Article

Potential for Methane Generation by Lignocellulosic Household Waste

by
Karla Peña Contreras
1,
Juan Manuel Sánchez Yáñez
2,
Quetzalli Aguilar-Virgen
3,
Paul Taboada-González
3 and
Liliana Marquez-Benavides
1,*
1
Instituto de Investigaciones Agropecuarias y Forestales, Universidad Michoacana de San Nicolás de Hidalgo, Av. San Juanito Itzicuaro S/N, Col. San Juanito Itzícuaro, Morelia 58000, Mexico
2
Instituto de Investigaciones Quimico-Biológicas, Gral. Francisco J. Mugica S/N, Morelia 58000, Mexico
3
Facultad de Ciencias Químicas e Ingeniería, Universidad Autónoma de Baja California, Calzada Universidad No. 14418, Mesa de Otay, Tijuana 22390, Mexico
*
Author to whom correspondence should be addressed.
Sustainability 2018, 10(10), 3461; https://doi.org/10.3390/su10103461
Submission received: 19 August 2018 / Revised: 20 September 2018 / Accepted: 26 September 2018 / Published: 28 September 2018
(This article belongs to the Section Sustainable Engineering and Science)

Abstract

:
The contribution of domestic lignocellulosic waste and its potential for biodegradation by components, for each category of paper and cardboard, have scarcely been reported. To achieve integral proposals, for managing this type of waste, is essential to know each individual contribution to the “paper and cardboard” category. The objective of this study was to characterize the paper and cardboard waste from the domestic solid waste stream, in the city of Morelia, Mexico, and estimate its methane generation potential (CH4). The generation of lignocellulosic waste was studied in a housing complex of social interest. The domestic lignocellulosic residues (DLW) that were chemically characterized were derived from paper and cardboard. The average daily generation was 0.5 kg/inhabitant. The highest content of lignin was found in newspaper (24.5%), and toilet paper was the material with the lowest lignin content (1%). The bond paper had a DLW of higher YCH4, when degraded anaerobically, in a semi-solid phase and a mesophilic regime. The variety of paper and cardboard, such as DLW, presented differences in their generation (kg/person), chemical composition (lignin content), and their potential for anaerobic biodegradability.

1. Introduction

The daily generation of municipal solid waste (MSW) in Mexico is 103 Gg [1]. On average, the total organic waste is equivalent to 66% of the waste stream, which includes 14% (of the total) of paper and paperboard compounds, according to reports from the Ministry of the Environment and Natural Resources [1]. Domestic waste constitutes 77% of MSW, making the sector the main source of waste [2].
The typical way to report the composition of MSW is in clustered categories. In Mexico, the categories are described in the Mexican Standard NMX-AA-022-1985 [3], where domestic lignocellulosic wastes (DLW) are grouped into general categories, such as paper, diapers, hard vegetable fiber, gardening, cardboard, and wood. In Latin America (LA), this categorization is also used, for example, in Peru, where the 2014 Guide of the Ministry of the Environment in Peru [4] sorts all DLW into different categories, such as paper, cardboard, as well as, wood, and foliage. Thus, reports mostly allow the distinction of the mixtures of these lignocellulosic residues, but “paper and board” is a category that includes materials diverse in grammage, and in physical and chemical characteristics. Some materials in this category could be as diverse as waxed paper, bible paper, compact paperboard, craft paper, and corrugated paperboard, among others. Clustering waste fractions generate a lack of knowledge about more specific paper categories, in the household waste stream. This situation differs with categorization reports, when the source is commercial or industrial [5]. The lack of knowledge regarding the quantities and type of waste generated, limits the possible strategies that could be implemented to recover lignocellulosic materials, or to reduce their use.
The recovery rates of materials, such as paper and cardboard, in LA, are limited and remain below 60%. These values are the result of several aspects, such as the demand for secondary materials, the collection capacity of both the collection personnel and the final disposal site, and low efficiency, due to contamination with other waste. In Mexico, approximately 50% of this type of waste was collected, according to the Chamber of Paper [6]. However, these values come mainly from the commercial or institutional sector. In LA, for instance, Colombia has the highest rate of paper and cardboard recycling (57%), in Chile and Ecuador, they recover between 40–50%, while Venezuela only recovers 20% of this material [4].
The impact on the environment, derived from the disposal of waste paper and cardboard, has at least three aspects. These include (a) the waste of wood pulp and water as natural resources; (b) the production of greenhouse gases by their disposal in landfill sites; and (c) the use of space in the final disposal site. In the first case, the wood pulp use of renewable sources is possible. The lignocellulosic residues could be used to produce biofuels synthesized from syngas, by biomass gasification, as reported in some research [7,8]. Regarding land use, Fonoll et al. [9] estimated that the content of paper and cardboard in a sanitary landfill is approximately 30%, and that it influences the biomethanization of the rest of the solid waste, at least on a laboratory scale. Other authors [10,11] indicate that the anaerobic digestion of paper and cardboard, in a mixed category, has a yield of around 190–280 L CH4/kg volatile solid (VS).
The contribution of domestic lignocellulosic waste, and its potential for biodegradation by components of each category of paper and cardboard, have scarcely been reported. Furthermore, there are no reports by the paper and cardboard industry that relate these potentials to the generation of the individual components. It is essential to value the individual categories of the “paper and cardboard” category, for the integral proposals required to manage this type of waste. That is, the growth of the infrastructure of these management systems needs information that details and distinguishes between recoverable materials.
The aim of this study was to characterize paper and cardboard waste from the domestic solid waste stream (DSW) in the city of Morelia, Mexico, and estimate its methane generation potential (CH4). This characterization included three aspects, including the rate of generation (kg/person), the chemical characterization, and the generation potential of CH4, of the various components of this category, at a laboratory scale.

2. Materials and Methods

2.1. Description of the Study Area

The duration of each study was dictated by the characteristics of each site, the availability of resources, and the objectives sought, among others. However, several methods for characterizing municipal solid waste suggest analyzing the waste for at least one full week [12,13,14,15,16,17,18,19,20,21,22,23,24]. The study was carried out in July and August of 2015, for six days, a week that was not close to any special period. The aim was to study a typical week of waste generation, in the studied households. Time and budget limitations did not allow the study to be carried out at other times of the year, to identify any significant differences, between them, in the generation of domestic paper and cardboard waste.
The generation of the lignocellulosic waste was studied in a housing complex of social interest (412 inhabited dwellings), located southwest of the city of Morelia, Michoacán, Mexico. The socio-economic stratum analyzed was medium-low; housing had a cost of USD 16,000–19,800, accessible to people earning wages of USD 10–18 per day. The selection of the study area included two criteria, (a) the study area should include at least 80% of the inhabited dwellings, and (b) the appointed waste-collector of the housing complex should agree to participate.

2.2. Study of the Composition and the Generation of Domestic Solid Waste

Some reports have pointed out that the representative samplings of a household solid waste (HSW) could be a truckload, coming in to the waste-transfer stations, in a typical weekday collection [25], or a mixed sampling, taken from a waste incinerator [18], among others. Before the start of the study, the operators of the waste-collection truck were asked not to carry out any material recovery activity. To ensure that the analyzed waste corresponded only to that of the study area, each day the collection truck was verified as empty, before the waste-collection started. At the end of the route, the collection truck transported the waste to the Solid Waste Laboratory of the Michoacán University of San Nicolás de Hidalgo (UMSNH). At this site, a homogeneous sample of 100 kg was taken daily for a six-day period. This sample size was determined by using the “Calculation Necessary Number of Sampling Units”, published by the European Community [12], considering a confidence level of 95%, with 10% random sampling error, and a 50% coefficient of variation.
Once the sample had been obtained, a manual separation and subsequent quantification were performed, according to the categorization shown in Table 1.
The measurements were performed in-situ using a portable electronic scale (H-670, Uline, Pleasant Prairie, WI, USA), with a 150 kg capacity and 10 g readability. The per-capita waste generation (pcwg) was calculated by dividing the weight of the collected waste by the studied population, multiplied by the number of days analyzed (Equation (1)).
pcwg = Amount   of   waste   generated inhabitants day = kg d hab

2.3. Chemical Characterisation of the Domestic Lignocellulosic Waste

The domestic lignocellulosic residues (DLW) that were chemically characterized, were derived from paper and cardboard. To select the items to be studied, two criteria were considered. First, they were DLWs of slow anaerobic degradation, and second, they did not contain any sodium polyacrylate (diapers or sanitary napkins). Therefore, only bond paper, glossy paper, cardboard, toilet paper, and newsprint were selected. Each material was ground separately in a stubble hammer mill, with an aperture size screen of 4 mm, and then stored at room temperature, until use.
For mass loss, the total solids content (TS) was determined at a temperature of 110 °C, for 24 h, and total volatile solids (TVS), at 550 °C, for 30 min [26]. Using the Sun et al. [27] method, the extractables were obtained (extraction in a Soxhlet with a reflux of ethanol and toluene), and from these, the content of holocellulose and lignin was determined. For the holocellulose, the Wise [28] method was followed, using NaClO2 and CH3COOH. For lignin, the extraction was done by H2SO4, using the Runkel method [29]. The content of TS and TVS was made in triplicates and that of lignin and holocellulose in duplicates.
The results were analyzed statistically, through an analysis of variance (p ≤ 0.05) and the Tukey-Kramer test. Finally, the biodegradable fraction (BF) of each type of paper and cardboard was determined according to what was suggested by several researchers [30,31,32,33,34,35,36,37,38], who related it to the lignocellulosic fibers present (Equation (2)).
BF = 0.83 0.028   LC
where BF is the biodegradable fraction; 0.83 and 0.028 are empirical constants, and LC is the lignin content expressed as a percentage (dry basis).

2.4. CH4 Generation Potential of Domestic Lignocellulosic Waste

The DLWs considered for the anaerobic biodegradation test were those mentioned in Section 2.2.

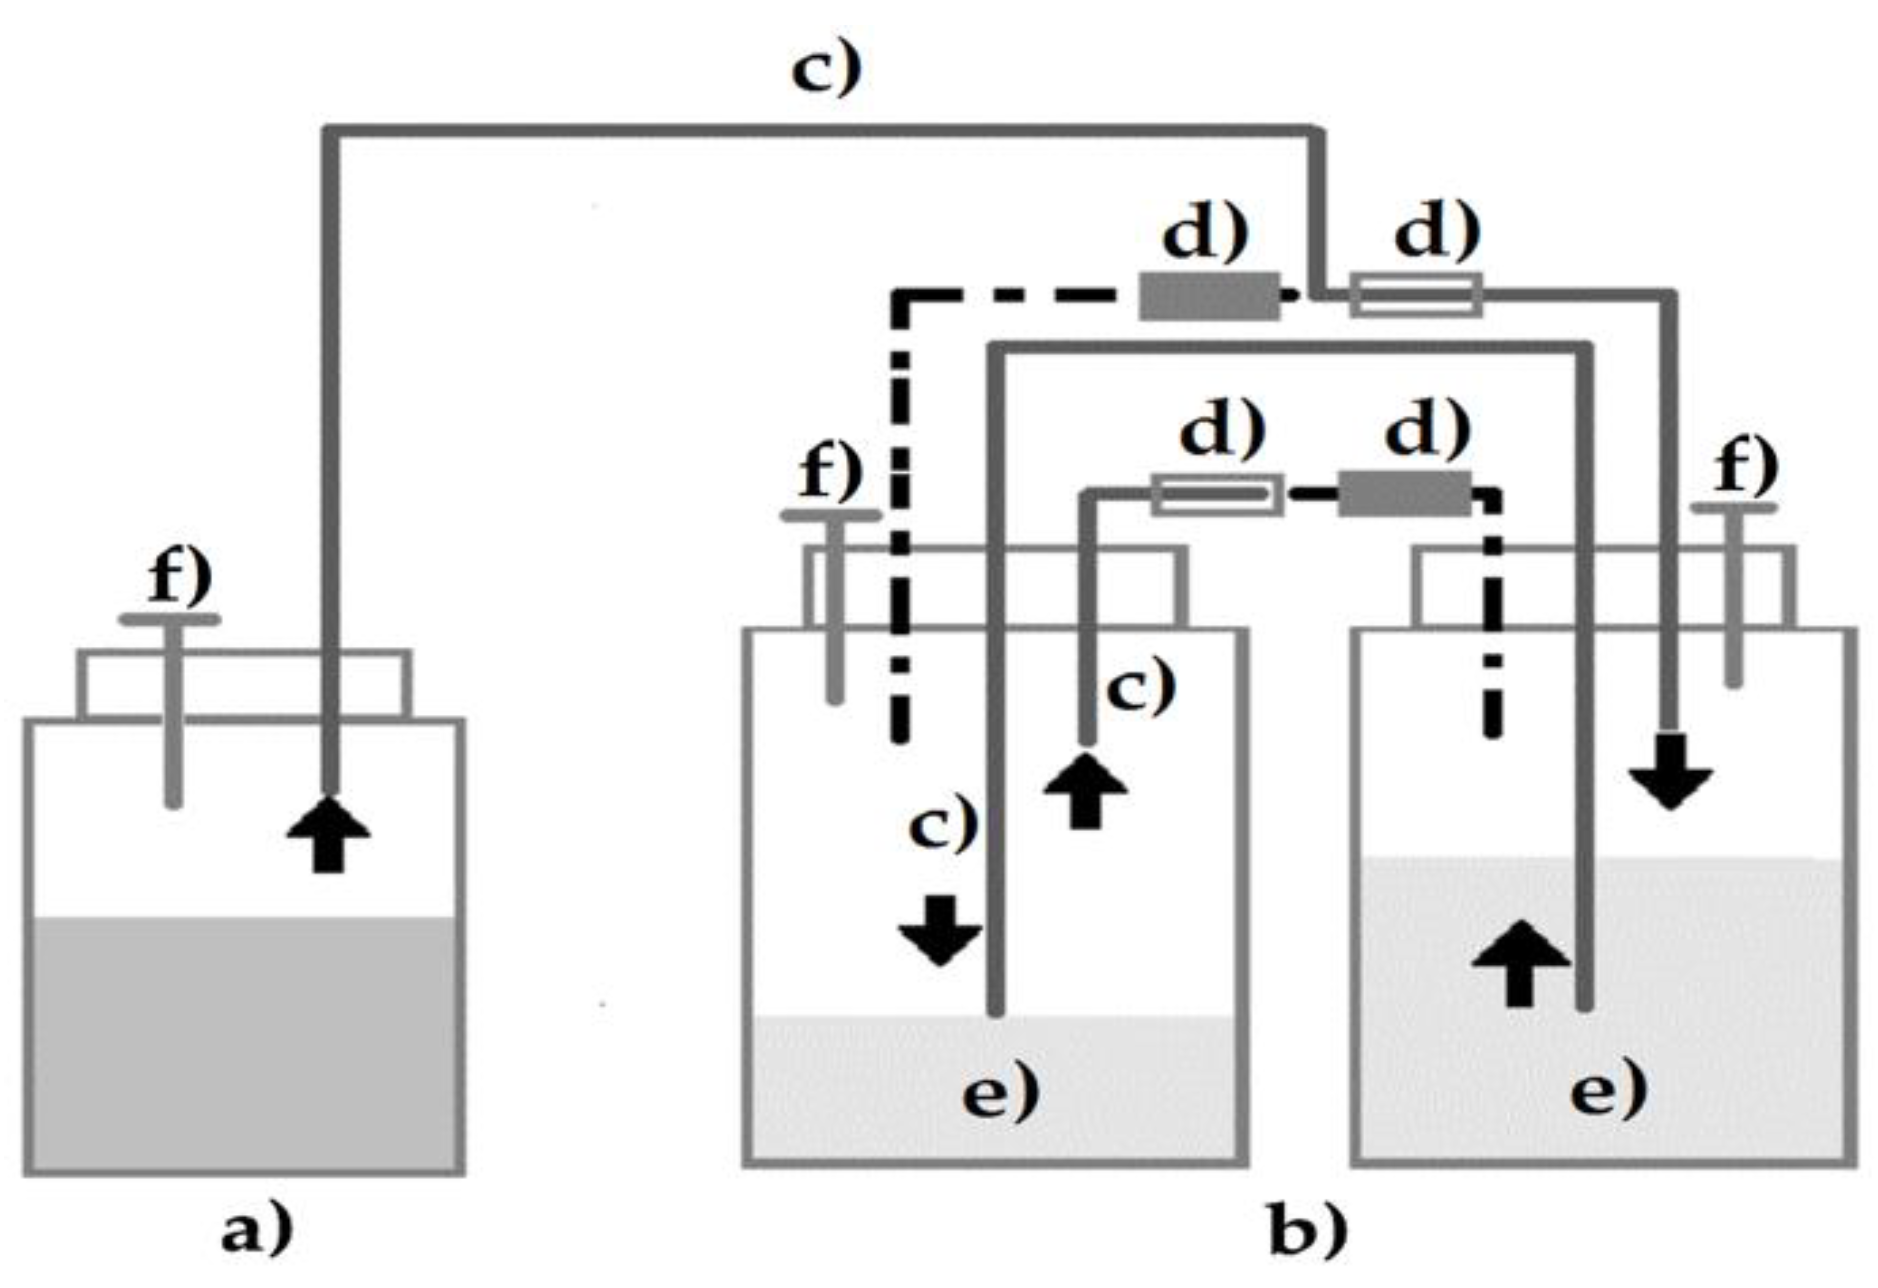
2.4.1. Obtainment of Biogas Producer Inoculum

The biogas-producing inoculum was obtained through the methodology of Baltierra-Trejo et al. [39]. The soil and the excreta were obtained from the garden and the stables of the UMSNH, and the digestion sludge from the upflow anaerobic sludge blanket (UASB) reactor at the municipal wastewater treatment plant in Quiroga, Michoacán. The parameters for using the inoculum for the subsequent biodegradation tests were ≈25% total solids (TS), ≈60% total volatile solids (TVS), pH 6.5, and a constant biogas production with a correlation coefficient of 95% (long-term linear dynamics).

2.4.2. Mesophilic Anaerobic Biodegradation Assays

Bioreactors were mounted using glass bottles. One gram (dry basis) of the substrate (bond paper, newsprint, toilet paper, glossy paper, and cardboard), 9 g dry base of biogas-producing inoculum, and 100 mL of distilled water were added. They were sealed and flushed with N2 (nitrogen) to displace the O2 from the headspace, and finally incubated, at a temperature of 35 °C, for 200 days. The treatments were mounted in quadruplicates, the active control only contained the inoculum and the distilled water, and the passive control contained only the DLW and the distilled water.
The CH4 content was measured, every seven days, for a period of two hundred days, using a gas chromatograph (Varian CP-3800, Conquer Scientific, San Diego, CA, USA) fitted with a flame ionization detector (FID), catalog ZW 3609. N2 was used as the carrier gas; operating conditions of the flow were 12 mL/min, and the temperatures of the furnace, injector, and the detector were 40, 150, and 250 °C, respectively. The biogas was measured by liquid displacement (Figure 1), following the method used by Baltierra-Trejo et al. [39]. At the end of each CH4 and biogas measurement, the headspace of each bioreactor was flushed with oxygen-free N2.
The yield of CH4 (mL/g TVS) for each of the DLWs was determined by Equation (3), reported by Yuan et al. [40]. The accumulated YCH4 was obtained by adding together all the calculated returns.
Yield   CH 4   ( Y CH 4 ) = ( volume   CH 4 ) Sample ( volume   CH 4 ) empty g   TVS
As a limitation of this work, the possible influence of ink inhibition on newspaper was not taken into account. The rest of the material was unprinted or new.

2.5. Calculation of CO2eq Emissions by the Anaerobic Degradation of Waste

2.5.1. Emissions Relative to the Amount of Domestic Lignocellulosic Waste Produced in the Dwelling

In order to calculate the emissions of the domestic lignocellulosic waste, a factor-based calculation approach by Myhre et al. was used [41]. An emission factor is a coefficient that quantifies the emissions or removals of a gas per unit activity, and it is often based on a sample of measurement data. The general equation for emissions estimates is E = A × EF, where E = emissions; A = activity data (e.g., fuel consumed, material input, throughput, or production output, and waste production); EF = emission factor (usually the weight of the pollutant or the unit weight, or the volume or duration of the activity, e.g., tons of CO2 or tons of coal) [42].
A calculation basis of 1000 kg of DSW was considered, and the percentage of each DLW obtained in the characterization study was identified (Section 3.1). For example, if the bond paper contributed 8.7% of the DSW current, the amount to be considered would be 87 kg. Next, the yield of CH4 (m3/kg material, dry base) obtained experimentally from the biodegradability test for each DLW was identified (Section 2.4). Subsequently, CO2eq emissions were calculated using Equation (4), derived from the above general equation to include single-waste categories of DLW.
E DLW = Y i · ( M i · ρ CH 4 ) · CH 4 GWP
where EDLW = Emissions of CO2eq per domestic lignocellulosic waste, (kg CO2eq/kg DLW individual, dry basis); Mi = Proportion of DLW in the domestic waste stream (kg DLW, dry base); Yi = Cumulative methane yield, obtained experimentally, by individual lignocellulosic residue (i) of the domestic fraction (m3/kg DLW, dry base); ρ CH4 = Density of methane gas in normal conditions, 0.667 kg/m3 (25 °C and 1 atm), to obtain mass instead of volume; CH4 GWP = Constant with a value of 25, representing the global warming potential of methane, in a horizon of 100 years [41].

2.5.2. Emissions Calculated by Emission Factors

Weight (kg) of DLW was multiplied by each emission factor (kg CO2eq/kg waste), according to the DEFRA [43] and Turner et al. [44] reports.

3. Results

3.1. Composition and Generation of Domestic Solid Waste

During the week of the study, a total of 4350 kg of DSW was generated, with an average daily generation of 0.5 kg/inhabitant. Table 2 shows the composition of DSW, where the highest category within the DLW was that of food waste (47%). The rest of the DLW categories constituted 25% of the total waste stream. Within that fraction, sanitary waste (diaper and sanitary napkin) was the largest category (30.7%).

3.2. Chemical Characterization of Waste Paper, Cardboard, and Derivatives

The DLWs that were chemically characterized were those derived from paper and cardboard. Table 3 shows the chemical characterization of the components studied. The highest content of lignin was found in newspaper (24.5%), which also had the lowest biodegradability factor (0.2). Toilet paper was the material with the lowest lignin content (1%).

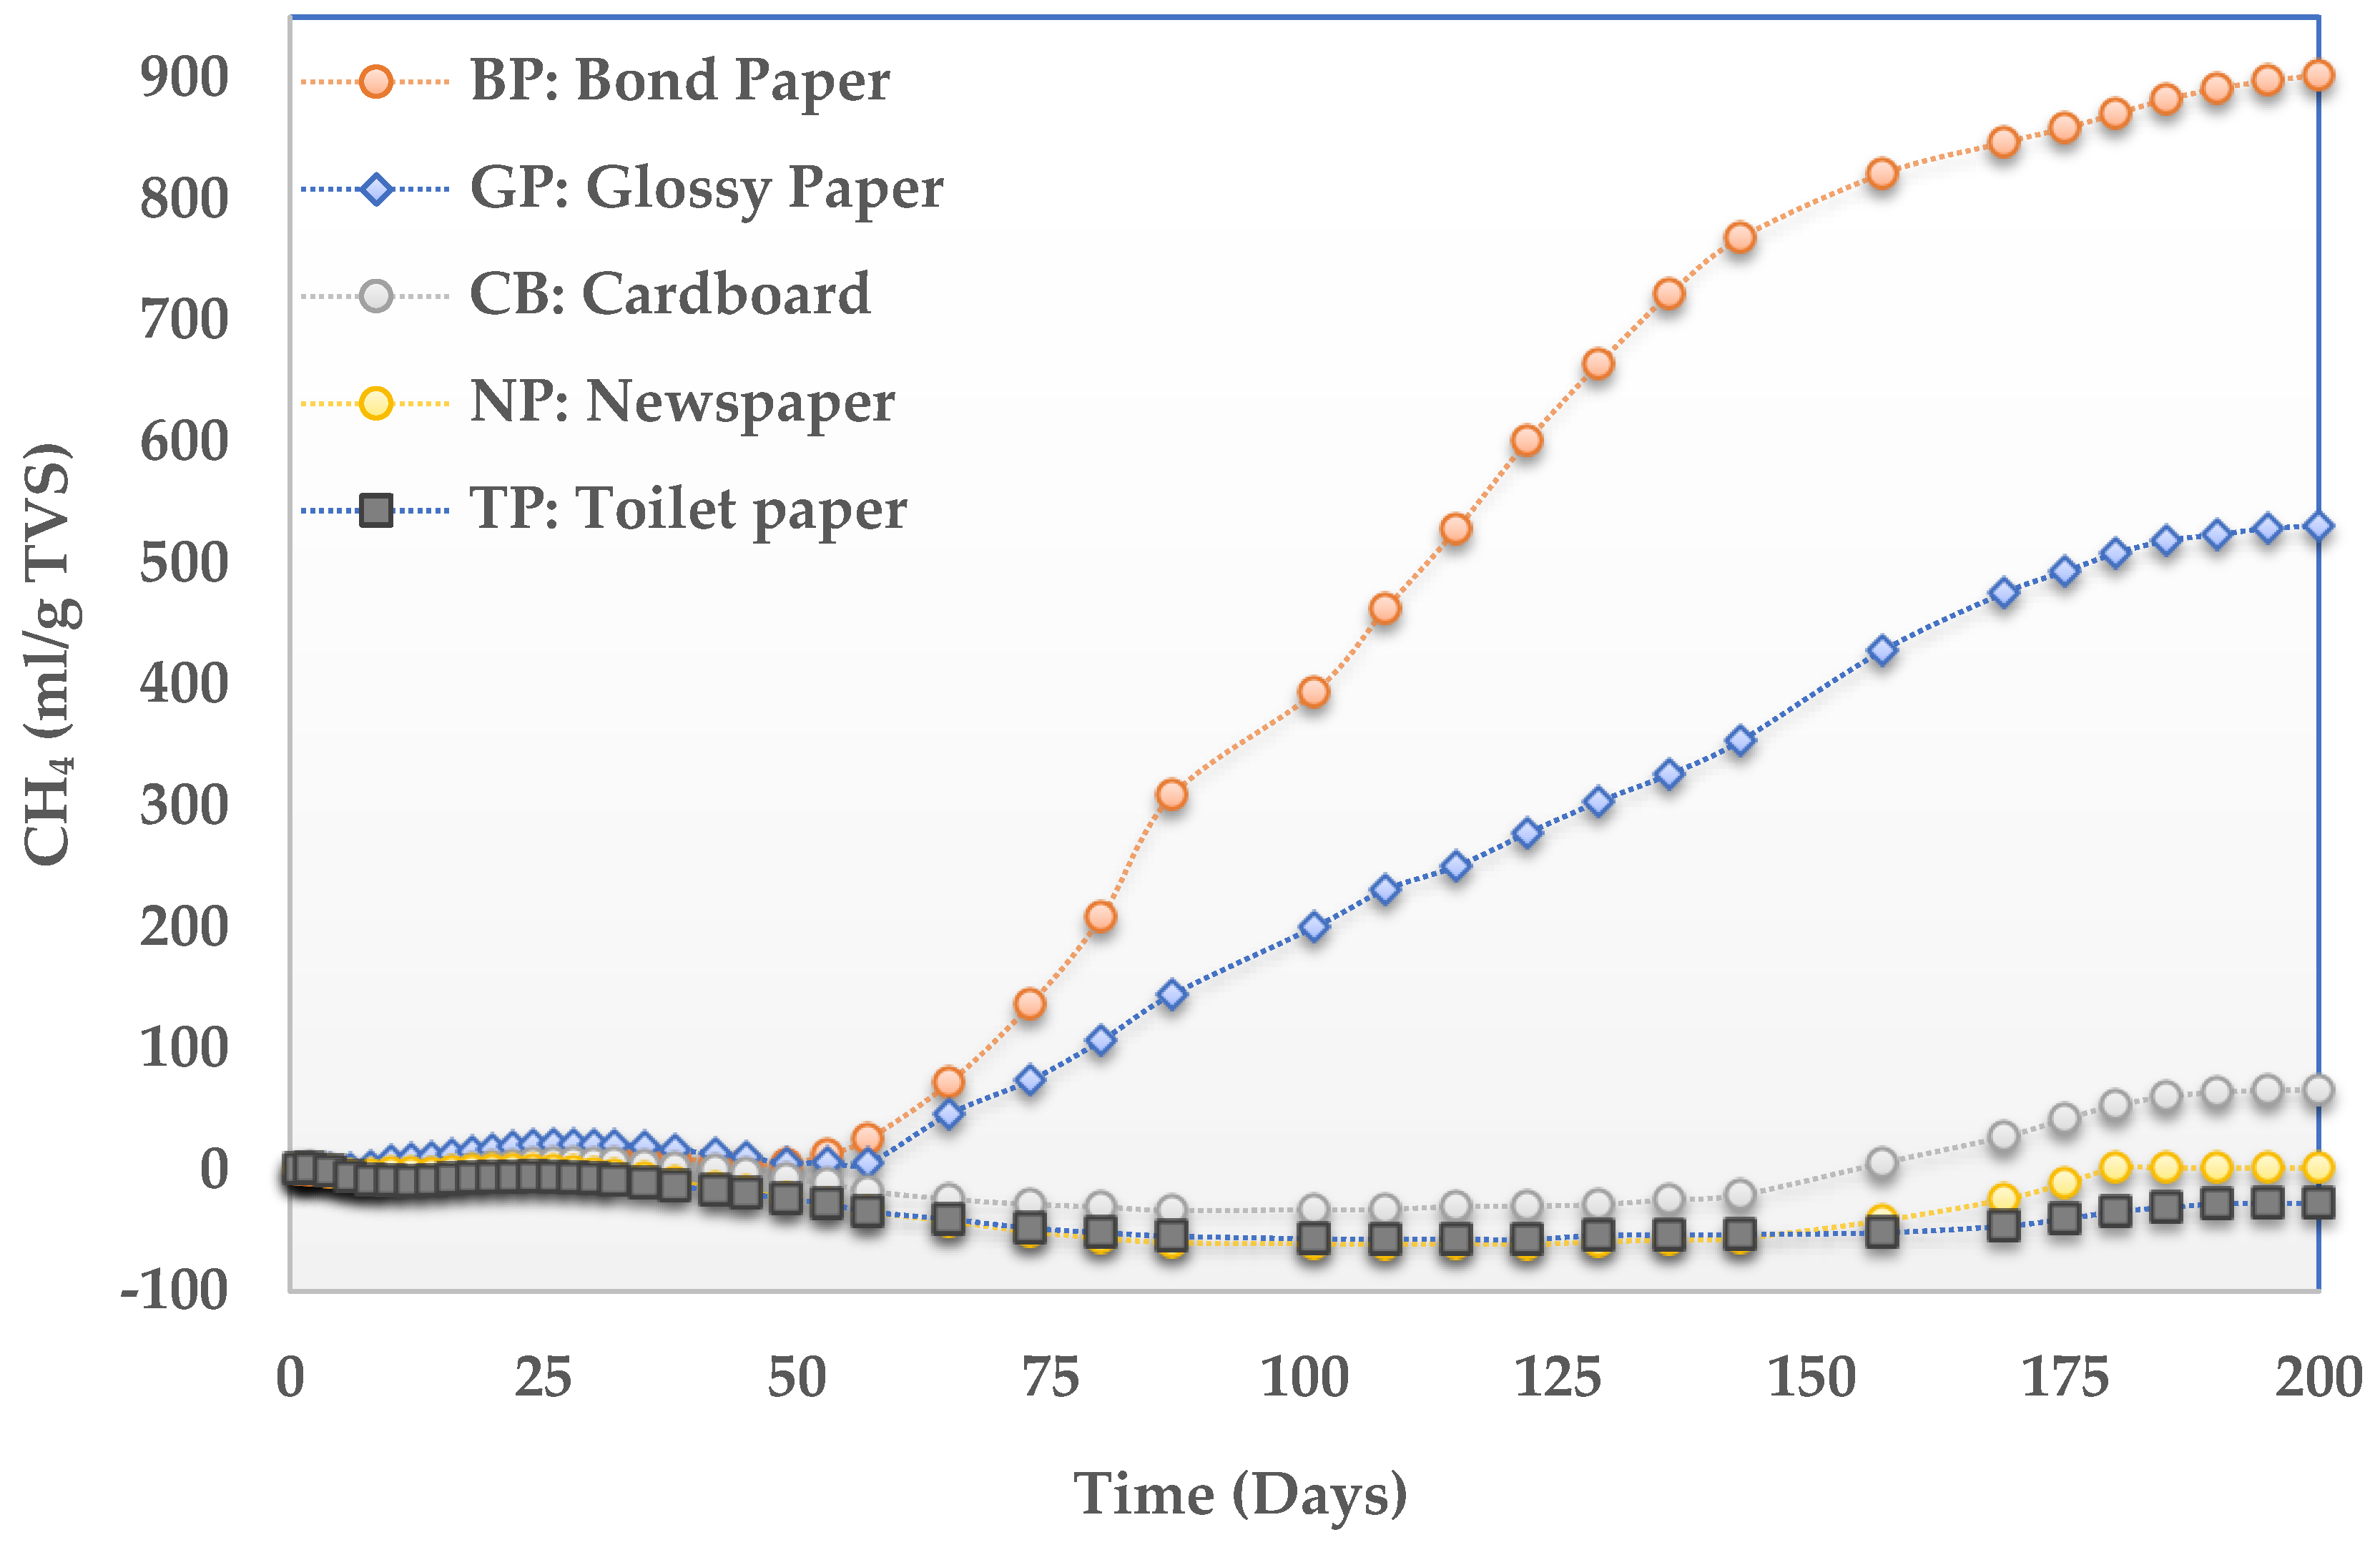
3.3. The Potential for CH4 Generation by Domestic Lignocellulosic Waste during the Biodegradability Test

Figure 2 shows the yield curves of CH4 (YCH4), accumulated during the laboratory scale test period (200 days). The order of the generation potential of CH4 was BP > GP > CB > NP > TP. For all paper categories, a sixty-day lag phase period was observed. This was expected for anaerobic slow-degrading material, in which one of the most important features of cellulose as a substrate for microorganisms, is its insolubility. This suggests the assembly of extremely complex enzyme systems that occur exocellularly [45]. From there, only glossy paper and bond paper experiments produced biogas during the studied period. Moreover, bond paper yielded the largest methane production rate, with a cumulative 902 mL CH4/g TVS. This was not expected for bond paper as with each recycling cycle in the paper industry, the fibers in the paper become shorter and the acceptable use is more restricted. As a result, a normal paper production cycle first produces a white bond paper, then colored bond paper, newspaper, grocery bags, and finally toilet paper. Glossy paper produced 50% of the cumulative methane compared to bond paper.
It was expected that the lignin content (Table 3) would limit the anaerobic degradation of paper categories, thus, CH4 generation potential was anticipated to be TP > BP > GP > CB > NP. However, Figure 2 showed unexpected results, where TP produced no biogas during the experimentation period. TP has been studied and reported as easily degradable, yet most available reports include biomethane potential tests that use a liquid experimental phase [46], and co-degradation [9] or aerobic composting experimentation [47]. After the recycling process, TP might contain a variety of chemical ingredients. Chemical substances that can be found in TP include perfume, softeners, and others (e.g., azo dyes, monomeric acrylic acid, phthalates, halogen-organic compounds, organotin compounds, PAHs and CFCs, formaldehyde, glyoxal and heavy metals, and allergenic perfumes) [48,49]. It is suggested that the solid-state anaerobic degradation of these components might have a stronger influence than the lignin content, during TP degradation.

4. Discussion

4.1. Composition and Generation of Lignocellulosic Household Waste

The generation of DSW found in this study was lower than the generation reported by other cities in the world, for example, Muscat, Oman, where Baawain et al. states that the generation increased from 0.79 kg to 1.30 in 12 years because of rapid population urbanization, and infrastructure growth [50]. In Ecuador, a study by Jara-Samaniego et al. indicates a generation of 1.13 kg/inhabitant/day [51]. In Mexico, the National Institute of Ecology and Climate Change report a 0.7 kg waste/inhabitant/day generation for the state of Michoacán de Ocampo [1].
The components of the MSW, which includes the DSW, were categorized by defining items that integrated similar materials. In this work, the DLW category was proposed to identify those with similar chemical compositions, as constituted by these materials. This implies that waste categories of slow anaerobic biodegradation were considered, as in the sanitary landfill. The food waste category also contained lignocellulosic materials, but it was decided to exclude them, since they were of rapid degradability (i.e., hours or days). The slow degradation of lignocellulosic materials (weeks or months) implied a limiting step in the fermentation process, at the landfill site.
The differences in the growth of the microbial populations involved in the degradation of each type of paper was probably a function of (a) the chemical composition of the paper, (b) the diversity of the associated microbial populations, and (c) the physical-chemical conditions of the reactor. Hence, contrasts in the production of methane were also derived from the above-mentioned factors, as indicated by several investigations [30,52,53,54,55,56,57].
Waste paper and cardboard fractions were rarely disaggregated, according to reports in the literature. This simplified grouping implied the integration of a variety of paper and cardboard with differing grammages (Table 1), generation rates, and chemical compositions (Table 2) into one or two general categories (Table 4).

4.2. Chemical Characterisation of Paper and Cardboard Waste

Table 5 shows a comparison of the chemical composition (lignin), of the DLW in this work, with other studies. Regarding the lignin content, it was observed that the DLW analysis agreed with that reported in the literature (see Table 5), where the NP had the highest detected content (NP > CT > GP > BP > TP). However, according to Wang et al. [66] and Ghasimi et al. [56], the chemical composition of paper and its derivatives depends on the chemical or mechanical method used during its manufacture, that is, there is no “standard” chemical composition. This is because the paper industry uses raw materials and processes specific to the desired end product.

4.3. The Potential for the Generation of CH4 by Domestic Lignocellulosic Waste

Table 5 shows a comparison of the CH4 yield of this study’s DLWs, with other reports. One of the most important points of difference between these studies was the phase reported in the lignocellulosic material degradation experiments (solid, liquid, semi-solid). In most of the reports, a liquid phase (less than 10% TS) was used, while in the present work a semi-solid phase (10% TS) was used. Commonly, the DSW is disposed of in a sanitary landfill or a general landfill, where the waste mixture is a solid matrix, with a moisture content of 25–90%, depending on the management of the site. The experimental conditions of the solid phase (>20% TS) or the semisolid (10–20% TS), of this study, were made by considering these parameters.
Bond paper is a lignocellulosic material whose anaerobic degradation has been reported elsewhere (see Table 5). The bond paper was identified as a DLW of higher YCH4, when degraded anaerobically in a semi-solid phase, and a mesophilic regime (35 °C). The obtained results indicate that pre-treatment of the material was not necessary, since in mesophilic conditions (35 °C) it was possible to obtain a YCH4, two or three times higher, than in other reports. However, this result should be received with caution, since at day forty of the study, the accumulated YCH4 of the bond paper was only 7 mL CH4/g TVS.
The YCH4 obtained by the degradation of the cardboard in this work, was lower (41%) than that in the study of Eleazer et al. [52], who used a solid phase (>20% TS). This difference might be a consequence of other conditions, in each study, since the trial period of that work was greater than four hundred and fifty days, and periodic pH adjustments were provided for the system. In the case of studies that used a liquid phase (<10% TS), pre-treatment of the material, and a thermophilic temperature, it was reported that the cardboard was capable of reaching a YCH4 of up to 280 mL/g TVS [54]. This value was more than four times the level obtained in this work. The biodegradability factor for the cardboard used was 0.4 (Table 3), which could explain the low methane yield.
In this study, the YCH4 of the glossy paper was higher (by 88%) than that obtained by Eleazer et al. [52], who used a solid phase (>20% TS), a period of two hundred and thirty days, and a constantly adjusted pH, and higher by 82% than that obtained by Wang et al. [66], despite the fact that they used a liquid phase (<10% TS) and a biological pre-treatment.
The newsprint paper had the lowest generation of DLW, identified in the characterization study, and also the lowest YCH4. The CH4 yields in this study were lower (by 97%) than that obtained by Eleazer et al. [52]. However, the duration of their study was greater than four hundred and fifty days, and included a constant pH adjustment.
The results of the anaerobic digestion of toilet paper were contrary to what was expected. As the DLW with the lowest lignin content, it was expected that, within the group of materials analyzed, it would present greater ease of degradation and, consequently, a greater YCH4. The available studies on methanogenic inhibition of toilet paper have experimented in a liquid phase, so comparisons with the results of this study could not be made.

4.4. YCH4 and Its Equivalence in CO2eq Emissions

Using the composition of the DLW in the DSW stream (Table 2), and the various yields of each of them in the anaerobic digestion (Table 5), a calculation base of 1000 kg of waste was determined to construct Table 6.
The YCH4 obtained under experimental conditions represented the biodegradability potential, under mesophilic anaerobic conditions of the materials studied. However, in the sanitary landfill, this potential was influenced by the abiotic variables of the final disposal site, in particular, the humidity conditions [70]. The calculated CO2 equivalent emissions, after disposal in a sanitary landfill, had a very wide interval, from 0.1 to 259 kg CO2eq/material (Table 6). These values were up to 10 times higher than those calculated using emission or characterization factors reported through life cycle analysis (LCA). This discrepancy has three possible explanations, (a) the results of this work represent a potential upper limit of biodegradation, due to the controlled laboratory conditions; (b) the results obtained in this investigation have a dry base, unlike the LCA emission factors that commonly use a wet-weight calculation basis; (c) DEFRA factors consider three separate compositions of the paper and cardboard stream: “78% corrugated + 22% cardboard”, “25% paper + 75% cardboard”, and “only paper”, however, the emission factor for each of them is the same, which equals to 0.58 kg CO2eq/kg material. This indicates that the results of this study highlight the need to identify and separate the paper and cardboard category in order to deliver an adequate management system. If the production of biogas in a sanitary landfill depends on the presence of paper and cardboard [9], it is important to separately value the potential biomethanization yields of each category, within the item under study. In the same sense, it is necessary to continue with research in this area, to obtain standardized factors of lignocellulosic waste-degradation.

5. Conclusions

The various types of paper and cardboard, such as DLW, presented differences in their generation (kg/person), chemical composition (lignin content), and their potential for anaerobic biodegradability. It is important that the generation of domestic current and the anaerobic biodegradation are considered as interdependent variables in the generation of CH4, under the broad heading of slow-degradation DLW (paper and cardboard). The factors used for the estimates of CO2 eq emissions strongly influenced the results obtained, so the conditions for which they were designed must be verified.
Finally, future research is recommended to analyze other factors that directly and indirectly influence the degradation and generation of CH4, as a contributory source to the Greenhouse Gas (GHG) of the waste sector. It is also essential to generate the characterization factors for the calculation of GHG-emissions, generated by domestic waste.

Author Contributions

Conceptualization, Data curation, Methodology and Formal analysis, K.P.C., J.M.S.Y. and L.M.-B.; Analytical techniques, K.P.C., L.M.-B., Q.A.-V. and P.T.-G.; Validation, P.T.-G. and Q.A.-V.; Writing-Original Draft Preparation, K.P.C., J.M.S.Y. and L.M.-B.; Writing-Review & Editing, Q.A.-V. and P.T.-G.; Supervision, L.M.-B.

Conflicts of Interest

The authors declare no conflict of interest.

References

  1. INECC (National Institute of Ecology and Climate Change). Diagnóstico Básico Para la Gestión Integral de los Residuos. Versión Extensa del Instituto Nacional de Ecología y Cambio Climático y del Centro Nacional de Investigación y Capacitación Ambiental de la Secretaría de Medio Ambiente y Recursos Naturales; INECC: México City, Mexico, 2012. (In Spanish) [Google Scholar]
  2. Castillo-González, E.; Medina-Salas, L.D. Generación y composición de residuos sólidos domésticos en localidades urbanas pequeñas en el estado de Veracruz, México. Rev. Int. Contam. Ambient. 2014, 30, 81–90. [Google Scholar]
  3. STID (Former Secretariat of Trade and Industrial Development). NMX-AA-22-1985. Selección y Cuantificación de Subproductos; STID: México City, Mexico, 1985. (In Spanish) [Google Scholar]
  4. Sáez, A.; Urdaneta, G. Manejo de residuos sólidos en América Latina y el Caribe. Omnia 2014, 20, 121–135. [Google Scholar]
  5. Gavrilescu, D. Energy from biomass in pulp and paper mills. Environ. Eng. Manag. J. 2008, 7, 537–546. [Google Scholar] [CrossRef]
  6. Cámara del Papel (Chamber of Paper). Plan de Manejo Para Residuos de Papel y Cartón en México. Cámara Nacional de las Industrias de la Celulosa y el Papel. Plan de Manejo; Cámara del Papel: México City, Mexico, 2012. (In Spanish) [Google Scholar]
  7. Ben Hassen Trabelsi, A.; Zaafouri, K.; Baghdadi, W.; Naoui, S.; Ouerghi, A. Second generation biofuels production from waste cooking oil via pyrolysis process. Renew. Energy 2018, 126, 888–896. [Google Scholar] [CrossRef]
  8. Molino, A.; Larocca, V.; Chianese, S.; Musmarra, D.; Molino, A.; Larocca, V.; Chianese, S.; Musmarra, D. Biofuels Production by Biomass Gasification: A Review. Energies 2018, 11, 811. [Google Scholar] [CrossRef]
  9. Fonoll, X.; Astals, S.; Dosta, J.; Mata-Alvarez, J. Impact of paper and cardboard suppression on OFMSW anaerobic digestion. Waste Manag. 2016, 56, 100–105. [Google Scholar] [CrossRef] [PubMed]
  10. Lesteur, M.; Latrille, E.; Maurel, V.B.; Roger, J.M.; Gonzalez, C.; Junqua, G.; Steyer, J.P. First step towards a fast analytical method for the determination of Biochemical Methane Potential of solid wastes by near infrared spectroscopy. Bioresour. Technol. 2011, 102, 2280–2288. [Google Scholar] [CrossRef] [PubMed]
  11. Mou, Z.; Scheutz, C.; Kjeldsen, P. Evaluating the biochemical methane potential (BMP) of low-organic waste at Danish landfills. Waste Manag. 2014, 34, 2251–2259. [Google Scholar] [CrossRef] [PubMed]
  12. EC (European Commission). Methodology for the Analysis of Solid Waste (SWA-Tool) User Version. Available online: https://www.wien.gv.at/meu/fdb/pdf/swa-tool-759-ma48.pdf (accessed on 10 April 2016).
  13. Al-Khatib, I.A.; Arafat, H.A.; Basheer, T.; Shawahneh, H.; Salahat, A.; Eid, J.; Ali, W. Trends and problems of solid waste management in developing countries: A case study in seven Palestinian districts. Waste Manag. 2007, 27, 1910–1919. [Google Scholar] [CrossRef] [PubMed]
  14. Karousakis, K.; Birol, E. Investigating household preferences for kerbside recycling services in London: A choice experiment approach. J. Environ. Manag. 2008, 88, 1099–1108. [Google Scholar] [CrossRef] [PubMed]
  15. Liu, H.; Ni, W.; Li, Z.; Ma, L. Strategic thinking on IGCC development in China. Energy Policy 2008, 36, 1–11. [Google Scholar] [CrossRef]
  16. Alqader, A.A.; Hamad, J. Municipal Solid Waste Composition Determination Supporting the Integrated Solid Waste Management in Gaza Strip. Int. J. Environ. Sci. Dev. 2012, 3, 172–176. [Google Scholar] [CrossRef]
  17. Monavari, S.M.; Omrani, G.A.; Karbassi, A.; Raof, F.F. The effects of socioeconomic parameters on household solid-waste generation and composition in developing countries (a case study: Ahvaz, Iran). Environ. Monit. Assess. 2012, 184, 1841–1846. [Google Scholar] [CrossRef] [PubMed]
  18. Edjabou, M.E.; Jensen, M.B.; Götze, R.; Pivnenko, K.; Petersen, C.; Scheutz, C.; Astrup, T.F. Municipal solid waste composition: Sampling methodology, statistical analyses, and case study evaluation. Waste Manag. 2015, 36, 12–23. [Google Scholar] [CrossRef] [PubMed] [Green Version]
  19. Pop, I.N.; Baciu, C.; Bican-Brisan, N. Survey on household waste composition generated in cluj-napoca, romania during the summer season. Environ. Eng. Manag. J. 2015, 14, 2643–2651. [Google Scholar] [CrossRef]
  20. Edjabou, M.E.; Petersen, C.; Scheutz, C.; Astrup, T.F. Food waste from Danish households: Generation and composition. Waste Manag. 2016, 52, 256–268. [Google Scholar] [CrossRef] [PubMed] [Green Version]
  21. Edjabou, M.E.; Martín-Fernández, J.A.; Scheutz, C.; Astrup, T.F. Statistical analysis of solid waste composition data: Arithmetic mean, standard deviation and correlation coefficients. Waste Manag. 2017, 69, 13–23. [Google Scholar] [CrossRef] [PubMed]
  22. Weichgrebe, D.; Speier, C.; Mondal, M.M. Scientific approach for municipal solid waste characterzation. In Advances in Solid and Hazardous Waste Management; Goel, S., Ed.; Springer: New Delhi, India, 2017; pp. 65–100. ISBN 978-3-319-57076-1. [Google Scholar]
  23. Edjabou, M.E.; Boldrin, A.; Astrup, T.F. Compositional analysis of seasonal variation in Danish residual household waste. Resour. Conserv. Recycl. 2018, 130, 70–79. [Google Scholar] [CrossRef]
  24. Yang, N.; Damgaard, A.; Scheutz, C.; Shao, L.-M.; He, P.-J. A comparison of chemical MSW compositional data between China and Denmark. J. Environ. Sci. 2018. [Google Scholar] [CrossRef]
  25. Wagland, S.T.; Veltre, F.; Longhurst, P.J. Development of an image-based analysis method to determine the physical composition of a mixed waste material. Waste Manag. 2012, 32, 245–248. [Google Scholar] [CrossRef] [PubMed] [Green Version]
  26. American Public Health Association (APHA). Standard Methods for the Examination of Water and Wastewater. Scope and Application of Methods, 21st ed.; Centennial Edition; APHA: Washington, DC, USA, 2005. [Google Scholar]
  27. Sun, R.C.; Tomkinson, J.; Zhu, W.; Wang, S.Q. Delignification of maize stems by peroxymonosulfuric acid, peroxyformic acid, peracetic acid, and hydrogen peroxide. 1. Physicochemical and structural characterization of the solubilized lignins. J. Agric. Food Chem. 2000, 48, 1253–1262. [Google Scholar] [CrossRef] [PubMed]
  28. Wise, L.E. Chlorite holocellulose, its fractionation and bearing on summative wood analysis and studies on the hemicelluloses. Pap. Trade J. 1946, 122, 35–43. [Google Scholar]
  29. Runkel, R.O.H. Zur Kenntnis des thermoplastischen Verhaltens von Holz. Holz Roh Werkst. 1951, 9, 41–53. [Google Scholar] [CrossRef]
  30. Espinosa Lloréns, M.D.C.; López Torres, M.; Pellón Arrechea, A.; Mayarí Navarro, R.; Fernández Colomina, A. La fracción orgánica de los residuos sólidos urbanos como fuente potencial de producción de biogás. Rev. CENIC. Cienc. Biol. 2007, 38, 33–37. [Google Scholar]
  31. Loehr, R.C. Pollution Control for Agriculture: Problems, Processes, and Applications, 2nd ed.; Academic Press: Cambridge, MA, USA, 1984; ISBN 978-0-323-13884-0. [Google Scholar]
  32. Vigil, S.A.; Tchobanoglous, G. Comparison of the environmental effects of aerobic and anaerobic composting technologies. In Proceedings of the Civil and Environmental Engineering; Air and Waste Management Association: Pittsburgh, PA, USA, 1994; p. 11. [Google Scholar]
  33. Kayhanian, M.; Tchobanoglous, G.; Brown, R.C. Biomass conversion processes for energy recovery. In Handbook of Energy Efficiency and Renewable Energy; Goswami, D.Y., Kreith, F., Eds.; CRC Press: Boca Raton, FL, USA, 2007; pp. 1–65. ISBN 978-1-4200-0348-2. [Google Scholar]
  34. Law, J.; Peterson, E.; Hudgins, M. Water requirement estimates for an aerobic bioreactor landfill in China. In Proceedings Sardinia; CISA (Environmental Sanitary Engineering Centre): Cagliari, Italy, 2011; pp. 1–9. [Google Scholar]
  35. Castells, X.E. Reciclaje de Residuos Industriales: Residuos Sólidos Urbanos y Fangos de Depuradora, 2nd ed.; Ediciones Díaz de Santos: Madrid, España, 2012; ISBN 978-84-9969-366-8. [Google Scholar]
  36. Alexis, P.-O.B.; Patricia, T.-L.; Fernando, M.-R.L.; Marcela, C.-C.L.; Carlos, V.-F.; Alexander, T.-L.W.; Abdón, O.-A.J. Efecto de la relación sustrato-inóculo sobre el potencial bioquímico de metano de biorresiduos de origen municipal. Ing. Investig. Technol. 2015, 16, 515–526. [Google Scholar] [CrossRef]
  37. Soto, J.; Torres, P.; Barba, L.E.; Marmolejo, L.F.; Torres, W.A.; Guzmán, M.A.; Perea, L.M. Dissolved oxygen effect on the biodegradability of biowaste. Rev. UDCA Actual. Divulg. Cient. 2015, 18, 485–495. [Google Scholar]
  38. Trzcinski, A.P.; Stuckey, D.C. Microbial biomethane from solid wastes: Principles and biotechnogical processes. In Microbial Fuels: Technologies and Applications; Harzevili, F.D., Hiligsmann, I.S., Eds.; CRC Press: Boca Raton, FL, USA, 2018; pp. 77–152. ISBN 978-1-4987-6380-6. [Google Scholar]
  39. Baltierra-Trejo, E.; Márquez-Benavides, L.; Sánchez-Yáñez, J.M. Modelo experimental de difusión de biogás en raíces vegetales. Rev. Int. Contam. Ambient. 2012, 28, 133–139. [Google Scholar]
  40. Yuan, X.; Cao, Y.; Li, J.; Wen, B.; Zhu, W.; Wang, X.; Cui, Z. Effect of pretreatment by a microbial consortium on methane production of waste paper and cardboard. Bioresour. Technol. 2012, 118, 281–288. [Google Scholar] [CrossRef] [PubMed]
  41. Myhre, G.; Shindell, D.; Breon, F.-M.; Collins, W.; Fuglesttvedt, J.; Huang, J.; Koch, D.; Lamarque, J.-F.; Lee, D.; Mendoza, B.; et al. Anthropogenic and Natural Radiative Forcing. In Climate Change 2013: The Physical Science Basis: Working Group I Contribution to the Fifth Assessment Report of the Intergovernmental Panel on Climate Change; Stocker, T.F., Qin, G.-K., Plattner, M., Tignor, S.K., Allen, J., Boschung, A., Nauels, Y., Xia, B., Bex, V., Midgley, P.M., Eds.; Cambridge University Press: Cambridge, UK; New York, NY, USA, 2013; pp. 659–740. ISBN 978-1-107-05799-9. [Google Scholar]
  42. Daviet, F. Designing a Customized Greenhouse Gas Calculation Tool; World Resources Institute: Washington, DC, USA, 2007; ISBN 978-1-56973-659-3. [Google Scholar]
  43. DEFRA (Department for Environment, Food and Rural Affairs). 2016 Government GHG Conversion Factors for Company Reporting: Methodology Paper for Emission Factors; DEFRA: London, UK, 2016.
  44. Turner, D.A.; Williams, I.D.; Kemp, S. Greenhouse gas emission factors for recycling of source-segregated waste materials. Resour. Conserv. Recycl. 2015, 105, 186–197. [Google Scholar] [CrossRef]
  45. Leschine, S.B. Cellulose degradation in anaerobic environments. Annu. Rev. Microbiol. 1995, 49, 399–426. [Google Scholar] [CrossRef] [PubMed]
  46. Zheng, W.; Phoungthong, K.; Lü, F.; Shao, L.-M.; He, P.-J. Evaluation of a classification method for biodegradable solid wastes using anaerobic degradation parameters. Waste Manag. 2013, 33, 2632–2640. [Google Scholar] [CrossRef] [PubMed]
  47. Venelampi, O.; Weber, A.; Rönkkö, T.; Itävaara, M. The Biodegradation and Disintegration of Paper Products in the Composting Environment. Compost Sci. Util. 2003, 11, 200–209. [Google Scholar] [CrossRef]
  48. Bengtström, L.; Trier, X.; Granby, K.; Rosenmai, A.K.; Petersen, J.H. Fractionation of extracts from paper and board food contact materials for in vitro screening of toxicity. Food Addit. Contam. 2014, 31, 1291–1300. [Google Scholar] [CrossRef]
  49. Rosenmai, A.K.; Bengtström, L.; Taxvig, C.; Trier, X.; Petersen, J.H.; Svingen, T.; Binderup, M.-L.; Barbara Medea Alice, V.-L.; Dybdahl, M.; Granby, K.; et al. An effect-directed strategy for characterizing emerging chemicals in food contact materials made from paper and board. Food Chem. Toxicol. 2017, 106, 250–259. [Google Scholar] [CrossRef] [PubMed]
  50. Baawain, M.; Al-Mamun, A.; Omidvarborna, H.; Al-Amri, W. Ultimate composition analysis of municipal solid waste in Muscat. J. Clean. Prod. 2017, 148, 355–362. [Google Scholar] [CrossRef]
  51. Jara-Samaniego, J.; Pérez-Murcia, M.D.; Bustamante, M.A.; Pérez-Espinosa, A.; Paredes, C.; López, M.; López-Lluch, D.B.; Gavilanes-Terán, I.; Moral, R. Composting as sustainable strategy for municipal solid waste management in the Chimborazo Region, Ecuador: Suitability of the obtained composts for seedling production. J. Clean. Prod. 2017, 141, 1349–1358. [Google Scholar] [CrossRef]
  52. Eleazer, W.E.; Odle, W.S.; Wang, Y.-S.; Barlaz, M.A. Biodegradability of municipal solid waste components in laboratory-scale landfills. Environ. Sci. Technol. 1997, 31, 911–917. [Google Scholar] [CrossRef]
  53. Abbassi-Guendouz, A.; Brockmann, D.; Trably, E.; Dumas, C.; Delgenès, J.-P.; Steyer, J.-P.; Escudié, R. Total solids content drives high solid anaerobic digestion via mass transfer limitation. Bioresour. Technol. 2012, 111, 55–61. [Google Scholar] [CrossRef] [PubMed]
  54. Kobayashi, T.; Xu, K.-Q.; Li, Y.-Y.; Inamori, Y. Evaluation of hydrogen and methane production from municipal solid wastes with different compositions of fat, protein, cellulosic materials and the other carbohydrates. Int. J. Hydrogen Energy 2012, 37, 15711–15718. [Google Scholar] [CrossRef]
  55. Díaz Domínguez, Y.; Férnandez Santana, E.; Sárvári Horváth, I.; Rodríguez Muñoz, S. Hidrólisis química y digestión anaerobia termofílica de la fracción orgánica de los residuos sólidos urbanos. Rev. Cuba. Ing. 2014, 5, 59–66. [Google Scholar] [CrossRef]
  56. Ghasimi, D.S.M.; Zandvoort, M.H.; Adriaanse, M.; van Lier, J.B.; de Kreuk, M. Comparative analysis of the digestibility of sewage fine sieved fraction and hygiene paper produced from virgin fibers and recycled fibers. Waste Manag. 2016, 53, 156–164. [Google Scholar] [CrossRef] [PubMed]
  57. Naroznova, I.; Møller, J.; Scheutz, C. Characterisation of the biochemical methane potential (BMP) of individual material fractions in Danish source-separated organic household waste. Waste Manag. 2016, 50, 39–48. [Google Scholar] [CrossRef] [PubMed] [Green Version]
  58. Bardales, J.; Cruz, E.; Cabrera, C. Manejo integral de residuos sólidos domiciliarios por medio de la segregación en la fuente en el distrito de San Luis, Lima, Perú. Rev. Inst. Investig. Fac. Ing. Geol. Miner. Met. Geogr. 2015, 18, 23–29. [Google Scholar]
  59. Sánchez Bernal, E.I.; Rodríguez León, A.; Sandoval Orozco, G.; Camacho Escobar, M.A.; Estrada Vázquez, C. Generación de residuos sólidos municipales en San Pedro Mixtepec, Juquila, Oaxaca: Impactos ambientales y alternativas de mitigación. Rev. Int. Cienc. Soc. 2015, 2, 21–36. [Google Scholar]
  60. Castañeda Delgado, G.A.; Pérez Escatel, A.A. La problemática del manejo de los residuos sólidos en seis municipios del sur de Zacatecas. Reg. Soc. 2015, 27, 97–115. [Google Scholar] [CrossRef]
  61. Gu, B.; Wang, H.; Chen, Z.; Jiang, S.; Zhu, W.; Liu, M.; Chen, Y.; Wu, Y.; He, S.; Cheng, R.; et al. Characterization, quantification and management of household solid waste: A case study in China. Resour. Conserv. Recycl. 2015, 98, 67–75. [Google Scholar] [CrossRef]
  62. Taboada-González, P.; Aguilar-Virgen, Q.; Cruz-Sotelo, S.E.; Ramirez-Barreto, M.E. Manejo y potencial de recuperación de residuos sólidos en una comunidad rural de México. Rev. Int. Contam. Ambient. 2013, 29, 43–48. [Google Scholar]
  63. Taboada-González, P.; Aguilar-Virgen, Q.; Ojeda-Benitez, S. Análisis estadístico de residuos sólidos domésticos en un municipio fronterizo de México. Avances en Ciencias e Ingeniería 2011, 2, 9–20. [Google Scholar]
  64. Francisco, A.A.; Rodríguez, Y. Caracterización residuos sólidos domiciliarios en Santo Domingo Oeste, Provincia Santo Domingo, (i). Cienc. Soc. 2010, 35, 566–587. [Google Scholar] [CrossRef]
  65. Thanh, N.P.; Matsui, Y.; Fujiwara, T. Household solid waste generation and characteristic in a Mekong Delta city, Vietnam. J. Environ. Manag. 2010, 91, 2307–2321. [Google Scholar] [CrossRef] [PubMed]
  66. Wang, X.; De la Cruz, F.B.; Ximenes, F.; Barlaz, M.A. Decomposition and carbon storage of selected paper products in laboratory-scale landfills. Sci. Total Environ. 2015, 532, 70–79. [Google Scholar] [CrossRef] [PubMed]
  67. Yuan, X.; Wen, B.; Ma, X.; Zhu, W.; Wang, X.; Chen, S.; Cui, Z. Enhancing the anaerobic digestion of lignocellulose of municipal solid waste using a microbial pretreatment method. Bioresour. Technol. 2014, 154, 1–9. [Google Scholar] [CrossRef] [PubMed]
  68. Wan, S.; Sun, L.; Douieb, Y.; Sun, J.; Luo, W. Anaerobic digestion of municipal solid waste composed of food waste, wastepaper, and plastic in a single-stage system: Performance and microbial community structure characterization. Bioresour. Technol. 2013, 146, 619–627. [Google Scholar] [CrossRef] [PubMed]
  69. Pommier, S.; Llamas, A.M.; Lefebvre, X. Analysis of the outcome of shredding pretreatment on the anaerobic biodegradability of paper and cardboard materials. Bioresour. Technol. 2010, 101, 463–468. [Google Scholar] [CrossRef] [PubMed]
  70. Mañon-Salas, M.; Hernández-Berriel, M.; Márquez-Benavides, L. Uso del análisis multivariado para modelar el asentamiento de RSU en biorreactores con recirculación de lixiviados. Rev. Int. Contam. Ambient. 2012, 28, 51–58. [Google Scholar]
Figure 1. (a) Anaerobic digester in a solid substrate (ADSS) (2 L, glass vessel); (b) biogas measurement system (BMS) by liquid displacement (3 L, glass vessel); and the (c) silicone tubing (ID 1/4 in, Merck, cat. XX8000025, Germany). (d) The black/white rectangles indicate mini-ratchet tubing clamps, for up to 1/4” tubing (Masterflex, cat. EW-06833-01, USA) which alternate the flow between both BMS. (e) Saturated acidified brine solution. (f) Sampling port. Taken and modified from Baltierra-Trejo et al. [39].
Sustainability 10 03461 g001
Figure 2. Performance curves of CH4 (accumulated) of domestic lignocellulosic waste (bond paper, glossy paper, toilet paper, newspaper, and cardboard). Methane volume was reported, at 25 °C and 1 atm.
Sustainability 10 03461 g002
Table 1. Studied categories of the DSW and the specifications of the lignocellulosic materials.
Domestic Solid WasteFractionsSpecifications
Domestic lignocellulosic residuesFood wasteResidues of vegetable, animal and artificial origin.
Sanitary waste (diaper and sanitary napkin)Includes adult and child diapers.
WoodWood and similar.
Yard trimmingResidues of flowers, leaves, grass, branches or the like.
Bond paperIncludes white and colored paper (printed or not), of notebooks and books. With a grammage of 50, 60, 68, 75, 90, 105, 120, 150 g/m2.
Glossy paperIt includes magazines, brochures, triptychs (grammage of 70, 90 y 120 g/m2), linings of magazines and books (grammage of 200 to 300 g/m2) and pictures (grammage of 175 to 250 g/m2).
Newspaper Newspaper recovered (recycled) or mechanical pulp paper, grammage 40 to 65 g/m2.
Toilet paper Includes disposable tissues and napkins, weight of 12 to 30 g/m2.
CardboardIncludes brown, white and mixed cardboard boxes, grammage 160 to 600 g/m2.
OthersNon-biodegradableIncludes high and low density polyethylene, polyethylene, transparent and colored glass, cans, aluminum, polypropylene, polystyrene, tetrapak, and ferrous material.
MiscellaneousMixed materials difficult to separate.
Table 2. Characterization of household solid waste.
Domestic Solid WasteMean ± Standard Deviation
(%, p/p)
Percentage DLW a
(%)
DLWFood waste47.4 ± 5.4-
Sanitary waste (diaper and sanitary napkin)7.8 ± 3.030.7
Cardboard (CB)4.8 ± 1.618.9
Toilet paper (TP)4.3 ± 2.316.9
Yard trimming3.2 ± 3.112.6
Bond paper (BP)2.2 ± 1.28.7
Glossy paper (GP)1.6 ± 1.46.3
Wood1.1 ± 1.64.3
Newspaper (NP)0.4 ± 0.41.6
Total25.4 b100
OthersNon-biodegradable23.5 ± 9.0
Miscellaneous3.8 ± 1.9
DLW: Domestic lignocellulosic residues; a Percentage relative to total DLW; b Except for food waste.
Table 3. Chemical characterization of DLWs belonging to the paper and cardboard category.
Chemical CompositionDomestic Lignocellulosic Residues
TPBPGPCBNP
Total Solid
(TS)
(%, p/p)98.898.899.697.997.6
σ0.10.30.20.10.1
(p ≤ 0.05) *bbacd
Total Volatile Solid
(TVS)
(% TS)98.779.667.991.787.0
σ0.20.21.60.60.8
(p ≤ 0.05) *adebc
Lignin(% TS)1.02.212.915.424.5
σ0.10.00.51.51.2
(p ≤ 0.05) *ddcba
Holocellulose(% TS)84.986.374.568.462.7
σ1.00.40.80.80.7
(p ≤ 0.05) *aabcd
Biodegradability factor (BF)0.80.80.50.40.2
Toilet paper (TP); Bond paper (BP); Glossy paper (GP); Cardboard (CB); Newspaper (NP); Standard deviation (σ); * Tukey-Kramer Test: The different letters indicate a statistically significant difference between the means with a probability (α = 0.05, n = 3).
Table 4. The composition of paper and cardboard in the domestic solid waste stream.
Paper (%)Cardboard (%)SeasonSocioeconomic StratumCity/CountryReference
8.54.8SummerMedium-LowMorelia, Michoacán/MexicoThis study
6.81.6NSLow-MediumSan Luis, Lima/Peru[58]
13SummerMediumSan Pedro Mixtepec Juquila, Oaxaca/Mexico[59]
4.3 to 8.7SummerLow-MediumZacatecas Mexico[60]
14.3Four seasonsMedium-HighSuzhou/China[61]
8.6Summer/WinterRuralEnsenada, B.C.N./Mexico[62]
5.15.3WinterPopular-Medium-ResidencialXico, Veracruz/Mexico[2]
6.26.5NSHigh-Medium-LowMexico[1] a
21.6SummerProMedium High, Medium y LowEnsenada, B.C.N./Mexico[63]
16.5SummerMedium-LowSan Quintín, B.C.N./Mexico[63]
15.9SummerMedium-LowVicente Guerrero, B.C.N./Mexico[63]
11.4SummerLowSanto Domingo/Dominican Republic[64]
4.7Dry/RainyHigh-Medium-LowCan Tho/Vietnam[65] b
NS: Not specified; a National average of urban solid waste; b Subdivisions in the category of paper and cardboard, only by the use of the material.
Table 5. Lignin content and CH4 yield of domestic lignocellulosic residues.
DLWLignin (% TS)Pretreatment aExperimental Phase bTemperature RegimeTest Time (Days)YCH4 Accum. (mL/g TVS)Ref
BP2-Semi-SolidMesophilic200902This study
NCBiologicalLiquidThermophilic40380[54]
2-LiquidMesophilic45372[57]
1-LiquidMesophilic55287[40]
2-SolidMesophilic700214[52]
2BiologicalLiquidMesophilic60184[66]
GP13-Semi-SolidMesophilic200504This study
12BiologicalLiquidMesophilic6092[66]
15-SolidMesophilic23063[52]
CB15-Semi-SolidMesophilic20066This study
NCBiologicalLiquidThermophilic40280[54]
3-LiquidMesophilic45271[57]
18-LiquidMesophilic55231[40]
9-LiquidMesophilic45202[57]
16Addition of nutrientsSemi-SolidMesophilic298197[53]
21-SolidMesophilic450113[52]
NP25-Semi-SolidMesophilic2002This study
23-LiquidMesophilic55287[40]
NCBiologicalLiquidThermophilic40280[54]
24-SolidMesophilic45073[52]
25BiologicalLiquidMesophilic6059[66]
TP1-Semi-SolidMesophilic200−28This study
1-LiquidMesophilic45419[57]
NC-LiquidMesophilic15230[56]
Mixture containing domestic lignocellulosic residues (similar to paper and cardboard)
BP, NP, and CB (1:1:1)1BiologicalLiquidMesophilic10569[67]
Food and paper (9:1)NCChemicalLiquidThermophilic32499[55]
Diverse paperNCBiologicalLiquidThermophilic40380[54]
Food paper and plastic (2:1:1)NCThermalSolidMesophilic37370[68]
BP, NP, CB and GP (1:2:3:3)2-LiquidMesophilic50117[69]
a Pretreatment different from mechanical (crushing). b Liquid concentration (<10%TS), semi-solid (10 ≤ 20% TS), and solid (>20% TS). Not quantified (NC).
Table 6. Production of CH4 relative to the generation rate of domestic solid waste.
Domestic Lignocellulosic ResiduesDomestic Solid Waste a
(kg)
Experimental Performance of CH4 b
(m3/kg of Material, Dry Base)
CH4
(m3)
Emissions of CH4
(kg CO2eq/kg of Waste)
This Study cDEFRA [18] cTurner et al. [19] d
Bond paper220.72162591335
Glossy paper160.36694925
Toilet paper43-----0.12568
Cardboard480.063472827
Newspaper4<0<00.126
Total 2340077161
a Percentage of total domestic solid waste; b Accumulated during anaerobic digestion in the mesophilic regime, at day two hundred, in this study; c Dry base; d Wet base.

