Article

Sustainable and Healthy Organizations Promote Employee Well-Being: The Moderating Role of Selection, Optimization, and Compensation Strategies

by
Adrián Segura-Camacho
1,
Juan-José García-Orozco
2 and
Gabriela Topa
2,*
1
Department of Developmental and Educational Psychology, University of Huelva, 21071 Huelva, Spain
2
Department of Social and Organizational Psychology, UNED, 28040 Madrid, Spain
*
Author to whom correspondence should be addressed.
Sustainability 2018, 10(10), 3411; https://doi.org/10.3390/su10103411
Submission received: 25 July 2018 / Revised: 20 September 2018 / Accepted: 22 September 2018 / Published: 25 September 2018
(This article belongs to the Special Issue Psychology of Sustainability and Sustainable Development)

Abstract

:
The psychology of sustainability claims for a new kind of organization that promotes employee well-being as well as the search firm’s performance. In sustainable and healthy organizations, tasks are characterized by their significance, variety, autonomy, and feedback from the job. This way of organizing employees’ activities motivates them and can affect their well-being. However, due to a series of age-related physical and cognitive changes, older workers must constantly adapt to task demands to continue working and maintain their productivity. This research explores the moderating role of selection, optimization, and compensation strategies in the relationship between task characteristics (significance, variety, autonomy, and feedback from the job) on the one hand, and job satisfaction and organizational citizenship behaviors on the other. This study was carried out using a lagged design over a three-month interval. Participants were 183 Spanish workers aged between 45–55 years who completed two questionnaires (Time 1 and Time 2). The results support the moderating role of the optimization and compensation in the relationship between task characteristics and employee well-being. Elective selection and loss-based selection strategies do not moderate the relationship. These findings underscore that people who are actively involved in optimization and compensation strategies can age successfully at work. The implications of this study to improve the orientation practices of older workers are discussed.

1. Introduction

Nowadays, population aging, doubts about the strength of public pension systems, and recognition of the older workers’ accumulation of knowledge and professional experience have jointly contributed to encouraging people to stay at work longer. Despite this, fast changes, employment insecurity, and negative stereotypes toward older workers threaten their well-being [1]. Moreover, the psychology of sustainability and sustainable development [2,3,4] encourage research and intervention directed toward the development of resources at the personal level [5,6,7], and the construction of healthy working environments [8,9,10,11] at the organizational level. Such organizations provide their members with healthy working conditions, which are characterized by their meaningfulness, responsibility, and knowledge, which in turn foster employee well-being. Hence, healthy organizations would be more appropriate for workers in general, and still more so for older workers [9,11]. Healthy organizations could be defined as those where work practices, as well as culture, promote employee well-being and organizational effectiveness [12]. This way of organizing employees’ activities motivates them and can affect their well-being. Consequently, healthy organizations are environments [13] in which older workers’ permanence and productivity are more likely. So, these are environments in which older workers could find the organizational conditions that are needed for successful aging at work [14].
In these organizations, jobs are characterized by their task significance, variety, work methods, autonomy, and feedback from the job; these characteristics are sources of intrinsic motivation and experiences of meaningfulness, responsibility, and knowledge of the outcomes at work [15,16]. Positive psychology has stated that individual well-being can be conceptualized both as hedonic and eudaimonic well-being. Hedonic well-being refers to the affective and cognitive components of satisfaction assessment, whereas eudaimonic well-being refers to the individual’s psychological and the social functioning. Empirical research has supported that employee well-being is likely to be influenced by the characteristics of positive organizations [17]. Accordingly, meta-analysis supported that task characteristics are related to workers’ attitudes and behaviors, such as job satisfaction and organizational citizenship behaviors (hereafter, OCB).
However, to remain at work and maintain productivity, older workers need to constantly adapt to job demands due to a set of age-related physical and cognitive changes, which are often accompanied by changes in emotion regulation, personality traits, and motivational orientations, among others [12]. Hence, people can apply individual adaptive strategies, which consider personal age-related changes and the ultimate purpose of increasing their adaptation to the job. Hence, individual adjustment strategies have also been considered to have a strong influence on employee well-being [14]. Moreover, studies have accumulated evidence of age as a moderator in the relationship between task characteristics and outcomes, and a lifespan development perspective on job design was proposed [18]. This perspective examines the interplay between age and work features, because adults devote a relevant part of their lifespan to work, which allows them to apply these adaptive processes. In accordance with this evidence, the present study aims to explore the relationships between task characteristics and older employees’ well-being [19], such as job satisfaction [20] and OCB [21]. The main contribution of the present research is to offer concrete recommendations both to Human Resources (HR) managers and older workers. This will allow us to determine whether the level of SOC strategies shows a differential impact of task characteristics on workers’ attitudes and behaviors (high impact for workers with low SOC strategies and low impact for workers with high SOC strategies).

Selection, Optimization, and Compensation Use and Its Moderating Role at Work

As Baltes and Baltes [22] stated, older adults experiencing age-related decline can cope with these discontinuities by using the selection—both elective selection and loss-based selection—optimization, and compensation strategies (hereafter, SOC) as a mechanism that leads to a positive balance between age-related gains and losses. Hence, individuals using SOC as a personal resource adapt better to their environments and their job demands [11,23].
Moghimi, Zacher, Scheibe, and Van Yperen [24] meta-analyzed the empirical evidence on SOC, but their specific role in the relationships between task characteristics and older employees’ outcomes has only received limited attention [25,26]. Among these studies, several limitations emerge such as for instance, the inclusion of limited task characteristics, the mainly negative antecedents of well-being such as burnout [27], and relying on work ability as a criterion variable [28]. Moreover, most studies used overall SOC, or three strategies, with only one study including four dimensions [24].
Hence, we argue that it is necessary to consider the moderator role of the four SOC strategies in the relation between task characteristics and older employees’ well-being. This moderator role can be explained by people going to great lengths to accumulate and hold onto resources, and they are therefore hurt by losses, or by the threat of losses. Threats of loss will undermine future well-being not only due to their predictive power of subsequent “actual losses”, but mainly due to their indirect role as sources of stress [27]. Threats are both energy and resource-consuming, and even in the absence of later losses, threats themselves could exert a negative influence on the subsequent availability of emotional and cognitive resources. As unhealthy working environments are characterized by less motivating task features, people could proactively engage in accumulating resources to prevent future depletion or in compensating for the actual losses of meaningfulness and knowledge by improving their resources or selecting highly motivating goals [18]. Hence, SOC strategies could play a buffering role, and the negative impact of a lack of motivational characteristics should be lower in employees with high SOC use [28]. These subtle processes would explain the hypothetical moderating role of SOC in the relationships between task characteristics and employees’ outcomes. Since the four SOC dimensions could at least entail a gain cycle, by increasing resource accumulation or decreasing resource consumption, the present study proposes the hypothetical moderating role of SOC in the relationships between task characteristics and employees’ outcomes [29]. Although some studies have previously considered SOCs as moderators in the relationships between work environment characteristics and employee’s well-being [25,26,27,28], empirical evidence is controversial [24].
Employee well-being could be conceptualized as hedonic and eudaimonic [30]. Hedonic well-being consists of self-realization, but also of social integration, contribution, and actualization, among other facets [31]. Based on this approach, affective job satisfaction has been considered a direct indicator of hedonic well-being at work [20]. From the eudaimonic perspective, well-being would include the employee behaviors that are positively oriented toward other people in the work environment or toward their organization, such as OCB.
Based on the literature reviewed, it is hypothesized that:
Hypothesis 1 (H1).
SOC will moderate the relationship between task characteristics—(H1a) significance, (H1b) variety, (H1c) autonomy, and (H1d) feedback from the job—and job satisfaction.
Hypothesis 2 (H2).
SOC will moderate the relationship between task characteristics—(H2a) significance, (H2b) variety, (H2c) autonomy, and (H2d) feedback from the job—and OCB.

2. Materials and Methods

2.1. Participants and Procedure

The study Ethics Committee of UNED (National Distance Education University) approved the study protocol accordingly with the Declaration of Helsinki on May/4/2016. The present study was conducted following a lagged design with a three-month interval to address the concern of common method variance. Data were collected in June and July (T1) and in September and October (T2) of 2016. The methodological objective for the time lag between the two waves was to separate the variables by time periods that were longer than three months, as recommended [32]. The participants were contacted by Human Resources departments of companies in Madrid and Andalusia. They recruited the participants using a convenience sampling procedure. Participants were given an envelope containing the complete booklet and instructions, plus a cover letter and the envelope with paid postage to return the responses to the research team. All of the subjects provided an informed consent for inclusion before their participation in the study. In the first data collection, 500 questionnaires were distributed, and 245 completed questionnaires were returned (49% response rate). The final sample of this study included 183 Spanish workers aged between 45–55 years.
The mean age was 50.6 years (SD = 2.8), and the average organizational seniority was 20.5 years (SD = 9.3). Of the sample, 56.9% were males, 57.1% had higher education (university degrees, Master’s, or PhD), 13.6% had vocational training (secondary education or courses oriented to a specific profession), and 23.4% only had primary education. Of them, 76% were qualified employees, 4.3% were managers, and 28.8% were middle managers. Furthermore, 90.2% of the participants were working full-time and 5.4% were part-time workers, while the rest were missing data. The sample included 76% from the services sector, 9.8% from telecommunications, 2.2% from banking and finance, and 12% from industry.

2.2. Instruments

Task characteristics: A Spanish adaptation [33] of the Work Design Questionnaire was used [34], which included the following subscales: Task Significance, Task Variety, Work Methods Autonomy, and Feedback from Job. Examples of items are: “The results of my work are likely to significantly affect the lives of other people” (Significance); “The job involves a great deal of task variety” (Variety); “The job allows me to make decisions about what methods I use to complete my work” (Work Methods Autonomy); “The job itself provides me with information about my performance” (Feedback from Job). The Likert-type response scale ranged from one (Totally disagree) to five (Totally agree). Adequate reliability has been shown, ranging from α = 0.76 for Task significance to α = 0.91 for Task Variety.
SOC (Selection, Optimization, and Compensation): We used the Spanish short version [35] of the SOC questionnaire [36]. The Likert-type response scale ranged from one (never) to five (always). Three items were contained in each subscale. Examples of items are: “I concentrate all my energy on a few things” (Elective selection); When things don’t go as well as before, I choose one or two important goals” (Loss-based selection); “I keep working on what I have planned until I succeed” (Optimization); and “When something in my life isn’t working as well as it used to, I ask others for advice or help” (Compensation). Mean +1 standard deviation were considered high values in these subscales, whereas mean −1 standard deviation were considered low values.
Job Satisfaction: The four items of the Brief Index of Affective Job Satisfaction in Spanish [20] were used, providing a positive overall and emotional response to the job in general. The Likert-type response scale ranged from one (Totally disagree) to five (Totally agree). Adequate reliability has been shown (α = 0.83) in the past [37]. Examples of items are: “I find real enjoyment in my job” and “I feel fairly well satisfied with my job”.
Organizational Citizenship Behavior: The Spanish Organizational Citizenship Behavior scale has been used [21]. Example items are: “I show interest in the image of the organization” and “I dedicate time to help others who have problems related or not to the tasks”. The Likert-type response scale ranged from one (Infrequently) to five (Frequently). The reliability has been satisfactory in previous studies [38].
All of the measures met the general threshold of Cronbach’s alpha of 0.70 (See Table 1). Age, sex, education, organizational tenure, organizational position, and type of contract were assessed at T1.
Data analysis was conducted using SPSS 25.0 and the PROCESS macro for SPSS. We used the regression model indicators, such as unstandardized coefficients (b), standard errors, and probability values. The bootstrapping of 1000 samples provides the confidence intervals for the unstandardized effect of the predictor on the criterion at the different levels of the moderator (at a confidence level of 95%).

3. Results

The non-response bias has been tested by comparing the demographic features of respondents who participated in both times and non-respondents at Time 2 (T2). ANOVA analyses on age, gender, education, organizational tenure, organizational position, and type of contract have been conducted. While both groups did not differ on gender [F(243,1) = 0.59; p = 0.44], education [F(243,1) = 0.18; p = 0.89], organizational position [F(243,1) = 2.31; p = 0.12], or type of contract [F(243,1) = 0.107; p = 0.53], they significantly differed on age [F(243,1) = 101.92; p < 0.001] and organizational tenure [F(243,1) = 24.28; p < 0.001]. Respondents tended to be younger and are more likely to have longer organizational tenure. Table 1 displays the descriptive statistics and correlations among the study variables.
Age was not significantly related to SOC, job satisfaction, or OCB. All of the task characteristics were positively and significantly related to each other, except for a negative correlation between variety and feedback from the job. Task characteristics had a positive relationship with optimization and compensation, but not with either elective selection or loss-based selection. Regarding the outcome variables, job satisfaction was significantly related to task significance, autonomy, and feedback, but not to variety. Furthermore, OCB had positive and statistically significant relationships with all of the variables.

3.1. Relationship between Job Characteristics and Job Satisfaction

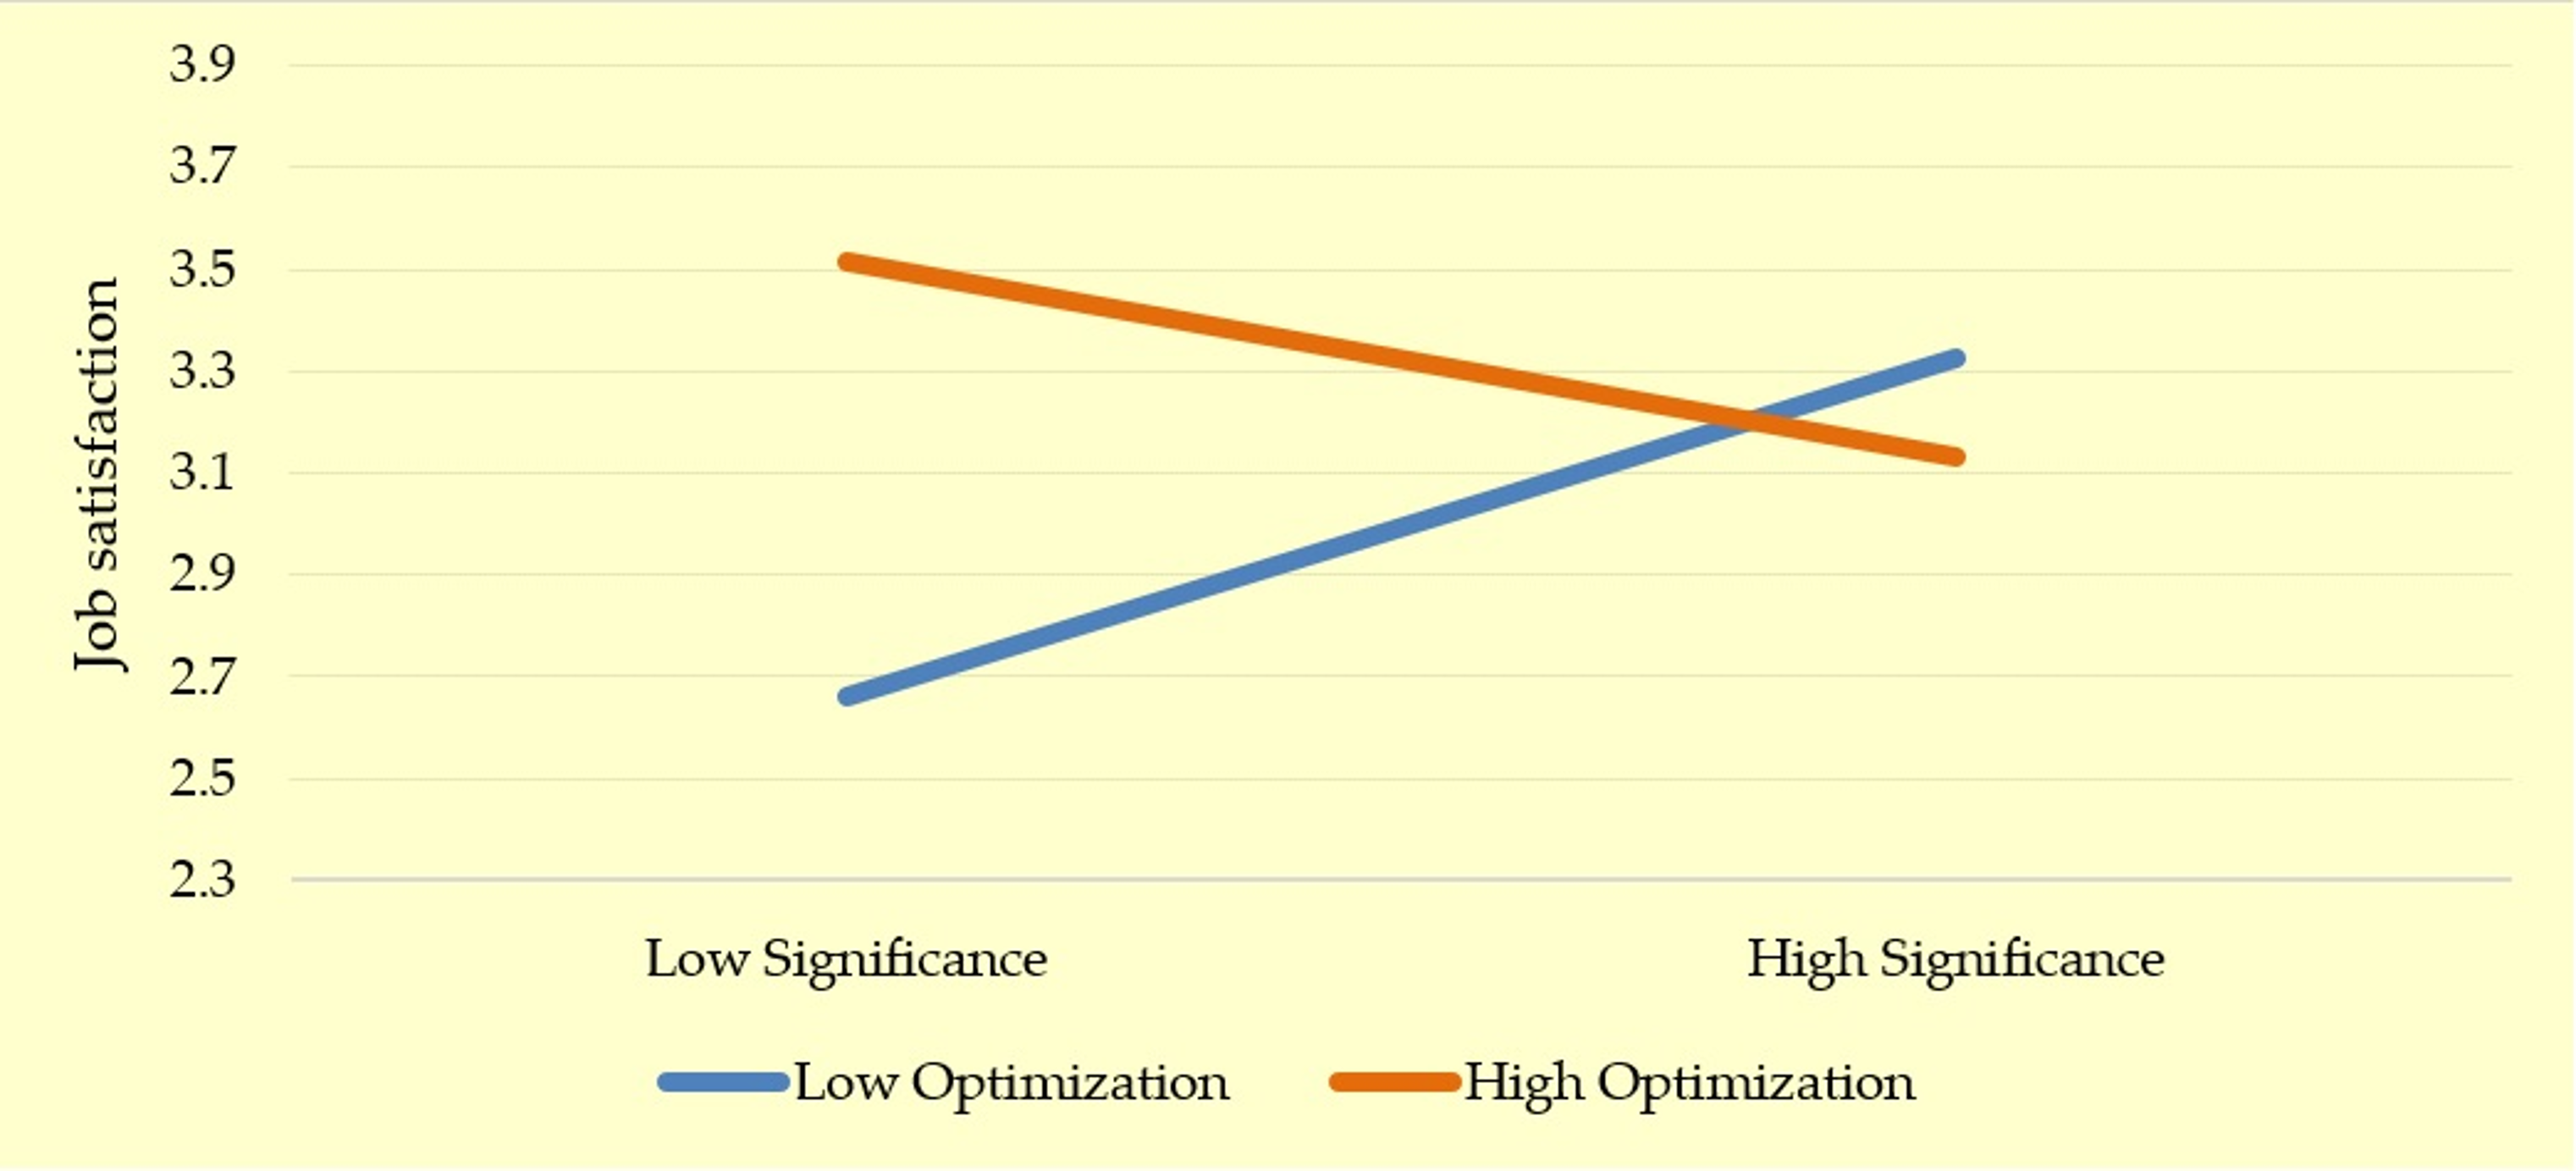
Significant results for the moderating role of SOC strategies results were found only in the interaction between job characteristics and optimization. As shown in Table 2, the interaction between optimization and task significance predicted job satisfaction [low optimization, B = 0.43, SE = 0.14, t = 3.11, p < 0.00, 95% CI [0.15, 0.71] versus high optimization, B = −0.24, SE = 0.11, t = −2.11, p = 0.03, 95% CI [−0.48, −0.01]. However, the interaction between the other SOC strategies (elective selection, loss-based selection, and compensation) and task characteristics failed to predict job satisfaction. The complete results are available from the corresponding author on request.
See Figure 1 showing that job satisfaction decreases when task significance increases and optimization is high.
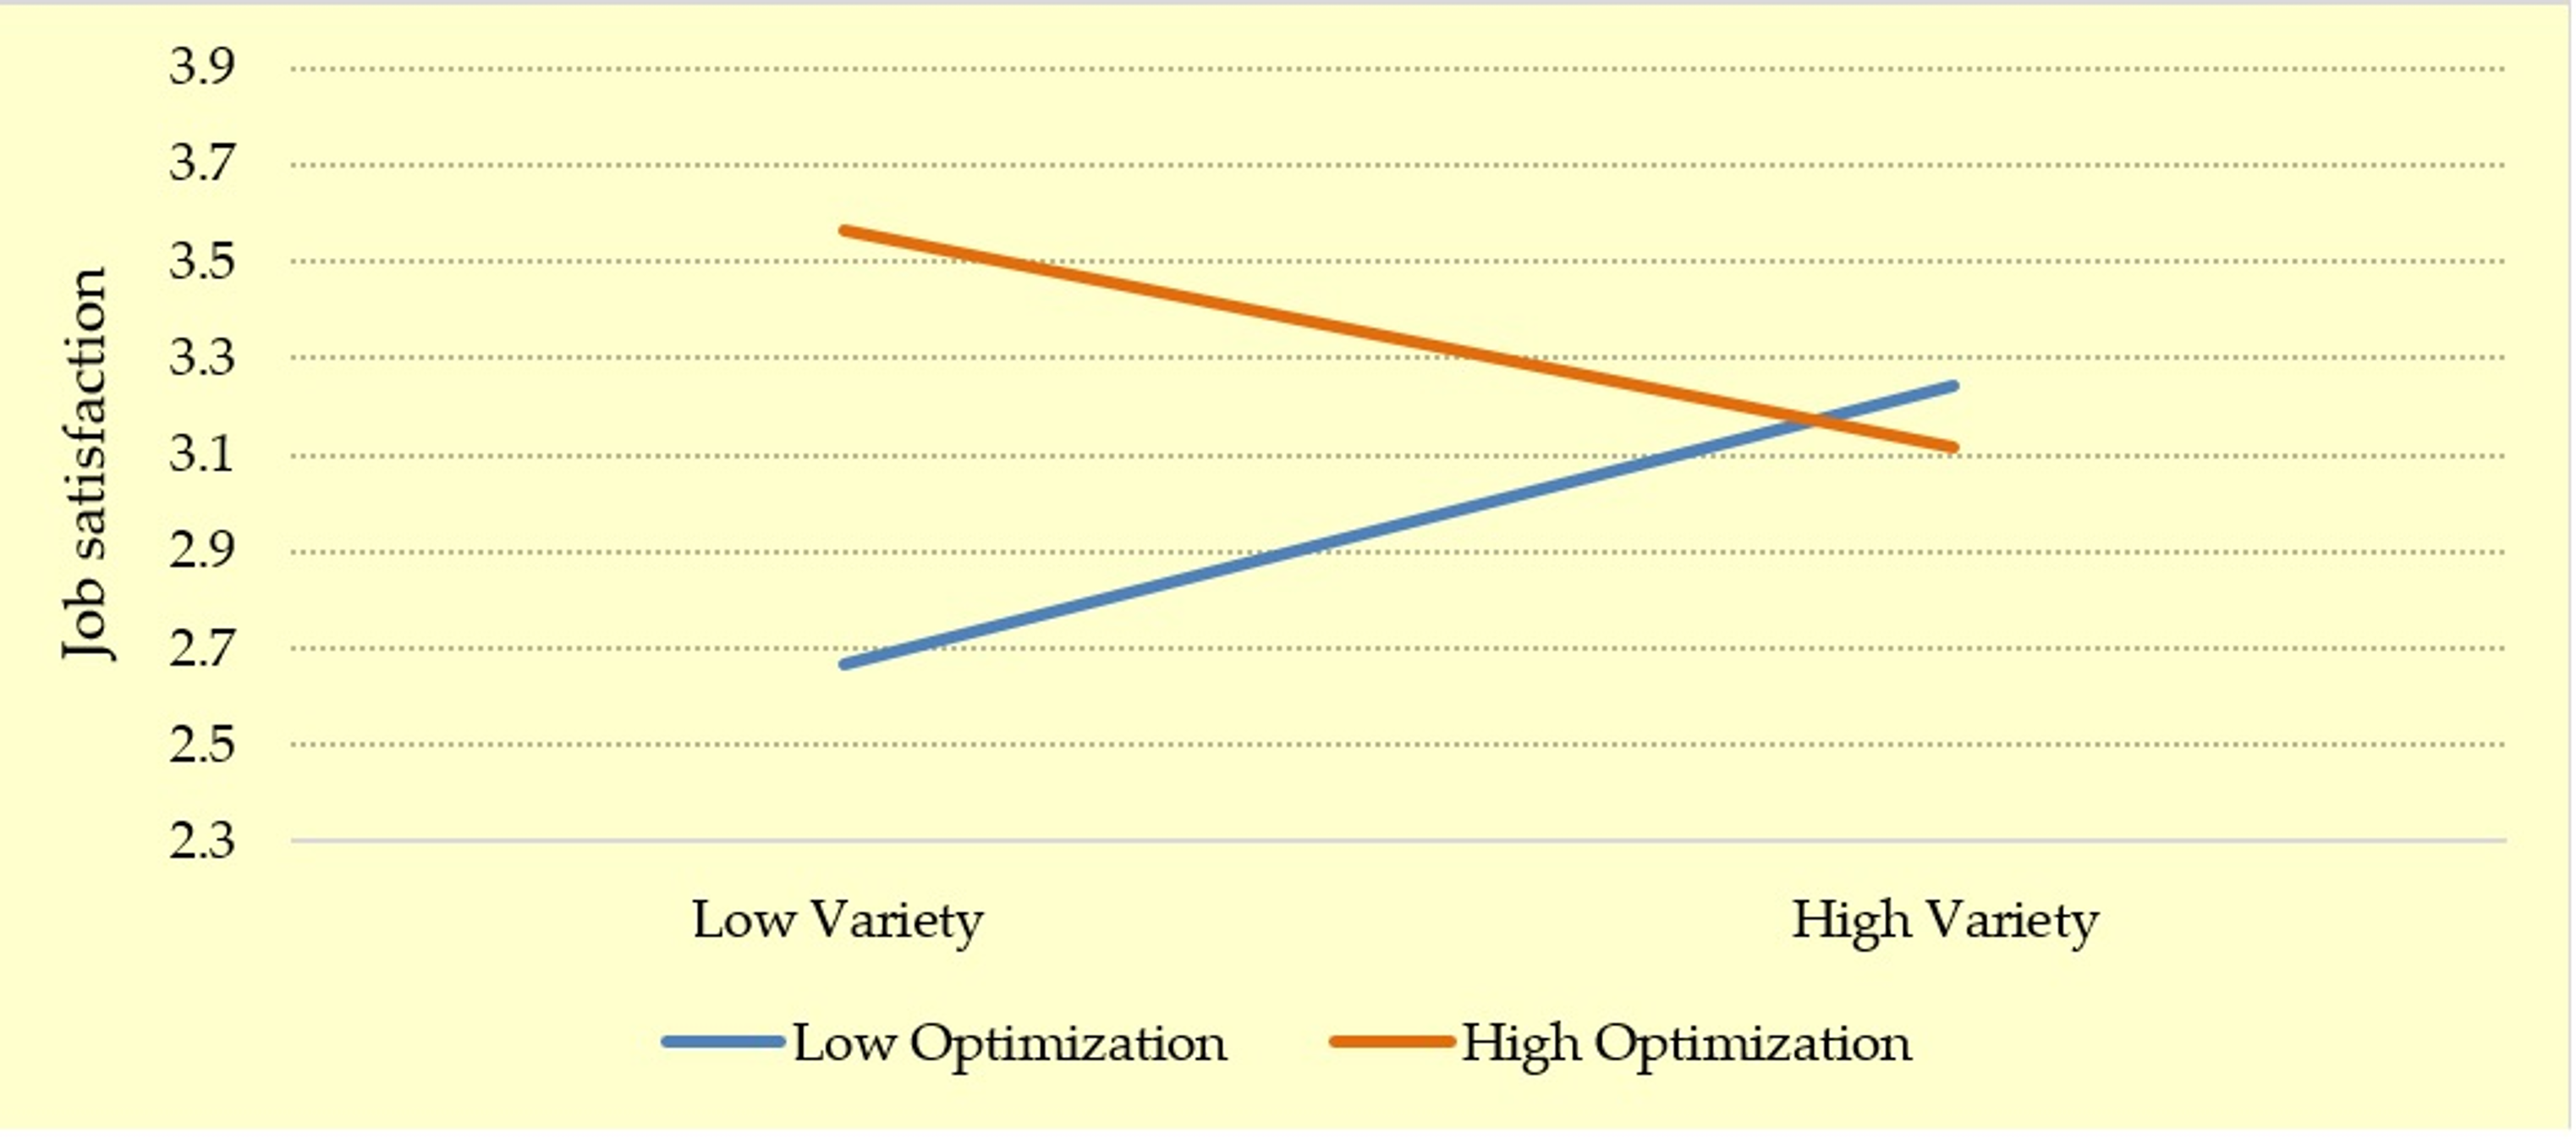
The interaction between optimization and task variety significantly predicted job satisfaction [low optimization, B = 0.34, SE = 0.13, t = 2.54, p < 0.05, 95% CI [0.07, 0.61] versus high optimization, B = −0.26, SE = 0.11, t = −2.36, p < 0.05, 95% CI [−0.49, −0.04]. See Table 3.
See Figure 2 showing that job satisfaction decreased when task variety increases and optimization is high.
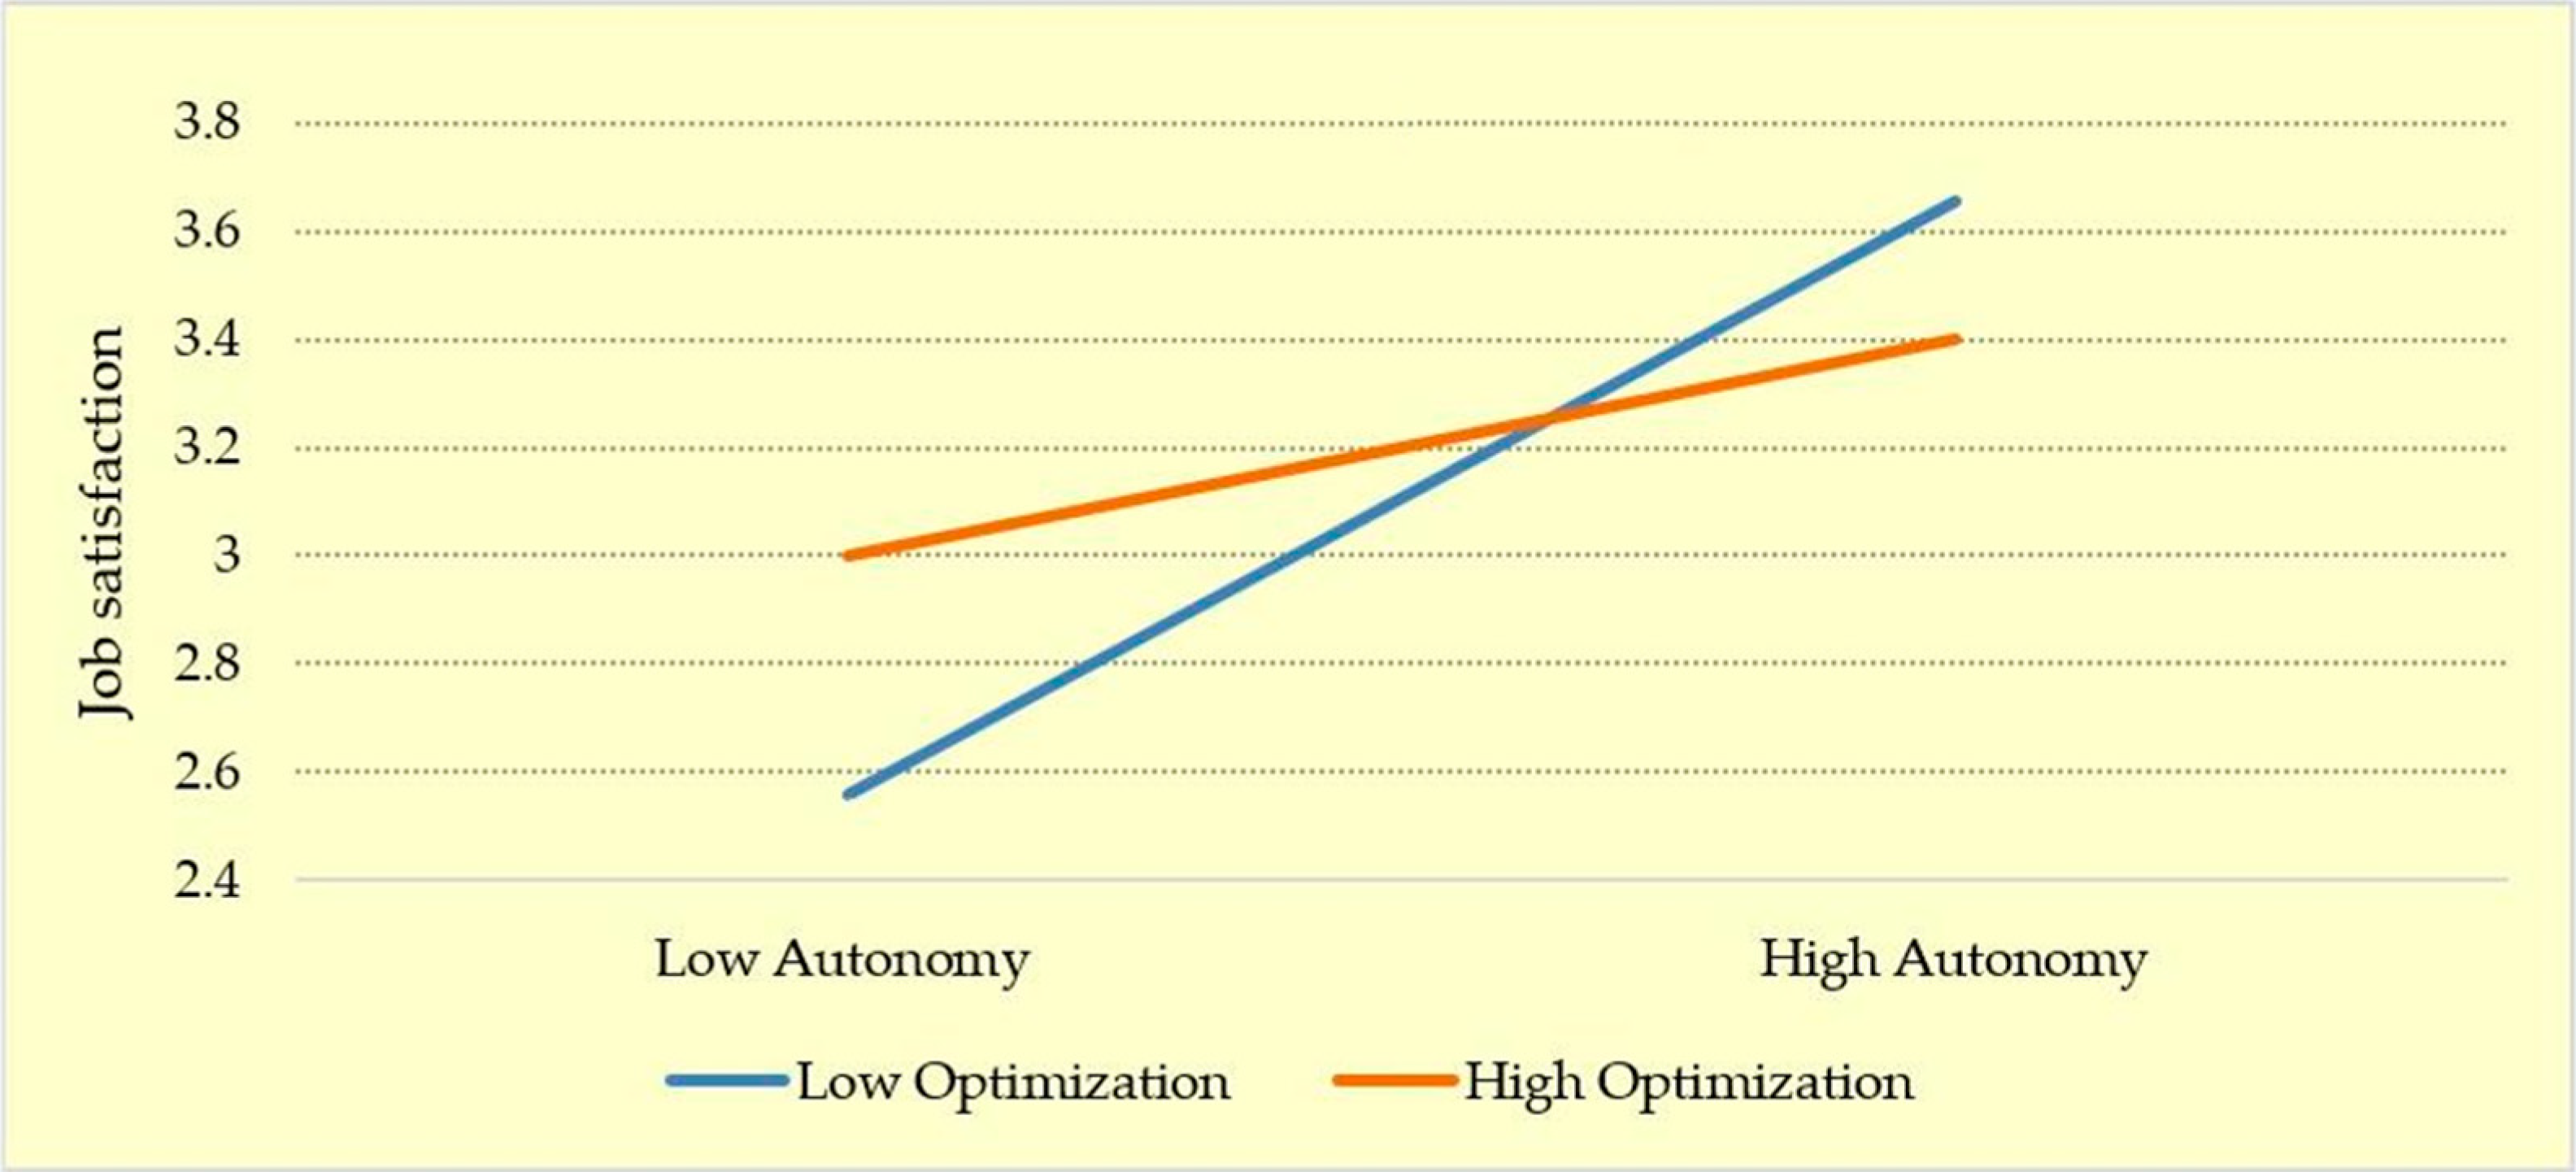
There was a significant effect of task autonomy on job satisfaction, but when optimization was high, the effect of autonomy became less intense and totally lost its statistical significance [low optimization, B = 0.58, SE = 0.10, t = 5.66, p < 0.001, 95% CI [0.38, 0.78] versus high optimization, B = 0.21, SE = 0.10, t = 1.97, p = 0.0501, 95% CI [−0.0001, 0.42]. See Table 4.
See Figure 3 showing that job satisfaction increases when optimization is high and task autonomy increases.
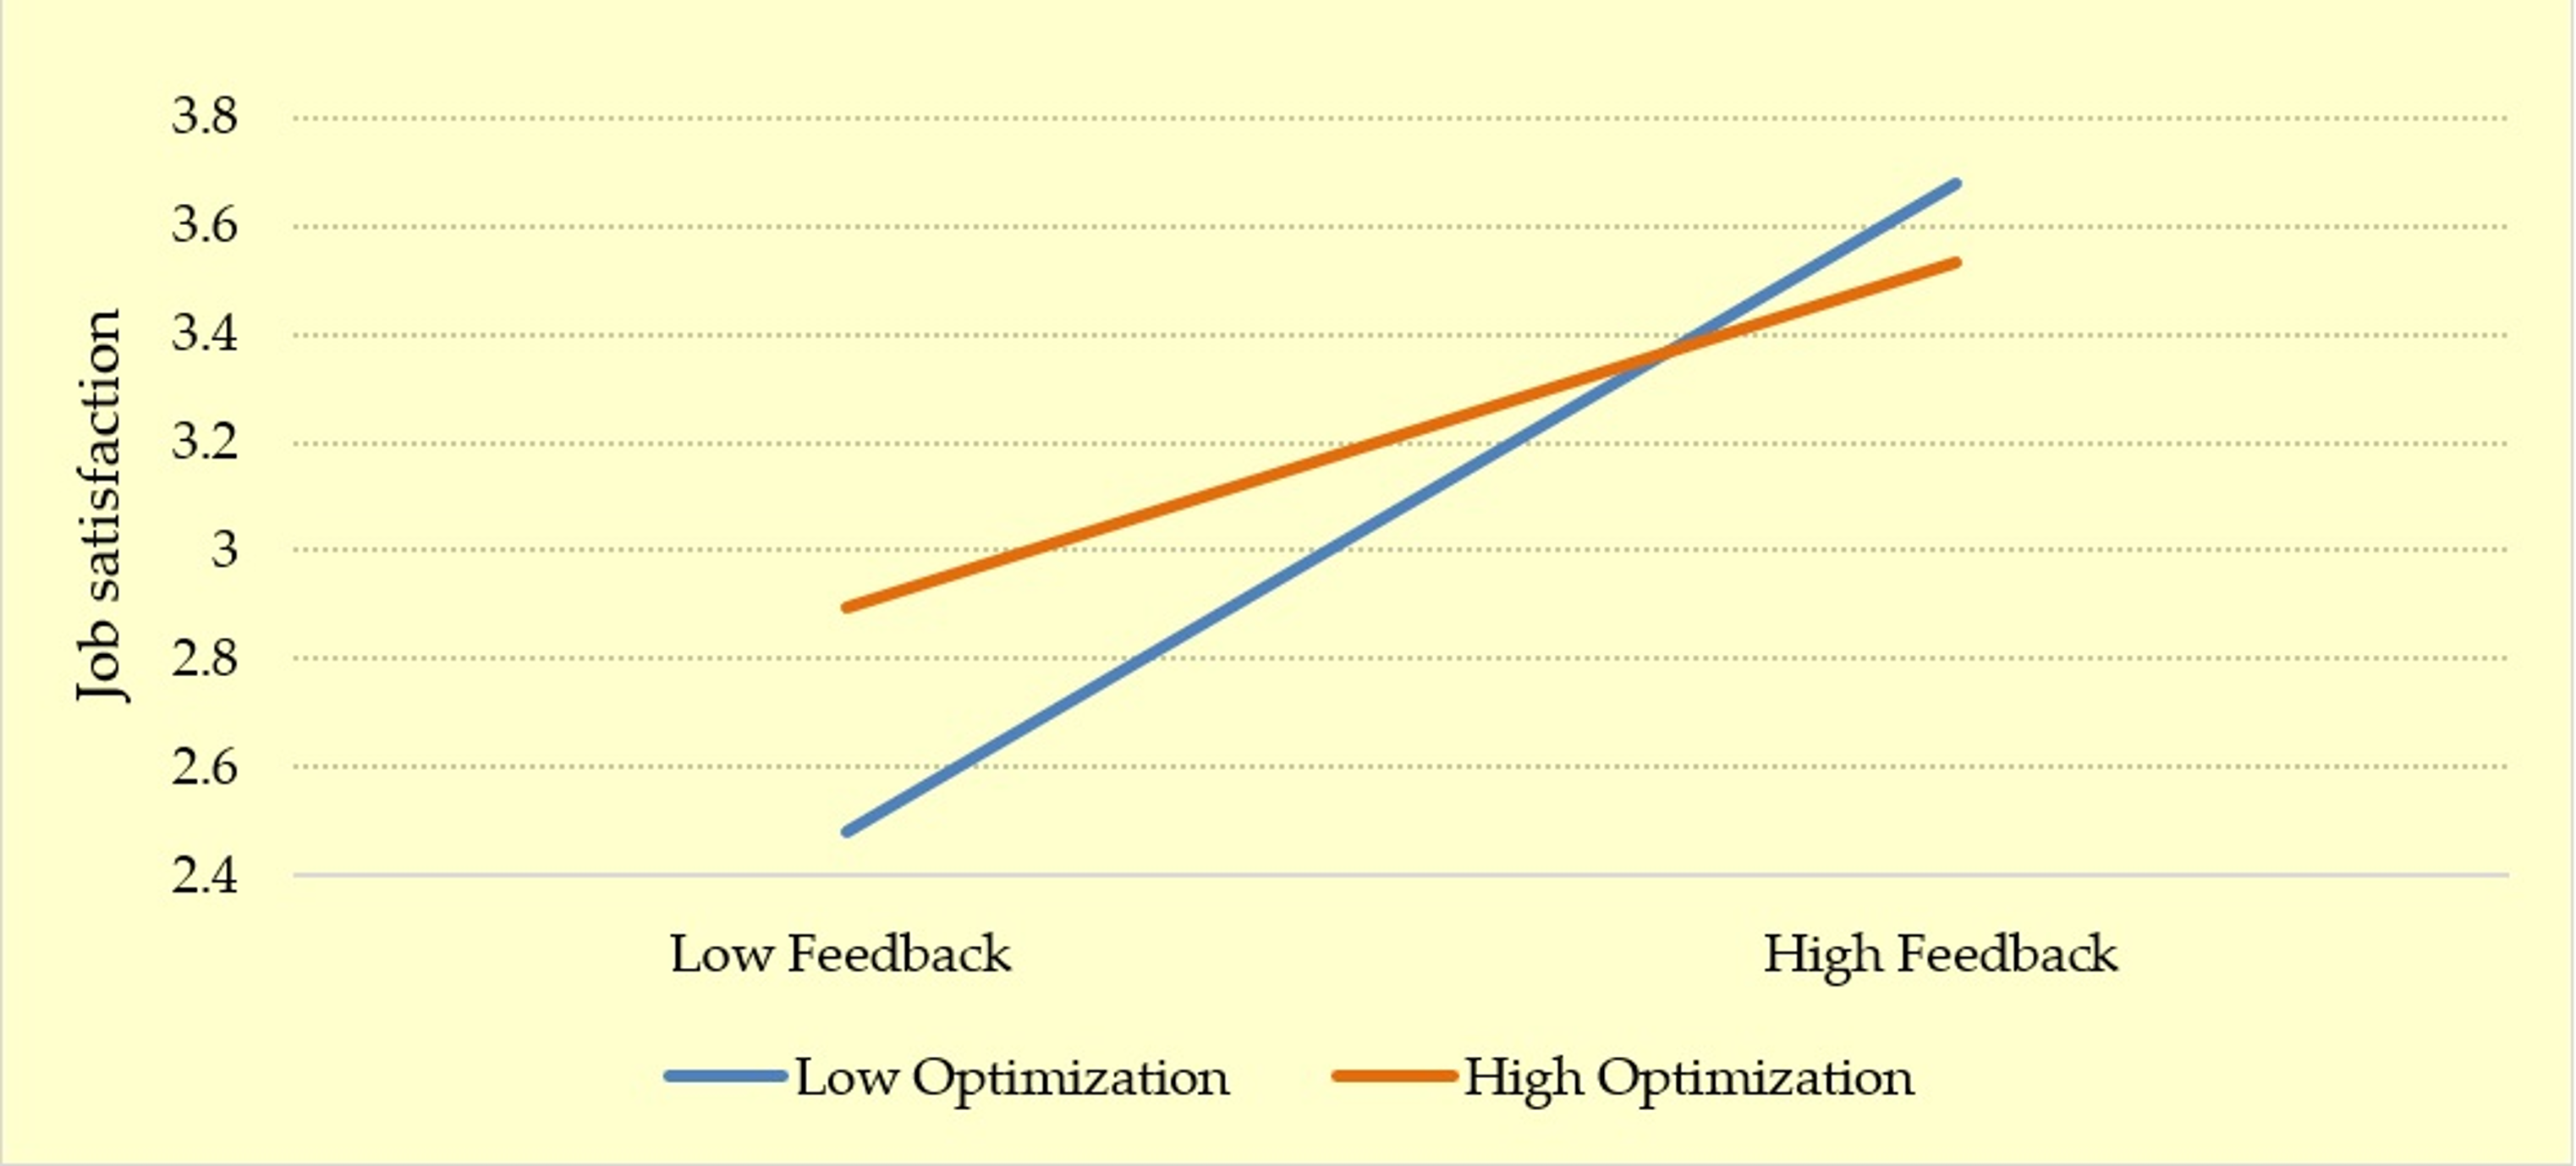
Optimization was found to be a moderator in the relationship between feedback from the job and satisfaction [low optimization, B = 0.83, SE = 0.11, t = 7.50, p < 0.001, 95% CI [0.61, 1.05] versus high optimization, B = 0.44, SE = 0.12, t = 3.47, p < 0.00, 95% CI [0.19, 0.70]. See Table 5.
See Figure 4 showing that job satisfaction increases when optimization is high and feedback from the job increases. Therefore, hypotheses 1a, b, c, and d were only partially supported.

3.2. Relationship between Job Characteristics and OCB

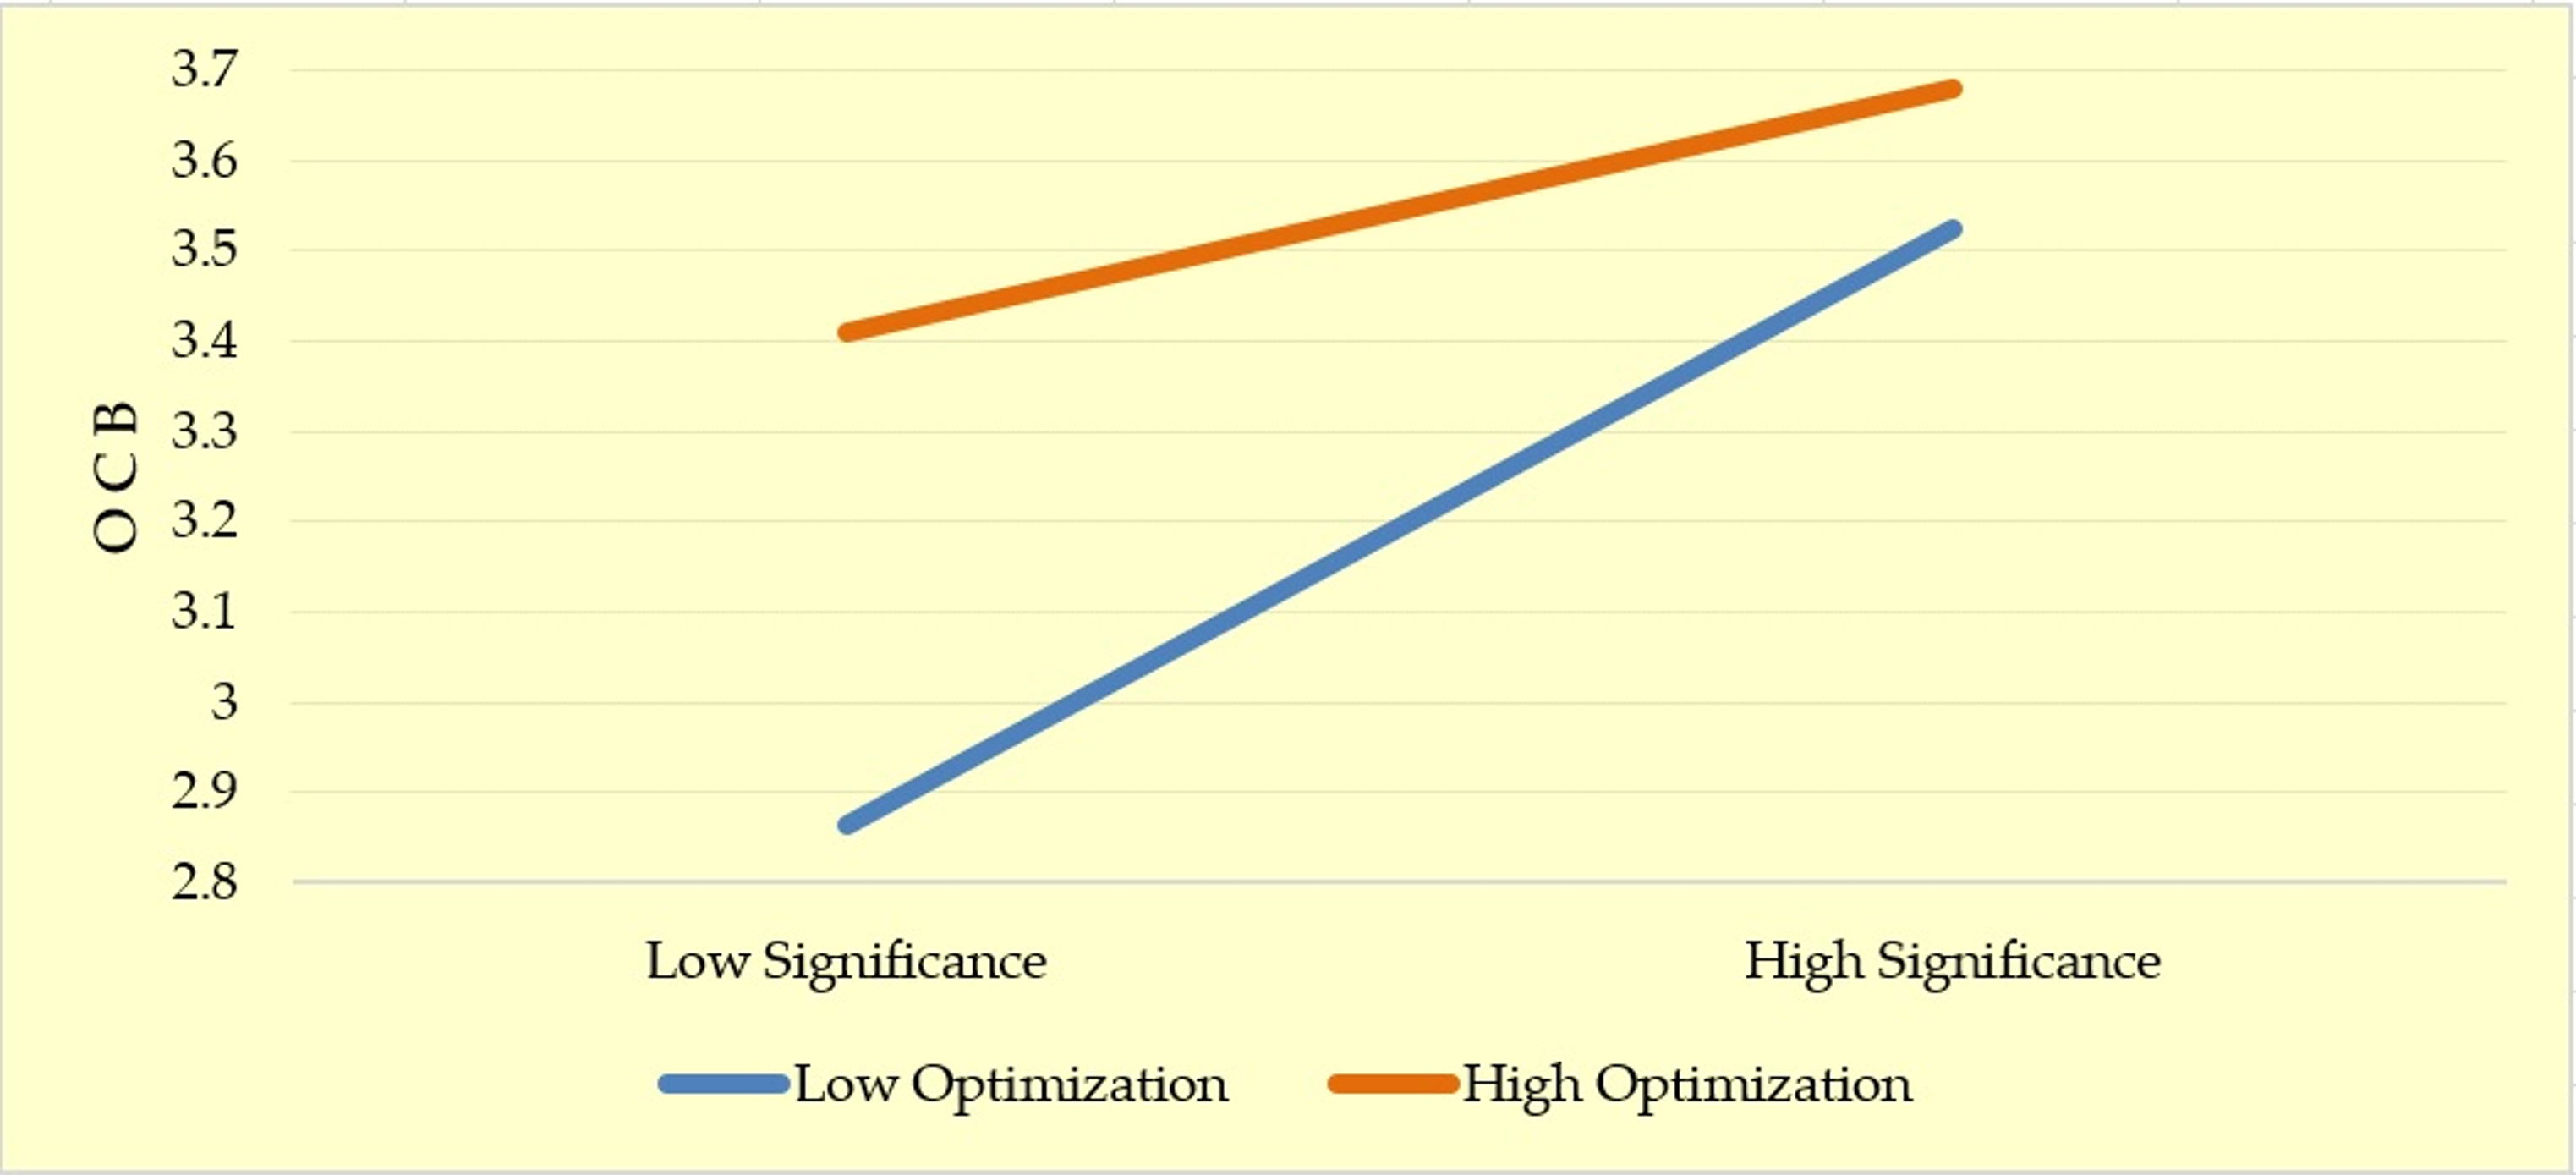
Optimization moderated the task significance—OCB relationship, as shown in Table 6 [low optimization, B = 0.41, SE = 0.08, t = 5.09, p < 0.001, 95% CI [0.25, 0.57] versus high optimization, B = 0.17, SE = 0.08, t = 1.91, p = 0.06, 95% CI [−0.005, 0.34].
See Figure 5 showing that OCB increases when optimization is high and task significance increases.
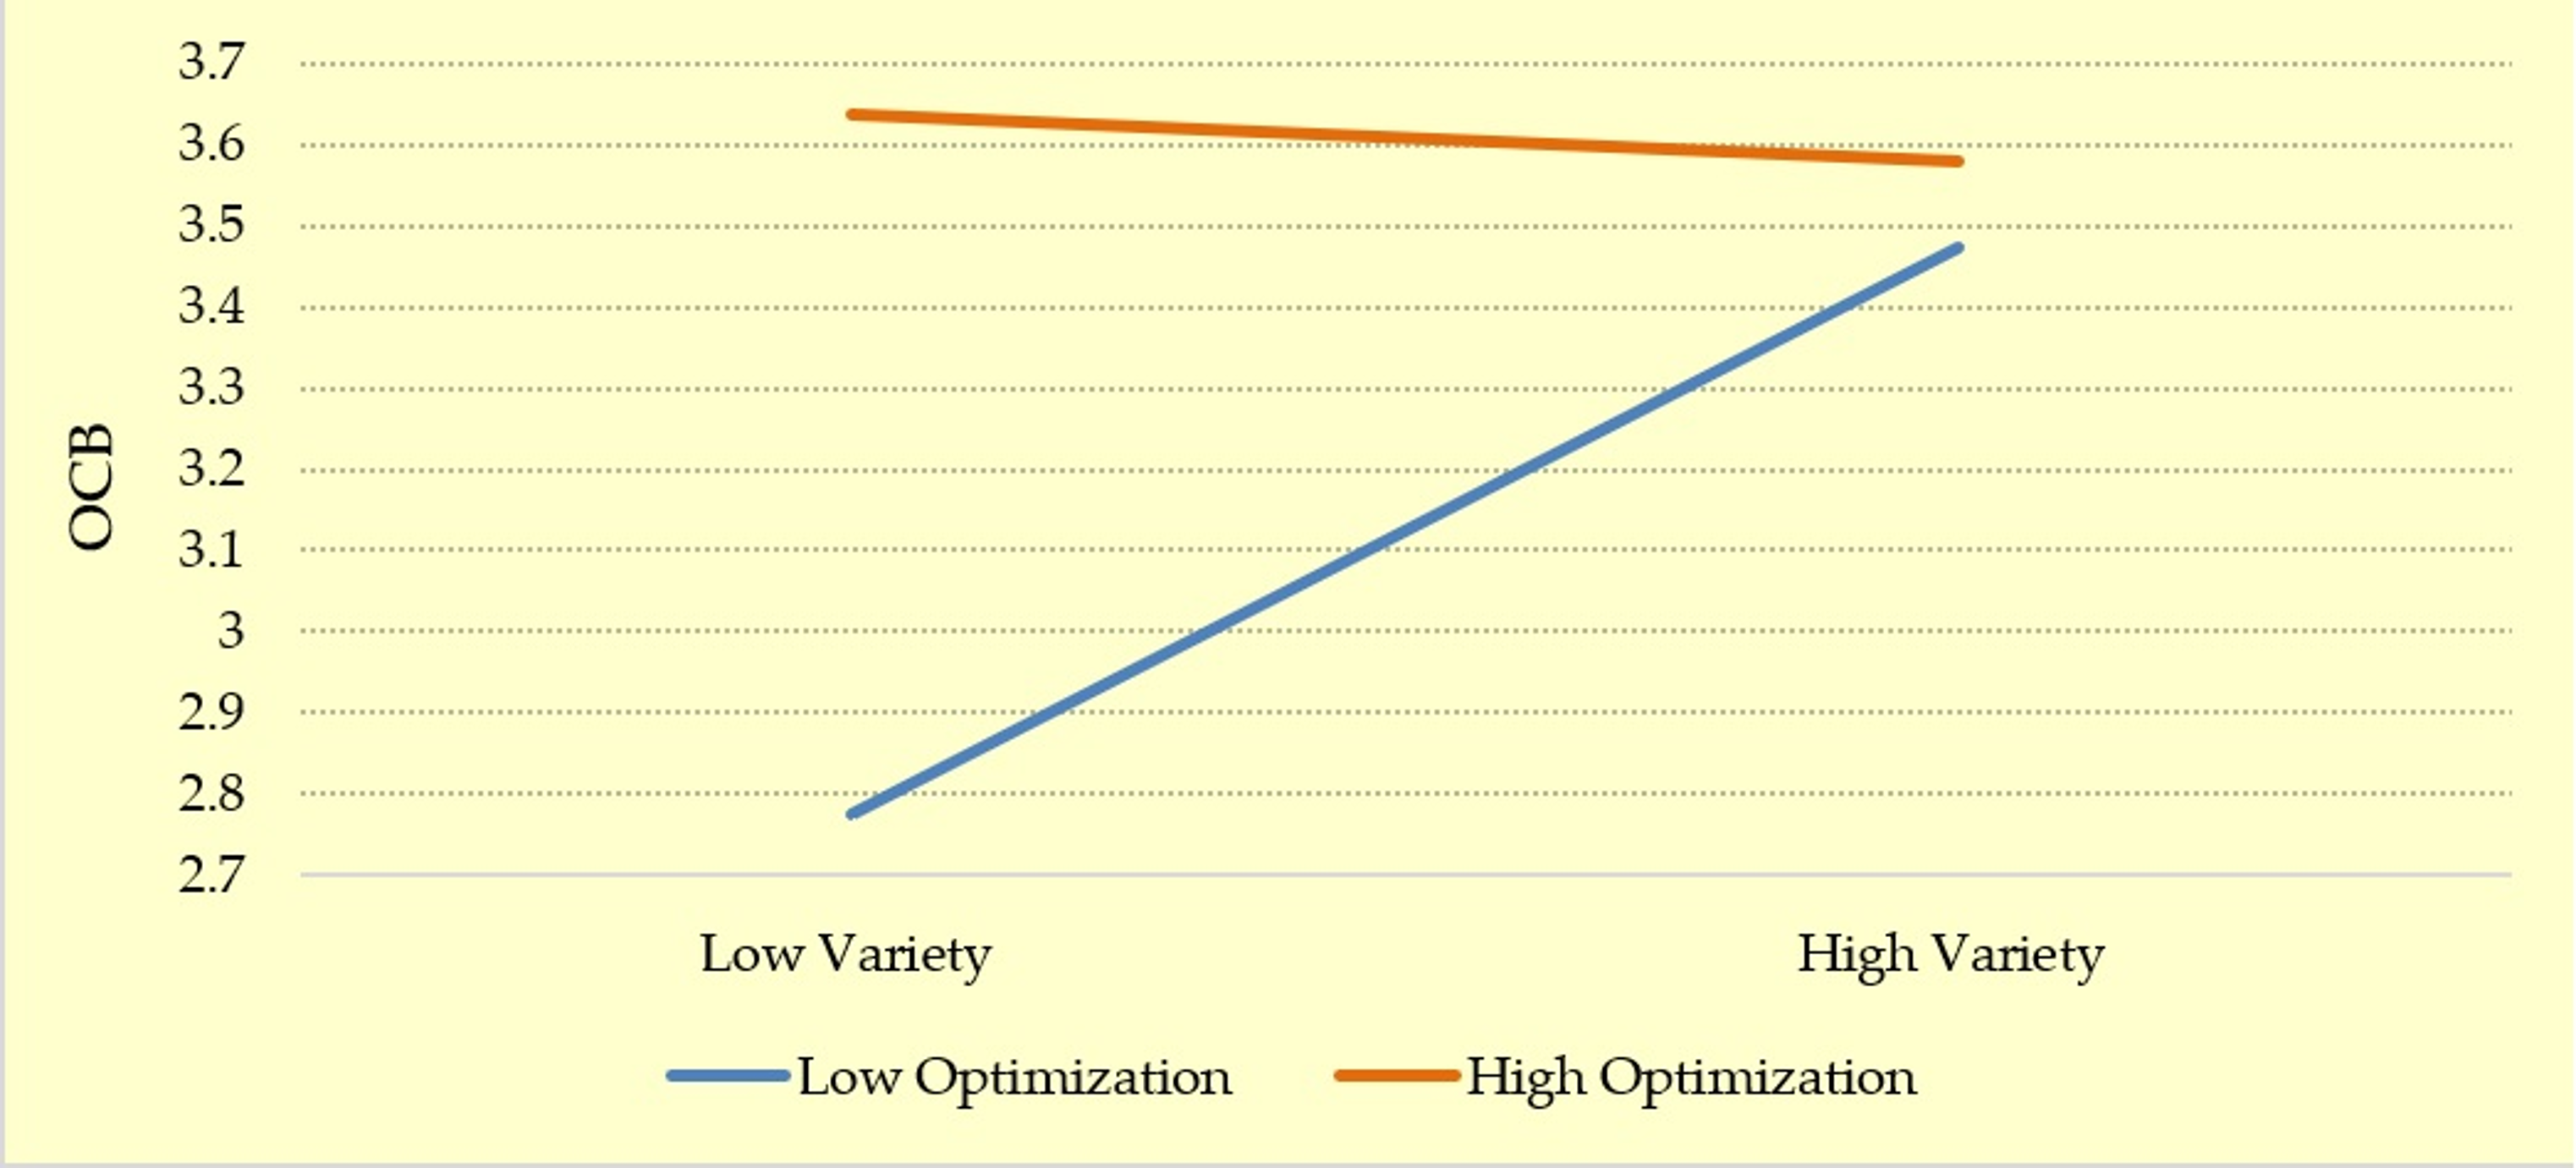
Regarding task variety, both optimization and compensation moderate the relationship between task variety and OCB. Firstly, as Table 7 showed, OCB decreases when optimization is high and task variety increases [low optimization, B = 0.41, SE = 0.09, t = 4.58, p < 0.001, 95% CI [0.23, 0.60] versus high optimization, B = −0.03, SE = 0.07, t = −0.4389, p = 0.66, 95% CI [−0.18, 0.11].
See Figure 6 showing that OCB decreases when optimization is high and task variety increases.
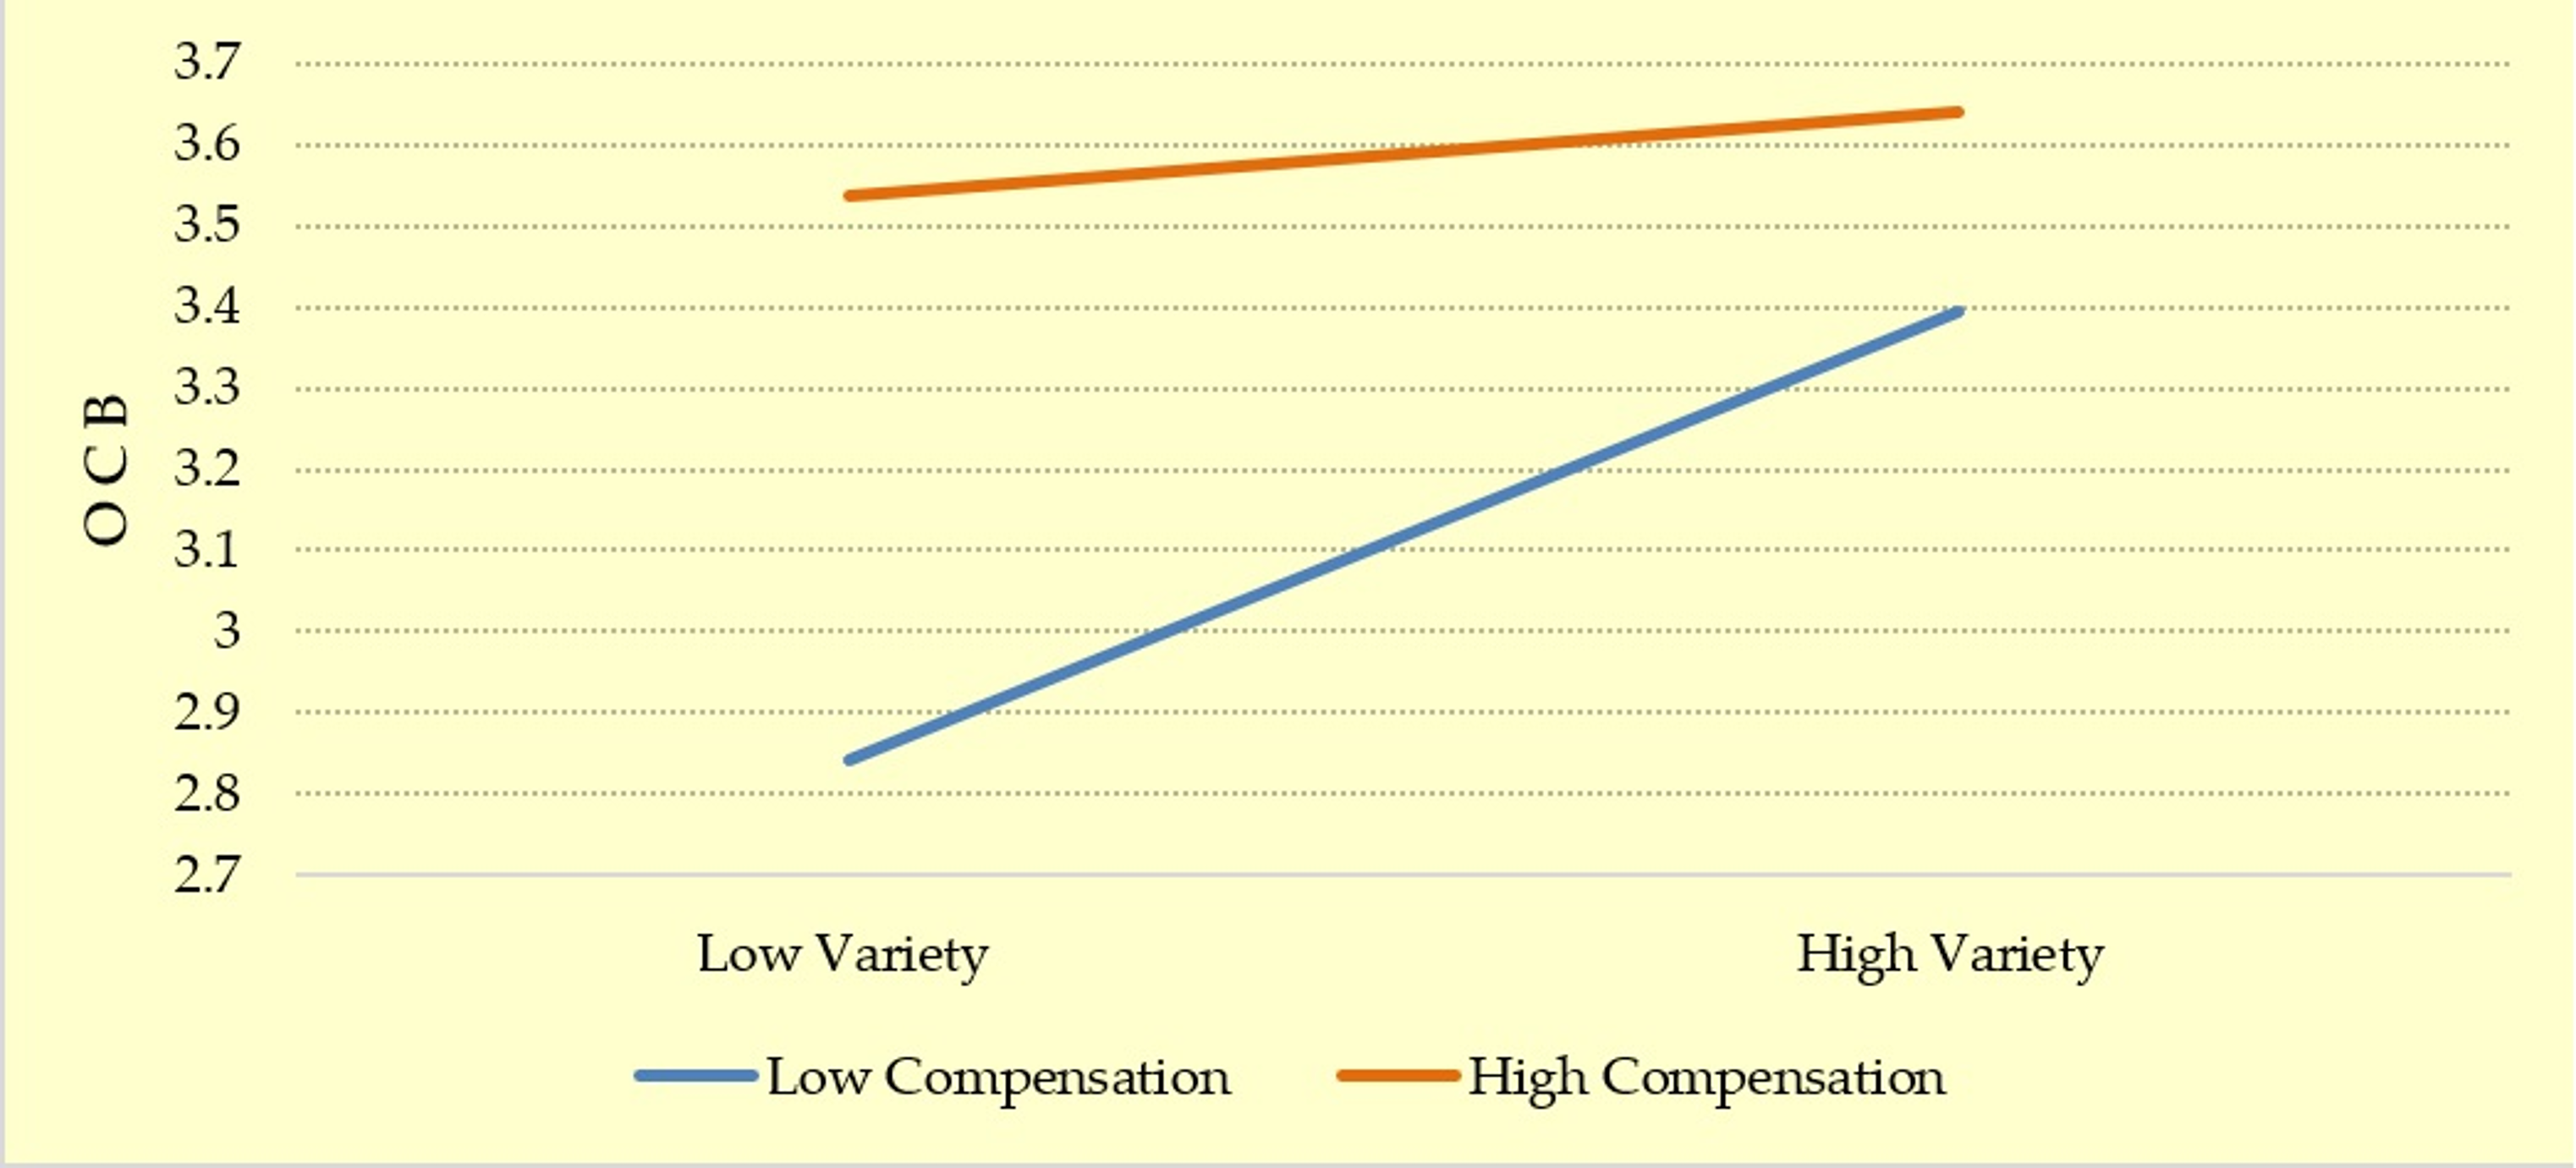
Secondly, as Table 8 showed, OCB increases when compensation is high and task variety increases [low compensation, B = 0.32, SE = 0.08, t = 3.76, p < 0.01, 95% CI [0.15, 0.49] versus high compensation, B = 0.06, SE = 0.07, t = 0.86, p = 0.58, 95% CI [−0.08, 0.20].
See Figure 7 showing that OCB increases when compensation is high and task variety increases.
Hence, hypotheses 2a and 2b were only partially supported, while hypotheses 2c and 2d were totally rejected. None of the SOC strategies moderated the relationship between task autonomy and OCB, on the one hand, or feedback from the job and OCB on the other. The complete results are available from the corresponding author on request.

4. Discussion

One of the main assumptions of the positive psychology framework is the relevance of optimization on disposition and the use of personal strengths [6,8,12,23] to prevent the future depletion of resources [39,40] and experiences of reduced quality of life [41]. According to this approach, the main aim of this study was to analyze the moderating role of SOC strategies in the relationship between task characteristics and older workers’ attitudes and behaviors, as suggested by previous studies [42]. The results underline that the use of SOC, mainly optimization and compensation, or loss-based selection to a lesser extent, could be mechanisms for successful aging and extending working lives [43], but some discrepancies deserve a more detailed discussion [18,44].
Firstly, one of the most relevant contributions of the present study is that optimization may be the most efficient strategy to increase job satisfaction when the job design is not suitable for older workers [45]. Optimization is the process that is focused on the acquisition of new tools, improving skills, and learning by modeling from others who are successful performing or directing energy to achieve important goals. Therefore, when the task characteristics are inappropriate, workers could use SOC to regulate themselves and find a new basis for motivation, showing high levels of well-being compared with those with do not apply SOC strategies. These findings are in line with the tenet that people make efforts to increase gains and reduce the actual losses of resources [46,47] and prevent future loss. At work, a lack of a positive environment, reduced autonomy, task significance, variety, and feedback could derive in a lower perception of meaning, a decrease in responsibility, and knowledge for older workers [48]. In order to prevent the detrimental impact of actual loss or even the threat of a loss of meaning, workers’ strategies could act as a renewed source of motivation or even as buffers, reducing the negative influence of the inadequate working environment on personal well-being [49].
Moreover, the most relevant contribution of this work is to point out the more efficient strategies, such as optimization, and those that are less efficient—such as compensation or loss-based selection—or those that are only efficient in some fields. As changes in job design are often slow, difficult to implement, and in most situations, beyond workers’ control [50], the use of these strategies provides an interesting avenue for intervention to improve employee well-being. However, their impact on OCB is more limited [16]. In this sense, several studies have found weaker effects when evaluating behaviors than when analyzing employees’ attitudes. In addition, OCB has been assessed as a global construct, but there may be individual differences in the tendency to manifest some OCB rather than others at work [51].
More specifically, this study shows that optimization is the most successful strategy to cushion the effects of job characteristics on older employees’ attitudes and behaviors. When these workers show a poor use of this strategy, their job satisfaction and OCB depend strongly on the task significance, their experience of autonomy, and receiving feedback from their job. Conversely, when they make good use of optimization, desirable attitudes and behaviors are relatively independent of task characteristics. Despite this general finding, our research showed two specific patterns. One of them was related to the relationships between task significance and task variety on the one hand, and job satisfaction on the other. The other pattern was related to the relationships between work methods autonomy and feedback from the job, on the one hand, and job satisfaction on the other. As Figure 1 and Figure 2 display, employee job satisfaction decreases when both task significance and task variety are high. Instead, as Figure 3 and Figure 4 display, job satisfaction increases when optimization is high, and both autonomy and feedback increase. This discrepant finding could be concealing a curvilinear relationship between variety and employee satisfaction, since task significance and task variety could imply an increase of cognitive demands that would be motivating from one viewpoint, but could also be an overload, more specifically for older workers [28]. Additionally, the continued use of SOC for a long time would be an extra effort with a less beneficial effect on well-being over the long term [27]. Future research collecting three or more waves could clarify the specific relationships for different task characteristics [44].
The present findings confirm some of the conclusions of previous studies [24]. Firstly, some task characteristics, such as job autonomy, should be considered strong correlates of the SOC used. Our findings support this assertion. Moreover, we expand the range of correlates of the SOC strategy, including feedback from the job and task significance. Secondly, SOC use significantly influences job satisfaction and OCB, which are considered part of job performance. Our findings support that SOC use predicts job satisfaction better than job behaviors. Feedback provides information about the viability of plans, and it allows people to regulate their behavior. In this sense, feedback from the job would help individuals correct their behaviors and adapt them through the optimization strategy [52].
Thirdly, our findings are also in line with other primary studies [35,42]. Additionally, other studies reported that a high use of SOC strategies facilitated older employees’ maintenance of a positive view of work, even when task complexity was high [18,53].
These findings highlight a concern for people who possess fewer resources, which could put them in a disadvantaged position in which they concentrate preventive resources in order to cope with future loss [54]. As members of stigmatized groups suffer frequently from the prevention from accumulating or even from using their current resources, interventions aimed at overcoming the negative stereotypes of older workers would protect them from being less able to profit their existing resources.

Limitations, Suggestions for Future Research, and Practical Implications

A first limitation of this work is the use of a design with two moments of data collection but with a short time interval between the two phases. Hence, the relationships between these variables should be explored through more complex designs, including interventions such as training courses or training programs, and then assessing the impact of strategies on outcomes. Second, even though we consider a wide range of antecedents by trying to collect the task characteristics, this is only a part among all of the possible variables. Due to the necessity of reducing the length of the survey, we have not included the task identity dimension among the predictor variables. Especially when it comes to late work life, people’s negative expectations about outcomes could influence their successful aging at work [55]. Thirdly, although we believe that this SOC measure was successful and economical because of its reduced length in evaluating the use of strategies, future studies could also incorporate concrete daily behaviors. For example, more objective assessments could be made through methods of daily reconstruction or the sampling of experiences. Another important limitation is the small size of the sample and the participant selection procedure. In this sense, the non-response bias could be considered a serious concern, as a reviewer suggested. Attrition could lead to a loss of power in the statistical analyses, due to increase the change of both type I and type II errors. Moreover, attrition tends to be associated with having poor health or lower financial status [56]. Our analyses supported that older participants and those with longer organizational tenure tended to remove themselves from the survey. These characteristics allow us to propose the generalization of the very limited results, which can be applied to Spanish workers with levels of training similar to those of our participants, but they cannot be extrapolated to most of the older population. A future line of research would test a mediated moderation model, considering the mediating effect of job satisfaction on the relationship between task characteristics and OCB and the moderating effects of SOC on task characteristics and job satisfaction relationships. We thank an anonymous reviewer for these suggestions.
Although the findings of this work are limited, organizations, HR managers, and workers themselves may adopt individual strategies to increase the sustainability in their social environments [57]. First, organizations can properly assess the negative impact of an impoverished job design on employee attitudes and behaviors, which now seems to be underestimated. As the findings seem to support that some task characteristics—such as task significance, autonomy, and feedback—correlate with job satisfaction and OCB more strongly than others, organizations could redesign jobs to motivate older employees. As for HR managers, they could increase their efforts to enrich jobs to provide older workers with a more motivating environment, but also train them to critically identify deficits and actively engage in accumulating resources to cope with them. As a recent study showed, an organizational climate for successful aging is positively associated with relational civility and respect [12]. Hence, if the organizational climate is adequate for successful aging, better opportunities could be perceived by older employees, and these perceptions in turn would improve their satisfaction and OCB. Finally, the amount of time and opportunities that older workers perceive as remaining for them in their work future would impact their job satisfaction and OCB. Hence, depending on their personal aging experiences, workers could focus on developing some strategies more than others to minimize the negative impact of the physical and cognitive decline on their attitudes and behaviors. As SOC serve as moderators between task characteristics and outcomes, these strategies should be trained so that people can learn how to better choose their professional goals, optimize their action plans, and cope with their losses of resources.

5. Conclusions

To sum up, sustainable development should promote successful aging at work, as a means of progress toward the Millennium Development Goals [58], and as a way of promoting more general life satisfaction [59].

Author Contributions

A.S.-C. and G.T. conceptualized the study and choose the theoretical framework. A.S.-C. and J.-J.G.-O. collected the data and analyzed them. A.S.-C., J.-J.G.-O. and G.T. wrote the paper together, revising the manuscript several times.

Funding

This research received no external funding.

Conflicts of Interest

The authors declare no conflict of interest.

References

  1. Di Fabio, A.; Maree, J.G. Using a transdisciplinary interpretive lens to broaden reflections on alleviating poverty and promoting decent work. Front. Psychol. 2016, 7, 503. [Google Scholar] [CrossRef] [PubMed]
  2. Di Fabio, A. The psychology of sustainability and sustainable development for well-being in organizations. Front. Psychol. 2017, 8, 1534. [Google Scholar] [CrossRef] [PubMed]
  3. Di Fabio, A.; Kenny, M.E. Promoting well-being: The contribution of emotional intelligence. Front. Psychol. 2016, 7, 1182. [Google Scholar] [CrossRef] [PubMed]
  4. Di Fabio, A. Positive Healthy Organizations: Promoting well-being, meaningfulness, and sustainability in organizations. Front. Psychol. 2017, 8, 1938. [Google Scholar] [CrossRef] [PubMed]
  5. Maurer, T.J.; Chapman, E.F. Relationship of Proactive Personality with Life Satisfaction during Late Career and Early Retirement. J. Career Dev. 2017. [Google Scholar] [CrossRef]
  6. Di Fabio, A.; Gori, A. Assessing Workplace Relational Civility (WRC) with a new multidimensional “mirror” measure. Front. Psychol. 2016, 7, 890. [Google Scholar] [CrossRef] [PubMed]
  7. Lapalme, M.È.; Doucet, O.; Gill, A.; Simard, G. Can “Temps” Secure Future Employment? Investigating the Relationship between Proactive Behaviors and Employers’ Rehiring Decision. J. Career Dev. 2017, 44, 297–310. [Google Scholar] [CrossRef]
  8. Di Fabio, A.; Giannini, M.; Loscalzo, Y.; Palazzeschi, L.; Bucci, O.; Guazzini, A.; Gori, A. The challenge of fostering healthy organizations: An empirical study on the role of workplace relational civility in acceptance of change, and well-being. Front. Psychol. 2016, 7, 1748. [Google Scholar] [CrossRef] [PubMed]
  9. Dirik, H.F.; Intepeler, S.S. The work environment and empowerment as predictors of patient safety culture in Turkey. J. Nurs. Manag. 2017, 25, 256–265. [Google Scholar] [CrossRef] [PubMed]
  10. Goh, Y.-S.; López, V. Job satisfaction, work environment and intention to leave among migrant nurses working in a publicly funded tertiary hospital. J. Nurs. Manag. 2016, 24, 893–901. [Google Scholar] [CrossRef] [PubMed]
  11. Di Fabio, A.; Bucci, O. Green positive guidance and green positive life counseling for decent work and decent lives: Some empirical results. Front. Psychol. 2016. [Google Scholar] [CrossRef] [PubMed]
  12. Zacher, H.; Yang, J. Organizational climate for successful aging. Front. Psychol. 2016, 7, 1007. [Google Scholar] [CrossRef] [PubMed]
  13. Di Fabio, A.; Kenny, E.M. From decent work to decent lives: Positive Self and Relational Management (PS&RM) in the twenty-first century. Front. Psychol. 2016, 7, 361. [Google Scholar] [PubMed]
  14. Zacher, H.; Schmitt, A. Work characteristics and occupational well-being: The role of age. Front. Psychol. 2016, 7, 1411. [Google Scholar] [CrossRef] [PubMed]
  15. Di Fabio, A.; Peiró, J.M. Human Capital Sustainability Leadership to Promote Sustainable Development and Healthy Organizations: A New Scale. Sustainability 2018, 10, 2413. [Google Scholar] [CrossRef]
  16. Oldham, G.R.; Fried, Y. Job design research and theory: Past, present and future. Organ. Behav. Hum. Decis. Process. 2016, 136, 20–35. [Google Scholar] [CrossRef]
  17. Humphrey, S.E.; Nahrgang, J.D.; Morgeson, F.P. Integrating motivational, social, and contextual work design features: A meta-analytic summary and theoretical extension of the work design literature. J. Appl. Psychol. 2007, 92, 1332–1356. [Google Scholar] [CrossRef] [PubMed]
  18. Truxillo, D.M.; Cadiz, D.M.; Rineer, J.R.; Zaniboni, S.; Fraccaroli, F. A lifespan perspective on job design: Fitting the job and the worker to promote job satisfaction, engagement, and performance. Organ. Psychol. Rev. 2012, 2, 340–360. [Google Scholar] [CrossRef]
  19. Cheung, F.; Yeung, D.Y.; Wu, A.M. Occupational future time perspective and successful aging at work. J. Career Dev. 2017. [Google Scholar] [CrossRef]
  20. Fernández-Muñoz, J.; Topa, G. Older workers and affective job satisfaction: Gender invariance in Spain. Front. Psychol. 2018, 9, 930. [Google Scholar] [CrossRef] [PubMed]
  21. Dávila, M.C.; Finkelstein, M. Comportamiento de ciudadanía organizacional y bienestar. [Organizational citizenship behavior and well-being]. Int. J. Psychol. Psychol. Ther. 2016, 16, 35–48. [Google Scholar]
  22. Baltes, P.B.; Baltes, M.M. Psychological perspectives on successful aging: The model of selective optimization with compensation. In Successful Aging: Perspectives from the Behavioral Sciences; Baltes, P.B., Baltes, M.M., Eds.; Cambridge University Press: New York, NY, USA, 1990; pp. 1–34. [Google Scholar]
  23. Di Fabio, A.; Palazzeschi, L.; Bucci, O. In an unpredictable and changing environment: Intrapreneurial Self-Capital as a key resource for life satisfaction and flourishing. Front. Psychol. 2017, 8, 1819. [Google Scholar] [CrossRef] [PubMed]
  24. Moghimi, D.; Zacher, H.; Scheibe, S.; Van Yperen, N.W. The selection, optimization, and compensation model in the work context: A systematic review and meta-analysis of two decades of research. J. Organ. Behav. 2016, 38, 247–275. [Google Scholar] [CrossRef]
  25. Müller, A.; De Lange, A.; Weigl, M.; Oxfart, C.; Van der Heijden, B. Compensating losses in bridge employment? Examining relations between compensation strategies, health problems, and intention to remain at work. J. Vocat. Behav. 2013, 83, 68–77. [Google Scholar] [CrossRef]
  26. Müller, A.; Weigl, M. SOC Strategies and Organizational Citizenship Behaviors toward the Benefits of Co-workers: A Multi-Source Study. Front. Psychol. 2017, 8, 1740. [Google Scholar] [CrossRef] [PubMed]
  27. Shang, L.; Riedel, N.; Loerbroks, A.; Müller, A.; Wege, N.; Angerer, P.; Li, J. The association between effort-reward imbalance and depressive symptoms is modified by selection, optimization, and compensation strategy. J. Occup. Environ. Med. 2015, 57, 1222–1227. [Google Scholar] [CrossRef] [PubMed]
  28. Weigl, M.; Müller, A.; Hornung, S.; Zacher, H.; Angerer, P. The moderating effects of job control and selection, optimization, and compensation strategies on the age-work ability relationship. J. Organ. Behav. 2013, 34, 607–628. [Google Scholar] [CrossRef]
  29. Brienza, J.P.; Bobocel, D.R. Employee age alters the effects of justice on emotional exhaustion and organizational deviance. Front. Psychol. 2017, 8, 479. [Google Scholar] [CrossRef] [PubMed]
  30. Di Fabio, A.; Palazzeschi, L. Hedonic and eudaimonic well-being: The role of resilience beyond fluid intelligence and personality traits. Front. Psychol. 2015, 6, 1367. [Google Scholar] [CrossRef] [PubMed]
  31. Joshanloo, M.; Capone, V.; Petrillo, G.; Caso, D. Discriminant validity of hedonic, social, and psychological well-being in two Italian samples. Pers. Individ. Differ. 2017, 109, 23–27. [Google Scholar] [CrossRef]
  32. Podsakoff, P.M.; MacKenzie, S.B.; Lee, J.Y.; Podsakoff, N.P. Common method biases in behavioral research: A critical review of the literature and recommended remedies. J. Appl. Psychol. 2003, 88, 879. [Google Scholar] [CrossRef] [PubMed]
  33. Bayona, J.A.; Caballer, A.; Peiró, J.M. The Work Design Questionnaire: Spanish version and validation. J. Work Organ. Psychol. 2015, 31, 187–200. [Google Scholar] [CrossRef]
  34. Morgeson, F.P.; Humphrey, S.E. The Work Design Questionnaire (WDQ): Developing and validating a comprehensive measure for assessing job design and the nature of work. J. Appl. Psychol. 2006, 91, 1321–1339. [Google Scholar] [CrossRef] [PubMed]
  35. Segura-Camacho, A.; Rodríguez-Cifuentes, F.; Sáenz, L.; Topa, G. Successful aging at work: Psychometric properties of the Spanish version of the Selection, Optimization and Compensation Questionnaire. Front. Psychol. 2018, 9, 410. [Google Scholar] [CrossRef] [PubMed]
  36. Baltes, P.B.; Baltes, M.M.; Freund, A.M.; Lang, F.R. The Measurement of Selection, Optimization, and Compensation (SOC) by Self-Report: Technical Report; Max-Planck-Institut für Bildungsforschung: Berlin, Germany, 1999. [Google Scholar]
  37. Thompson, E.R.; Phua, F.T.T. A Brief Index of Affective Job Satisfaction. Group Organ. Manag. 2012, 37, 275–307. [Google Scholar] [CrossRef]
  38. Aranda, M.; Hurtado, M.D.; Topa, G. Breach of psychological contract and organizational citizenship behaviors in volunteerism: The mediator role of affect and the moderation of volunteers’ age. Volunt. Int. J. Volunt. Nonprofit Organ. 2018, 29, 59–70. [Google Scholar] [CrossRef]
  39. Fournier, G.; Zimmermann, H.; Masdonati, J.; Gauthier, C. Job loss in a group of older Canadian workers: Challenges in the sustainable labour market reintegration process. Sustainability 2018, 10, 2245. [Google Scholar] [CrossRef]
  40. Vallejo-Sánchez, B.; Pérez-García, A.M. Estrés vital: Variables psicológicas y sociodemográficas predictoras del malestar emocional [Life Stress: Psychological and socio-demographic variables as predictors of emotional distress]. Acción Psicol. 2016, 13, 159–178. [Google Scholar] [CrossRef]
  41. Budowski, M.; Schief, S.; Sieber, R. Precariousness and quality of life—A qualitative perspective on quality of life of households in precarious prosperity in Switzerland and Spain. Appl. Res. Qual. Life 2016, 11, 1035–1058. [Google Scholar] [CrossRef]
  42. Segura-Camacho, A.; Topa, G. Identificación con los trabajadores mayores y absentismo: Moderación de la Selección, Optimización y Compensación. [Identification with older workers and absenteeism: Moderation of Selection, Optimization and Compensation]. Acción Psicol. 2016, 13, 169–188. [Google Scholar] [CrossRef]
  43. Topa, G.; Depolo, M.; Alcover, C.-M. Early retirement: A meta-analysis of its antecedent and subsequent correlates. Front. Psychol. 2018, 8, 2157. [Google Scholar] [CrossRef] [PubMed]
  44. Schmitt, A.; Zacher, H.; Frese, M. The buffering effect of selection, optimization, and compensation strategy use on the relationship between problem-solving demands and occupational well-being: A daily diary study. J. Occup. Health Psychol. 2012, 17, 139–149. [Google Scholar] [CrossRef] [PubMed]
  45. Navascués, A.N.; Medel, D.C.; Martín, A.B. Efectos del bienestar subjetivo y psicológico en los resultados terapéuticos de un hospital de día [Effects of subjective and psychological well-being on the therapeutic outcomes at a day hospital]. Acción Psicol. 2016, 13, 143–166. [Google Scholar] [CrossRef]
  46. Armenta, B.M.; Stroebe, K.; Scheibe, S.; Postmes, T.; Van Yperen, N.W. Feeling younger and identifying with older adults: Testing two routes to maintaining well-being in the face of age discrimination. PLoS ONE 2017, 12, e0187805. [Google Scholar] [CrossRef] [PubMed]
  47. Maher, A.C.; Kielb, S.; Loyer, E.; Connelley, M.; Rademaker, A.; Mesulam, M.-M.; Weintraub, S.; McAdams, D.; Logan, R.; Rogalski, E. Psychological well-being in elderly adults with extraordinary episodic memory. PLoS ONE 2017, 12, e0186413. [Google Scholar]
  48. Albieri, D.; Salvagioni, J.; Nesello, F.; Eumann, A.; Durán, A.; Lopes, F.; Maffei, S. Physical, psychological and occupational consequences of job burnout: A systematic review of prospective studies. PLoS ONE 2017, 12, e0185781. [Google Scholar]
  49. Du, H.; King, R.B.; Chi, P. Self-esteem and subjective well-being revisited: The roles of personal, relational, and collective self-esteem. PLoS ONE 2017, 12, e0183958. [Google Scholar] [CrossRef] [PubMed]
  50. Pecino-Medina, V.; Díaz-Fúnez, P.A.; Mañas-Rodríguez, M.A. Climate, stress and satisfaction: A multilevel study in the public sector/Clima, estrés y satisfacción: UN estudio multinivel en el sector público. Int. J. Soc. Psychol. 2017, 32, 52–79. [Google Scholar] [CrossRef]
  51. Palmer, J.C.; Komarraju, M.; Carter, M.Z.; Karau, S.J. Angel on one shoulder: Can perceived organizational support moderate the relationship between the Dark Triad traits and counterproductive work behavior? Pers. Individ. Differ. 2017, 110, 31–37. [Google Scholar] [CrossRef]
  52. Lavy, S.; Littman-Ovadia, H. My better self: Using strengths at work and work productivity, organizational citizenship behavior, and satisfaction. J. Career Dev. 2017, 44, 95–109. [Google Scholar] [CrossRef]
  53. Cheung, F.; Wu, A.M.; Yeung, D.Y. Factors Associated with Work Volition among Aging Workers in Hong Kong. J. Career Dev. 2016, 43, 160–176. [Google Scholar] [CrossRef]
  54. Singh, P.; Govil, D.; Kumar, V.; Kumar, J. Cognitive impairment and quality of life among elderly in India. Appl. Res. Qual. Life 2017, 12, 963–979. [Google Scholar] [CrossRef]
  55. Gärtner, L.U.; Hertel, G. Future Time Perspective in Occupational Teams: Do Older Workers Prefer More Familiar Teams? Front. Psychol. 2017, 8, 1639. [Google Scholar] [CrossRef] [PubMed]
  56. Gray, L. The importance of post hoc approaches for overcoming non-response and attrition bias in population-sampled studies. Soc. Psychiatry Psychiatr. Epidemiol. 2016, 51, 155–157. [Google Scholar] [CrossRef] [PubMed]
  57. Sirgy, M.J.; Lee, D.-J. Work-life balance: A quality-of-life model. Appl. Res. Qual. Life 2016, 11, 1059–1082. [Google Scholar] [CrossRef]
  58. Martín, J.A.R.; Martín, J.M.M.; Aguilera, D.J. A Synthetic Indicator of Progress towards the Millennium Development Goals 2, 3 and 4 in the Least Developed Countries (LDCs) of Asia. Appl. Res. Qual. Life 2018, 13, 1–19. [Google Scholar] [CrossRef]
  59. Hart, E.A.C.; Lakerveld, J.; McKee, M.; Oppert, J.M.; Rutter, H.; Charreire, H.; Veenhoven, R.; Bárdos, H.; Compernolle, S.; De Bourdeaudhuij, I.; et al. Contextual correlates of happiness in European adults. PLoS ONE 2018, 13, e0190387. [Google Scholar] [CrossRef] [PubMed]
Figure 1. Two-way interaction between Task Significance and Selection, Optimization, and Compensation (SOC) (Optimization) in predicting Job Satisfaction.
Sustainability 10 03411 g001
Figure 2. Two-way interaction between Task Variety and SOC (Optimization) in predicting Job Satisfaction.
Sustainability 10 03411 g002
Figure 3. Two-way interaction between Work Method Autonomy and SOC (Optimization) in predicting Job Satisfaction.
Sustainability 10 03411 g003
Figure 4. Two-way interaction between Feedback from Job and SOC (Optimization) in predicting Job Satisfaction.
Sustainability 10 03411 g004
Figure 5. Two-way interaction between Task Significance and SOC (Optimization) in predicting OCB.
Sustainability 10 03411 g005
Figure 6. Two-way interaction between Task Variety and SOC (Optimization) in predicting OCB.
Sustainability 10 03411 g006
Figure 7. Two-way interaction between Task Variety and SOC (Compensation) in predicting OCB.
Sustainability 10 03411 g007
Table 1. Descriptive Statistics and Correlation Matrix (N = 183).
Variables MSD12345678910111213141516
1. Age (years)50.022.8
2. Gender--0.056
3. Organizational Tenure (years)20.49.300.266 **−0.107
4. Education--−0.0660.0940.018
5. Organizational Position--0.0970.249 **−0.038−0.116
6. Type of Contract −0.0160.080−0.436 **−0.0560.219 **
7. Task Variety2.900.83−0.0370.111−0.246 **−0.0570.0330.1440.761
8. Task Significance3.150.790.0300.084−0.0420.178 *0.241 **−0.0460.287 **0.83
9. Work Method Autonomy3.220.94−0.1280.023−0.0700.1160.228 **−0.0510.232 **0.340 **0.91
10. Feedback from the Job3.320.71−0.0980.136−0.0610.0030.039−0.083−0.0230.246 **0.350 **0.87
11. SOC Elective Selection 3.310.56−0.003−0.068−0.0850.0100.102−0.036−0.150−0.0720.0520.147 *0.70
12. SOC Loss-Based Selection3.430.59−0.0360.071−0.0630.0760.1130.019−0.008−0.0250.0690.0530.425 **0.81
13. SOC Optimization3.670.74−0.1190.104−0.0450.005−0.013−0.0320.0780.153 *0.150 *0.171 *0.390 **0.273 **0.81
14. SOC Compensation3.580.53−0.1310.131−0.0720.028−0.036−0.0560.0170.1520.224 **0.267 **0.452 **0.499 **0.534 **0.79
15. Job Satisfaction3.130.92−0.0780.042−0.0360.100−0.114−0.0950.0070.445 **0.438 **0.530 **0.179 *0.0360.152 *0.320 **0.80
16. OCB3.350.67−0.0450.0070.0780.075−0.134−0.211 **0.174 *0.392 **0.445 **0.364 **0.195 *0.161 *0.303 **0.371 **0.541 **0.82
1 Note: Values in italics on the diagonal are Cronbach’s alphas. Gender: 1 = Male; 2 = Female; Education: 1 = Primary education; 2 = Secondary education or courses oriented to a specific profession; 3 = University degree, Master or PhD; Organizational position: 1 = non-qualified employees; 2 = qualified employees; 3 = middle managers; and 4 = managers; Type of contract: 1 = part-time; 2 = full time. ** p < 0.01. * p < 0.05. OCB: organizational citizenship behaviors.
Table 2. Results of Regression of Task Significance and Optimization on Job Satisfaction.
Variable Outcome: Job Satisfaction
B 1SEt95% LLCI95% ULCIR2
Control variables
Age−0.00520.0251−0.2196−0.00530.0442
Gender0.10770.14090.7641−0.17050.3858
Organizational Tenure−0.00220.0086−0.2538−0.01910.0148
Education0.05720.05591.0248−0.01910.0148
Organizational Position−0.11760.0786−1.4958−0.05300.1675
Type of Contract−0.29060.2532−1.1477−0.27280.0376
Independent variable
Task Significance 1.7662 **0.46703.78160.84442.3140
Moderator variable
Optimization1.5630 **0.38054.10810.81202.3140
Interaction term
Task Significance × Optimization−0.4553 **0.1205−3.7787−0.6931−0.2175
∆R2 interaction term [F(173,1) = 14.27] 0.0720 **
Total R2 [F(173,9) = 2.82] 0.1282 **
1 Unstandardized coefficients (B). LLCI: Lower level Confidence interval; ULCI: Upper level Confidence interval; N = 183. * p < 0.05. ** p < 0.01.
Table 3. Results of Regression of Task Variety and Optimization on Job Satisfaction.
Variable Outcome: Job Satisfaction
B 1SEt95% LLCI95% ULCIR2
Control variables
Age−0.00560.0254−0.2191−0.05580.0446
Gender0.11300.14270.7920−0.16860.3946
Organizational Tenure−0.00480.0085−0.5593−0.02160.0121
Education0.06620.05651.1722−0.04530.1778
Organizational Position−0.12030.0794−1.5160−0.27690.0363
Type of Contract−0.31990.2558−1.2505−0.82490.1850
Independent variables
Task Variety1.5425 **0.47343.25870.60822.4768
Moderator variable
Optimization1.4418 **0.39163.68150.66882.2148
Interaction term
Task Variety × Optimization−0.4094 **0.1227−3.3362−0.6516−0.1672
∆R2 interaction term [F(173,1) = 11.13] 0.0571 **
Total R2 [F(173,9) = 2.44] 0.1127 *
1 Unstandardized coefficients (B). LLCI: Lower level Confidence interval; ULCI: Upper level Confidence interval; N = 183. * p < 0.05. ** p < 0.01.
Table 4. Results of Regression of Task Autonomy and Optimization on Job Satisfaction.
Variable Outcome: Job Satisfaction
B 1SEt95% LLCI95% ULCIR2
Control variables
Age0.00180.02340.0784−0.04430.0480
Gender0.02350.13130.1792−0.23560.2827
Organizational Tenure−0.00160.0078−0.2018−0.01700.0138
Education0.02300.05240.4398−0.08040.1264
Organizational Position−0.01630.0748−0.2173−0.16400.1315
Type of Contract−0.23870.2374−1.0056−0.70730.2298
Independent variables
Task Autonomy1.3062 **0.39623.29690.52432.0882
Moderator variable
Optimization0.8578 *0.33842.53470.18991.5257
Interaction term
Task Autonomy × Optimization−0.2470 *0.1072−2.3046−0.4585−0.0355
∆R2 interaction term [F(174,1) = 5.31] 0.0234 *
Total R2 [F(174,9) = 5.83] 0.2319 **
1 Unstandardized coefficients (B). LLCI: Lower level Confidence interval; ULCI: Upper level Confidence interval; N = 183. * p < 0.05. ** p < 0.01.
Table 5. Results of Regression of Feedback from the Job and Optimization on Job Satisfaction.
Variable Outcome: Job Satisfaction
B 1SEt95% LLCI95% ULCIR2
Control variables
Age0.00140.02190.0626−0.04190.0446
Gender−0.08890.1250−0.7113−0.33550.1578
Organizational Tenure0.00020.0074.0236−0.01440.0148
Education0.06350.04891.2987−0.03300.1599
Organizational Position−0.07830.0687−1.1406−0.21390.0572
Type of Contract−0.00480.2288−0.0211−0.45650.4468
Independent variables
Feedback from the Job1.6014 **0.41633.84660.77972.4231
Moderator variable
Optimization0.9545 *0.39222.43350.18031.7287
Interaction term
Feedback from the Job × Optimization−0.2609 *0.1143−2.2825−0.4864−0.0353
∆R2 interaction term [F(173,1) = 5.20] 0.0204 *
Total R2 [F(173,9) = 9.21] 0.3241 **
1 Unstandardized coefficients (B). LLCI: Lower level Confidence interval; ULCI: Upper level Confidence interval; N = 183. * p < 0.05. ** p < 0.01.
Table 6. Results of Regression of Task Significance and Optimization on OCB.
Variable Outcome: OCB
B 1SEt95% LLCI95% ULCIR2
Control variables
Age−0.00430.0169−0.2551−0.03770.0290
Gender−0.04820.0945−0.5099−0.23480.1384
Organizational Tenure0.00320.00550.5684−0.00780.0141
Education−0.00220.0376−0.0575−0.07630.0720
Organizational Position−0.00460.0562−0.0814−0.11550.1063
Type of Contract−0.3884 *0.1694−2.2930−0.7227−0.0541
Independent variables
Task Significance0.8997 **0.29133.08860.32481.4747
Moderator variable
Optimization0.75370.26182.87920.23711.2704
Interaction term
Task Significance × Optimization−0.16500.0789−2.0907−0.3207−0.0092
∆R2 interaction term [F(173,1) = 4.37] 0.0183 **
Total R2 [F(173,9) = 7.14] 0.2698 *
1 Unstandardized coefficients (B). LLCI: Lower level Confidence interval; ULCI: Upper level Confidence interval; N = 183. * p < 0.05. ** p < 0.01.
Table 7. Results of Regression of Task Variety and Optimization on OCB.
Variable Outcome: OCB
B 1SEt95% LLCI95% ULCIR2
Control variables
Age0.00440.01720.2558−0.02950.0383
Gender0.00700.09650.0727−0.18340.1974
Organizational Tenure0.00520.00580.8977−0.00620.0166
Education0.04280.03821.1206−0.03260.1182
Organizational Position−0.09930.0537−1.8513−0.20520.0066
Type of Contract−0.4164 *0.1730−2.4073−0.7578−0.0750
Independent variables
Task Variety1.3060 **0.32004.08090.67431.9377
Moderator variable
Optimization1.2006 **0.26484.53440.67801.7232
Interaction term
Task Variety × Optimization−0.3028 **0.0830−3.6493−0.4665−0.1390
∆R2 interaction term [F(176,1) = 10.39] 0.0482 *
Total R2 [F(176,6) = 6.58] 0.1834 **
1 Unstandardized coefficients (B). LLCI: Lower level Confidence interval; ULCI: Upper level Confidence interval; N = 183. * p < 0.05. ** p < 0.01.
Table 8. Results of Regression of Task Variety and Compensation on OCB.
Variable Outcome: OCB
B 1SEt95% LLCI95% ULCIR2
Control variables
Age0.00330.01690.1937−0.03010.0367
Gender−0.06120.0958−0.6390−0.25020.1278
Organizational Tenure0.00680.00571.1854−0.00450.0181
Education0.04310.03781.1400−0.03150.1178
Organizational Position−0.07130.0528−1.3500−0.17560.0330
Type of Contract−0.36580.1711−2.1376−0.7036−0.0280
Independent variables
Task Variety1.09800.37792.90590.35221.8438
Moderator variable
Compensation1.16600.29563.94470.58261.7495
Interaction term
Task Variety × Compensation−0.25170.1019−2.4713−0.4528−0.0507
∆R2 interaction term [F(173,1) = 6.10] 0.0260 *
Total R2 [F(173,9) =6.83] 0.2624 **
1 Unstandardized coefficients (B). LLCI: Lower level Confidence interval; ULCI: Upper level Confidence interval; N = 183. * p < 0.05. ** p < 0.01.

