Article

Effect of Pre-Determined Maintenance Repair Rates on the Health Index State Distribution and Performance Condition Curve Based on the Markov Prediction Model for Sustainable Transformers Asset Management Strategies

by
Muhammad Sharil Yahaya
1,2,*,
Norhafiz Azis
1,3,*,
Amran Mohd Selva
1,
Mohd Zainal Abidin Ab Kadir
1,4,
Jasronita Jasni
1,
Mohd Hendra Hairi
5,
Young Zaidey Yang Ghazali
6 and
Mohd Aizam Talib
7
1
Centre for Electromagnetic and Lightning Protection, Universiti Putra Malaysia, 43400 Serdang, Selangor, Malaysia
2
Faculty of Engineering Technology, Universiti Teknikal Malaysia Melaka, 76100 Durian Tunggal, Melaka, Malaysia
3
Institute of Advanced Technology (ITMA), Universiti Putra Malaysia, 43400 Serdang, Selangor, Malaysia
4
Institute of Power Engineering (IPE), Universiti Tenaga Nasional, 43000 Kajang, Selangor, Malaysia
5
Faculty of Electrical Engineering, Universiti Teknikal Malaysia Melaka, 76100 Durian Tunggal, Melaka, Malaysia
6
Distribution Division, Tenaga Nasional Berhad, Wisma TNB, Jalan Timur, 46200 Petaling Jaya, Selangor, Malaysia
7
TNB Research Sdn. Bhd., No. 1, Lorong Ayer Itam, Kawasan Institut Penyelidikan, 43000 Kajang, Selangor, Malaysia
*
Authors to whom correspondence should be addressed.
Sustainability 2018, 10(10), 3399; https://doi.org/10.3390/su10103399
Submission received: 9 August 2018 / Revised: 17 August 2018 / Accepted: 23 August 2018 / Published: 25 September 2018
(This article belongs to the Section Sustainable Engineering and Science)

Abstract

:
This paper presents an investigation of the condition state distribution and performance condition curve of the transformer population under different pre-determined maintenance repair rates based on the Markov Prediction Model (MPM). In total, 3195 oil samples from 373 transformers with an age between one and 25 years were tested. The previously computed Health Index (HI) prediction model of the transformer population based on MPM utilizing the nonlinear minimization technique was employed in this study. The transition probabilities for each of the states were updated based on 10%, 20% and 30% pre-determined maintenance repair rates for the sensitivity study. Next, the HI state distribution and performance condition curve were analyzed based on the Markov chain algorithm. Based on the case study, it is found that the pre-determined maintenance repair rates can affect the HI state distribution and improve the performance condition curve. The 30% pre-determined maintenance repair rate gives the highest impact, especially for the transformer population at state 4 (poor). Overall, the average percentage of change for all HI state distributions is 16.48%. A clear improvement of HI state distribution is found at state 4 (poor) where the highest percentage can be up to 63.25%.

1. Introduction

Asset management and maintenance strategies have become important aspects of the electrical utility for a sustainable operation. It is a structural process used to guide the operation, maintenance, replacement, and disposal of assets [1]. The majority of electrical utilities are now adopting Condition Based Management (CBM) in order to optimize the management of the transformers asset. One of the key components in CBM is the future assessment of transformers which could assist utilities for asset management activities such as maintenance, repair, and replacement [1,2]. A previous study has shown that the life of transformers can be extended through optimal asset management strategies [3]. By maximizing the performance of the asset and optimizing the maintenance action, the maintenance operational cost can be reduced [2,4]. The asset can operate at an optimum level through prioritization of the equipment for maintenance, repair, or replacement based on condition and budget [2,3,4]. The Health Index (HI) is known as one of the key components in the CBM and has been adopted by most of the current utilities in the world [5,6,7,8,9,10]. HI provides a comprehensive assessment on transformers based on multiple parameters and has been considered as one of the important tools for diagnostic and condition monitoring techniques [11,12]. HI is mainly used to determine the current state of transformers. Currently, the application of HI to determine the future states of transformers and the impact of different types of management strategies on the state distribution of the asset is yet to be explored. Most of the studies on the prediction of transformers’ future states are based on the paper ageing model and statistical failure analyses [13,14,15,16,17,18,19]. There are only a few studies that have been carried out to estimate the transformers’ future states based on MPM [20]. The studies on the future state prediction of asset based on MPM have been mainly carried out in civil engineering [21,22,23,24,25,26]. MPM utilizes the condition parameters data and has been used to determine the decision for maintenance, repair, and replacement [26,27,28,29,30,31]. MPM is used to minimize the prediction issues related to the overreliance on simple mathematical fitting techniques [32,33]. In addition, the dependency on the failure data for the computation is also minimized for MPM [17,18,19,34]. The application of MPM based on transformer population condition data was considered an innovative approach to predict the future deterioration states [20]. MPM can also be used to examine the effect of maintenance, repair, and replacement on the state distribution of the asset [26,29,31]. Updated MPM with dedicated management strategies that can be represented by the intentional pre-determined maintenance repair rate could assist utilities to plan and forecast the effectiveness of the intervention actions [31]. The aim of this paper is to investigate the effect of pre-determined maintenance repair rates by MPM on the HI state distribution and performance condition curve of the transformer population. The previous oil condition monitoring data from 373 distribution transformers with ratings of 33 kV and 30 MVA are tested [20]. The current study is a continuation of a previous study in [20], whereby the state distribution and performance condition curve of the transformer population with and without pre-determined maintenance repair rates are compared and analyzed.

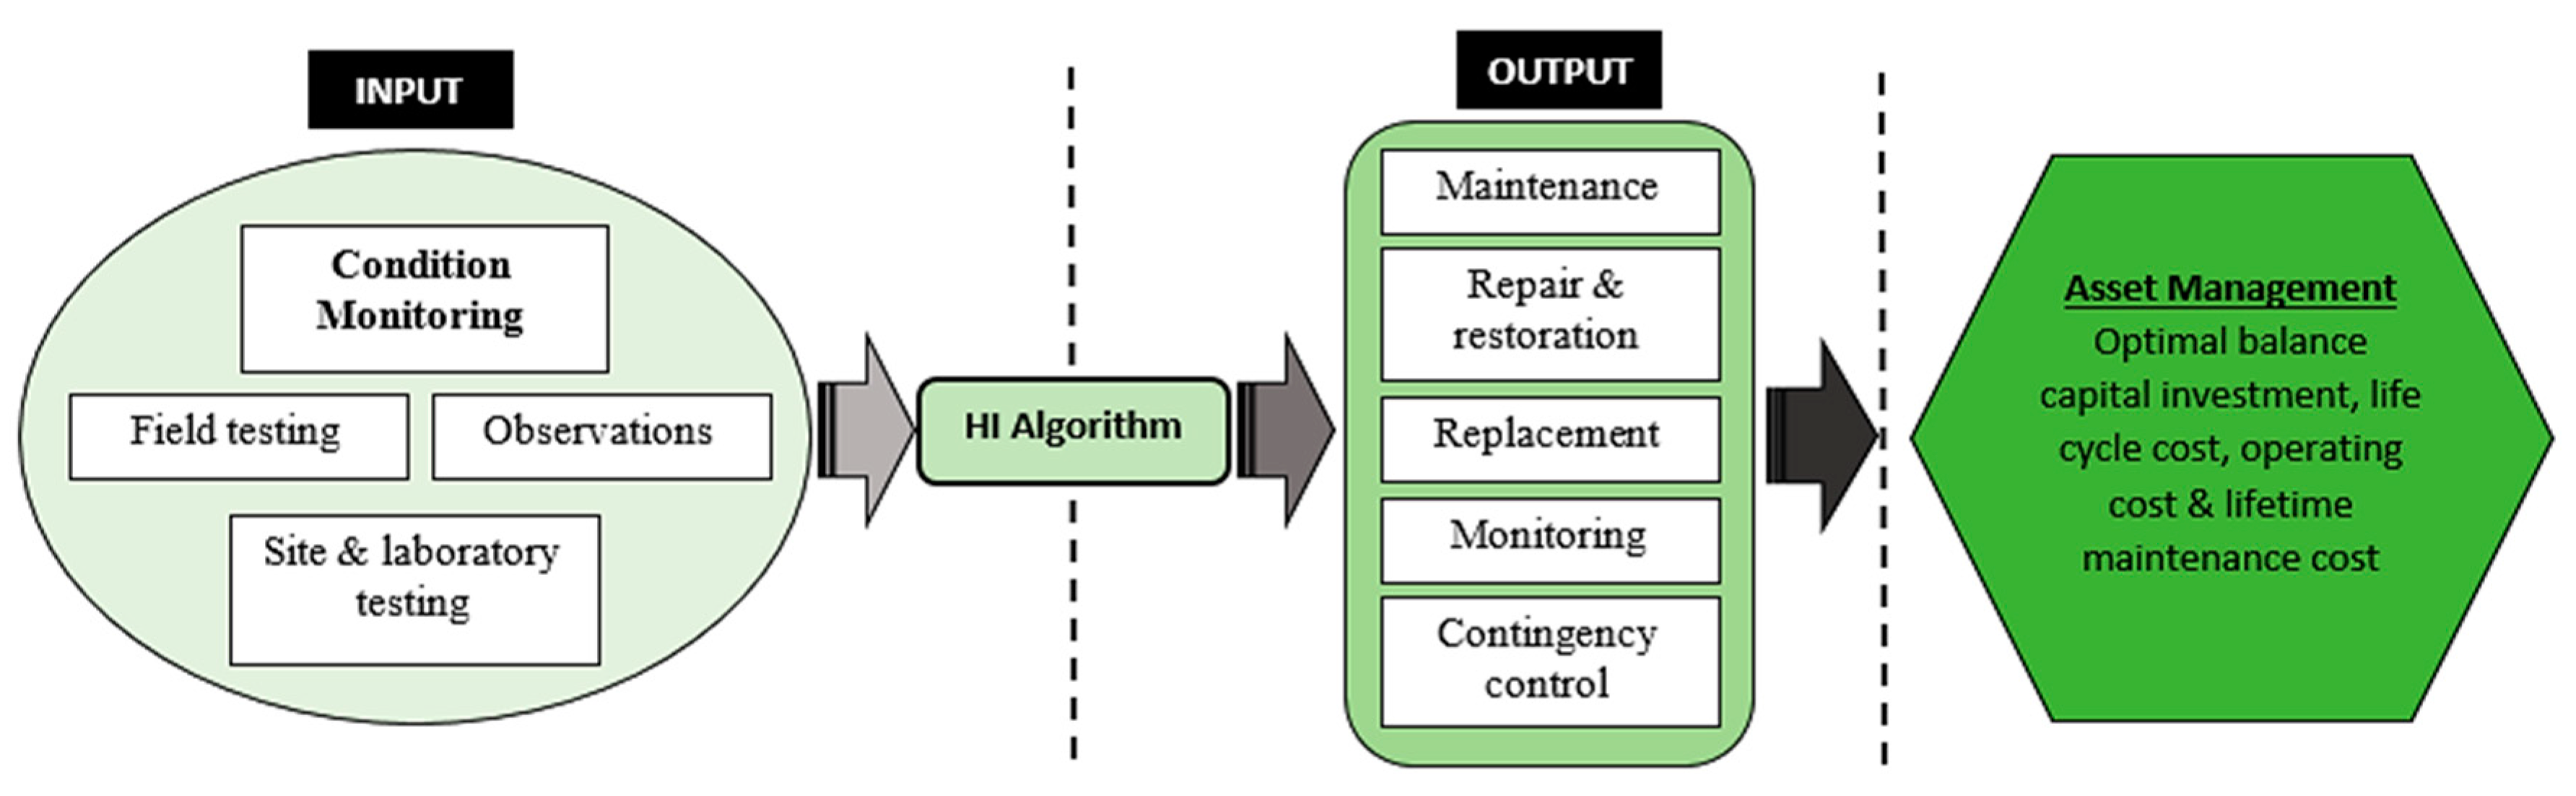
2. Health Index (HI) and Asset Management Strategy

Transformers can be subjected to electrical, mechanical, and chemical stresses that could reduce their reliability in-service [11,15]. Maintenance is essential to ensure that transformers operate at an optimum level [35]. The challenge for utilities nowadays is not only to monitor the condition of transformers, but also to identify the optimum maintenance strategies for the sustainable development of power system networks. It is known that maintenance is one of the pillars that support the asset management framework [36]. It is defined as all actions appropriate for retaining an item/part/equipment in, or restoring it to, a given condition [37]. The maintenance action for transformers can be divided into three schemes [35]. The first scheme is the condition assessment or basic maintenance. It includes regular maintenance plans such as Time-Based Condition Monitoring (TBCM), Condition-Based Monitoring (CBM), On-Line Condition Monitoring (OLCM) and Time-Based Maintenance (TBM). These maintenance schemes are normally performed for transformers with a higher/good condition state. The second scheme is applied for transformers with a middle/moderate condition state and maintenance action consists of minor work known as Corrective Maintenance (CM). The action is carried out to restore certain parts of transformers which have failed or degraded. The third scheme is for transformers with a lower/bad condition state. The maintenance action is the replacement or refurbishment of a major part of the transformers’ components such as windings, bushings, and tap changers. Principally, these maintenance actions are carried out based on the condition monitoring data, observations, and expert judgement. HI is normally used to assess the overall condition of transformers. HI is defined by [38] as an approach to quantify the condition monitoring information for the purpose of asset management. In [5,9,35,39], HI is also used as an indicator for transformers’ maintenance, repair, and replacement. Figure 1 illustrates the linkages between the HI concept and action plan for the asset management purpose [40].
There are several HI models for transformers that have been developed by previous researchers and practitioners [10,40,41]. Most of the HI mathematical formulations adopt a scoring system and it is used by most of the utilities due to the ease of use. Based on HI, the states of transformers can be categorized into several discrete groups. The maintenance action can be defined based on these groups, as seen in Table 1 [5,39]. In this study, the HI of transformers was categorized based on the maintenance action proposed in Table 1 [5,39].

3. Updating Markov Prediction Model (MPM)

MPM is a dynamic stochastic probabilistic approach that is capable of predicting the future condition state of transformers [20,42]. MPM has been widely applied to model the deterioration of different types of equipment [21,22,23,24,25,26,27,28]. It is also capable of simulating the effect of maintenance on the equipment by updating the MPM transition matrices with any pre-determined repair rate pre-defined by utilities based on their asset maintenance strategy [26,29,31]. In this study, the MPM for transformers was determined based on several assumptions. The first assumption is that the degradation of the transformer under study is a monotonic process and the condition will end up at the final state. The second assumption is that the transformer undergoes normal ageing and remains in one state for each time interval. The assumptions were translated into the transition probabilities, given as Pij [20,21,22,23]. Pij is the probability of equipment decaying from state i to j in a specific time interval. The transition probabilities were computed through the condition monitoring data based on the nonlinear optimization technique. A set of transition probabilities was represented in the form of transition matrix, P. The transition matrix without the pre-determined repair rate is shown in Equation (1).
  P = [ P 11   1 P 11 0 0 0 0 P 22 1 P 22 0 0 0 0 P 33 1 P 33 0 0 0 0 P 44 1 P 44 0 0 0 0 1 ]
The MPM and performance condition curve of the transformers population were determined based on [21,22,23,24,25,26,27,28,30]. In this study, several specific pre-determined maintenance repair rates were introduced to update the transition probabilities in transition matrices. In this study, these rates are artificially chosen in order to examine the impact on the health index state distribution and performance condition curve. These rates, however, can be carefully chosen by utilities based on historical database assessment and maintenance budget schemes. The updated transition matrices, PM, with a pre-determined repair rate, can be seen in Equation (2). Prepair rate can be introduced at any condition state.
  P M = [ P 11   1 P 11 0 0 0 P repair   rate ( 1 P repair   rate ) * P 22 ( 1 P repair   rate ) * 1 P 22 0 0 0 0 P 33 1 P 33 0 0 0 0 P 44 1 P 44 0 0 0 0 1 ]
The maintenance repair rate for any equipment can be obtained through several approaches. It can be obtained through a global conservation survey, population conservation investigation, examination of individual equipment behavior, budget, and policy of the utilities. A previous study in [31] implemented a 10% and 20% repair policy to simulate the future risk and maintenance cost of a bridge population. While, the actual repair rate from a conservation investigation was used by [26] to predict their bridge components’ deterioration. Since there is a limitation on the maintenance record of the population of transformers data under study, multiple pre-determined maintenance repair rates of 10% (0.1), 20% (0.2), and 30% (0.3) were assigned at each state for sensitivity study purposes. This rate was chosen to simulate the impact of updated MPM. The rate can affect the current state of transformers, whereby it moves to the inferior state. An example of an updated MPM transition matrix with a pre-determined maintenance repair rate 0.1 at state 3 (fair) can be seen in Equation (3).
  P M = [ P 11   1 P 11 0 0 0 0 P 22 1 P 22 0 0 0 0.1 0.9 * P 33 0.9 * ( 1 P 33 ) 0 0 0 0 P 44 1 P 44 0 0 0 0 1 ]
Equation (3) shows that the distribution of a population at (fair) state (P33 and 1-P33) will move to the (good) state (P32) by 10% at each interval (t). Once the transition matrix is updated, the state distribution and performance condition curve can be examined. The distribution of transformer population, D, can be simulated based on Markov chain iteration formulation, as shown in Equation (4).
  D ( t + 1   ) = D ( t ) × P M
The performance condition curve, HI, can be simulated based on Equation (5).
  HI   ( t + 1 ) = HI ( t ) × P M × R T
Where D(t+1) and HI(t+1) are the next conditions at the specific interval, D(t) and H(t) are the current conditions, PM is the updated transition matrix, and RT is the matrix of the discrete HI condition state scale where R = [100 84 69 49 29]. In this paper, the MPM that has been computed in a prior study was tested to investigate the impact of maintenance, repair, and replacement [20].

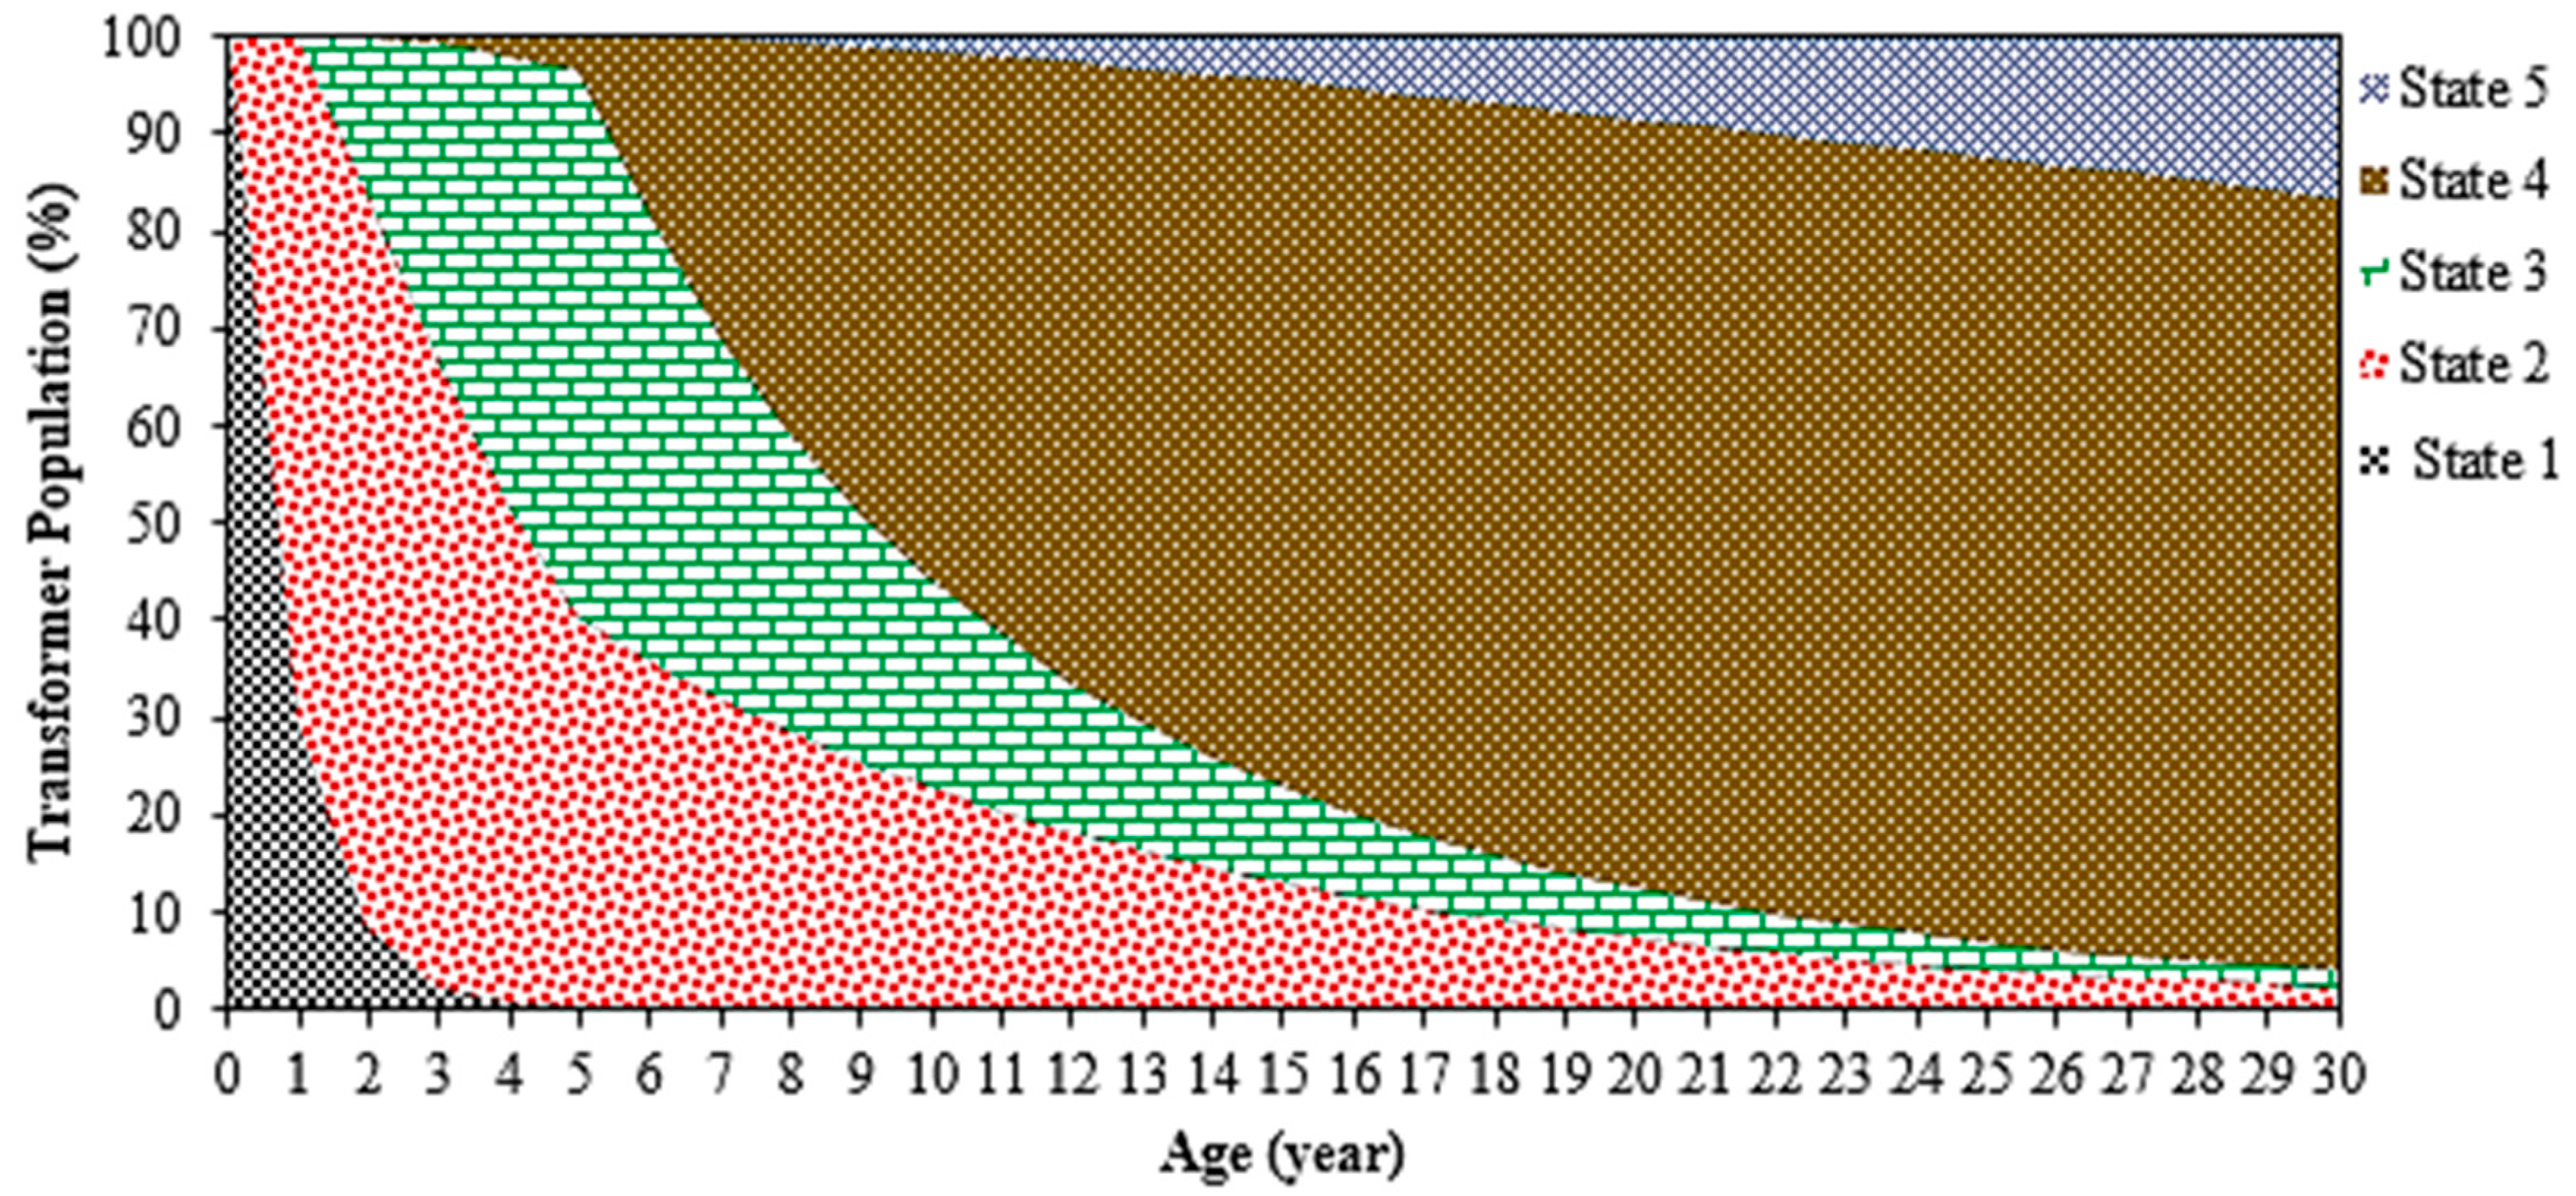
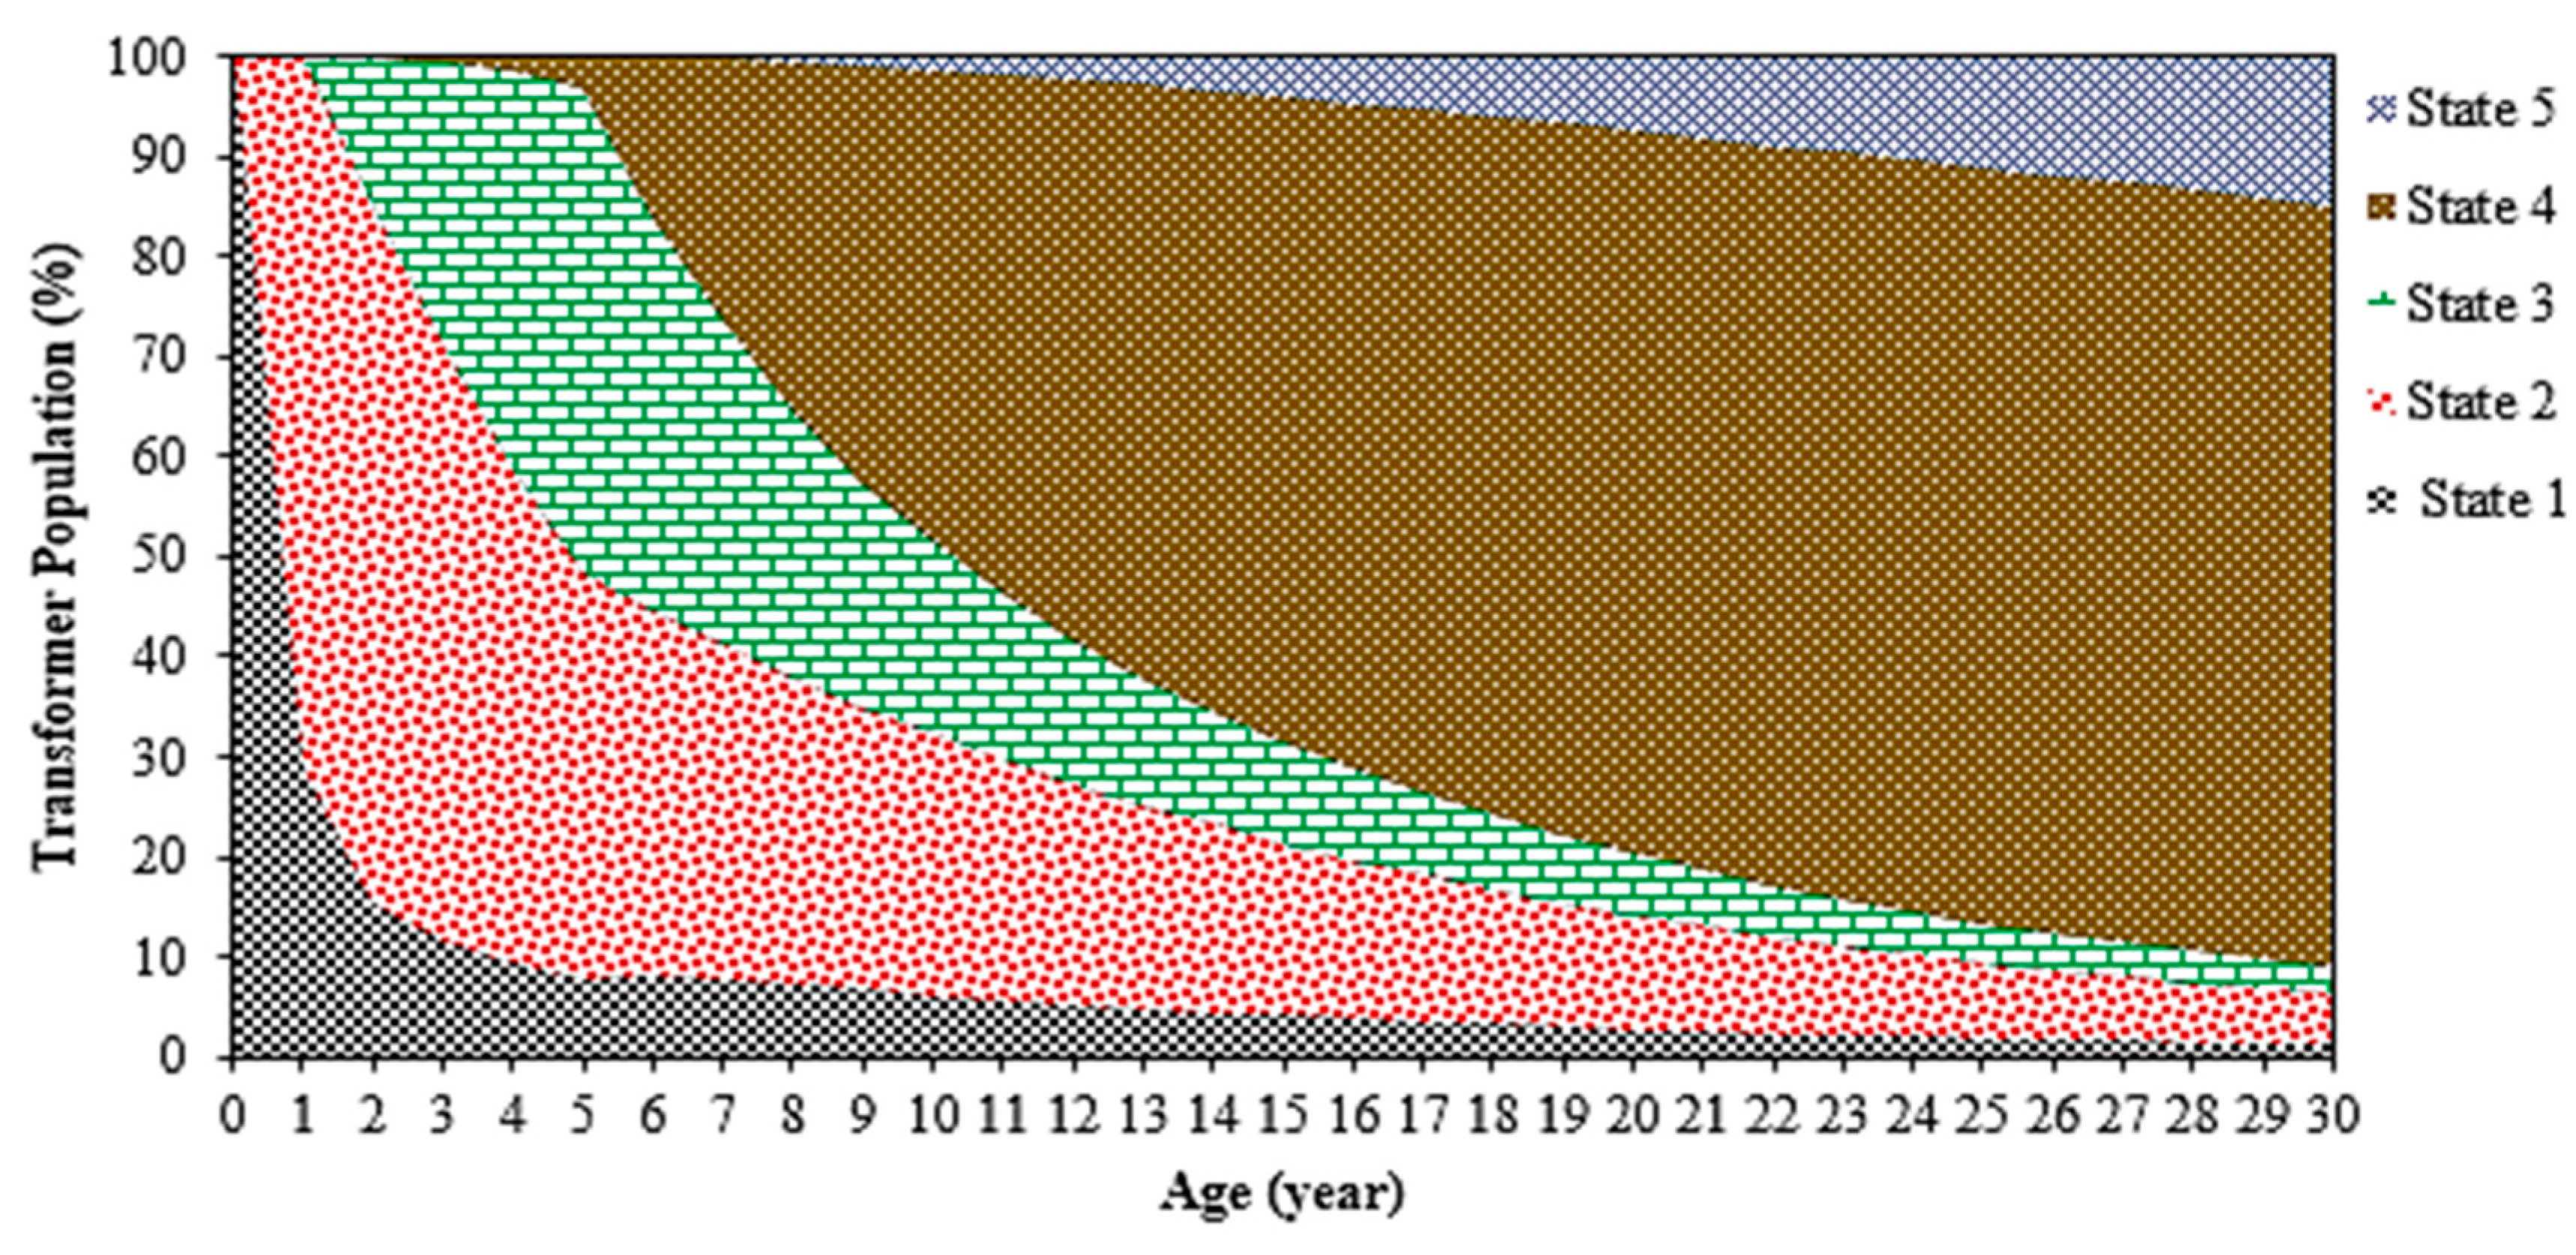
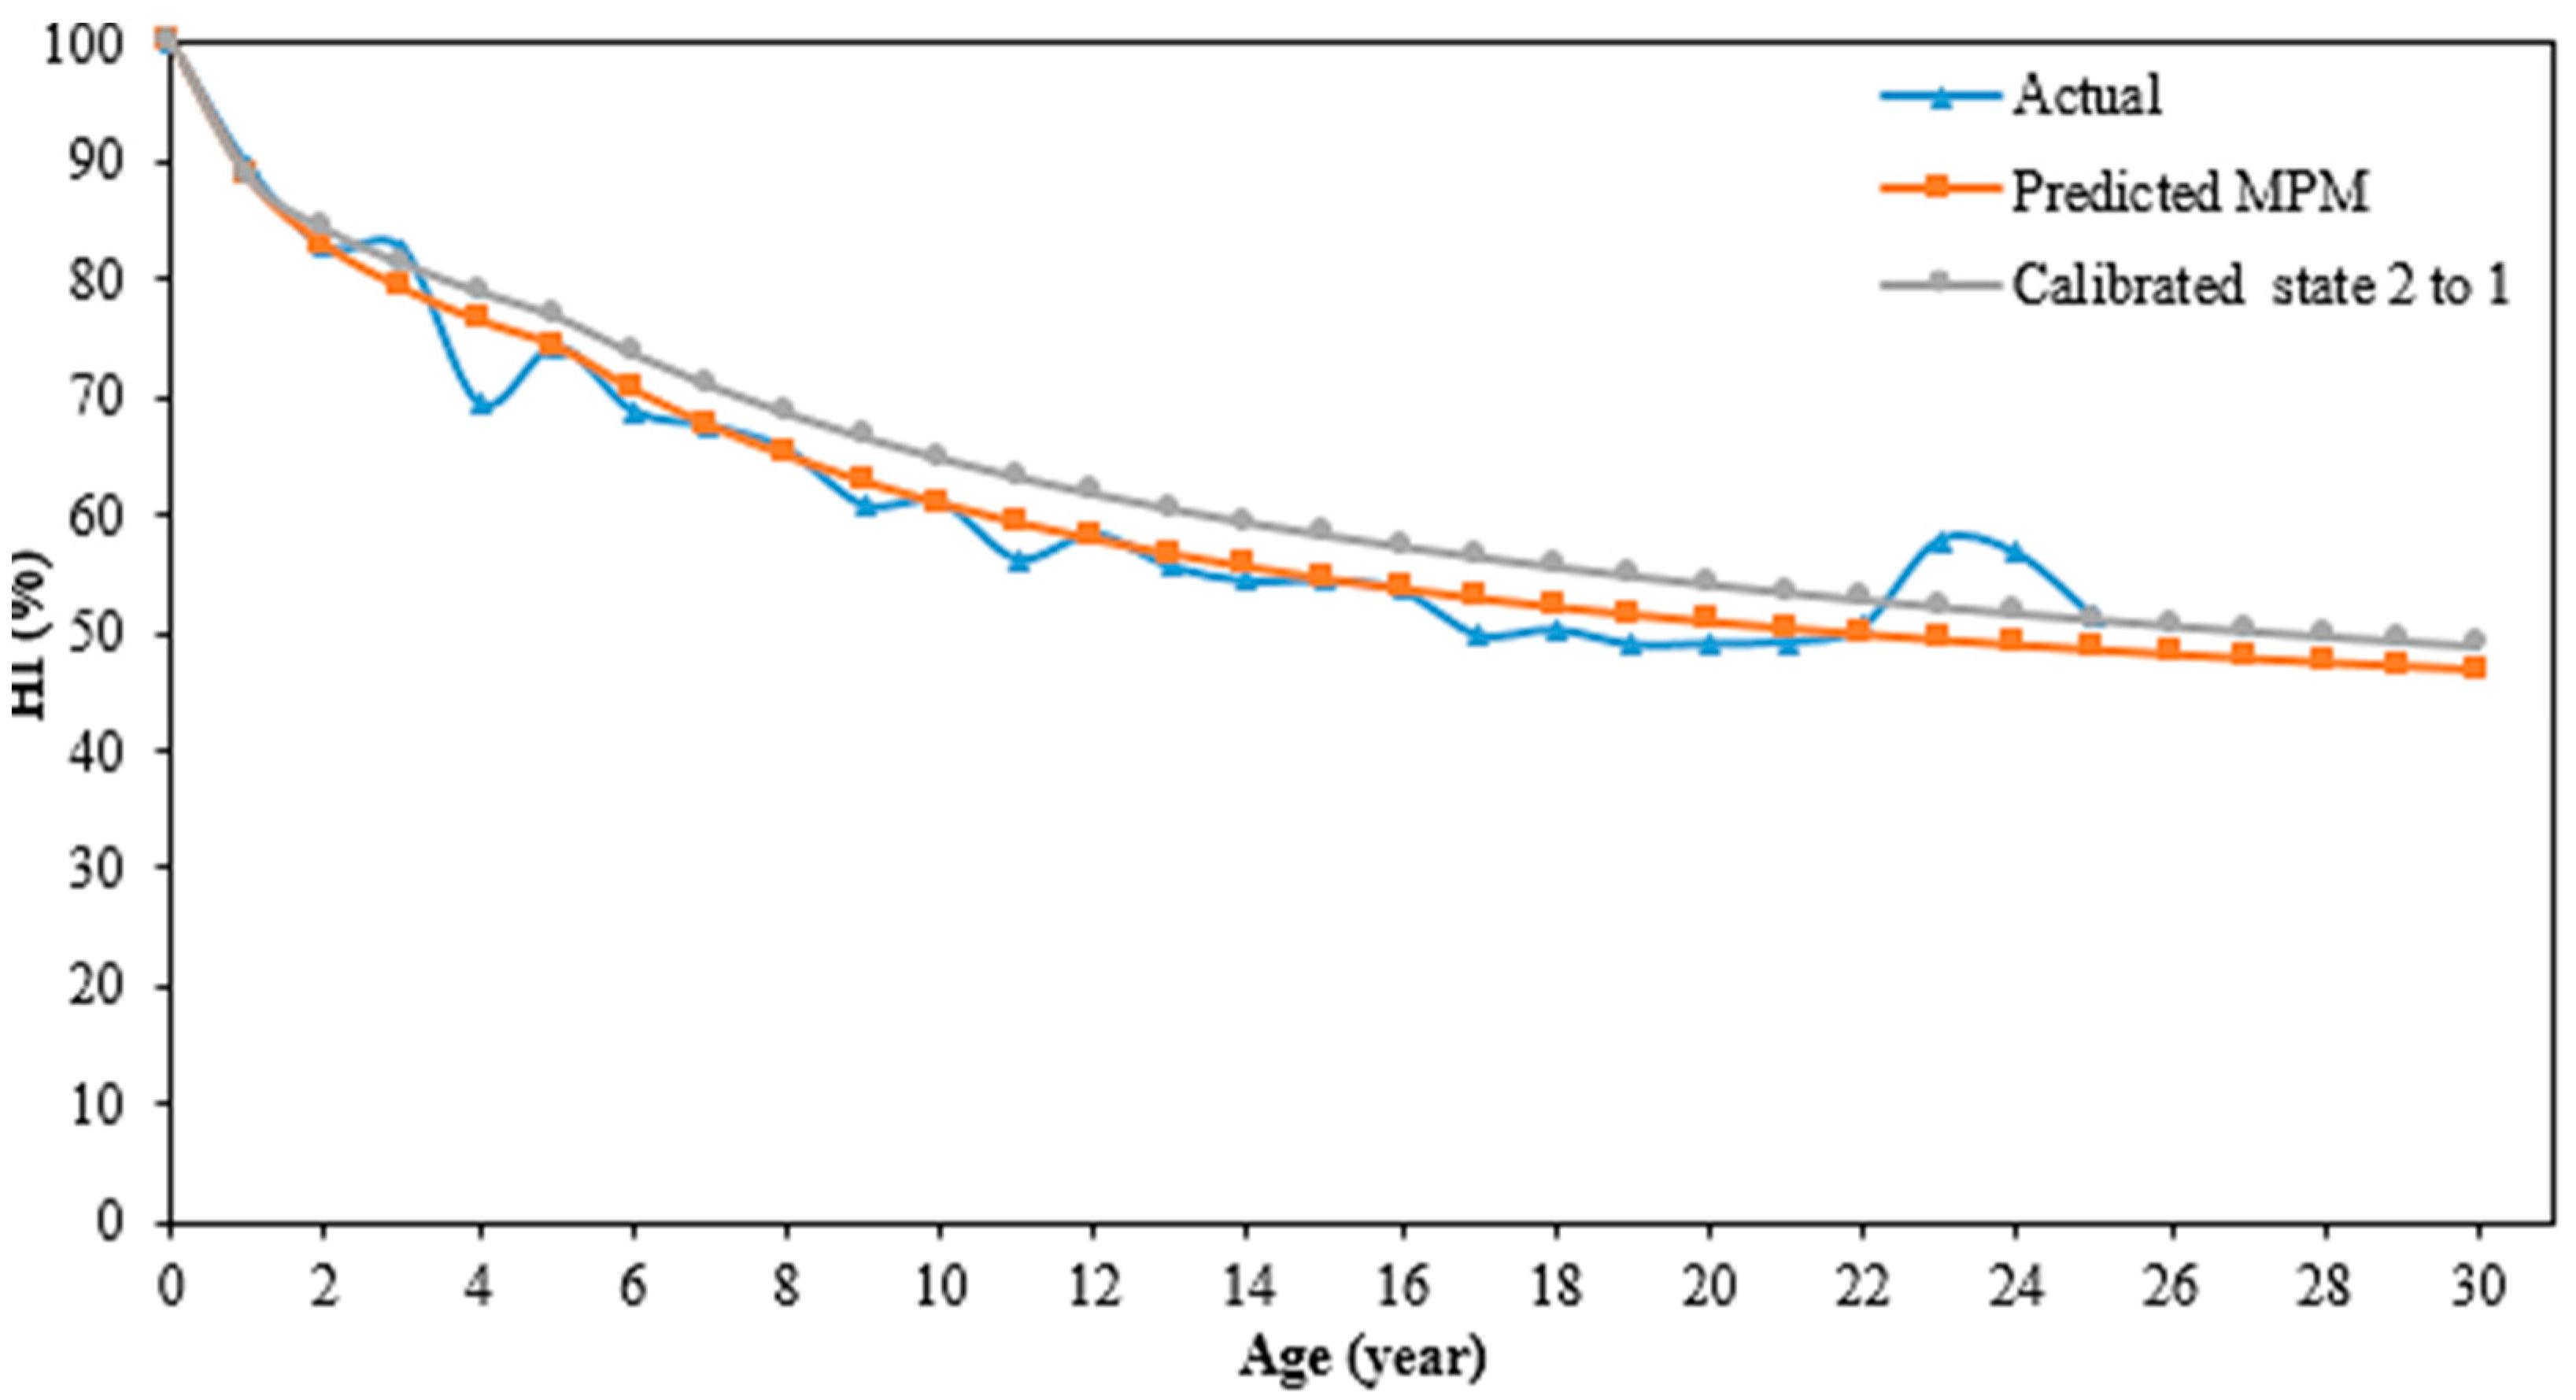
4. Application of Updated Markov Prediction Model (MPM)

The predicted distribution of the transformer population in each of the states based on MPM for 30 years can be seen in Figure 2. It is plotted based on the transition matrices for zone 1 and zone 2, which have been previously computed in [20]. The current study focuses on the impact of the pre-determined maintenance repair rate on the future deterioration states of the transformer population obtained based on [20]. The transition probabilities are determined according to a nonlinear minimization technique based on distribution transformer (33/11 kV and 30 MVA) oil samples data from utility. During the first five years, 96.45% of the transformer population reside within state 1 (very good) and state 3 (fair), while the rest reside in state 4 (poor) and state 5 (very poor). Over the next 25 years, the majority of the transformer population in state 1 (very good) shift to state 5 (very poor). At year 30, 96.09% of the transformer population are in state 4 (poor) and state 5 (very poor).
  P = [ 0.2889   0.7111 0 0 0 0 0.7717 0.2283 0 0 0 0 0.9626 0.0374 0 0 0 0 0.9900 0.0100 0 0 0 0 1 ]
  P = [ 0.5051   0.4949 0 0 0 0 0.8923 0.1077 0 0 0 0 0.7315 0.2685 0 0 0 0 0.9900 0.0100 0 0 0 0 1 ]
In the study, 10%, 20% and 30% pre-determined maintenance repair rates were applied to examine the effect on the transformer population. The first step was to update the previous transition matrices in [20]. For example, the non-updated transition matrices for zone 1 and 2 in Equation (6) and Equation (7) were adjusted to state 2 (good) by 10%. The adjustment representing the maintenance action defined in Table 1 was performed and the distribution of the transformer population improved to state 1 (very good) by 10%. The updated transition matrices for both zones, PM, are shown in Equations (8) and (9) below.
P M = [ 0.2889   0.7111 0 0 0 0.1 0.6945 0.2055 0 0 0 0 0.9626 0.0374 0 0 0 0 0.9900 0.0100 0 0 0 0 1 ]
P M = [ 0.5051   0.4949 0 0 0 0.1 0.8031 0.0969 0 0 0 0 0.7315 0.2685 0 0 0 0 0.9900 0.0100 0 0 0 0 1 ]
Next, the distribution of the transformer population in each of the states and performance condition curve were re-plotted by the Markov chain algorithm based on Equations (4) and (5). The distribution of the transformer population in each state with a 10% pre-determined maintenance repair rate carried out at state 2 (good) is shown Figure 3. The transformer population residing in state 1 (very good) and state 2 (good) increase up to 9.05% and 0.96%, respectively. In addition, the transformer population residing in state 3 (fair), state 4 (poor) and state 5 (very poor) decrease up to 7.92%. At year 30, the transformer population residing in state 4 (poor) and state 5 (very poor) decrease up to 3.50% and 1.51%, respectively, while there is a 2.76% increment of the transformer population residing in state 1 (very good), state 2 (good) and state 3 (fair).
An example of HI performance condition curves for all conditions can be seen in Figure 4. It can be seen that the predicted HI performance condition curve based on MPM agrees quite well with the actual HI performance curve. Based on the predicted HI performance condition curve, there is a 3.94% improvement of the HI performance condition curve along the 30 years period. In order to identify the full spectrum of the HI performance condition curve improvement, a sensitivity study on different state transitions is required. Table 2 shows the updated transition matrices of each state with a 10% pre-determined maintenance repair rate.
The distribution of the transformer population according to various state transitions based on a 10% pre-determined maintenance repair rate can be seen in Figure 5. It is worth noting that, practically, it is quite difficult to determine the equivalent state transitions for individual types of maintenance actions. Comprehensive examination and expert judgement are required in order to obtain the required information. Nevertheless, this study can provide an overview for utilities on how the health index state distribution and performance condition curve of the transformer population can be affected by several pre-determined maintenance repair rates. An apparent improvement in the transformer distribution is found once the pre-determined maintenance repair rate is applied for transition from state 4 (poor) to state 1 (very good). The transformer population in state 4 (poor) and state 5 (very poor) decrease up to 44.33% and 8.18% correspondingly. On the other hand, the transformer populations in state 1 (very good), state 2 (good), and state 3 (fair) increase up to 8.67%, 32.38% and 12.47% respectively.
The HI performance condition curves based on various state transitions can be seen in Figure 6. The most significant improvement can be attained through the introduction of the pre-determined maintenance repair rate at state 4 (poor). The transition from state 4 (poor) to state 1 (very good) provides an average improvement of the condition state of up to 10.24%.
Further investigation was carried out to analyse the impact of different pre-determined maintenance repair rates. The transition matrices adjustment similar to Table 2 was carried out for 20% and 30% pre-determined maintenance repair rates. The same methodology was repeated to examine the performance condition curve and distribution population. The HI state distribution and performance condition improvement trends for 10%, 20%, and 30% pre-determined maintenance repair rates are quite similar. For all rates, the most significant impact on the HI state distribution and improvement of the performance condition curve occur at the transition from state 4 (poor) to state 1 (very good). Figure 7 shows the comparison of the HI performance condition curve for different pre-determined maintenance repair rates. The average improvement of the HI performance condition curve for 20% and 30% pre-determined maintenance repair rates is 14.23% and 16.48% respectively.
The changes of transformer population for each of the states from state 4 (poor) to state 1 (very good) for different pre-determined maintenance repair rates are shown in Figure 8. In total, the 30% pre-determined maintenance repair rate has the greatest effect on the HI state distribution of the transformer population. The transformer populations in state 4 (poor) and state 5 (very poor) decrease up to 63.25% and 13.10% respectively. The transformer populations in state 1 (very good), state 2 (good), and state 3 (fair) increase by 15.03%, 46.67% and 18.20% respectively.
Based on the case study, it is found that the highest percentage of changes for the HI state distribution can be achieved through calibration of the transformer population in state 4 (poor), which has the highest distribution. Since MPM is a continuous time process that is based on the prior state, any improvement to state 1 (very good) from state 4 (poor) should affect the other future HI state distribution, as shown in Figure 8. It can be summarized that the changes for individual HI states’ distribution not only depend on the percentage of the pre-determined maintenance repair rate, but also depend on the transition of HI state improvement in the MPM.

5. Conclusions

The effects of maintenance, repair, and replacement on the HI states based on MPM have been investigated in this study. A study between updated and non-updated transition matrices reveals that all pre-determined maintenance repair rates adjustment from state 4 (poor) to state 1 (very good) gives the greatest improvement in terms of the HI state distribution and performance curve. The 30% pre-determined maintenance repair rate has the most significant impact on the distribution of the transformer population. However, these rates must be chosen appropriately based on maintenance, repair, and replacement readiness and cost benefit consideration. In addition, the pre-determined rates should be employed by the state with the largest population in order to obtain significant changes in the HI state distribution. Overall, this study could assist the utilities to plan and optimize the investments which support the sustainable transformer asset management.

Author Contributions

The research study was carried out successfully with contributions from all authors. The main research idea, simulation works, and manuscript preparation were contributed by M.S.Y. N.A. contributed to the manuscript preparation and research idea. A.M.S., M.Z.A.A.K., J.J., and M.H.H. assisted in finalizing the research work and manuscript. Y.Z.Y.G. and M.A.T. gave several suggestions from industrial perspectives. All authors revised and approved the publication of the paper.

Funding

The research was funded by Ministry of Education under FRGS scheme (03-01-16-1787FR) and Universiti Putra Malaysia under PUTRA Berimpak (GPB/2017/9570300).

Acknowledgments

The authors would like to express their sincere gratitude to the Ministry of Education Malaysia, UPM, CELP UPM and UTeM for the technical and financial support of this research.

Conflicts of Interest

The authors declare no conflict of interest.

References

  1. Abu-Elanien, A.E.B.; Salama, M.M.A. Asset management techniques for transformers. Elect. Power Syst. Res. 2010, 80, 456–464. [Google Scholar] [CrossRef]
  2. Juan, L.; Valasquez, C.; Miguel, A.S.; Samuel, G.A. General asset management model in the context of an electric utility: Application to power transformers. Elect. Power Syst. Res. 2011, 81, 2015–2037. [Google Scholar]
  3. A2.18 W.G. Life Management Techniques for Power Transformer; CIGRE: Paris, France, 2003. [Google Scholar]
  4. Hamoud, G.A. Use of Markov models in assessing spare transformer requirements for distribution stations. IEEE Trans. Power Syst. 2012, 27, 1098–1105. [Google Scholar] [CrossRef]
  5. Jahromi, A.; Piercy, R.; Cress, S.; Service, J.; Fan, W. An approach to power transformer asset management using health index. IEEE Electr. Insul. Mag. 2009, 25, 20–34. [Google Scholar] [CrossRef]
  6. Yang Ghazali, Y.Z.; Talib, M.A.; Ahmad Rosli, H. TNB experience in condition assessment and life management of distribution power transformers. In Proceedings of the Electricity Distribution-Part 1 (CIRED 2009), Prague, Czech Republic, 8–11 June 2009; pp. 1–4. [Google Scholar]
  7. Scatiggio, F.; Pompili, M. Health index: The TERNA’s practical approach for transformers fleet management. In Proceedings of the Electrical Insulation Conference (EIC), Ottawa, ON, Canada, 2–5 June 2013; pp. 178–182. [Google Scholar]
  8. Tanasescu, G.; Notingher, P.V.; Dragomir, O.; Gorgan, B.; Voinescu, L. Health index calculation of electrical equipments using DiagConsole software. In Proceedings of the Advanced Topics in Electrical Engineering (ATEE), Bucharest, Romania, 23–25 May 2013; pp. 1–6. [Google Scholar]
  9. Haema, J.; Phadungthin, R. Condition assessment of the health index for power transformer. In Proceedings of the IEEE Power Engineering and Automation Conference (PEAM), Wuhan, China, 18–20 September 2012; pp. 1–4. [Google Scholar]
  10. Brandtzæg, G. Health Indexing of Norwegian Power Transformers. Master’s Thesis, Norwegian University of Science and Technology, Trondheim, Norway, 2015. [Google Scholar]
  11. Wang, M.; Vandermaar, A.J.; Srivastava, K.D. Review of condition asessment of power transformers in service. Electr. Insul. Mag. IEEE 2002, 18, 12–25. [Google Scholar] [CrossRef]
  12. A2.27 W.G. Rcommendations for Condition Monitoring and Condition Assessment Facilities for Transformer; CIGRE: Paris, France, 2008. [Google Scholar]
  13. Emsley, A.; Steven, G. Review of chemical indicators of degradation of cellulosic electrical paper insulation in oil-filled transformers. IEE Proc. Sci. Meas. Technol. 1994, 141, 324–334. [Google Scholar] [CrossRef]
  14. Daniel, M.; Tapan, S.; Richard, D.; Gary, B.; Srinivasan, C.; Greg, C.; Jian, B.Z.; Russell, G. Determining water in transformer paper insulation: Analyzing aging transformers. Electr. Insul. Mag. IEEE 2015, 31, 23–32. [Google Scholar]
  15. Lars, R.L.; Walter, H.; Dag, L.; Terence, J.P. Aging of Oil-Impregnated Paper in Power Transformers. IEEE Trans. Power Deliv. 2004, 19, 230–239. [Google Scholar]
  16. D1.01 W.G. Furanic Compounds for Diagnosis; CIGRE: Paris, France, 2011. [Google Scholar]
  17. Zhou, D.; Wang, Z.; Li, C. Data requisites for transformer statistical lifetime modelling-part I: Aging related failures. IEEE Trans. Power Deliv. 2013, 28, 1750–1757. [Google Scholar] [CrossRef]
  18. Zhou, D.; Wang, Z.; Jarman, P. Data requisites for transformer statistical lifetime modelling-part II: Aging related failures. IEEE Trans. Power Deliv. 2014, 29, 154–160. [Google Scholar] [CrossRef]
  19. Ridwan, M.I.; Talib, M.A.; Ghazali, Y.Z.Y. Application of weibull-bayesian for the reliability analysis of distribution transformers. In Proceedings of the IEEE 8th International Power Engineering and Optimization Conference (PEOCO2014), Langkawi, The Jewel of Kedah, Malaysia, 24–25 March 2014. [Google Scholar]
  20. Yahaya, M.S.; Azis, N.; Ab Kadir, M.Z.; Jasni, J.; Hairi, M.H.; Talib, M.A. Estimation of transformers Health Index based on the Markov chain. Energies 2017, 10, 1824. [Google Scholar] [CrossRef]
  21. Butt, A.A.; Shahin, M.Y.; Feighan, K.J.; Carpenter, S.H. Pavement performance predíction model using the Markov process. Transp. Res. Rec. 1987, 1123, 12–99. [Google Scholar]
  22. Jiang, Y.; Saito, M.; Sinha, K. Bridge performance prediction model using the Markov chain. Transp. Res. Rec. 1988, 1180, 25–32. [Google Scholar]
  23. Jiang, Y.; Sinha, K. Bridge service life prediction model using the Markov chain. Transp. Res. Rec. 1989, 1223, 24–30. [Google Scholar]
  24. Riveros, G.A.; Arredondo, E. Guide to the Development of a Deterioration Rate Curve Using Condition State Inspection Data; Report, No.: ERDC/CHL CHETN-IX-25; US Army Corps of Engineers: Davis, CA, USA, 2010; pp. 1–12. [Google Scholar]
  25. Micevski, T.; Kuczera, G.; Coombes, P. Markov model for storm water pipe deterioration. J. Infrastruct. Syst. 2002, 8, 49–56. [Google Scholar] [CrossRef]
  26. Li, L.; Feng, L.; Zhang, C.; Lijun, S. Use of Markov chain model Bbsed on actual repair status to predict bridge deterioration in Shanghai, China. Transp. Res. Rec. J. Transp. Res. Board 2016, 2550, 106–114. [Google Scholar] [CrossRef]
  27. Hoskins, R.P.; Strbac, G.; Brint, A.T. Modelling the degradation of condition indices. IEE Proc. Gener. Transm. Distrib. 1999, 146, 386–392. [Google Scholar] [CrossRef]
  28. Zhang, Y.; Augenbroe, G.; Vidakovic, B. Uncertainty analysis in using Markov Chain to predict roof life cycle performance. In Proceedings of the Durability of Building Material and Components (10DBMC), Lyon, France, 17–20 April 2005. [Google Scholar]
  29. Camahan, J.V.; Davis, W.J.; Shahin, M.Y.; Keane, P.L.; Wu, M.I. Optimal maintenance decisions for pavement management. J. Transp. Eng. 1987, 113, 554–572. [Google Scholar] [CrossRef]
  30. Agrawal, A.K.; Kawaguchi, A.; Chen, Z. Deterioration rates of typical bridge elements in New York. J. Bridg. Eng. 2010, 15, 419–429. [Google Scholar] [CrossRef]
  31. Cesare, M.A.; Santamarina, C.; Turkstra, C.; Vanmarcke, E.H. Modeling bridge deterioration with Markov chains. J. Transp. Eng. 1993, 118, 820–833. [Google Scholar] [CrossRef]
  32. Jiang, Y. Application and comparison of regression and Markov chain methods in bridge condition prediction and system benefit optimization. J. Transp. Res. Forum 2010, 49, 91–110. [Google Scholar]
  33. Si, X.S.; Wang, W.; Hu, C.H.; Zhou, D.H. Remaining useful life estimation—A review on the statistical data driven approaches. Eur. J. Oper. Res. 2011, 213, 1–14. [Google Scholar] [CrossRef]
  34. Martins, M.A. Condition and risk assessment of power transformers: A general approach to calculate a health index. Ciência Tecnol. Mater. 2014, 26, 9–16. [Google Scholar] [CrossRef]
  35. A2.34 W.G. Guide for Transformer Maintenance; CIGRE: Paris, France, 2011. [Google Scholar]
  36. Richard, E.B.; Bruce, G.H. Asset Management for Transmission and Distribution. IEEE Power Energy Mag. 2005, 3, 39–45. [Google Scholar]
  37. Dhillon, B.S. Engineering Maintenance: A Modern Approach, 1st ed.; CRC Press: Boca Raton, FL, USA, 2002. [Google Scholar]
  38. Deloitte Asset Management; Canadian Electricity Associate (CEA). Asset Health Indices: A Utility Industry Necessity; Whitepaper; Deloitte: London, UK, 2014. [Google Scholar]
  39. Naderian, A.; Cress, S.; Piercy, R.; Wang, F.; Service, J. An approach to determine the health index of power transformers. In Proceedings of the IEEE International Symposium on Electrical Insulation (ISEI), Vancouver, BC, Canada, 9–12 June 2008; pp. 192–196. [Google Scholar]
  40. Azmi, A.; Jasni, J.; Azis, N.; Kadir, M.Z.A. Evolution of transformer health index in the form of mathematical equation. Renew. Sustain. Energy Rev. 2017, 76, 687–700. [Google Scholar] [CrossRef]
  41. Jasni, J.; Azmi, A.; Yahaya, M.S.; Talib, M.A. Assessment of transformer Health Index using different model. Pertanika J. Sci. Technol. 2017, 25, 143–150. [Google Scholar]
  42. Yates, R.D.; Goodman, D.J. Probability and Stochastic Processes, 2nd ed.; John Wiley & Sons Inc.: Hoboken, NJ, USA, 2005; pp. 445–451. [Google Scholar]
Figure 1. Concept of Health Index (HI) and the asset management.
Sustainability 10 03399 g001
Figure 2. Distribution of the transformer population in each of the states.
Sustainability 10 03399 g002
Figure 3. Distribution of the transformer population in each of the states with a 10% pre-determined maintenance repair rate carried out at state 2 (good).
Sustainability 10 03399 g003
Figure 4. HI performance curves with a 10% pre-determined maintenance repair rate.
Sustainability 10 03399 g004
Figure 5. Distribution of the transformers population in each of the states with a 10% pre-determined maintenance repair rate carried out at different states.
Sustainability 10 03399 g005
Figure 6. HI performance curves with a 10% pre-determined maintenance repair rate carried out at different states.
Sustainability 10 03399 g006
Figure 7. HI performance curves for 10%, 20%, and 30% pre-determined maintenance repair rates.
Sustainability 10 03399 g007
Figure 8. Percentage of changes for HI state distribution of the transformer population based on 10%, 20%, and 30% pre-determined maintenance repair rates (from state 4 (poor) to state 1 (very good)).
Sustainability 10 03399 g008
Table 1. Corresponding HI, condition states, and recommendation of maintenance action.
Health IndexConditionStateRequired Maintenance Action
85–100%Very Good1Normal maintenance.
70–84%Good2Normal maintenance.
50–69%Fair3Increase diagnostic testing, possible remedial work or replacement needed depending on criticality.
30–49%Poor4Start planning process to replace or rebuild considering risk and consequences of failure.
0–29%Very Poor5Immediately assess risk, replace or rebuild based on assessment.
Table 2. Updated transition matrices of each state with a 10% pre-determined maintenance repair rate.
NoUpdated StateTP Zone 1TP Zone 2
FromTo
1GoodVery good P M = [ 0.2899 0.7111 0 0 0 0.1 0.6945 0.2055 0 0 0 0 0.9626 0.0374 0 0 0 0 0.9900 0.0100 0 0 0 0 1 ] P M = [ 0.5051 0.4949 0 0 0 0.1 0.8031 0.0969 0 0 0 0 0.7315 0.2685 0 0 0 0 0.9900 0.0100 0 0 0 0 1 ]
2FairGood P M = [ 0.2899 0.7111 0 0 0 0 0.7717 0.2283 0 0 0 0.1 0.8664 0.0336 0 0 0 0 0.9900 0.0100 0 0 0 0 1 ] P M = [ 0.5051 0.4949 0 0 0 0 0.8923 0.1077 0 0 0 0.1 0.6584 0.2416 0 0 0 0 0.9900 0.0100 0 0 0 0 1 ]
3FairVery good P M = [ 0.2899 0.7111 0 0 0 0 0.7717 0.2283 0 0 0.1 0 0.8664 0.0336 0 0 0 0 0.9900 0.0100 0 0 0 0 1 ] P M = [ 0.5051 0.4949 0 0 0 0 0.8923 0.1077 0 0 0.1 0 0.6584 0.2416 0 0 0 0 0.9900 0.0100 0 0 0 0 1 ]
4PoorFair P M = [ 0.2899 0.7111 0 0 0 0 0.7717 0.2283 0 0 0 0 0.9626 0.0374 0 0 0 0.1 0.8910 0.0090 0 0 0 0 1 ] P M = [ 0.5051 0.4949 0 0 0 0 0.8923 0.1077 0 0 0 0 0.7315 0.2685 0 0 0 0.1 0.8910 0.0090 0 0 0 0 1 ]
5PoorGood P M = [ 0.2899 0.7111 0 0 0 0 0.7717 0.2283 0 0 0 0 0.9626 0.0374 0 0 0.1 0 0.8910 0.0090 0 0 0 0 1 ] P M = [ 0.5051 0.4949 0 0 0 0 0.8923 0.1077 0 0 0 0 0.7315 0.2685 0 0 0.1 0 0.8910 0.0090 0 0 0 0 1 ]
6PoorVery good P M = [ 0.2899 0.7111 0 0 0 0 0.7717 0.2283 0 0 0 0 0.9626 0.0374 0 0.1 0 0 0.8910 0.0090 0 0 0 0 1 ] P M = [ 0.5051 0.4949 0 0 0 0 0.8923 0.1077 0 0 0 0 0.7315 0.2685 0 0.1 0 0 0.8910 0.0090 0 0 0 0 1 ]
7Very poorPoor P M = [ 0.2899 0.7111 0 0 0 0 0.7717 0.2283 0 0 0 0 0.9626 0.0374 0 0 0 0 0.9900 0.0100 0 0 0 0.1 0.9 ] P M = [ 0.5051 0.4949 0 0 0 0 0.8923 0.1077 0 0 0 0 0.7315 0.2685 0 0 0 0 0.9900 0.0100 0 0 0 0.1 0.9 ]
8Very poorFair P M = [ 0.2899 0.7111 0 0 0 0 0.7717 0.2283 0 0 0 0 0.9626 0.0374 0 0 0 0 0.9900 0.0100 0 0 0.1 0 0.9 ] P M = [ 0.5051 0.4949 0 0 0 0 0.8923 0.1077 0 0 0 0 0.7315 0.2685 0 0 0 0 0.9900 0.0100 0 0 0.1 0 0.9 ]
9Very poorGood P M = [ 0.2899 0.7111 0 0 0 0 0.7717 0.2283 0 0 0 0 0.9626 0.0374 0 0 0 0 0.9900 0.0100 0 0.1 0 0 0.9 ] P M = [ 0.5051 0.4949 0 0 0 0 0.8923 0.1077 0 0 0 0 0.7315 0.2685 0 0 0 0 0.9900 0.0100 0 0.1 0 0 0.9 ]
10Very poorVery good P M = [ 0.2899 0.7111 0 0 0 0 0.7717 0.2283 0 0 0 0 0.9626 0.0374 0 0 0 0 0.9900 0.0100 0.1 0 0 0 0.9 ] P M = [ 0.5051 0.4949 0 0 0 0 0.8923 0.1077 0 0 0 0 0.7315 0.2685 0 0 0 0 0.9900 0.0100 0.1 0 0 0 0.9 ]

