Article

The Effects of Rapid Urbanization on Forest Landscape Connectivity in Zhuhai City, China

1
School of Life and Environmental Science, Minzu University of China, Beijing 100081, China
2
Department of Geography, National University of Singapore, Singapore 117570, Singapore
3
International Doctoral Innovation Centre, Research Group of Natural Resources and Environment, Department of Chemical and Environmental Engineering, University of Nottingham Ningbo China, Ningbo 315100, China
4
Build Environment Department, Eindhoven University of Technology, 5612 AZ Eindhoven, The Netherlands
*
Author to whom correspondence should be addressed.
Sustainability 2018, 10(10), 3381; https://doi.org/10.3390/su10103381
Submission received: 7 August 2018 / Revised: 16 September 2018 / Accepted: 18 September 2018 / Published: 21 September 2018

Abstract

:
Urban forests can provide the necessary ecosystem services for their residents and play an important part in improving the urban environment. Forest landscape connectivity is a vital indicator reflecting the quality of the ecological environment and ecological functions. Detecting changes in landscape connectivity is, therefore, an important step for providing sound scientific evidence for the better urban planning. Using remote sensing images of a study area in Zhuhai City in 1999, 2005, 2009 and 2013, the dynamic forest landscape connectivity of Zhuhai city can be evaluated based on a graph-theoretic approach. The aims of our study were to discover and interpret the effect of rapid urbanization on forest landscape connectivity. The construction of ecological corridors helps us specifically compare the landscape connectivity of three parts of urban forests. On the basis of functional landscape metrics, the correlation of these metrics and patch area was discussed in order to comprehensively identify the key patches. The analysis showed that the total areas of forestlands reduced from 1999 to 2009 and then increased from 2009 to 2013, and the same trend was found in overall forest landscape connectivity. To improve the overall landscape connectivity, construct urban ecological network and appropriately protect biodiversity in the future, the existing important patches with large areas or key positions should be well protected. This study revealed that urbanization reduced the area of key patches and consequently reduced the forest landscape connectivity, which increased while the patch areas increased due to the environmental protection policy. Functional connectivity indicators could provide more comprehensive information in the development of environmental protection strategies.

1. Introduction

The areas occupied by global cities quadrupled from 1970 to 2000 [1] and it is estimated that approximately 65% of the world’s population will live in cities by 2025 [2]. China is the world’s largest developing country and the percentage of the urban population was 22.9% in 1985 and 47.5% in 2010, an increase which resulted from rapid urbanization after the great reform and opening-up policy which began in 1978 [3]. Most countries in the world have experienced urbanization with the rapid development of economy and society [4,5,6,7]. From the perspective of landscape ecology, urbanization is the process in which landscape processes are affected and changed. The corresponding results of this process can be reflected by landscape patterns [8], for example, the original natural landscape including forestland, grassland, lakes, rivers and soil can be changed to nature reserves, city forest parks, scenic tourist areas or manmade landscapes which are mainly composed of cement, asphalt, chemical materials, and metal. In this case, the ecosystem services provided by urban forest land would be influenced to a large extent However, natural ecosystems play a vital role in maintaining ecological balance and providing ecosystem services [9,10,11]. Researchers and landscape planners are, therefore, dedicated to finding the key patches to maintain ecological services [12,13] and exploring how to plan for urban green space from an ecological perspective [14,15].
Urban forests have been regarded as important elements for improving the green infrastructure network in the urban landscape [16]. They not only make the large contribution of providing multiple benefits such as social, architectural, climatic and economic benefits, but also enhance the quality of urban life [17]. Urban forest lands therefore play a vital role in effective urban planning to support various ecosystem services and achieve sustainable urban development. The assessments of the urban forest connectivity can quantitatively reflect the quality of green infrastructure network. Urban forest landscape connectivity exerts very important influences on urban ecosystem services and functions (e.g., seed migration and proliferation, animal migration, and gene flow) and interferes with water infiltration and soil erosion. Connectivity is directly related to the integrity, sustainability and stability of urban ecosystems [18]. Maintaining landscape connectivity is a crucial part of sustainable planning and the management of urban forest landscapes [19]. Thus, the topic of studying urban forest connectivity has driven many planners and researchers to apply landscape connectivity in urban planning to effectively support ecological services [20,21,22].
A key task in these endeavors was that of improving landscape connectivity, which is defined as the degree to which the landscape facilitates or impedes movement among resource patches [23]. Landscape connectivity provides highly useful information about the characteristics of a landscape, such as description of the relationships between landscape structure and the organisms within it [24]. In addition to conserving biodiversity, maintaining good connectivity can maintain the stability and integrity of ecosystems [4]. Graph theory has a long tradition in ecological conservation [25,26,27] and its application in landscape connectivity allows for a comprehensive consideration of environmental variables including biotic factors (such as area) and abiotic factors (such as topography) in landscape ecological planning and research [28]. A graph-theoretic approach can effectively assess functional landscape connectivity, and can also be used to investigate the contribution of important patches to improving forest landscape connectivity [25,29]. Forest patches can be represented by a series of nodes which connect with each other and the ecological flows among these patches can be modeled as ecological corridors. Networks and corridor models make the great contribution of improving landscape connectivity in vital forest patches which can promote species movement among these patches. The Conefor Sensinode 2.6 (CS26) (http://www.conefor.org) uses a set of indices to calculate the ecological connectivity and then investigate the importance of critical patches [30,31].
The aims of this study are: (1) to detect the dynamics of forestlands based on land use maps and evaluate the changes in forest landscape connectivity from 1999 to 2013 in Zhuhai City; (2) to investigate the effects of rapid urbanization on forest landscape connectivity on the basis of landscape connectivity metrics; and (3) to rank the importance value of the total forest patches in order to develop better urban biodiversity conservation planning for the local study area and discuss the contributions of functional connectivity metrics in identifying important forest patches.

2. Materials and Methods
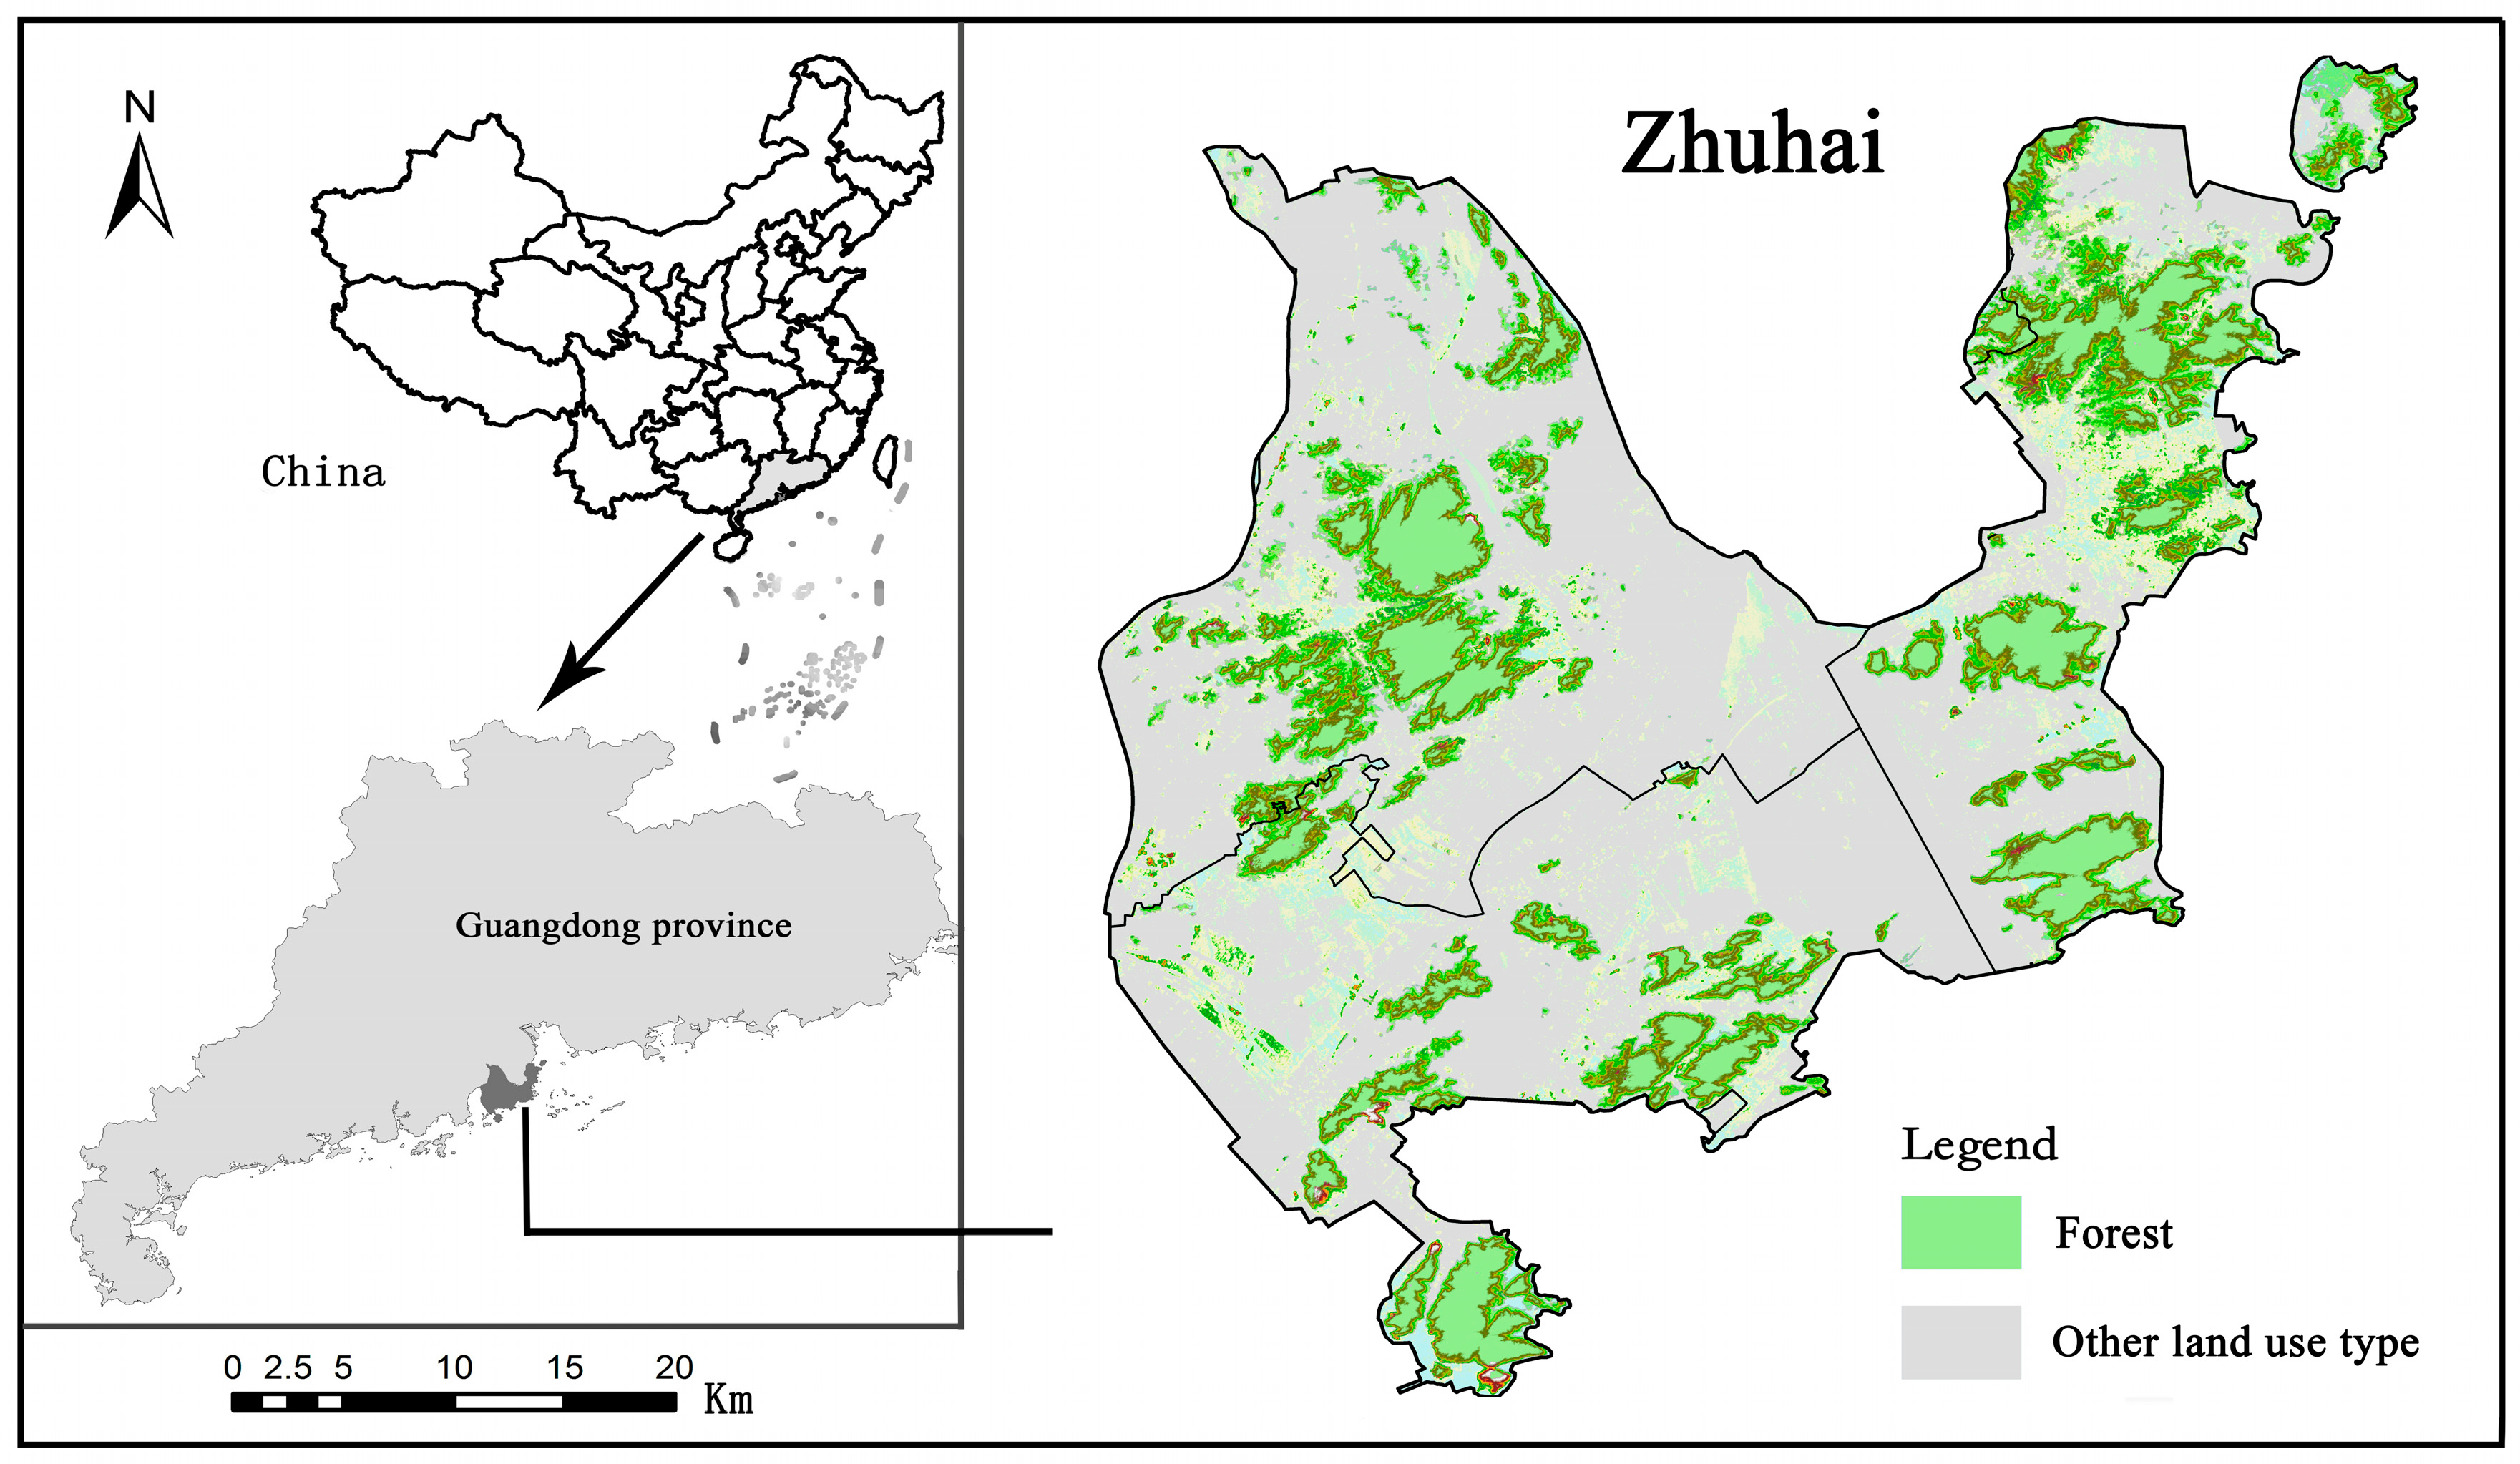
2.1. Study Area

Zhuhai City (113.510° E to 113.593° E, 22.209° N to 22.398° N) is located in the south of Guangdong Province, China, on the west bank of the Pearl River estuary (Figure 1). Zhuhai is a typical, fast expanding city with complex economic, social and geographical conditions. This city has experienced significant production growth and unprecedented land-use changes in the last three decades. With a population of 1.59 million in 2013, Zhuhai contains three main districts, Xiangzhou, Doumen and Jinwan. The total area of Zhuhai is 7836 km2, of which 1711 km2 is covered by land, and the remaining area is covered by ocean. Hills, plains and waters account for 58.6%, 25.5% and 15.9% of the total land area, respectively. The climate in Zhuhai is subtropical-monsoon-maritime and the forest type is mainly monsoon-evergreen-broadleaved forest. In order to protect the forest lands during urbanization, the government constructed many forest parks, scenic area and country parks in Zhuhai City in the past few decades, for example, the Jianfeng mountain forest park was opened in 1995 and the Banzhang mountain park was opened in 1997. Six forest parks have been developed in Zhuhai City from 1995–2005, and at present, almost all of the forest lands in Zhuhai City are covered by forest parks. They contributed to the preservation and protection of landscape resources, and additionally, facilitated the investigation and the study of the natural resources and environment effectively. In addition, these forest parks play an important role in the sustainable development of the tourism industry and also provide the great living conditions for the local people. The forest parks provide the necessary places for local educational institutions to hold educational activities and promote knowledge about environmental protection. The annual average temperature is 22.4 °C with monthly average temperatures of between 15 °C and 28 °C, and the annual rainfall is approximately 1770 mm. Zhuhai is a modernized city, serving as a regional hub for transportation, high-tech industry, and international trading for the south of the Pearl River Delta [32].
During the rapid urbanization, Zhuhai has experienced the dramatic changes in population composition and economy structure, improving the Biocultural Diversity could also make the good contribution to our urban environments. Biocultural Diversity is defined as the diversity of life in all its manifestations: biological, cultural, and linguistic—which are interrelated (and possibly coevolved) within a complex socio-ecological adaptive system. The diversity of life is made up not only of the diversity of plants and animal species, habitats and ecosystems found on the planet but also of the diversity of human cultures and languages. Certain geographic areas have been positively correlated with high levels of biocultural diversity, including those of low latitudes, higher rainfalls, higher temperatures, coastlines [33]. So improving the biocultural diversity in Zhuhai is also a necessary measure to protect the urban forest effectively.
Zhuhai City, adjacent to the Hong Kong and Macao special administrative regions, became one of the fastest-growing cities in China, especially in 1999–2009. In 2008, the National Development and Reform Commission of China had designed Zhuhai City as the center of the western bank of the Pearl River estuary, as part of a national urban development strategy for the next decade (2008–2020) [32]. Zhuhai city has experienced two stages of urbanization. Economic development was on top of the priority list at the beginning of urbanization, but constructing a garden city was recently set as the primary goal for long-term economic development [32]. As a result, urban forests also experienced two stages of change: the area of forest-land first decreased and then increased during the urbanization process. Therefore, the forest-land pattern in Zhuhai city was chosen to investigate the dynamics of the urban forest landscape connectivity within over the past 15 years.

2.2. Data sources and Processing

Remote sensing images from four years—1999, 2005, 2009 and 2013—were selected as the data source. All of the images used were taken in November, so as to generate comparable results; other information about these images is shown in Table 1. All remote sensing images were pre-processed: including radiation calibration, geometric correction, and image clipping. These processes can minimize errors during the classification of images [34]. Land use types were classified into seven types including forestland, grassland, farmland, developed land, wasteland, water body, and unutilized land, using supervised classification. Classification accuracy was assessed using kappa values. All the kappa values obtained from the assessment were higher than 8.5, suggesting that the classification results were reliable. The raster maps of land use were subsequently vectorized and imported to ArcMap to generate the spatial and attribute database of urban vegetation landscape types.
Taking the individual forestland in the study area as habitat patches and the entire study area as the environmental background and based on the Conefor Inputs package (http://www.conefor.org/gisextensions.html), node-line planar graph information was obtained by using the land use data in Zhuhai city [31]. Using the Conefor 2.6 software, all landscape connectivity indicators were investigated to detect changes in the landscape connectivity. The evaluation of the selected threshold distance was obtained by statistical methods.

2.3. Index of Landscape Connectivity

In this study, we examined the changes in forest landscape connectivity during the past 15 years in Zhuhai. Leveraging on a series of connectivity index, the study identified the important patches that potentially play an important role in future environment planning. Connectivity loss represents one of the major threats to the preservation of biotic diversity in natural ecosystems. Therefore, the forest landscape connectivity is set as a tool in the prioritization and protection of urban forest patches in landscape conservation planning.
The metrics used to quantify the landscape connectivity have attracted much research attention [26,35,36]. Probability of Connectivity (PC), which is based on a probabilistic connection model, and Integral Index of Connectivity (IIC), which is based on a binary connection model, were calculated based on a graph-theoretic approach [37]. The former is suitable for studying the actual movement of organisms of specific species while the latter is suitable for studying the topology of the network [22,38]. In this study, we used two indices to evaluate the overall forest landscape connectivity in Zhuhai and the IIC index to examine the structure of forestland and the general functional connectivity pattern.

2.3.1. Integral Index of Connectivity (IIC)

Changes in landscape connectivity depend not only on the area of the patches but also on the spatial distance between patches. In this study, the IIC was used to quantitatively estimate the change in landscape connectivity in the study area. IIC values range from 0 to 1 and increase with improved connectivity. The index is given by
IIC = i = 1 n j = 1 n a i a j 1 + nl ij A L 2  
where n is the total number of nodes in the landscape, ai and aj are the area of nodes i and j, nlij is the smallest number of links used to connect patches i and j, and AL is the total landscape area [26].

2.3.2. Probability of Connectivity (PC)

The PC index can be regarded as a network-based habitat availability index that is sensitive to habitat loss [39]. The PC ranges from 0 to 1 and increases with improved connectivity. It is given by:
PC = i = 1 n j = 1 n p ij a i a j A L 2  
where n is the total number of habitat nodes in the landscape, ai and aj are the area of nodes i and j, AL is the total landscape area, and pij is the maximal probability of the potential paths between patches i and j [37].

2.3.3. Patch Importance

The importance of an existing node for maintaining landscape connectivity (dI) is calculated according to a certain index (I) in Conefor Sensinode 2.6 [30,31] as a percentage expressed as:
dIIC = 100 ( IIC IIC remove ) IIC  
where IIC is the overall index value when all of the initially existing nodes are present in the landscape and IICremove is the overall index value after the removal of that single node from the landscape [40]. The importance of forest patches was classified into five levels according to the dIIC values, which are dIIC ≥ 70%; 70% > dIIC ≥ 50%; 50% > dIIC ≥ 30%; 30% > dIIC ≥ 10%; and dIIC < 10%. These classes were represented by very high importance; high importance; medium importance; medium low importance and low importance, respectively [41].
The dIIC can be partitioned into three fractions (dIICintra, dIICflux and dIICconnector), which can be used to assess the contributions of different habitat patches to landscape connectivity in three aspects [42]:
dIIC = dIICintra + dIICflux + dIICconnector  
where dIICintra is the contribution of patch when it comes to the intrapatch connectivity, or the available habitat area provided by the patch itself; dIICflux corresponds to the area-weighted dispersal flux through the connections of a patch to or from all of the other patches in the landscape when this patch is either the starting or ending patch of that connection or flux; dIICconnector is the contribution of patch to the connectivity between other habitat patches, as a connecting element or stepping stone between them [37,38]. In the present study, three functional connectivity indicators were selected to sufficiently investigate the landscape pattern in Zhuhai City. Additionally, binary indices including the number of components (NC) and the number of patches in the largest component (NPLC) were used to calculate the suitable threshold distance. A component is a set of nodes in which a path exists between every pair of nodes in the landscape [31].

2.4. The Threshold Distance and Patch Size Classification

The threshold distance is a vital factor in evaluating the landscape connectivity and the threshold distance could be interpreted as the minimum distance between patches of various ecological processes, such as the process of biological migration and species diffusion. Therefore, it is necessary to select suitable threshold distances in order to sufficiently detect the dynamics of forest landscape connectivity and investigate the functional connectivity of different habitat patches. To do so, firstly, we examined the changes in the number of components (NC) in the study period, and found that they decreased to 1 at the threshold distance of 5000 m in (Figure 2b), which indicated that all of the habitat patches in Zhuhai city were considered to be directly connected with each other. Thus, the suitable threshold distances, which were used to quantify the landscape connectivity and assess the contribution of important patches to landscape connectivity, were identified to be less than 5000 m. Secondly, we calculated the dIIC values of all forest patches at different threshold distance (50, 100, 200, 400, 600, 800, 1000, 1200, 1400, 1800, 2200, 2600, 3000, 3400, 3800, 4200, 4600 and 5000 m) and then compared the results of dIIC values at different threshold distances to select the suitable threshold distances.
Patch area also exerts a large influence on landscape connectivity and patch importance because since IIC value was calculated on the basis of patch areas. Thus, it was necessary to divide the selected patches into different classes based on the patch areas to clearly explain the changes of landscape pattern before studying the landscape connectivity. In this study, we categorized all of the forest patches into four classes, namely small patches (smaller than 100 ha), medium patches (100–500 ha), large patches (500–1000 ha), and great patches (larger than 1000 ha) [41].

2.5. Constructing the Ecological Corridor Based on the Important Nodes

First, the important patches in Zhuhai were selected as ecological source points based on the calculated dIIC values. Second, combined with observations and professional investigation, the resistance value can be calculated and assessed. Landscape resistance describes the influence of the landscape on the ecological flow rate and the creation of the landscape resistance surface using ArcGIS according to the landscape resistance values. Third, the distance of the corridors with minimum cost was calculated according to the methods of extracting ecological source points and the minimum cumulative resistance [43].

2.6. Statistical Analysis of Functional Connectivity Metrics

In order to compare the contribution of functional indices in identifying important patches, the Pearson correlation coefficients were used to evaluate the correlation between metrics (including dIIC, dIICintra, dIICflux and dIICconnector) and patch areas, and the results of the correlation analysis were computed using SPSS 12.0 [44,45].

3. Results

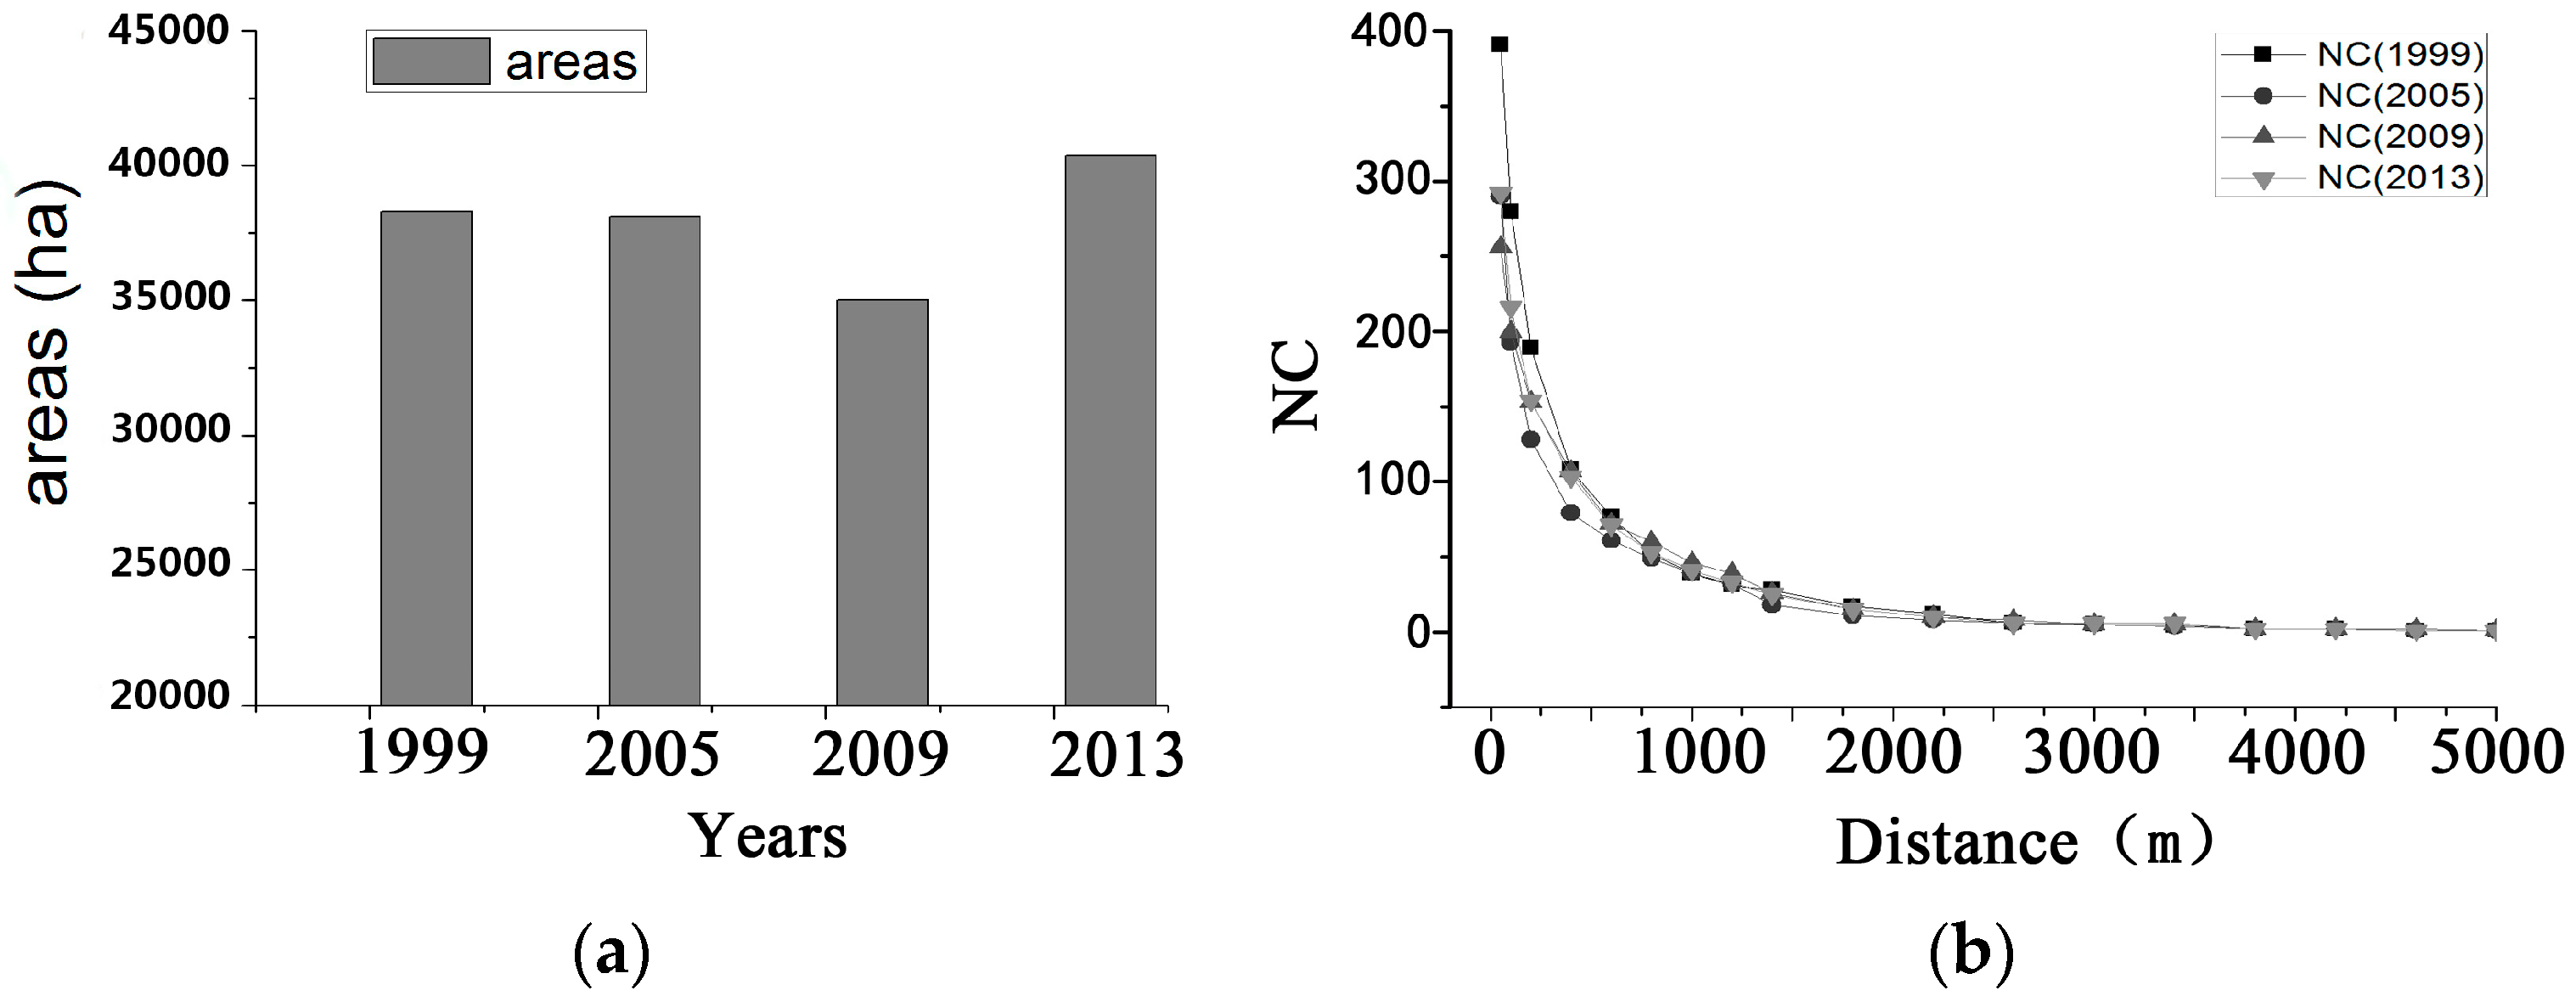
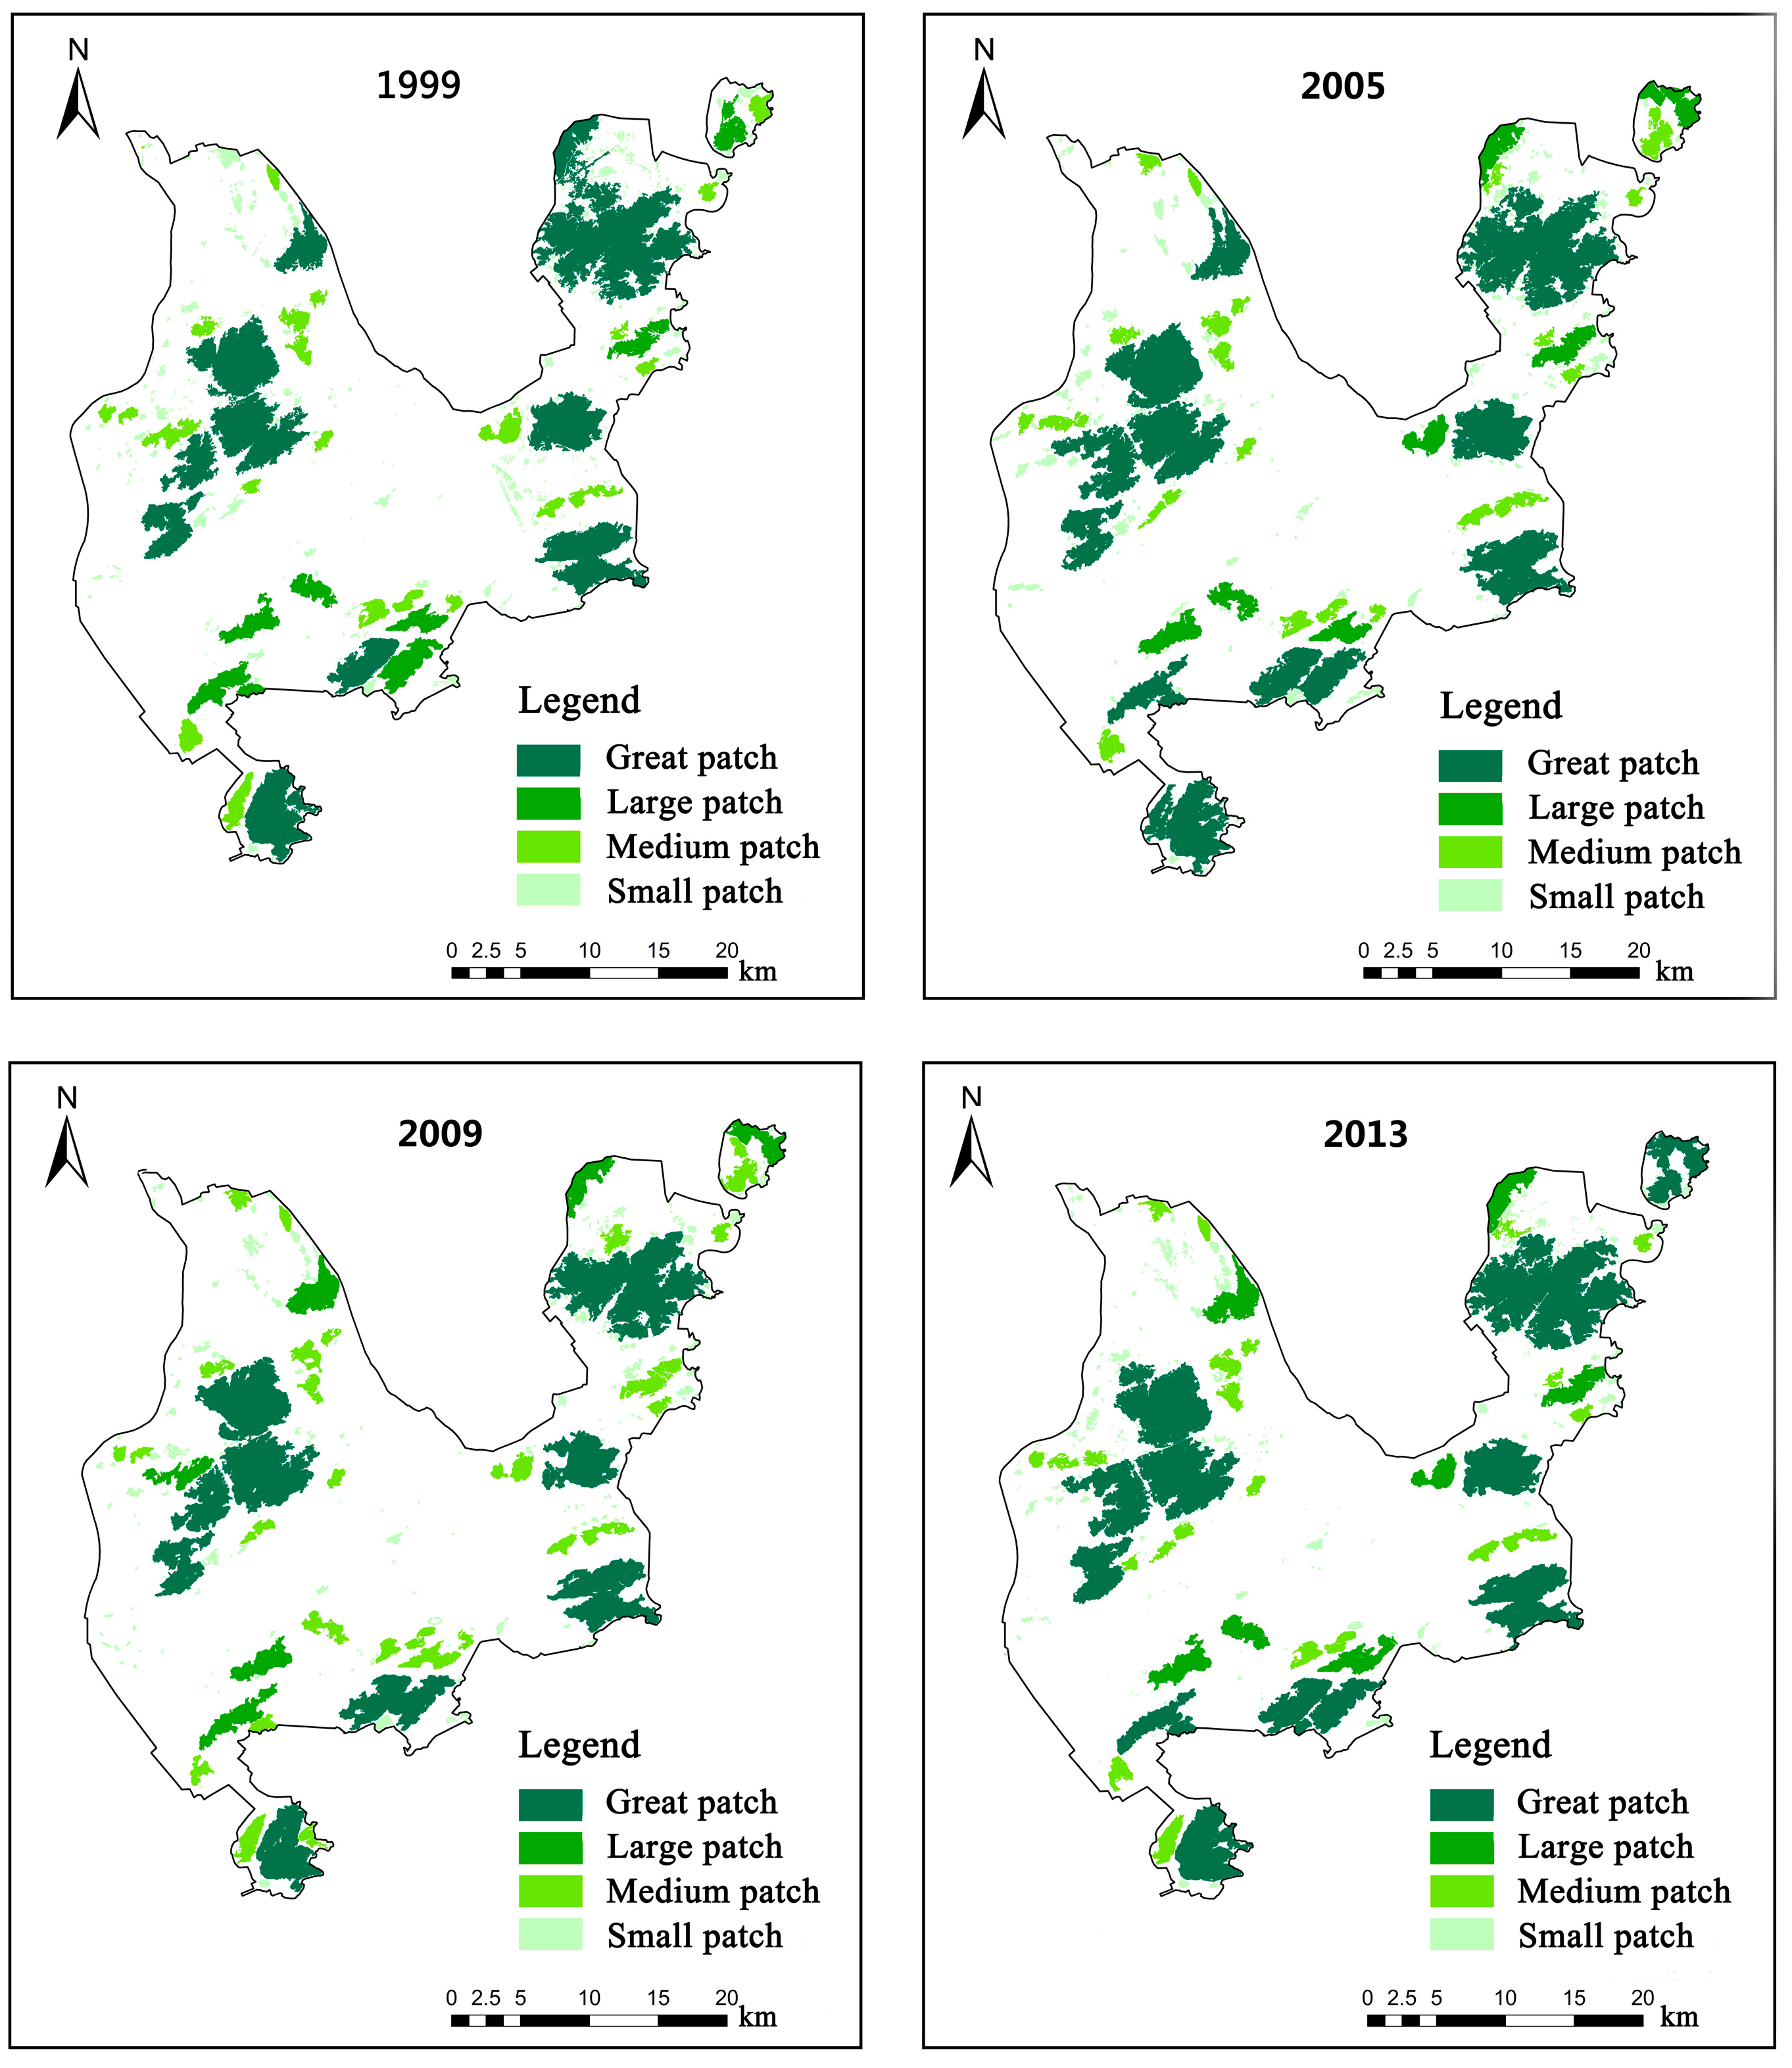
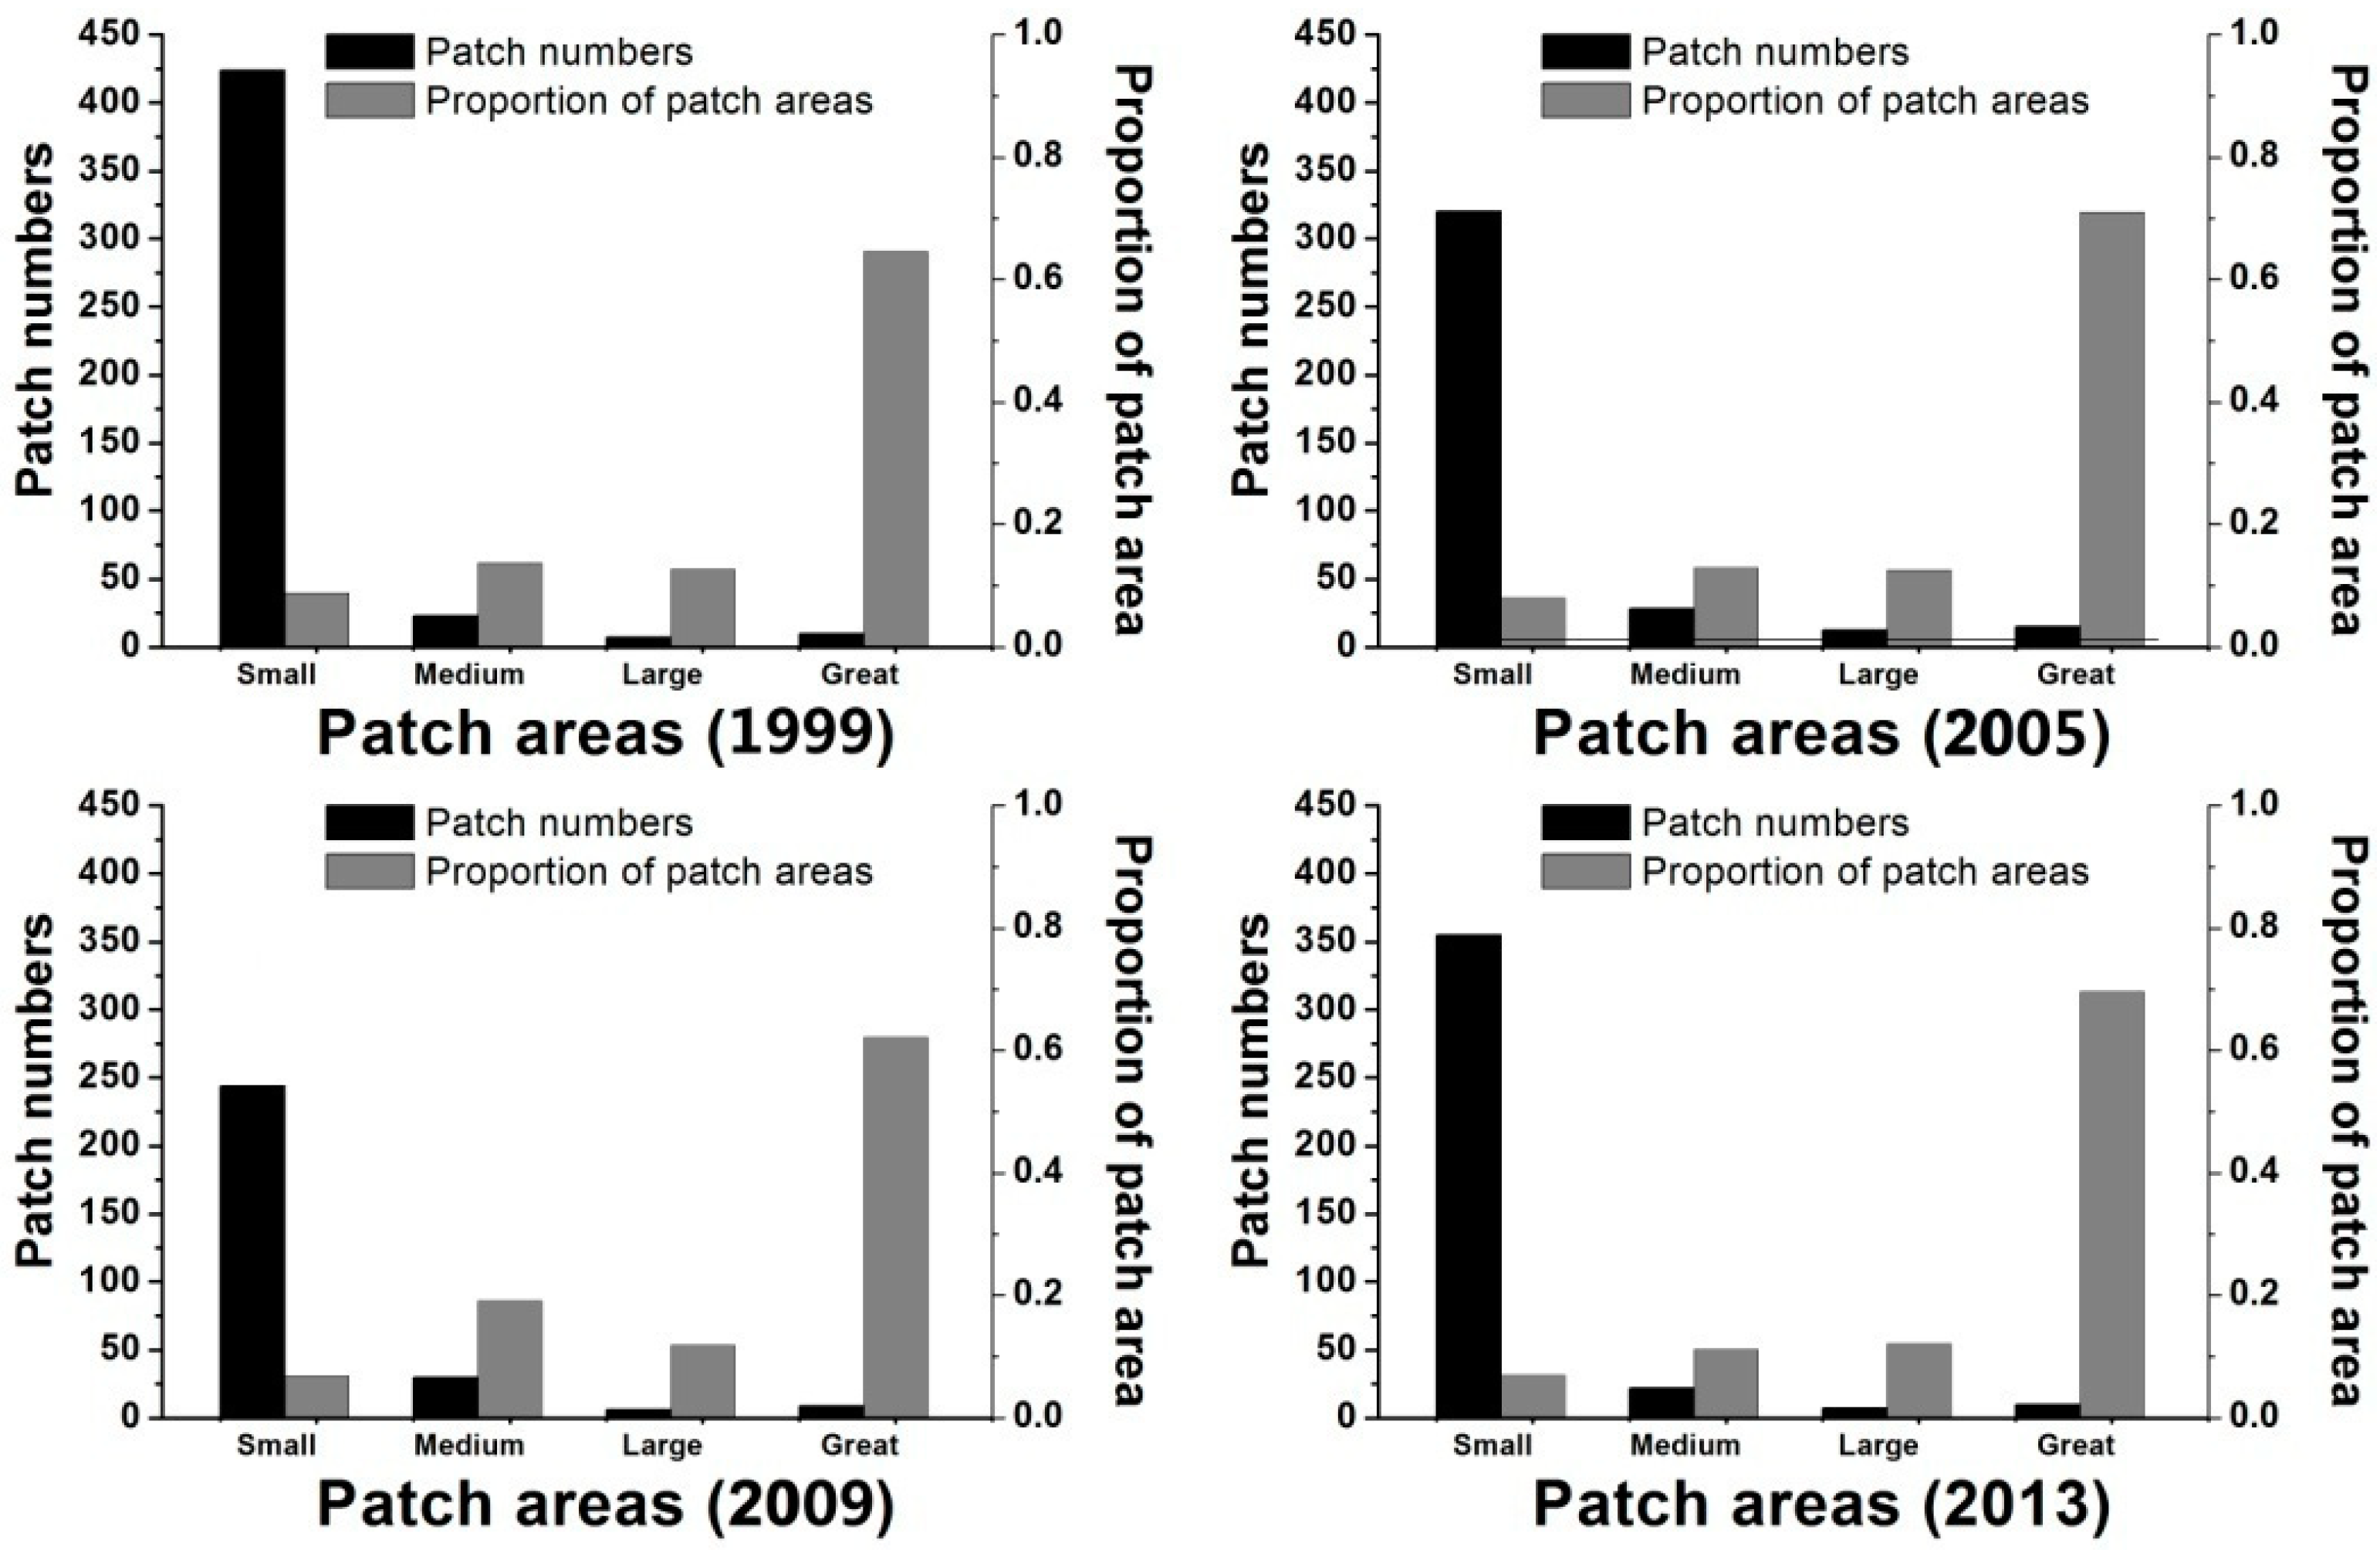
3.1. Spatiotemporal Distribution of Forest Patches

The urban forestland areas for the four studied years were calculated by using the GIS software. The observed changes in forestland area in the study area between 1999 and 2013 are displayed in Figure 2a. The area of forestland accounted for 24.24% of the total study area in 1999, and decreased to 24.12% and 22.17% in 2005 and 2009, respectively. Between 2009 and 2013, the forestland area increased to 25.56% of the total study area.
The spatial distribution of forestland is displayed in Figure 3. The observed changes of forestland area showed that the forestland in Zhuhai City experienced a fragmentation and loss of forest areas during 1999–2009, for instance, it could be observed in Figure 3 that the great patches in the northeast part of Zhuhai City had experienced a fragmentation during this period. At the same time, the area of forest-land decreased according to the results in Figure 2a. However, the increase of forestland area from 2009 to 2013 was shown to improve the landscape connectivity. The distribution patterns of forestland during the study period help us to investigate the dynamics of landscape connectivity more effectively.
Considering the potential development of Zhuhai, the National Development and Reform Commission of China has assigned Zhuhai as the center of the western bank of the Pearl River estuary in a national urban development strategy for the next decade (2008–2020). In order to achieve this goal, Zhuhai had made a series of polices to protect the urban eco-environment.
Some specific policies had been implemented in these plans include:
  • The forest coverage rate in the natural reserve and forest parks in Fenghuang Mountain and Huangyang Mountain increased to at least 85% and the areas of the natural reserve enlarged. The same measures were implemented in other mountains in Zhuhai City.
  • The eco-environment in Qiao island which is located in the northeast part of Zhuhai City had been recovered and improved. Other plans had been made such as forbidding destroy the plants in mountains, rescuing the destroyed forest land and restoration projects, similar measures had been adapted and implemented in another island such as Gaolan island.
  • The quarries in natural reserve were closed and the destroyed eco-environment in these places was restored through planting the suitable tree species and implementing the ecological restoration work.
There were also many other specific strategies in these plans about the protection and restoration of the forest land. So, the areas of forest lands had recovered during this period, which in this case the results in our data analysis showed that the areas in forest lands increased in 2013.
The changes in the number of patches per patch area level (small patch, medium patch, large patch and great patch) and their corresponding patch areas are illustrated in Figure 4. The smallest total patch number was 289 in 1999 and the proportion of small patch area was 84.43% which indicated that small patches disappeared during the urbanization from 1999 to 2009. Additionally, all the small patch numbers in the four studied years were higher than other patch types, however the area of the small patches only occupied 7–9% of the total patch area during the study period. The numbers of medium patch accounted for 10.38% in 2009 which was that biggest proportion in the studied period. The proportions of medium patch area to total patch area was 19.06% in 2009 which was also the biggest proportion in the study period. The numbers of large patch only accounted for about 1.5–2.5% of total patch numbers in the study period and the corresponding proportions of large patch area to total patch area were about 11.41% to 12.72%. As for the great patches, it is noteworthy that even though their numbers only accounted for 2–3% in the study period, the proportions of great patch area to total patch area were 64.58%, 69.85%, 62.14% and 69.60% in the study period, respectively, which were the largest proportions of all patch types.
The characteristic of the forestland in Zhuhai City showed that it was distributed as numerous small patches which covered small areas and a small number of great patches which covered the largest areas in the study area in the study period.

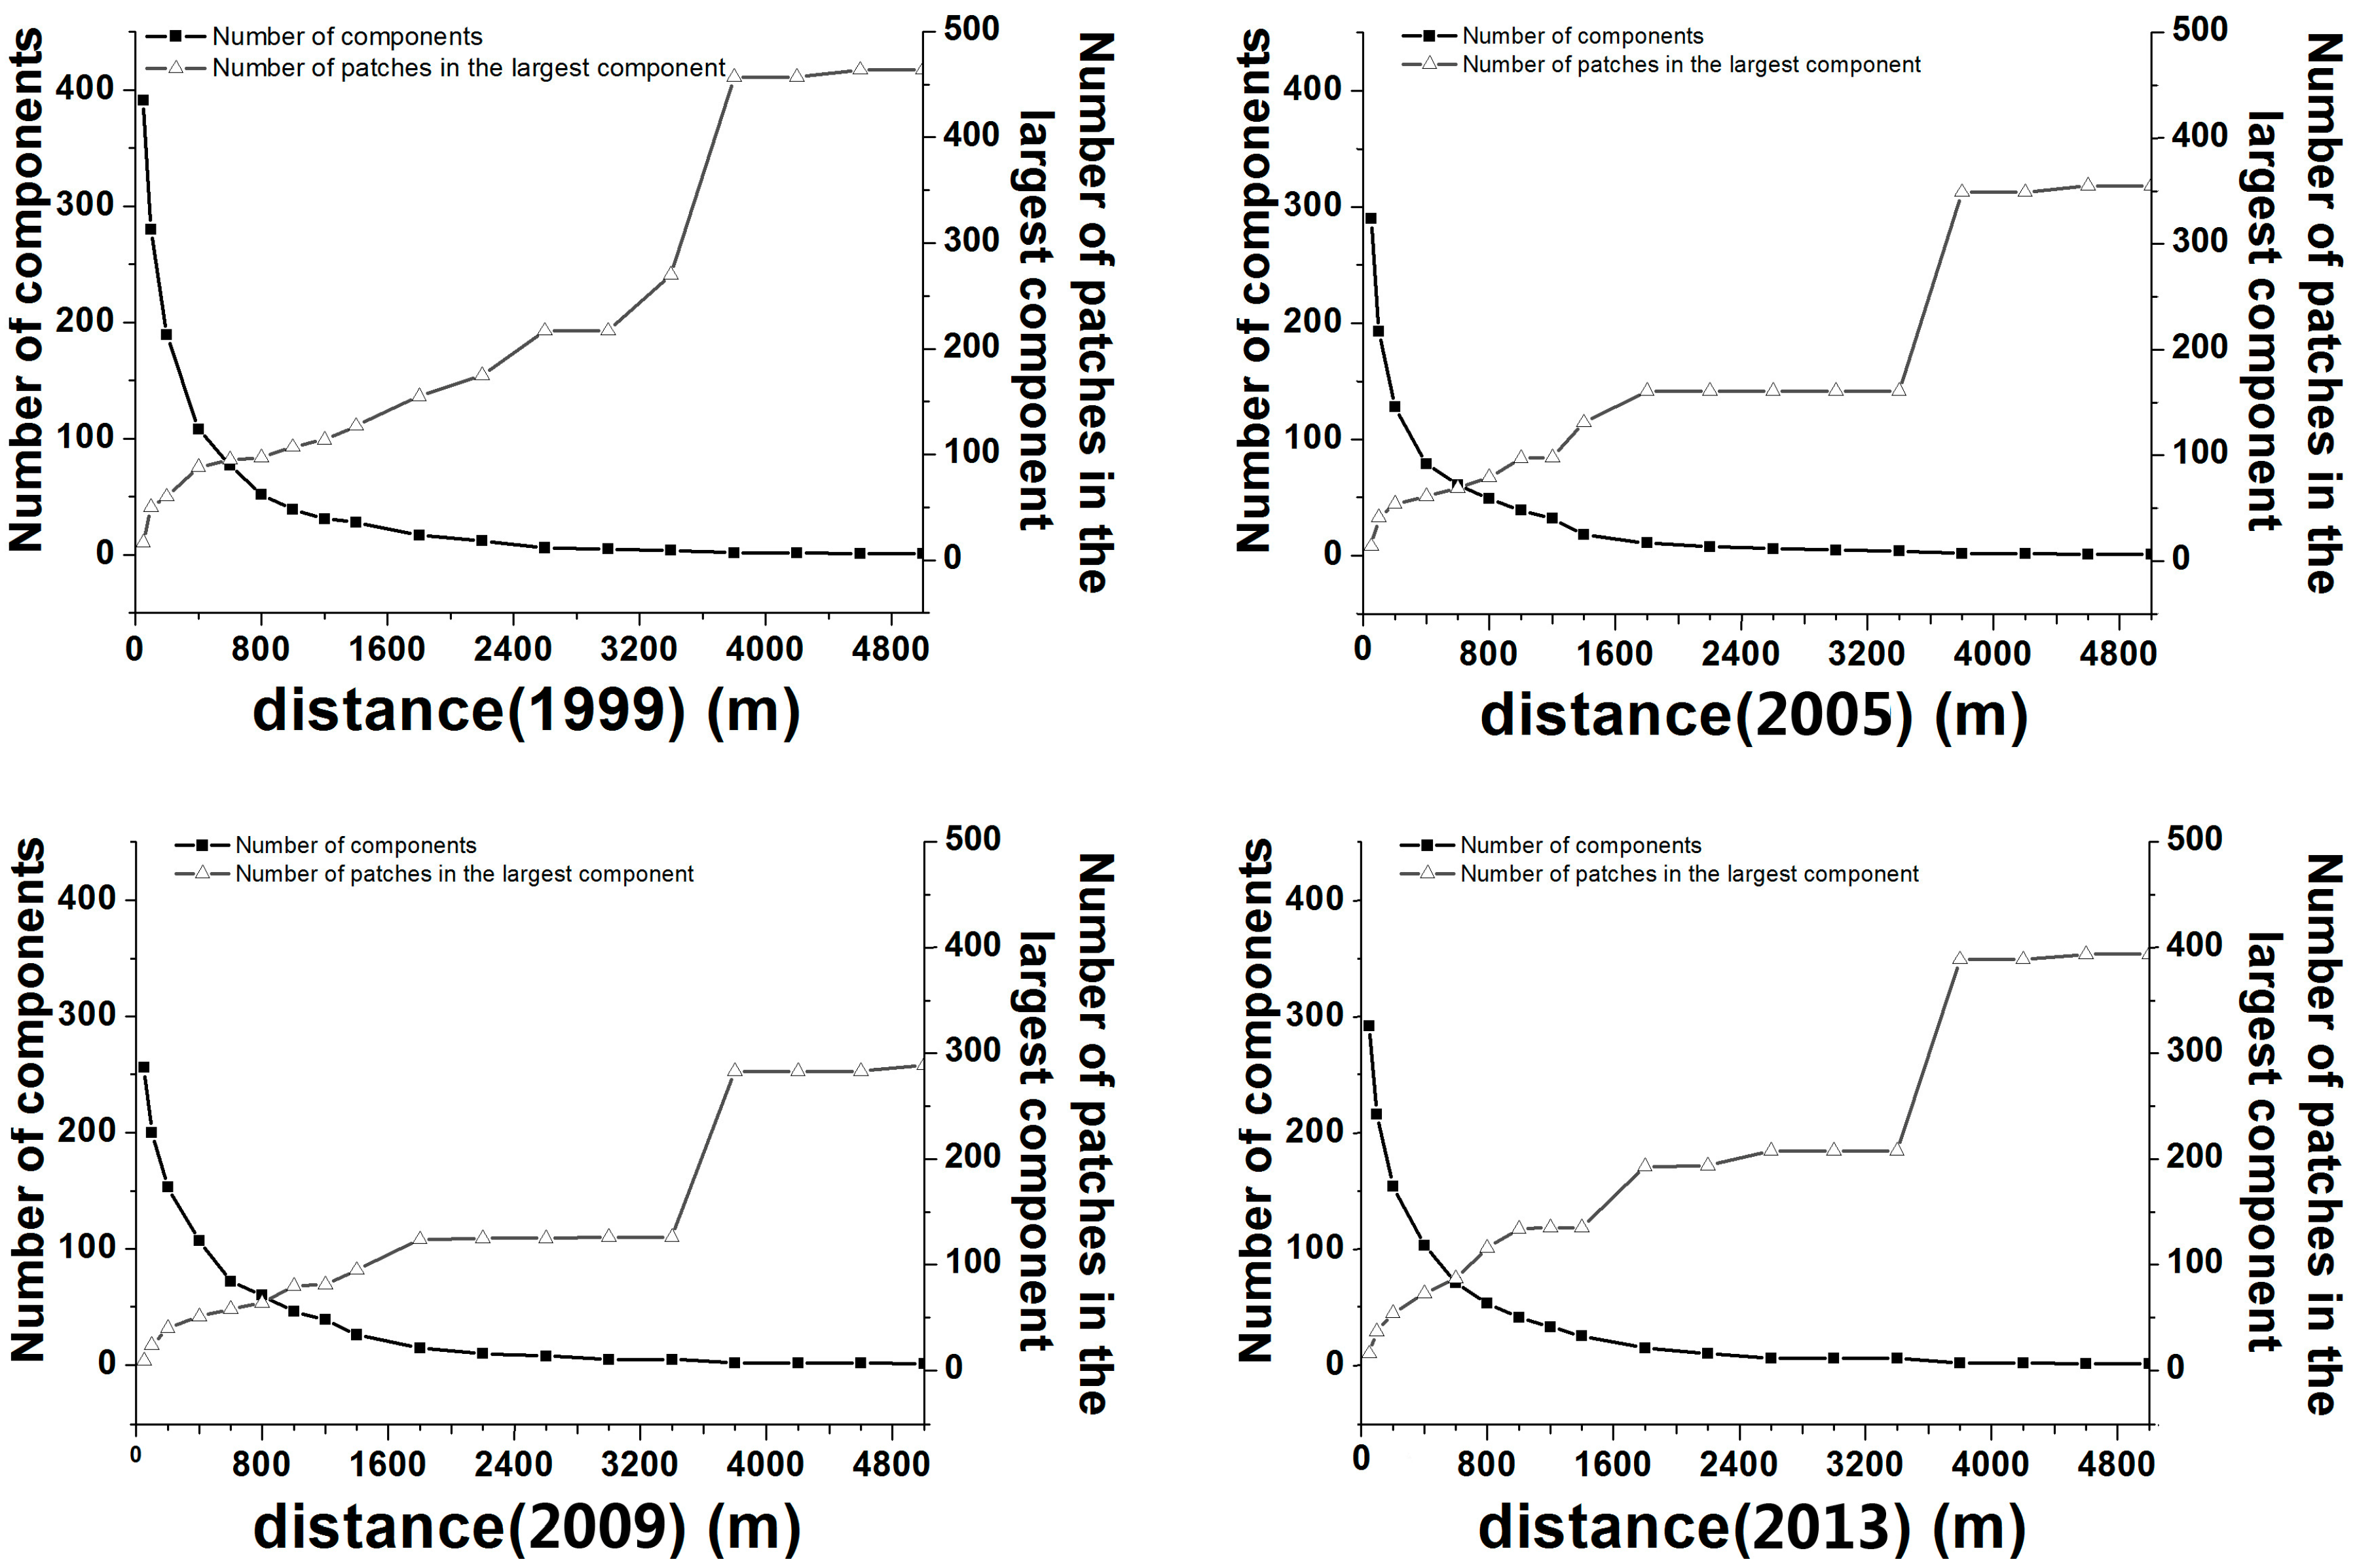
3.2. Analysis of the Threshold Distance

The changes in the values of the Number of Components (NC) and Number of Patches in the Largest Component (NPLC) are shown in Figure 5. Specifically, when the threshold distances were changed from 50 to 4600 m, NC decreased to 1 in three years of 1999, 2005 and 2013, and NC decreased to 2 in 2009. The NPLC were at their maximum when the distances increased to 4600 m in the study period. However, increasing the threshold distances than 4600 m, almost no changes were observed in the four studied years. This indicated that the forest patches in Zhuhai were connected with each other and that landscape types belong to the same type. This means that the landscape types were relatively homogeneous and that the landscapes were consistently connected.
The importance of all forest patches according to the dIIC values with various areas at different threshold distances are displayed in Figure 6. This clearly indicates that large patches had higher patch importance than medium patches and small patches at the same threshold distance. With an increase in the threshold distance, the small and medium patches became more important. Large patches were highly important in landscape connectivity because they have higher IIC values than smaller patches. The landscape connectivity values are deeply dependent on the dispersive abilities of species, so the threshold distances range from a few tens of meters to thousands of meters. Compared with a single threshold distance, the results would be more reliable and meaningful when calculate the IIC value at four distances. It was therefore necessary to set a series of distances. In order to obtain comparable results and overcome the limitations when only selecting one threshold distance, according to Figure 6, we selected four dispersal threshold distances (1000 m, 2200 m, 3400 m and 4600 m) to calculate the IIC value and node importance.

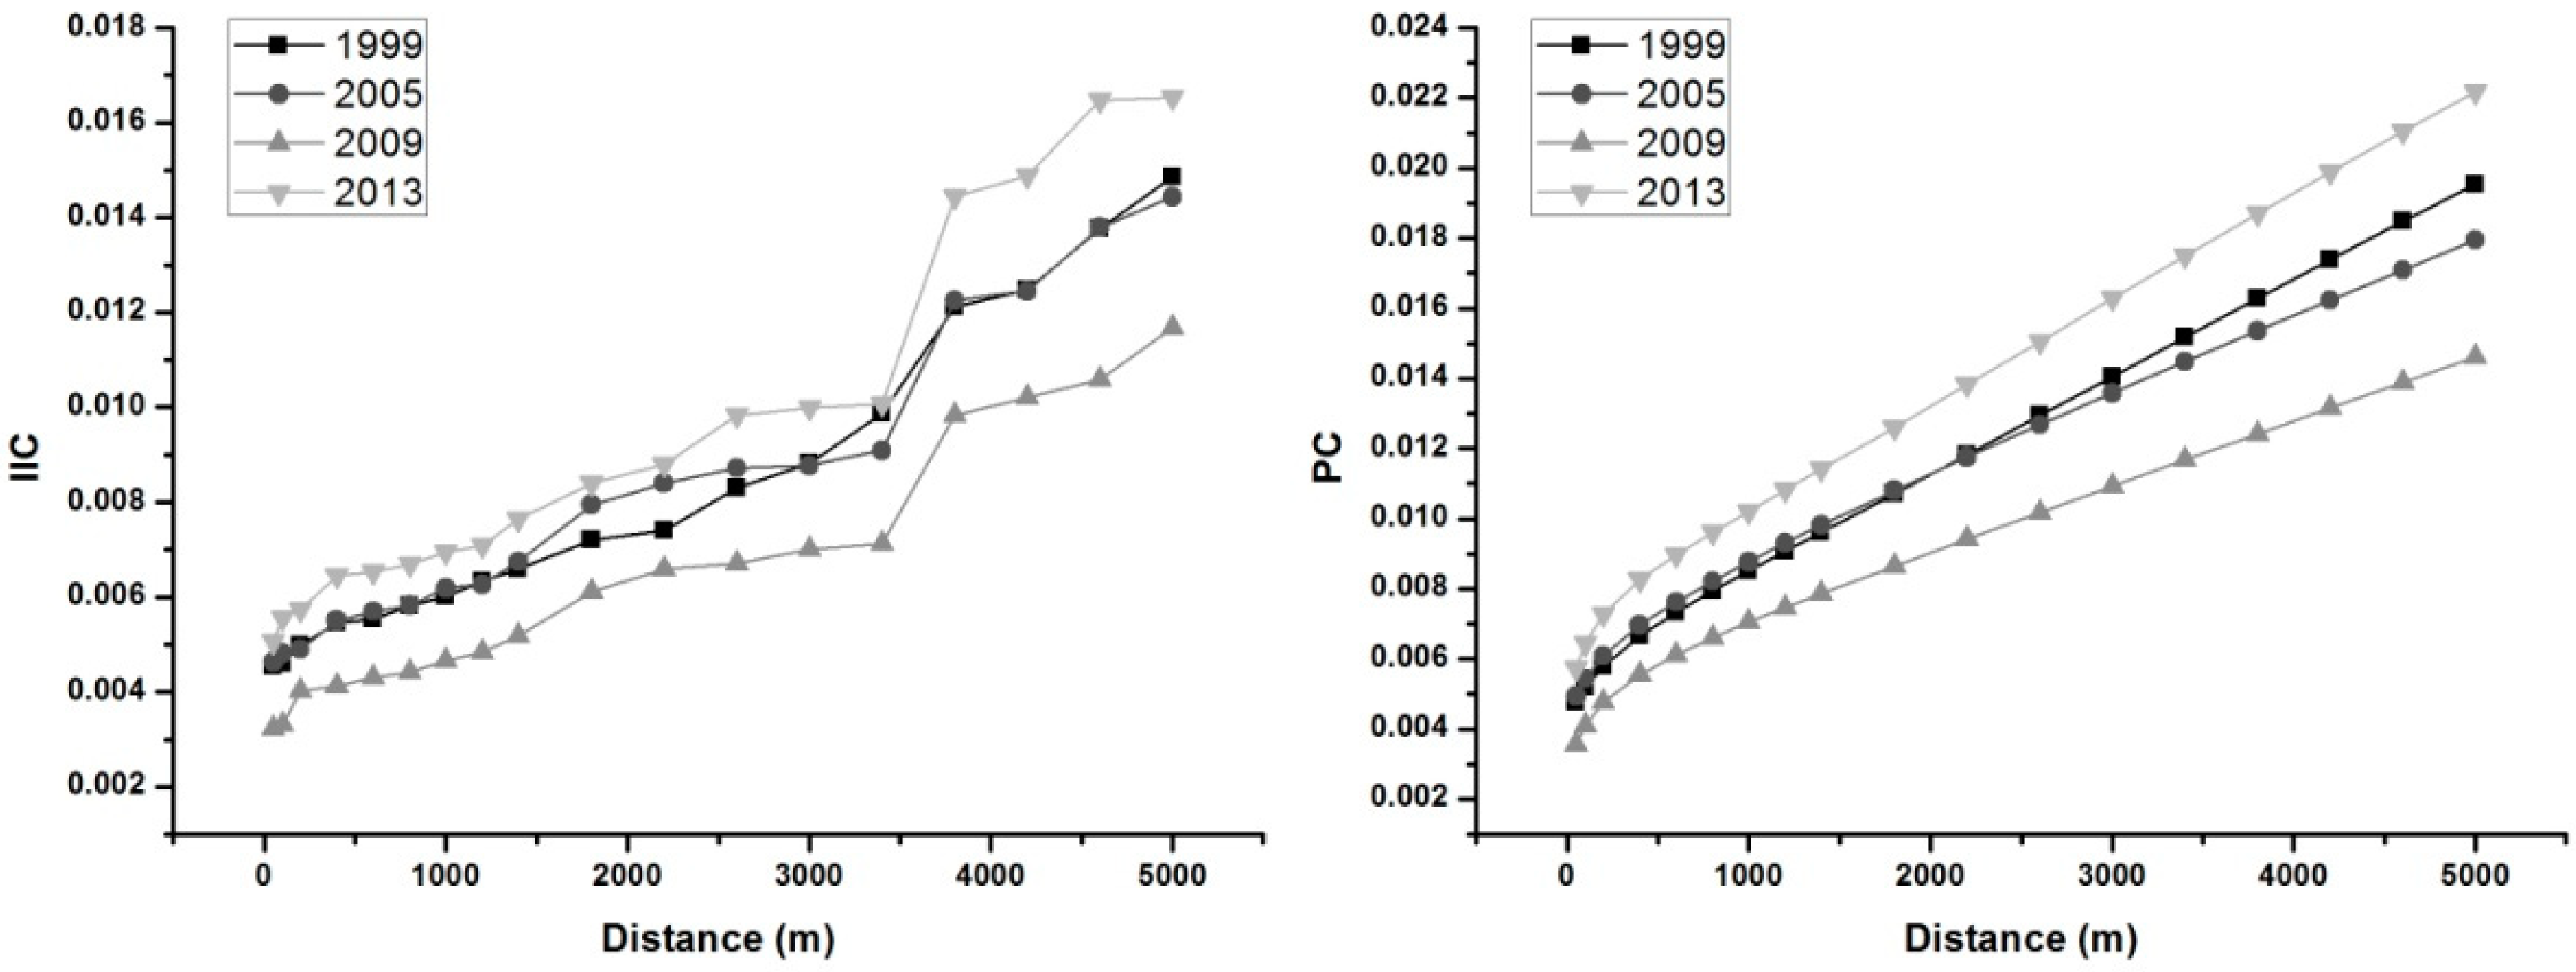
3.3. Dynamics of Forest Landscape Connectivity from 1999 to 2013

The values of IIC and PC were used to quantitatively assess the overall connectivity in the study area. The change of values of IIC values from 1999–2013 is shown in Figure 7. The IIC values increased significantly with the increase of threshold distance during the whole study period. Furthermore, the IIC values changed significantly at the specific threshold distance. Table 2 shows several values of IIC at the selected threshold distances of 1000 m, 2200 m 3400 m and 4600 m This shows that the values of IIC changed over time and that the smallest values were observed in 2009 at every threshold distance, which were 0.00466, 0.00665, 0.00712 and 0.01058, respectively, and that the biggest values of IIC in 2013 were 0.00695, 0.00879, 0.01007 and 0.01647.
The change in the PC values is shown in Figure 7. In the study period, PC values increased rapidly within the threshold distance of 1000 m and then linearly increased with the increase of threshold distance. Ranking the PC values of four years at specific distance including 1000 m, 2200 m 3400 m and 4600 m, we observed that the smallest PC value was in 2009 and the biggest PC value was in 2013 (Table 2). Figure 2a shows the change of the total forest areas in the four years of 1999, 2005, 2009 and 2013, from which it can be seen that the forest landscape connectivity is largely influenced by the patch areas, which means that the larger the overall patches areas were, the higher the overall landscape connectivity. Additionally, from the results mentioned above we also see that the higher the threshold distance, the better connected were the forest patches.

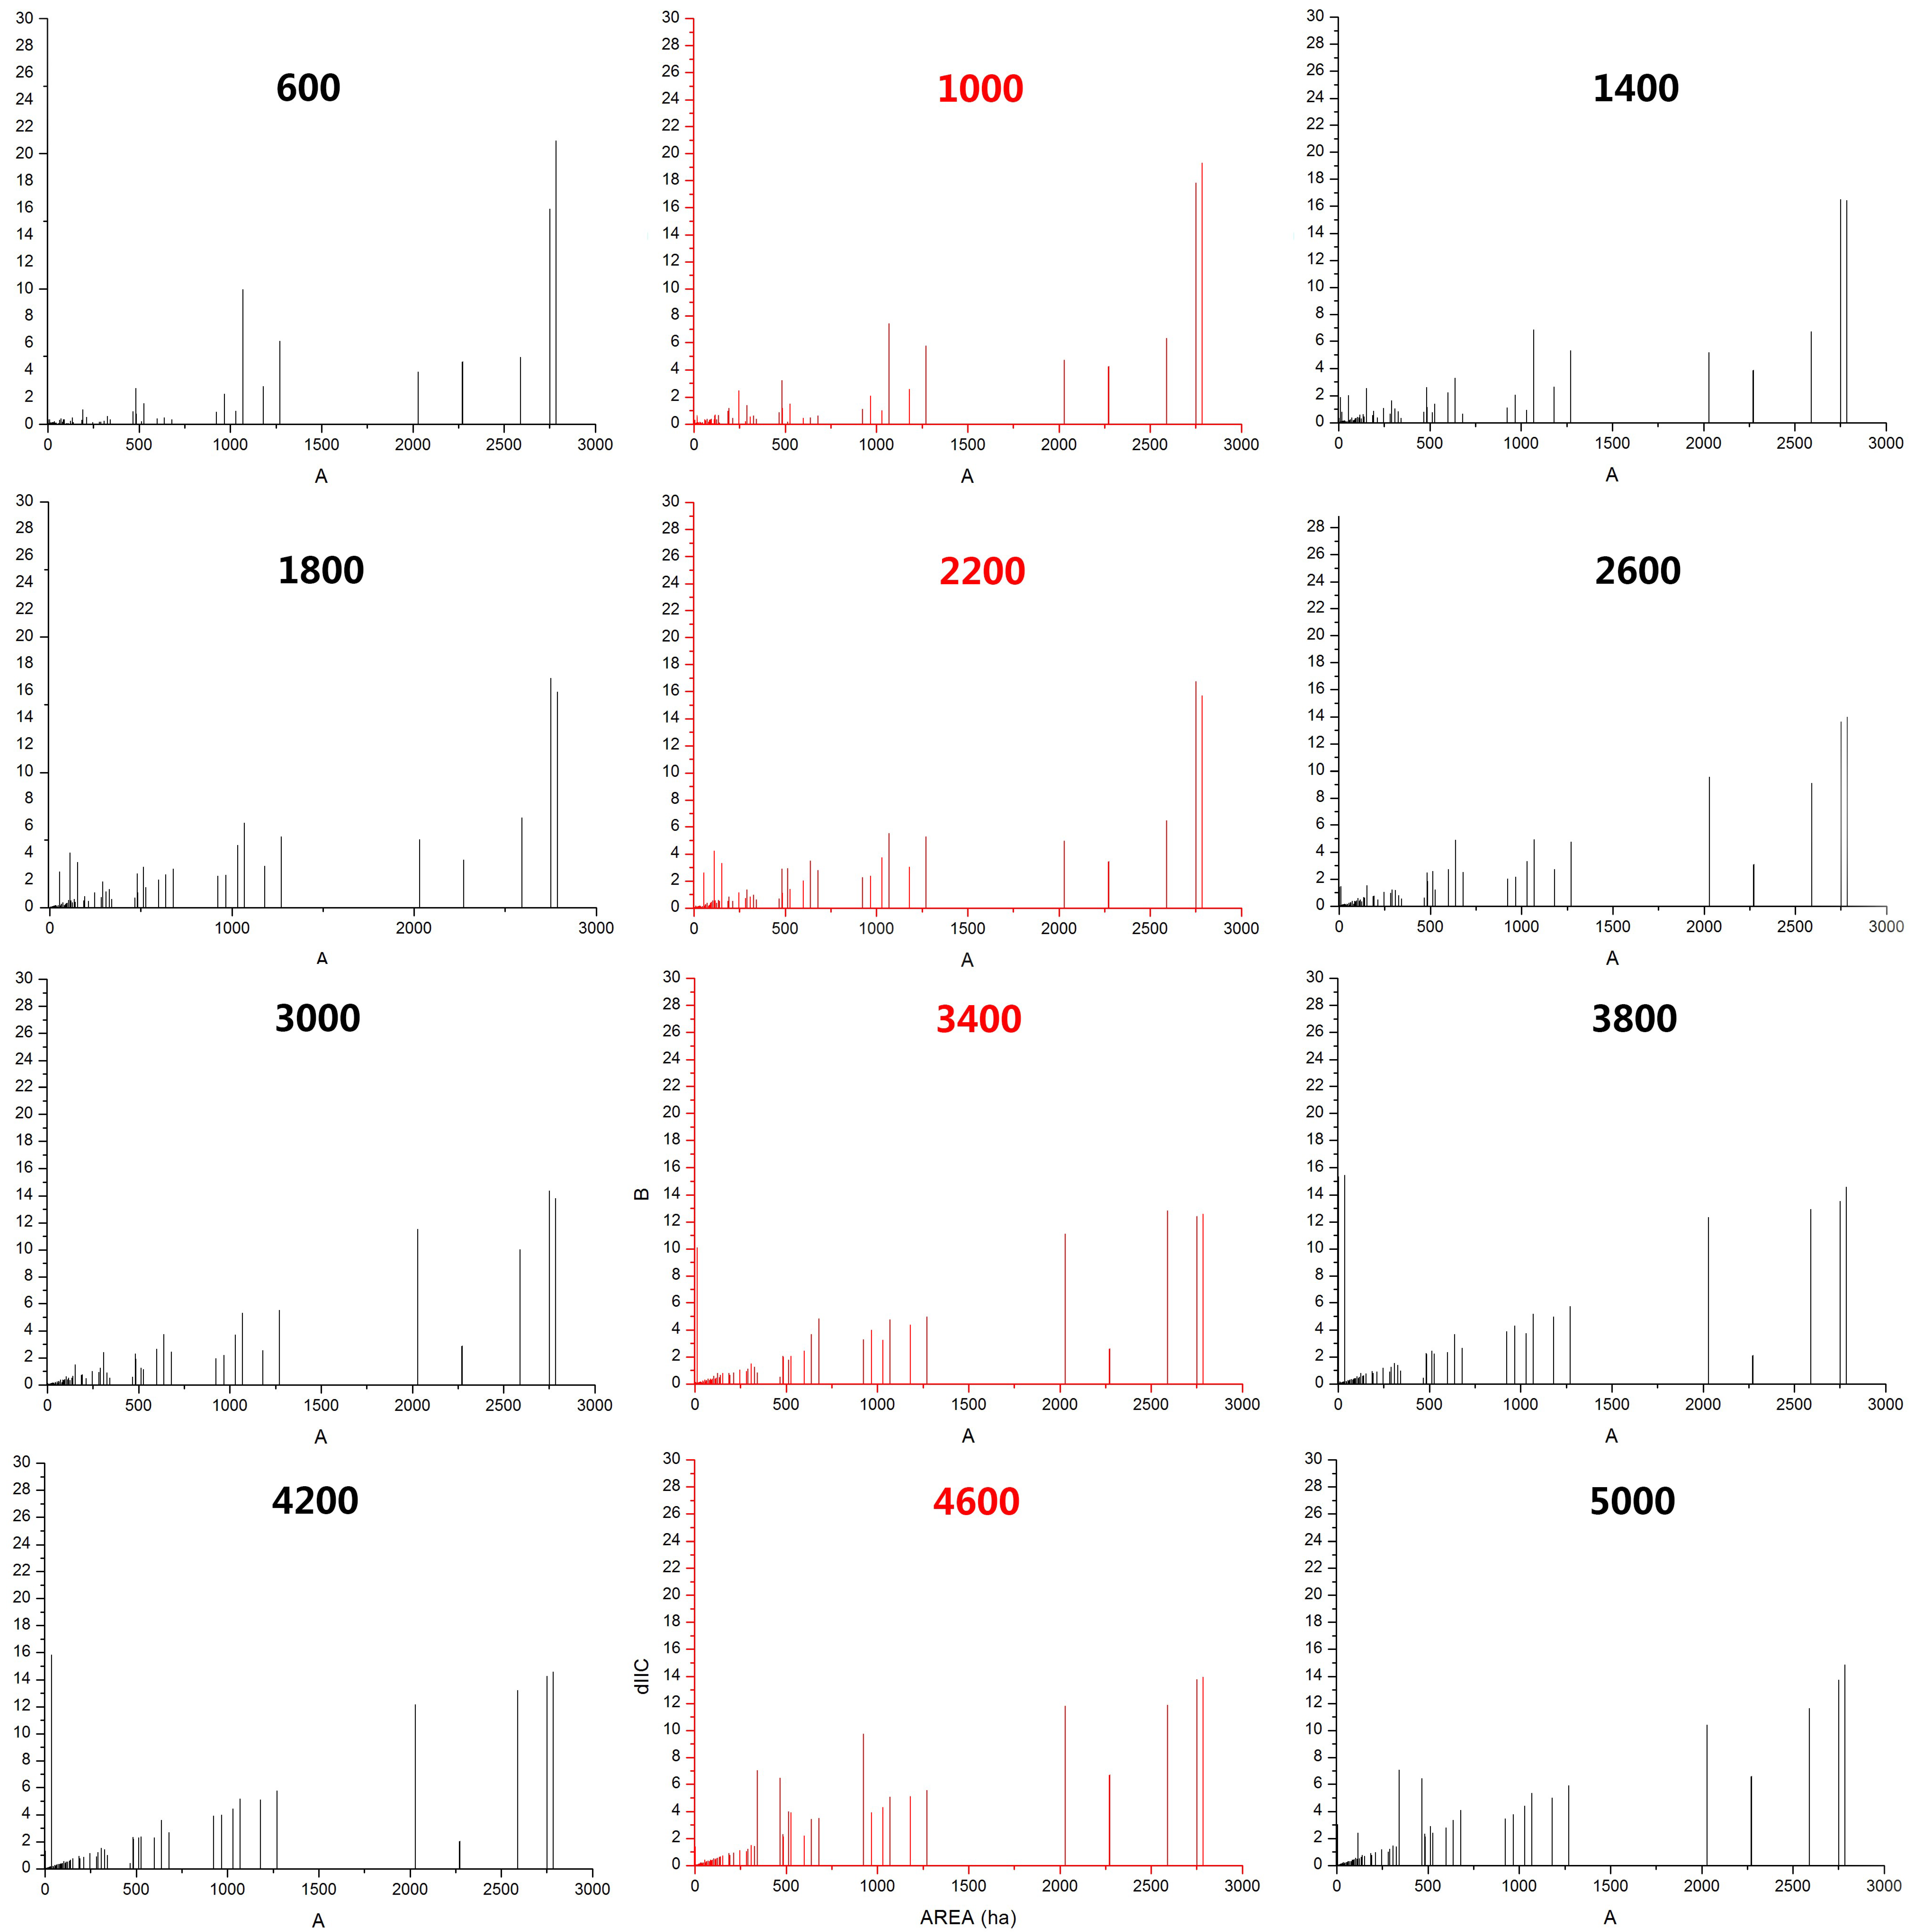
3.4. Dynamics of Patch Importance Based on the dIIC Value

The importance of forest patches was classified into five levels according to the dIIC values, very high importance (dIIC ≥ 70%); high importance (70% > dIIC ≥ 50%); medium importance (50% > dIIC ≥ 30%); medium low importance (30% > dIIC ≥ 10%) and low importance (dIIC < 10%).The importance of forest patches was represented by the values of dIIC, and the results showed that the distribution of the patch importance varied greatly with the increase of threshold distance in the four years of 1999, 2005, 2009 and 2013 (Figure 8). In Figure 8, we can observe the significant characteristics that most of the small patches and medium patches were low importance patches, while the importance of patches was steady for large and great patches. For example, the dIIC values of patches with large or great patch areas were more than 10%. All of the very high important patches (dIICvalues more than 70%) were great patches at the four threshold distances during the whole study period.
In 1999, the number of patches (dIIC > 10%) increased from 8 at 1000 m to 15 at 4600 m. It is noteworthy that a medium patch with areas of 111.71 ha became from the low importance patches (dIIC < 10%) to medium low important patches (30% > dIIC ≥ 10%) at 2200 m while the other patches belonging to this importance level were large and great patches.
In 2005, the number of patches (dIIC ≥ 10%) ranged from 8 at 1000 m to13 at 4600 m. Additionally, there were two small patches became from the low importance patches (dIIC < 10%) to the medium low importance patches (30% > dIIC ≥ 10%) at 2200 m, and one small patch only with patch areas of 55.58 ha became from the low importance patches to high importance patch (dIIC ≥ 50%) at 4600 m.
In 2009, the number of patches (dIIC ≥ 10%) slightly increased from 11 at 1000 m to 13 at 4600 m. There were also two medium patches with areas of 274.41 and 310.68 ha became from the low importance patches to the medium low importance patches at the threshold distance of 1000 m and 2200 m, respectively.
In 2013, the number of patches (dIIC ≥ 10%) ranged from 6 at 1000 m to 17 at 4600 m, which was the highest number in the study period. There were also great changes in three patches with medium areas (164.27 ha, 299.34 ha and 460.53 ha), the first two of which became the medium low importance patches under the threshold distance of 2200 m and another one became the medium low importance patches (30% > dIIC ≥ 10%) under the threshold distance of 4600 m.
In 1999, 2005, 2009 and 2013, an increasing number of patches were found to be more important with the increase of threshold distance. This indicates that more important patches would be identified if the threshold distance expanded. Additionally, the medium patches and small patches also played important roles in maintaining landscape connectivity and improving the protection of natural resources.

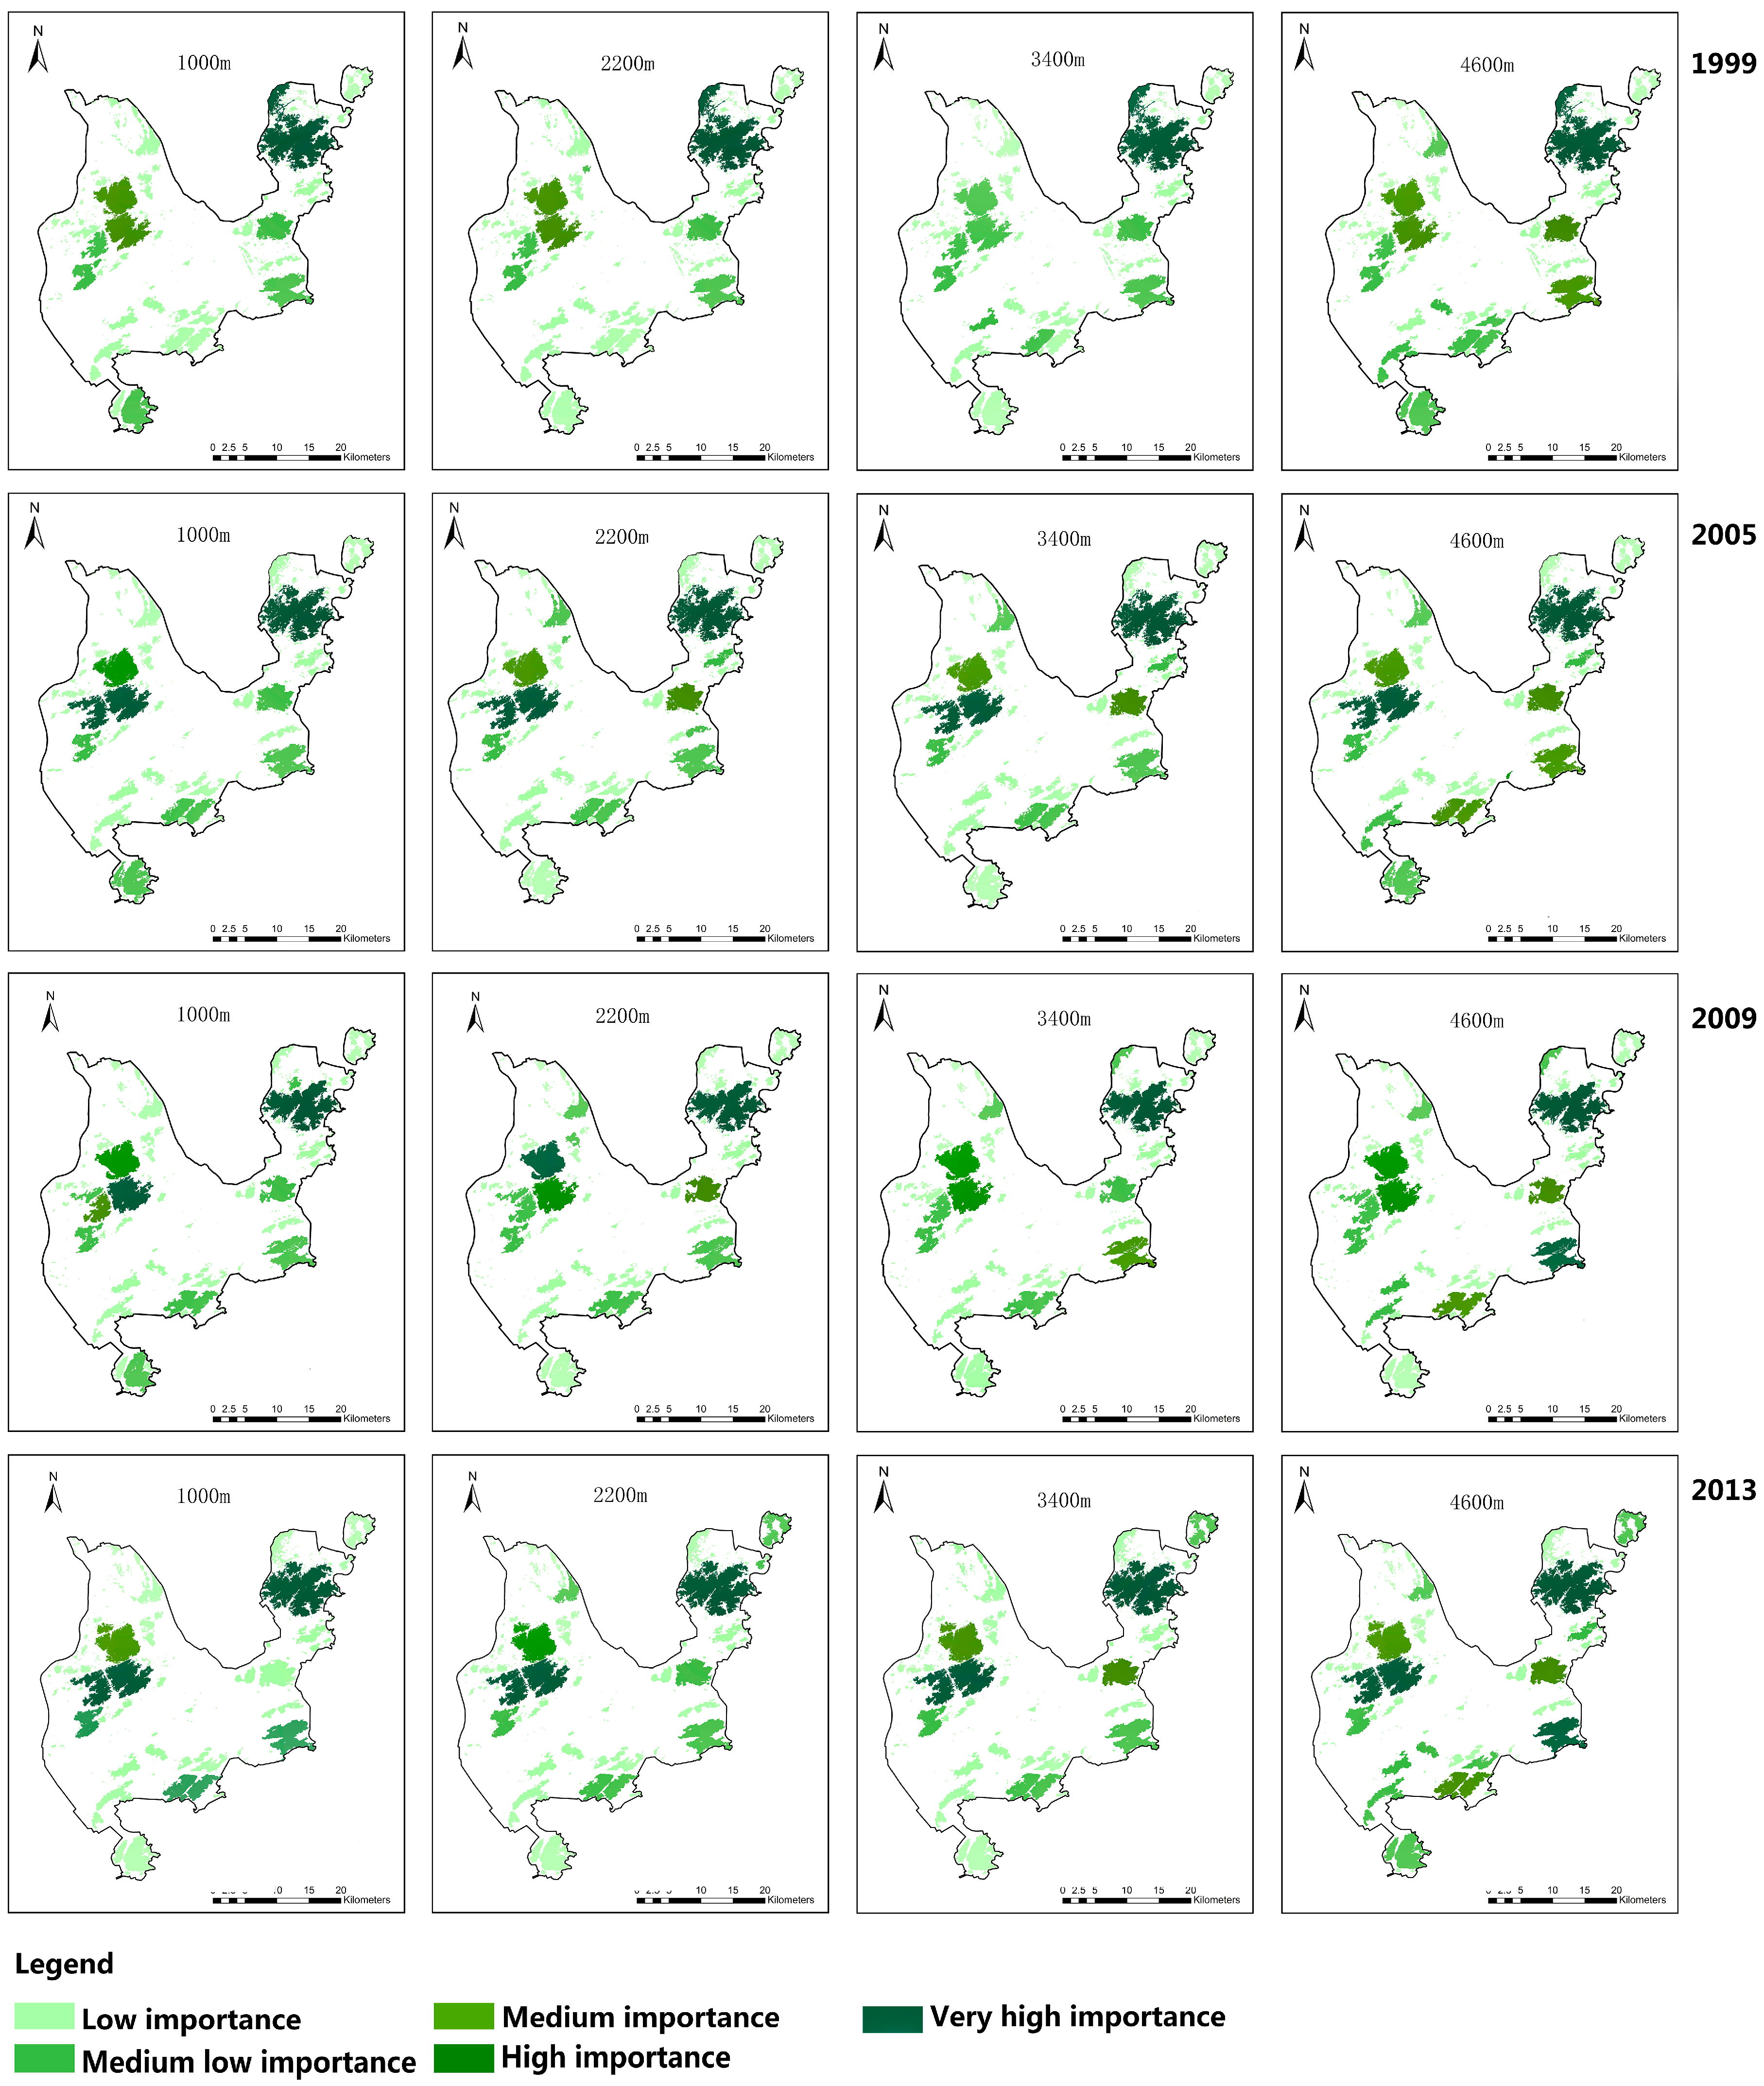
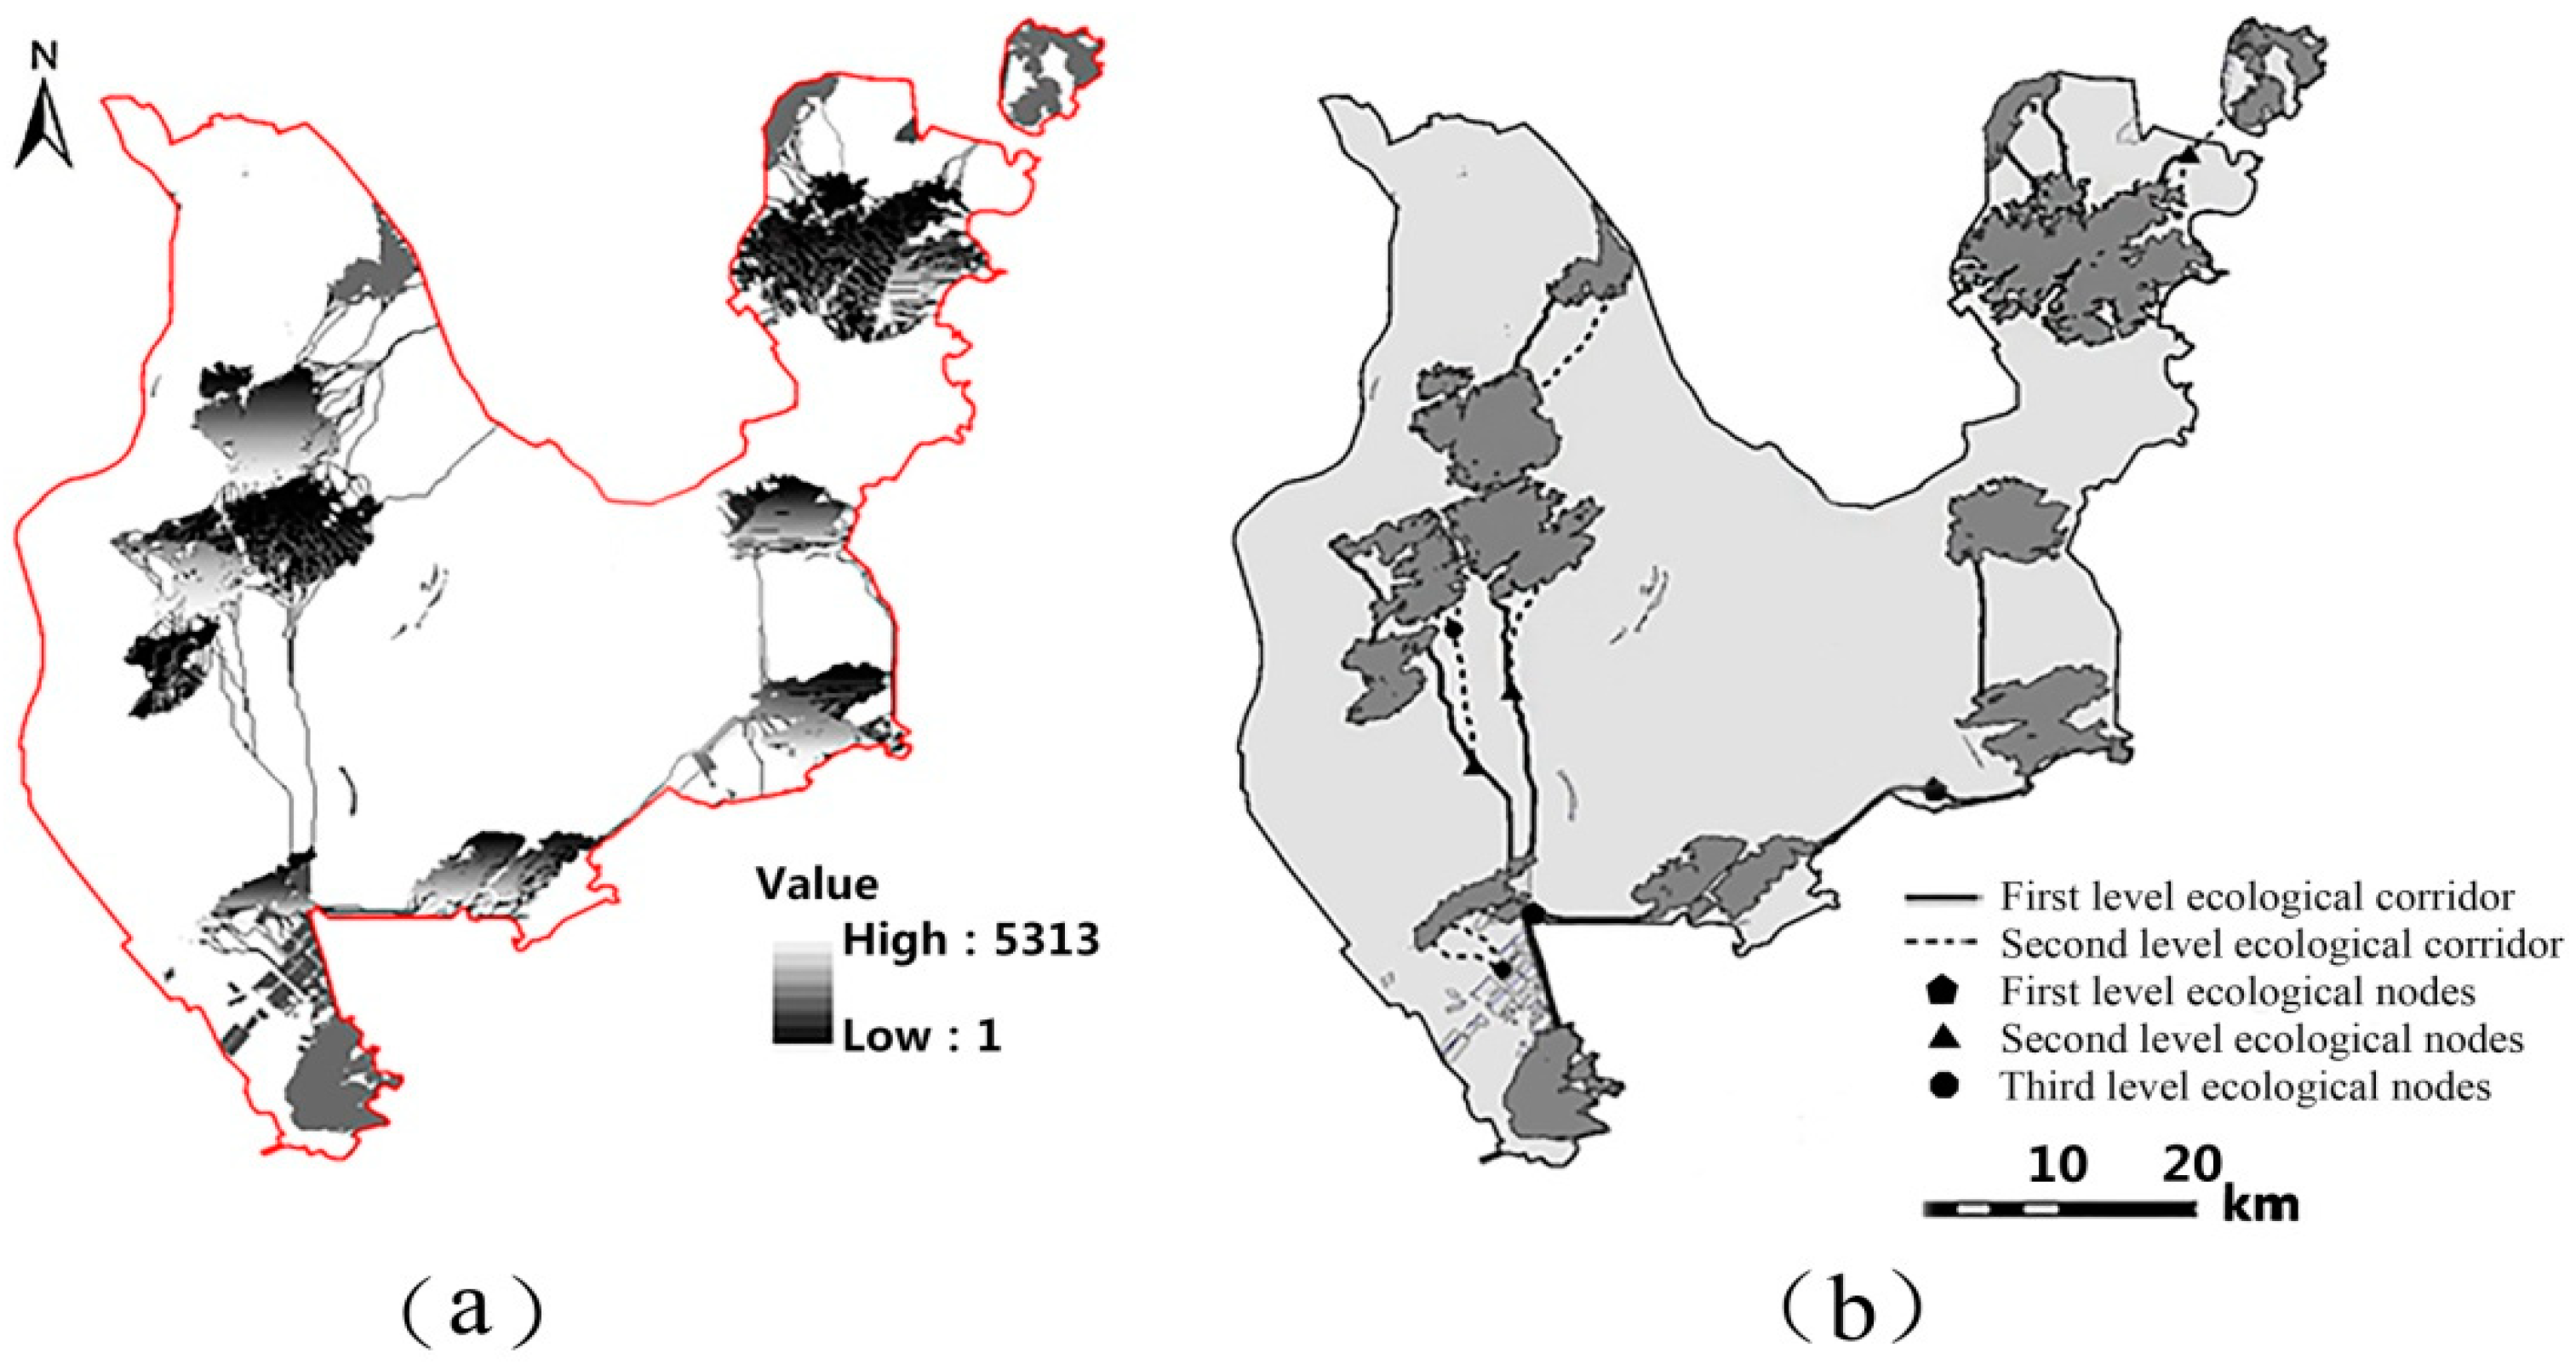
3.5. Construction of Ecological Network Based on Forest Distribution

Establishing ecological networks can strengthen the landscape connectivity and protect biodiversity effectively. In constructing an ecological network, it was first necessary to select the important patches as the ecological source points. In this study, we set important patches as the source points based on the results of dIIC values, and all of the selected patches were classified into three parts including the eastern part, southern part and western part of the study area according to their locations. We then established the corridors between them and the source point. The minimum cost distance of corridors was calculated, and the results are shown in the Figure 9a.
Ecological corridors were categorized into two levels representing the different functions as shown in (Figure 9b). The first level corridors connecting the three parts of important patches and second level corridors were located between the parts within the important patches. The ecological corridors of the eastern part of the study area showed that there were no ecological corridors between forest patches in the northeastern and southeastern part the study area, which indicated that the degree of landscape connectivity in this area was very low.
Therefore, it was very important to construct forest patches in the middle of two ecological source points which are not connected with each other. Compared with the ecological corridors in the east of Zhuhai City, the ecological corridors in the western part connect the forest patches effectively, which could make a large contribution to the improvement of landscape connectivity and protection of ecological biodiversity. Future construction activity should avoid the ecological corridors. The ecological corridors in the southern part of Zhuhai City were important because they played an essential role in connecting forest patches in the eastern and western parts, so the forests in the southern part should be protected, and especially fragmented forest land. Preventing new built up construction will be beneficial to recovering the broken ecological corridors.
The changes in areas of farmland, forestland and construction land are shown in the same period (Figure 10). The figure clearly indicates a dramatic decrease of cultivated areas and an increase of urbanized area during the study period in Zhuhai City. These trends are accompanied by a decrease of forest land in 1999–2009 and then an increase in 2013. These trends were the results of the environmental protection measures mentioned above.

3.6. Other Factors Which Could Also Affect the Patch Importance

In this study, three functional connectivity indices (dIICintra, dIICflux and dIICconnector) were selected to sufficiently investigate the landscape connectivity in Zhuhai City. The correlations between functional connectivity indices and patch area at two levels are shown in Table 3 and Table 4.
Table 3 shows the results of correlation coefficients between the four indices (dIIC, dIICintra, dIICflux and dIICconnector) and the areas of all patches. The dIIC was positively correlated with the patch area at the significance level of 0.01. It could be observed that the correlation coefficients between dIICintra and patch area stable when the threshold distance increases. The correlation coefficients between dIICintra and patch area were 0.892, 0.920, 0.905 and 0.920 in 1999, 2005, 2009 and 2013, respectively, which indicated that the change of threshold distance did not influence the correlation between the dIICintra and patch area. The coefficients between dIICflux and patch area were higher than those between dIICconnector and patch size under four threshold distances (1000 m, 2200 m, 3400 m and 4600 m) in all periods. The coefficients between dIICflux and patch area increased with the increasing distance, which indicates that the threshold distance exerted influence on the correlations of dIICflux and patch area. The lowest correlations occurred between the dIICconnector and patch areas due to the connector fraction influenced by patch position instead of other factors. Therefore, a patch with high dIICconnector values of indicated that it was regarded as a stepping stone between habitat patches in study areas, and makes contributions to the landscape connectivity.
All dI values (dIIC, dIICintra, dIICflux and dIICconnector) of forest patches were ranked and the 10 most important patches for each kind of dI values were selected. We subsequently evaluated the correlation coefficients between four indices (dIIC, dIICintra, dIICflux and dIICconnector) and the patch areas of the 10 most important patches.

Author Contributions

All authors have contributed to the development of the research and in the elaboration of this article; N.C., C.-C.F. and L.G. developed the conceptual framework; N.C. and J.L. performed data processing and analysis; D.W. and J.L. offered advice on the study; N.C. wrote the paper; C.-C.F. and L.G. gave valuable comments and revised the paper.

Funding

The work presented in this paper was supported by the key research project of Chinese Ministry of science (2017YFC0505601) and technology and the National Natural Science Foundation of China (31370480).

Acknowledgments

We are grateful for the comments of the anonymous reviewers, which greatly improved the quality of this paper.

Conflicts of Interest

The authors declare no conflict of interest.

References

  1. Seto, K.C.; Michail, F.; Burak, G.; Reilly, M.K. A Meta-Analysis of Global Urban Land Expansion. PLoS ONE 2011, 6, e23777. [Google Scholar] [CrossRef] [PubMed]
  2. Schell, L.M.; Ulijaszek, S.J. Urbanism, urbanisation, health and human biology: An introduction. In Urbanism, Health and Human Biology in Industrialised Countries; Cambridge University Press: Cambridge, UK, 1999. [Google Scholar]
  3. Li, J.; Deng, X.; Seto, K.C. Multi-level modeling of urban expansion and cultivated land conversion for urban hotspot counties in China. Landsc. Urban Plan. 2012, 108, 131–139. [Google Scholar]
  4. Clergeau, P.; Burel, F. The role of spatio-temporal patch connectivity at the landscape level: An example in a bird distribution. Landsc. Urban Plan. 1997, 38, 37–43. [Google Scholar] [CrossRef]
  5. Song, W.; Chen, B.; Zhang, Y.; Wu, J. Establishment of Rural Housing Land Standard in China. Chin. Geog. Sci. 2012, 22, 483–495. [Google Scholar] [CrossRef]
  6. Shahbaz, M.; Sbia, R.; Hamdi, H.; Ozturk, I. Economic growth, electricity consumption, urbanization and environmental degradation relationship in United Arab Emirates. Ecol. Indic. 2014, 45, 622–631. [Google Scholar] [CrossRef]
  7. Wang, S.J.; Ma, H.; Zhao, Y.B. Exploring the relationship between urbanization and the eco-environment—A case study of Beijing–Tianjin–Hebei region. Ecol. Indic. 2014, 45, 171–183. [Google Scholar] [CrossRef]
  8. Zhou, D.; Shi, P.; Wu, X.; Ma, J.; Yu, J. Effects of urbanization expansion on landscape pattern and region ecological risk in Chinese coastal city: A case study of Yantai city. Sci. World J. 2014, 2014, 821781. [Google Scholar] [CrossRef] [PubMed]
  9. Daily, G.C. Introduction: What Are Ecosystem Services; Resources for the Future: Washington, DC, USA, 1997. [Google Scholar]
  10. Dobbs, C.; Escobedo, F.J.; Zipperer, W.C. A framework for developing urban forest ecosystem services and goods indicators. Landsc. Urban Plan. 2012, 99, 196–206. [Google Scholar] [CrossRef]
  11. Hladnik, D.; Pirnat, J. Urban forestry—Linking naturalness and amenity: The case of Ljubljana, Slovenia. Urban For. Urban Green. 2011, 10, 105–112. [Google Scholar] [CrossRef]
  12. Löfvenhaft, K.; Björn, C.; Ihse, M. Biotope patterns in urban areas: A conceptual model integrating biodiversity issues in spatial planning. Landsc. Urban Plan. 2002, 58, 223–240. [Google Scholar] [CrossRef]
  13. Gagné, S.A.; Eigenbrod, F.; Bert, D.G.; Cunnington, G.M.; Olson, L.T.; Smith, A.C.; Fahrig, L. A simple landscape design framework for biodiversity conservation. Landsc. Urban Plan. 2015, 136, 13–27. [Google Scholar] [CrossRef]
  14. Li, F.; Wang, R.; Paulussen, J.; Liu, X. Comprehensive concept planning of urban greening based on ecological principles: A case study in Beijing, China. Landsc. Urban Plan. 2005, 72, 325–336. [Google Scholar] [CrossRef]
  15. Sandström, U.G.; Angelstam, P.; Khakee, A. Urban comprehensive planning—identifying barriers for the maintenance of functional habitat networks. Landsc. Urban Plan. 2006, 75, 43–57. [Google Scholar] [CrossRef]
  16. Riitters, K.H.; Coulston, J.W.; Wickham, J.D. Fragmentation of forest communities in the eastern United States. For. Ecol. Manag. 2012, 263, 85–93. [Google Scholar] [CrossRef]
  17. Emborg, J.; Walker, G.; Daniels, S. Forest landscape restoration decision-making and conflict management: Applying discourse-based approaches. In Forest Landscape Restoration: Integrating Natural and Social Sciences; Springer: Berlin, Germany, 2012; pp. 131–153. [Google Scholar]
  18. Urban, M.C.; Skelly, D.K.; Burchsted, D.; Price, W.; Lowry, S. Stream communities across a rural–urban landscape gradient. Divers. Distrib. 2006, 12, 337–350. [Google Scholar] [CrossRef]
  19. Wu, J. Key concepts and research topics in landscape ecology revisited: 30 years after the Allerton Park workshop. Landsc. Ecol. 2013, 28, 1–11. [Google Scholar] [CrossRef]
  20. Bergsten, A.; Zetterberg, A. To model the landscape as a network: A practitioner’s perspective. Landsc. Urban Plan. 2013, 119, 35–43. [Google Scholar] [CrossRef]
  21. Xun, B.; Yu, D.; Wang, X. Prioritizing habitat conservation outside protected areas in rapidly urbanizing landscapes: A patch network approach. Landsc. Urban Plan. 2017, 157, 532–541. [Google Scholar] [CrossRef]
  22. Qi, K.; Fan, Z.; Ng, C.N.; Wang, X.; Xie, Y. Functional analysis of landscape connectivity at the landscape, component, and patch levels: A case study of Minqing County, Fuzhou City, China. Appl. Geogr. 2017, 80, 64–77. [Google Scholar] [CrossRef]
  23. Taylor, P.D.; Fahrig, L.; Henein, K.; Merriam, G. Connectivity Is a Vital Element of Landscape Structure. Oikos 1993, 68, 571–573. [Google Scholar] [CrossRef]
  24. With, K.A. The Application of Neutral Landscape Models in Conservation Biology. Conserv. Biol. 1997, 11, 1069–1080. [Google Scholar] [CrossRef]
  25. Jordán, F.; Báldi, A.; Orci, K.M.; Rácz, I.; Varga, Z. Characterizing the importance of habitat patches and corridors in maintaining the landscape connectivity of a Pholidoptera transsylvanica (Orthoptera) metapopulation. Landsc. Ecol. 2003, 18, 83–92. [Google Scholar] [CrossRef]
  26. Pascual-Hortal, L.; Saura, S. Comparison and development of new graph-based landscape connectivity indices: Towards the priorization of habitat patches and corridors for conservation. Landsc. Ecol. 2006, 21, 959–967. [Google Scholar] [CrossRef]
  27. Pirnat, J.; Hladnik, D. Connectivity as a tool in the prioritization and protection of sub-urban forest patches in landscape conservation planning. Landsc. Urban Plan. 2016, 153, 129–139. [Google Scholar] [CrossRef]
  28. Galpern, P.; Manseau, M.; Fall, A. Patch-based graphs of landscape connectivity: A guide to construction, analysis and application for conservation. Biol. Conserv. 2011, 144, 44–55. [Google Scholar] [CrossRef]
  29. Bunn, A.G.; Urban, D.L.; Keitt, T.H.; Clarke, K.; Parks, B.; Crane, M. Landscape connectivity: A conservation application of graph theory. J. Environ. Manag. 2000, 59, 265–278. [Google Scholar] [CrossRef]
  30. Saura, S.T. J. Manual_Conefor_26.pdf. Available online: www.conefor.org (accessed on 15 December 2017).
  31. Sheng, N.; Tang, U.W. Zhuhai. Cities 2013, 32, 70–79. [Google Scholar] [CrossRef]
  32. Samain, M.-S. Biocultural Diversity Conservation: A Global Sourcebook. Int. J. Environ. Stud. 2012, 69, 182–184. [Google Scholar] [CrossRef]
  33. Gautam, A.P.; Webb, E.L.; Shivakoti, G.P.; Zoebisch, M.A. Land use dynamics and landscape change pattern in a mountain watershed in Nepal. Agric. Ecosyst. Environ. 2003, 99, 83–96. [Google Scholar] [CrossRef]
  34. Saura, S.; Torné, J. Conefor Sensinode 2.2: A software package for quantifying the importance of habitat patches for landscape connectivity. Environ. Model. Softw. 2009, 24, 135–139. [Google Scholar] [CrossRef]
  35. Baranyi, G.; Saura, S.; Podani, J.; Jordán, F. Contribution of habitat patches to network connectivity: Redundancy and uniqueness of topological indices. Ecol. Indic. 2011, 11, 1301–1310. [Google Scholar] [CrossRef]
  36. Kindlmann, P.; Burel, F. Connectivity measures: A review. Landsc. Ecol. 2008, 23, 879–890. [Google Scholar] [CrossRef]
  37. Saura, S.; Rubio, L. A common currency for the different ways in which patches and links can contribute to habitat availability and connectivity in the landscape. Ecography 2010, 33, 523–537. [Google Scholar] [CrossRef]
  38. Bodin, Ö.; Saura, S. Ranking individual habitat patches as connectivity providers: Integrating network analysis and patch removal experiments. Ecol. Model. 2010, 221, 2393–2405. [Google Scholar] [CrossRef]
  39. Saura, S.; Estreguil, C.; Mouton, C.; Rodríguez-Freire, M. Network analysis to assess landscape connectivity trends: Application to European forests (1990–2000). Ecol. Indic. 2011, 11, 407–416. [Google Scholar] [CrossRef]
  40. Saura, S.; Pascual-Hortal, L. A new habitat availability index to integrate connectivity in landscape conservation planning: Comparison with existing indices and application to a case study. Landsc. Urban Plan. 2007, 83, 91–103. [Google Scholar] [CrossRef]
  41. Liu, S.; Deng, L.; Dong, S.; Zhao, Q.; Yang, J.; Wang, C. Landscape connectivity dynamics based on network analysis in the Xishuangbanna Nature Reserve, China. Acta Oecol. 2014, 55, 66–77. [Google Scholar] [CrossRef]
  42. Rubio, L.; Saura, S. Assessing the importance of individual habitat patches as irreplaceable connecting elements: An analysis of simulated and real landscape data. Ecol. Complex. 2012, 11, 28–37. [Google Scholar] [CrossRef]
  43. Dong, J.; Dai, W.; Shao, G.; Xu, J. Ecological Network Construction Based on Minimum Cumulative Resistance for the City of Nanjing, China. ISPRS Int. J. Geo-Inf. 2015, 4, 2045–2060. [Google Scholar] [CrossRef] [Green Version]
  44. Bu, R.C.; Hu, Y.M.; Chang, Y.; Li, X.Z.; He, H.S. A correlation analysis on landscape metrics. Acta Ecol. Sin. 2005, 25, 2764–2775. [Google Scholar]
  45. Norusis, M.J. SPSS for Windows: Base System User’s Guide, Release 5.0; SPSS Incorporated: Chicago, IL, USA, 1993; pp. 397–400. [Google Scholar]
Figure 1. The distribution of forest land in Zhuhai City.
Sustainability 10 03381 g001
Figure 2. (a) Changes in forestland areas in 1999, 2005, 2009, and 2013; (b) number of components (NC) value changes with the distance increased.
Sustainability 10 03381 g002
Figure 3. The distribution of forest land in 1999, 2005, 2009, and 2013.
Sustainability 10 03381 g003
Figure 4. The number of different patches at four levels and corresponding areas of them.
Sustainability 10 03381 g004
Figure 5. Changes in NC at various threshold distances and their corresponding patch numbers in the largest component in 1999, 2005, 2009 and 2013.
Sustainability 10 03381 g005
Figure 6. The importance values of different patches with various areas (ha) were represented by dIIC values under gradient threshold distances from 600 m to 5000 m.
Sustainability 10 03381 g006
Figure 7. Dynamics in Integral Index of Connectivity (IIC) and Probability of Connectivity (PC) under different threshold distances in 1999, 2005, 2009 and 2013.
Sustainability 10 03381 g007
Figure 8. Changes in patch importance level for landscape connectivity of various habitat patches under gradient threshold distances in 1999, 2005, 2009 and 2013. Importance values based on the dIIC metric were divided into five categories.
Sustainability 10 03381 g008
Figure 9. (a) Minimum cost distance of corridor and (b) Ecological network of Zhuhai.
Sustainability 10 03381 g009
Figure 10. The changes in areas of farmland, forestland, and construction land, 1999–2013.
Sustainability 10 03381 g010
Table 1. The list of remote sensing data in Zhuhai.
NumberImage Date Satellite Spatial Resolution Path and Row
115 November 1999LandsatETM+30 m122-45/44
223 November 2005Landsat TM30 m122-45/44
32 November 2009Landsat TM30 m122-45/44
47 November 2013Landsat TM30 m122-45/44
Table 2. Overall indices of Integral Index of Connectivity (IIC) and Probability of Connectivity (PC) for Zhuhai City from 1999 to 2013 under four threshold distances.
YearDistance (m)IICPCDistance (m)IICPC
199910000.006010.0085134000.009870.01518
20050.006180.008770.009090.01448
20090.004660.007040.007120.01167
20130.006950.010220.010070.01749
199922000.007430.0118246000.013790.01848
20050.008420.011760.013770.01711
20090.006650.009420.010580.01389
20130.008790.013820.016470.02104
Table 3. Pearson correlation coefficients between patch importance indices and total patch area.
YearPatch Importance Indices 1000 mSig2200 mSig3400 mSig4600 mSig
1999dIIC0.947 **00.957 **00.957 **00.979 **0
dIICintra0.892 **00.892 **00.892 **00.892 **0
dIICflux0.590 **00.823 **00.958 **00.978 **0
dIICconnector0.367 **00.220 **00.127 **0.0060.188 **0
2005dIIC0.906 **0.0010.943 **00.962 **00.906 **0
dIICintra0.920 **00.920 **00.920 **00.920 **0
dIICflux0.738 *0.040.937 **00.944 **00.990 **0
dIICconnector0.499 **0.000.355 **00.522 **00.0690.196
2009dIIC0.913 **00.949 **00.964 **00.944 **0
dIICintra0.905 **00.905 **00.905 **00.905 **0
dIICflux0.728 **00.914 **00.935 **00.962 **0
dIICconnector0.316 **00.551 **00.584 **00.369 **0
2013dIIC0.904 **00.940 **00.966 **00.950 **0
dIICintra0.920 **00.920 **00.920 **00.920 **0
dIICflux0.699 **00.867 **00.951 **00.987 **0
dIICconnector0.538 **00.459 **00.584 **00.323 **0
** Pearson correlation is significant at the 0.01 level. * Pearson correlation is significant at the 0.05 level.
Table 4. Pearson correlation coefficients between patch importance indices and the top 10 patch area.
YearPatch Importance Indices 1000 mSig2200 mSig3400 mSig4600 mSig
1999dIIC0.933 **00.959 **00.948 **00.956 **0
dIICintra0.977 **00.977 **00.977 **00.977 **0
dIICflux0.0610.8680.5790.0790.982 **00.957 **0
dIICconnector0.915 **0−0.4770.164−0.3020.396−0.4070.243
2005dIIC0.868 **0.0010.928 **00.968 **00.991 **0
dIICintra0.976 **0.0000.976 **00.976 **00.976 **0
dIICflux0.654 **0.0040.913 **00.937 **00.969 **0
dIICconnector0.786 **0.007−0.2440.4970.050.891−0.3680.296
2009dIIC0.821 **0.0040.901 **00.958 **00.884 **0
dIICintra0.973 **00.973 **00.973 **00.973 **0
dIICflux0.5460.1030.771 **0.0090.922 **00.964 **0
dIICconnector−0.4900.150.350.3210.3720.290.2130.554
2013dIIC0.858 **0.0020.915 **00.969 **00.849 **0.002
dIICintra0.978 **00.978 **00.978 **00.978 **0
dIICflux0.5700.0860.7170.020.952 **00.958 **0
dIICconnector0.928 **0−0.0410.9110.4610.180−0.0110.976
** Pearson correlation is significant at the 0.01 level.

