Sustainable Urbanization Synergy Degree Measures—A Case Study in Henan Province, China

Abstract
:1. Introduction
2. Literature Review
2.1. Research on Sustainable Urban Development
- (1)
- Analyses of the changes brought about by urbanization. Srinivasan et al. [15] studied the relationship between urbanization and water resource vulnerability in a fast-growing city and found that some generalizable factors exist in the highly site-specific link between urbanization and water vulnerability, for which some feasible suggestions on water resource vulnerability were offered. Shen et al. [16] examined the link between urbanization and resource utilization and predicted that as there was going to be an increased demand for energy and mineral resources for China’s continuing urbanization plans up till 2050, the government sector needed to review and improve existing resource utilization and environmental policies to ensure sustainable urban development. Li and Ma [17] established environmental quality indices for 30 administrative regions in China from 2003 to 2011, and employed panel data analyses to explore the relationships between the urbanization rate, economic development, and environmental change, with the results revealing an inverted-U-shaped relationship between the urbanization rate and regional environmental quality changes, and a “turning point” at around a 60% urbanization rate. Zhang et al. [18] studied the effects of industrial structure, infrastructure development, land use changes, and income on sustainable urban development, and found that with steady economic growth, moderate land use changes were the key to sustainable urban development. Dewan et al. [19] investigated the link between rapid urbanization growth and flood disasters in Bangladesh and concluded that urbanization had a significant influence on flood occurrences.
- (2)
- Construction of sustainable urban development measurement indices. Measurement indices play an important role in information extraction and urbanization evaluations, however, due to different foci and research perspectives, different scholars have utilized different indices. Overall, in Refs. [20,21,22], there was a consensus that sustainable urbanization could be assessed from economic, social, environmental, and resource sustainability perspectives. Moreover, Jochen et al. [23] outlined thirteen suitability criteria for measuring urbanization expansion, providing a helpful and useful reference for the systematic assessment of the consistency and reliability of urban development metrics. To assess the urban sustainability of Chinese megacities, Huang et al. [24] listed eight indicators from the three dimensions of sustainability such as an environmental performance index, a human development index, and a Gini coefficient. Shen et al. [25] examined nine different practices using different indicators based on particular needs, and proposed a comparative analysis across four dimensions: environmental, economic, social, and government. Mori and Yamashita [26] selected environmental, economic, and social indices and established a framework of city sustainability indices to assess the performance of sustainable urbanization. All of these studies have provided valuable contributions to sustainable urbanization indicator systems from diverse perspectives.
- (3)
- Sustainable urbanization measures. With the advancement of urbanization, the methods, techniques, and tools for assessing sustainable performance in the process of urbanization have made remarkable progress. Zhang [27] proposed a bi-dimensional matrix model for sustainable urbanization to analyze the performance of economic, social and environmental issues at different stages of new lifecycles of urban and rural environments, providing a reference for sustainable urbanization. Li et al. [28] analyzed panel data collected from 2000 to 2008 for Lianyungang and established a coupling coordination degree model to measure coordination between urbanization and the environment. Liang et al. [6] constructed a PCA-Grey-TOPSIS model to measure sustainable urban development capacities by combining principal component analysis with Grey TOPSIS. Thirteen cities in the Jiangsu province, China were selected as the study object to measure their sustainable development capacity, from which the model’s effectiveness and operability were proven. Principal component analysis (PCA) [29] and the entropy method [30] were used to develop a sustainable urban development system evaluation model for assessing the performance of sustainable urbanization and a range of evaluation standards were outlined.
2.2. Summary of Previous Research
- (1)
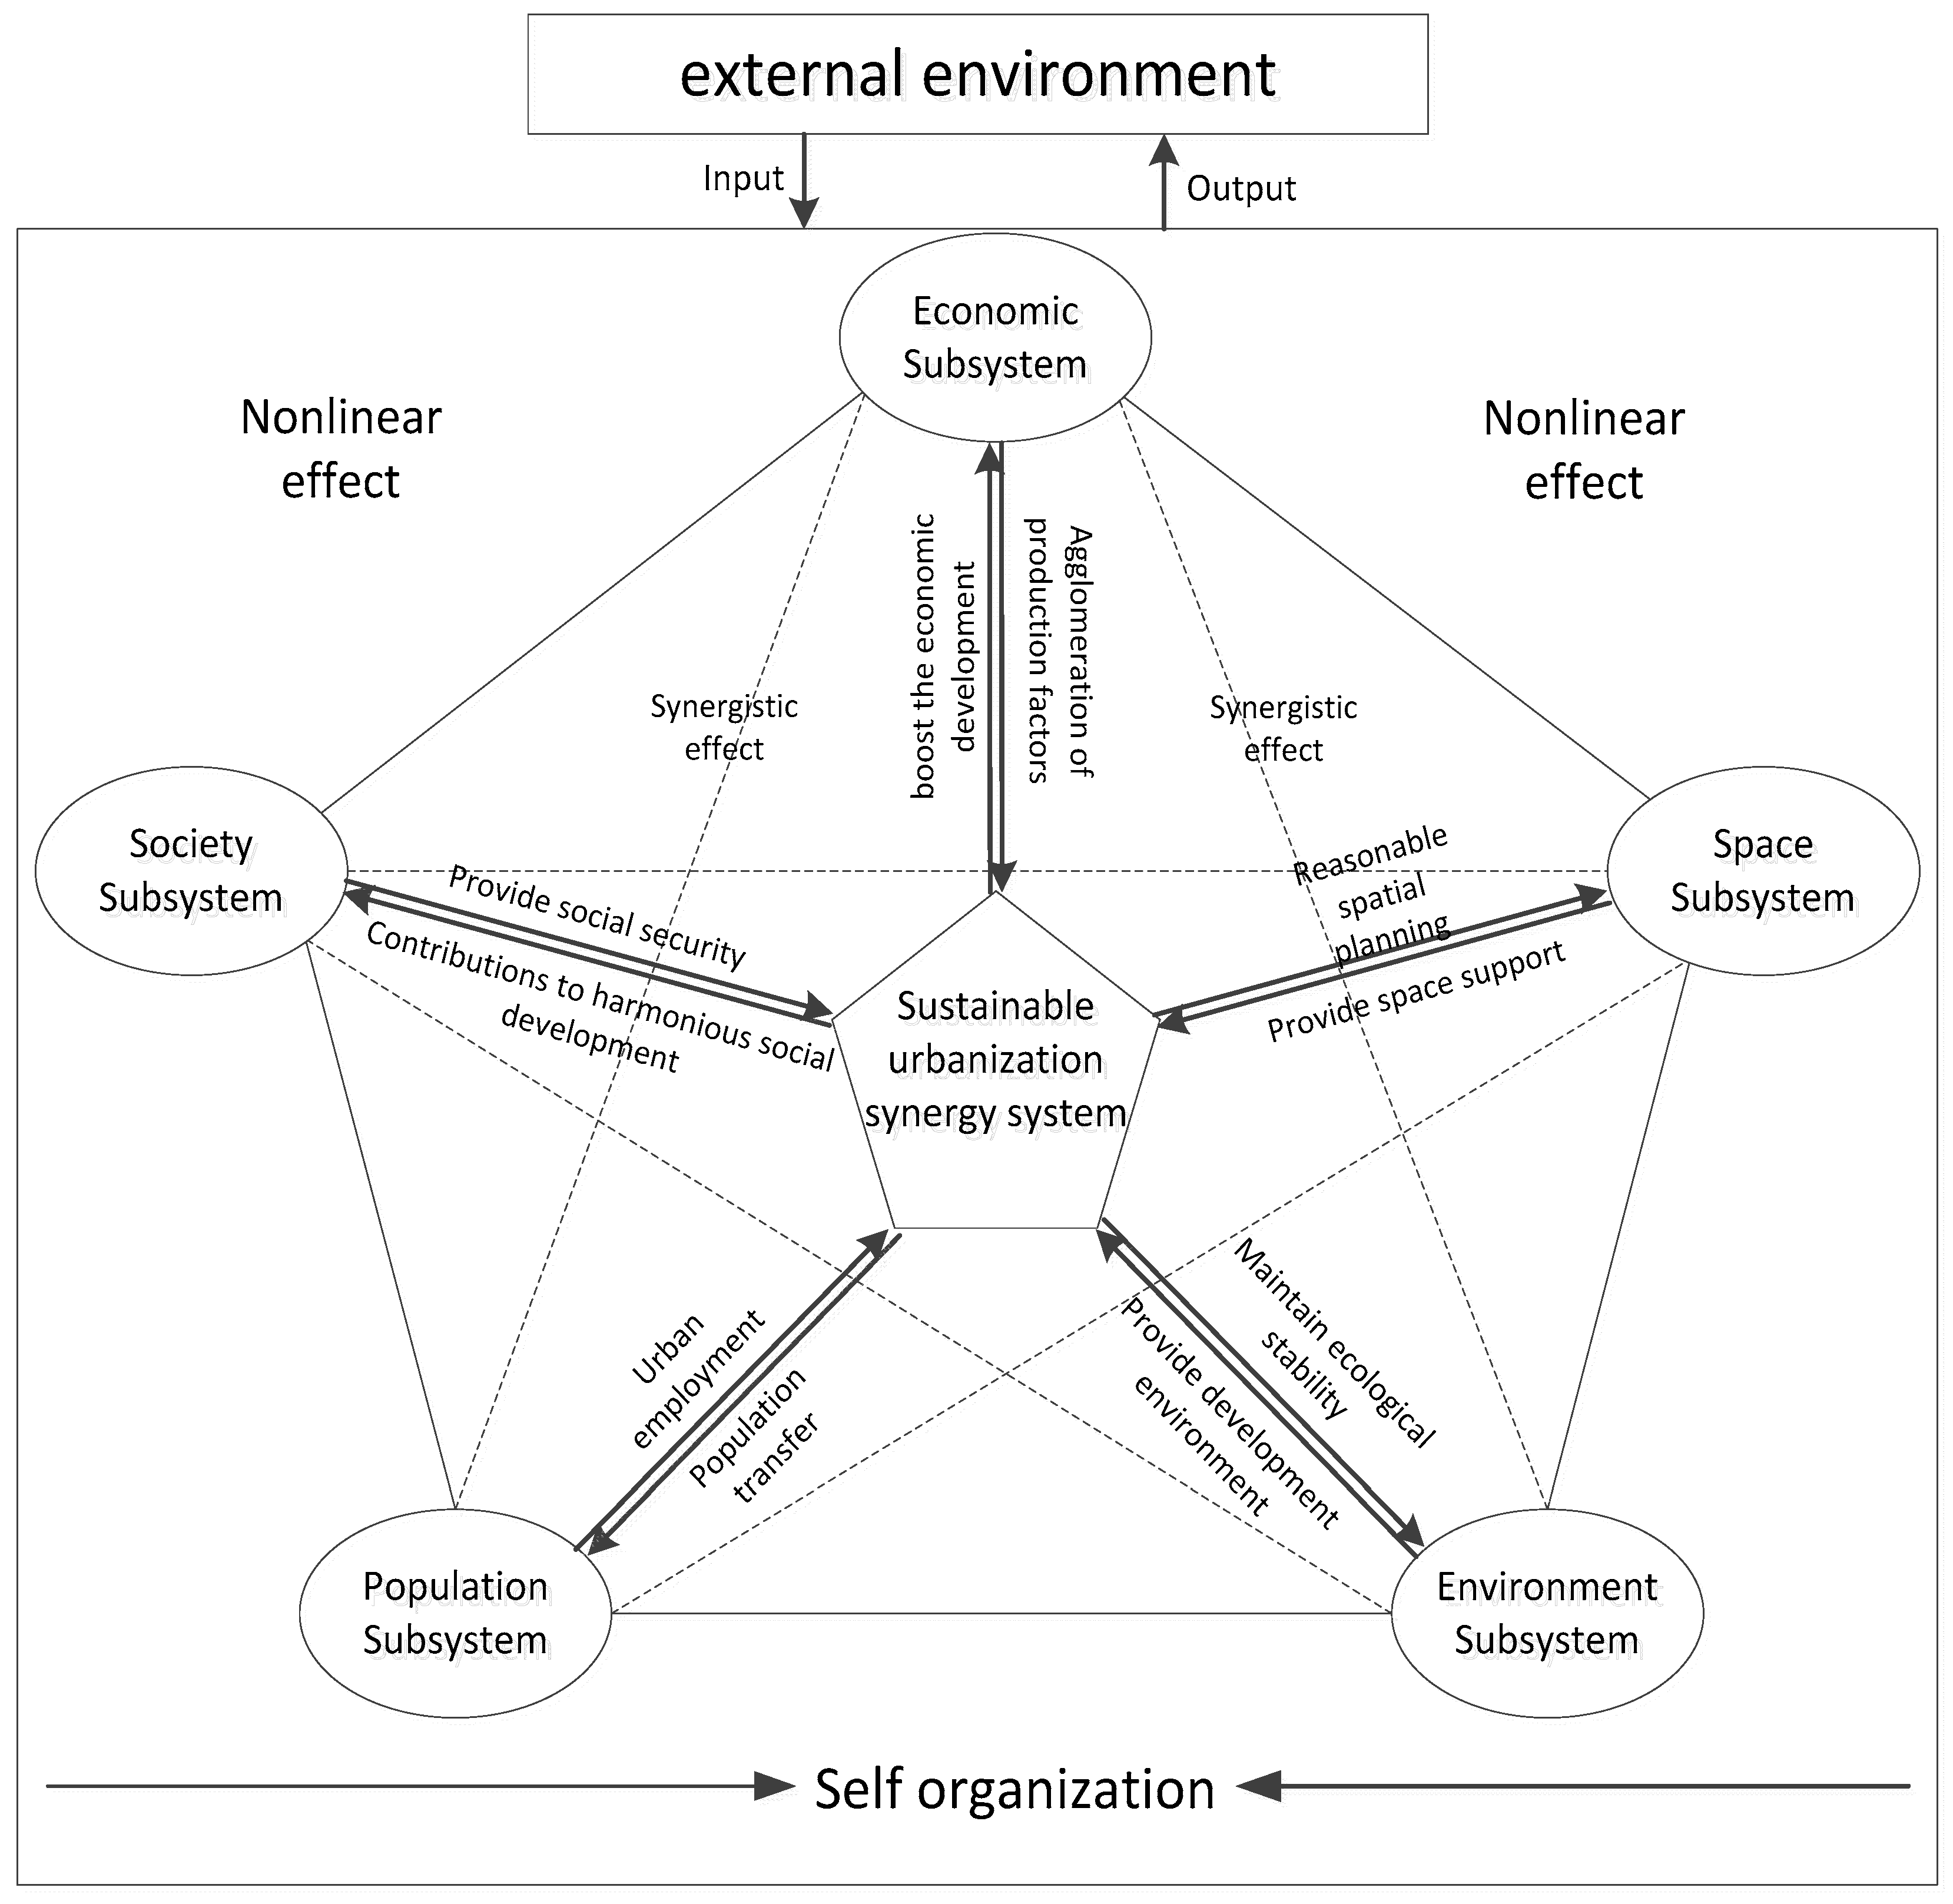
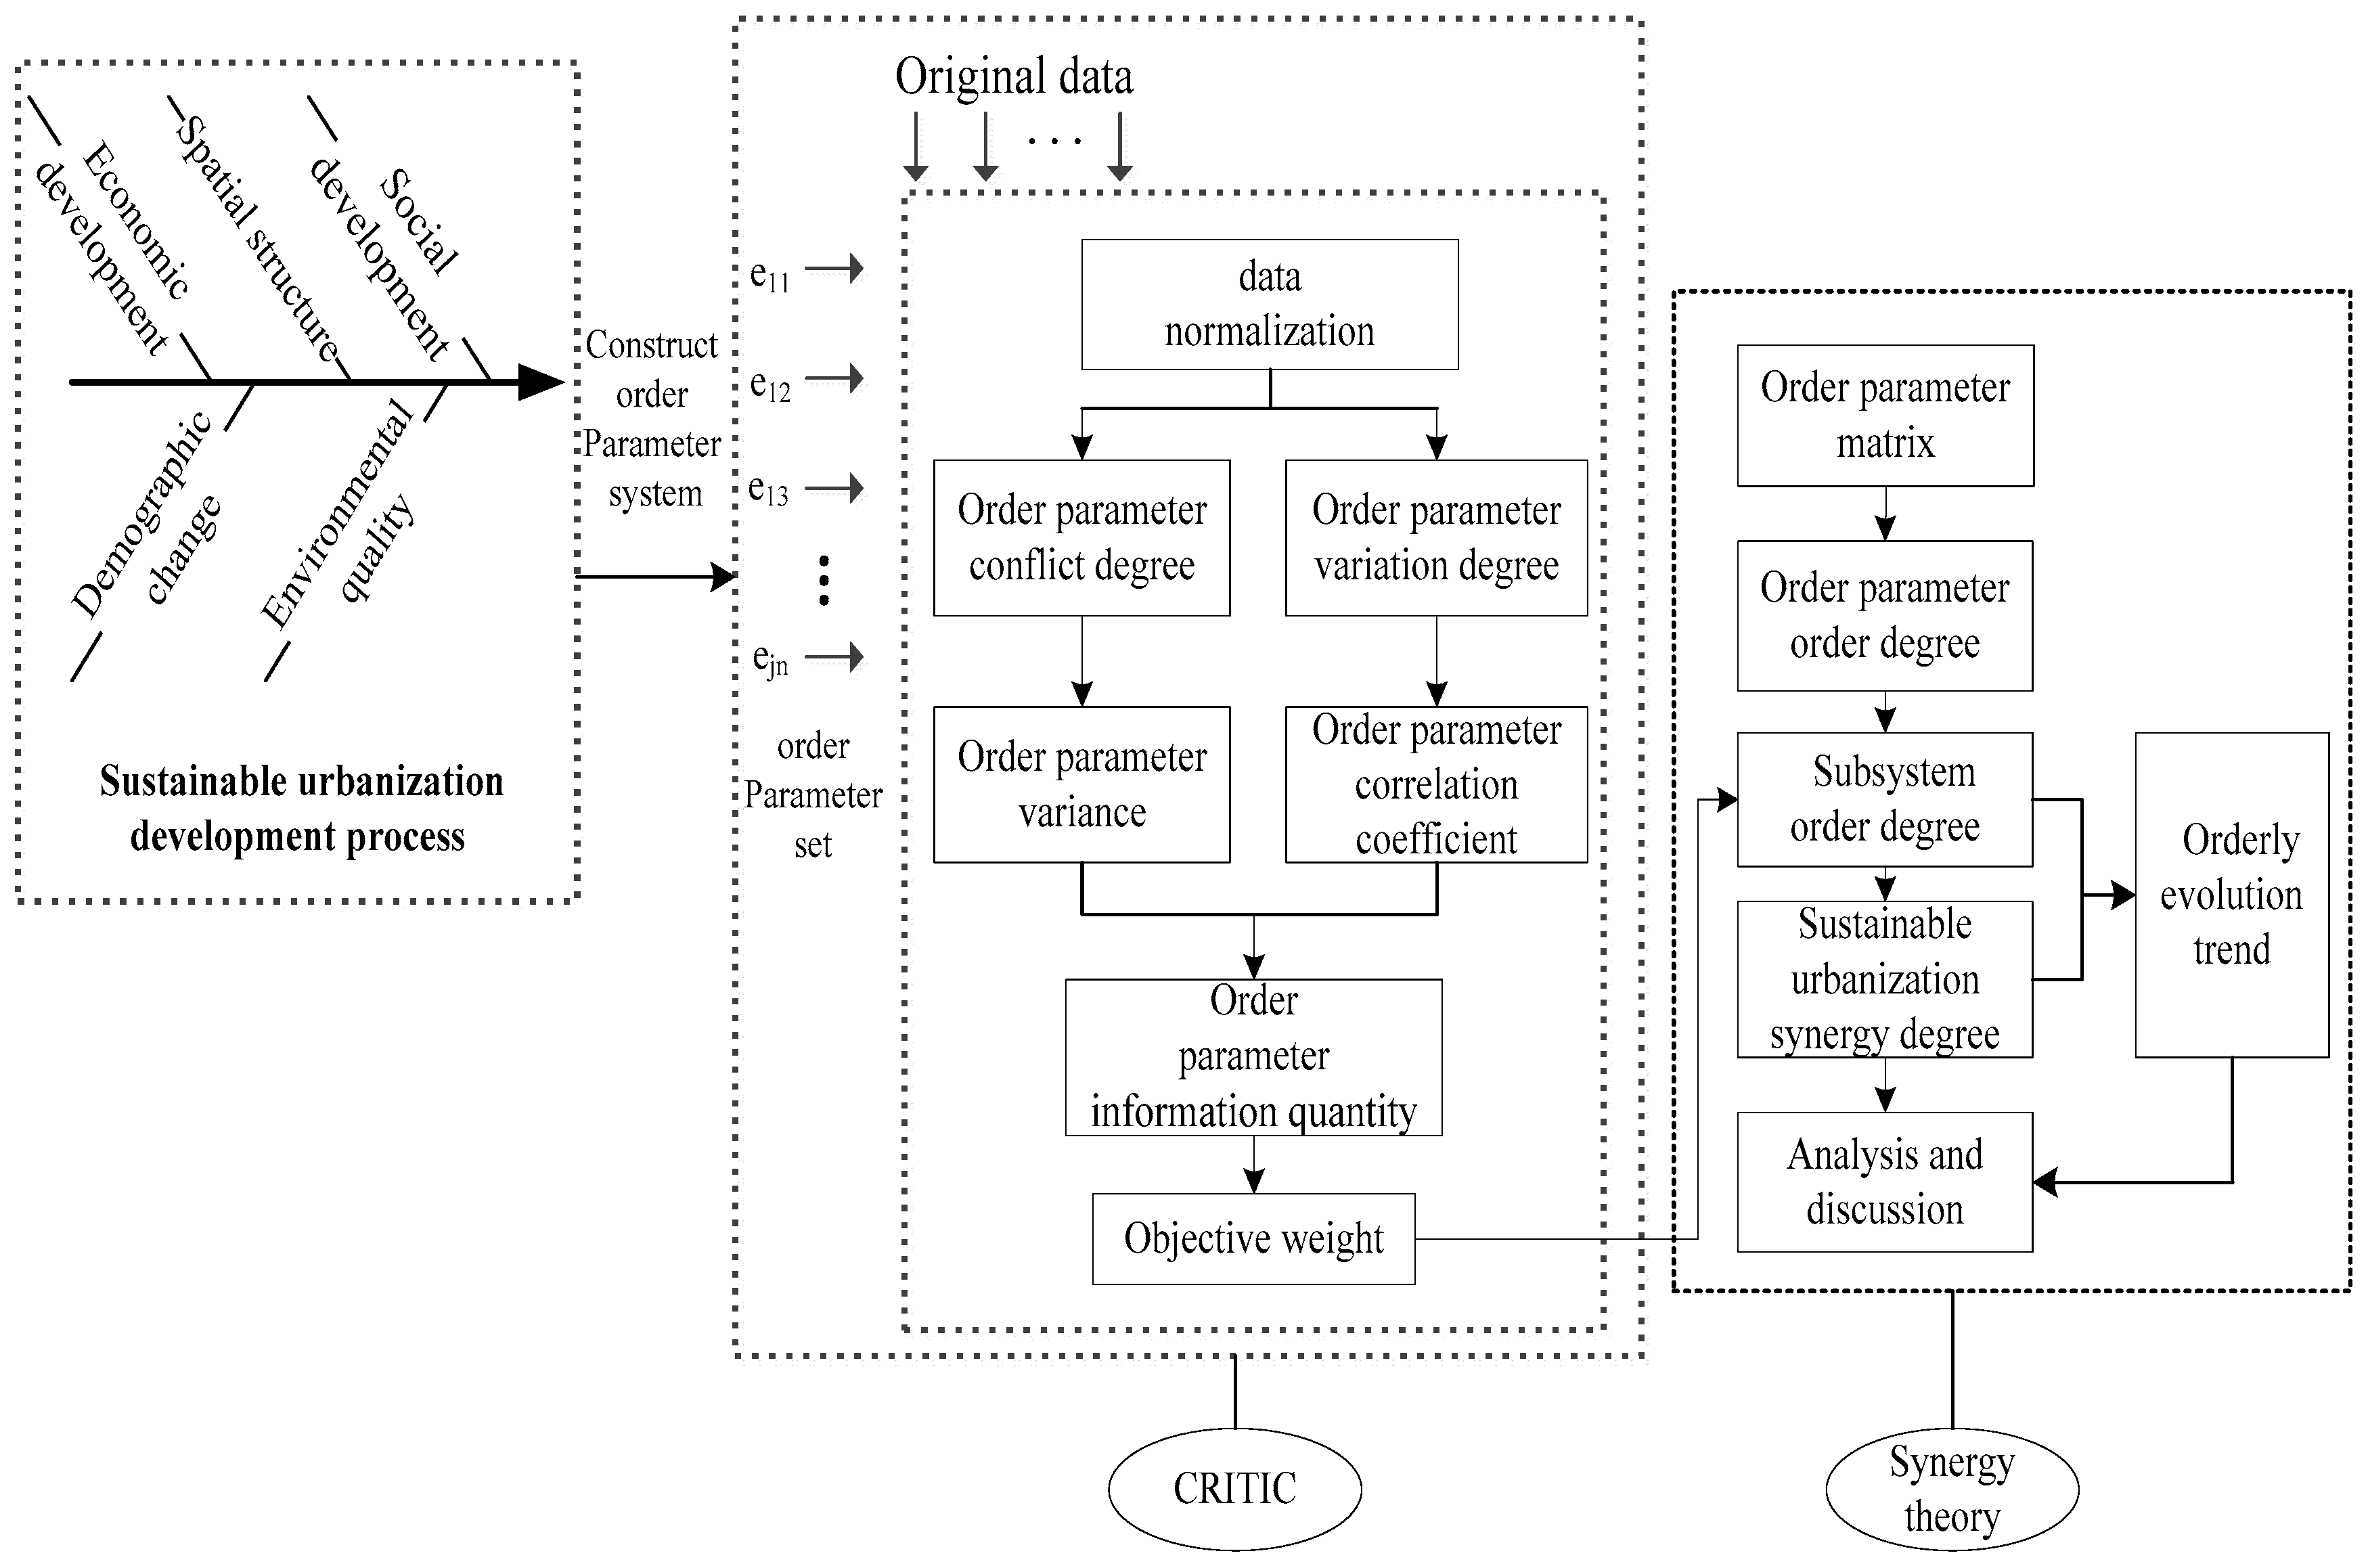
- On the basis of previous research, this paper developed a more comprehensive SUSS that included demographic change, economic development, space structure, environmental quality, and social development. For these five subsystems, more accurate order parameters were selected to allow for the analyses of the subsystems’ evolutionary processes. Through the determination of the subsystem order degrees, the synergistic development level of the sustainable urbanization composite system can be more easily analyzed.
- (2)
- Grounded by the principles associated with a comprehensive, integrated index system, a sustainable urbanization synergy degree measurement model was established. The CRITIC method was used to obtain the objective weights of each order parameter, and a quantitative analysis was then carried out using this model in order to reflect the coordination of sustainable urbanization and understand the urbanization development status and future tendencies.
- (3)
- From the calculation of the order parameter weights, the subsystem order degrees and the composite system synergy degree, the coordinated development status and the orderly evolutionary trends of sustainable urbanization system in different years were analyzed from the perspective of time series.
3. SUSS Analysis
4. The Order Parameter System of SUSS
5. Sustainable Urbanization Synergy Degree Measurement Method
5.1. Subsystem Order Degree Measurement Model
5.2. Sustainable Urbanization System Synergy Degree Measurement Model
5.3. Measurement Steps
6. Case Analysis
7. Results Analysis
7.1. Analysis of the Subsystem Order Degree of the Sustainable Urbanization
- (1)
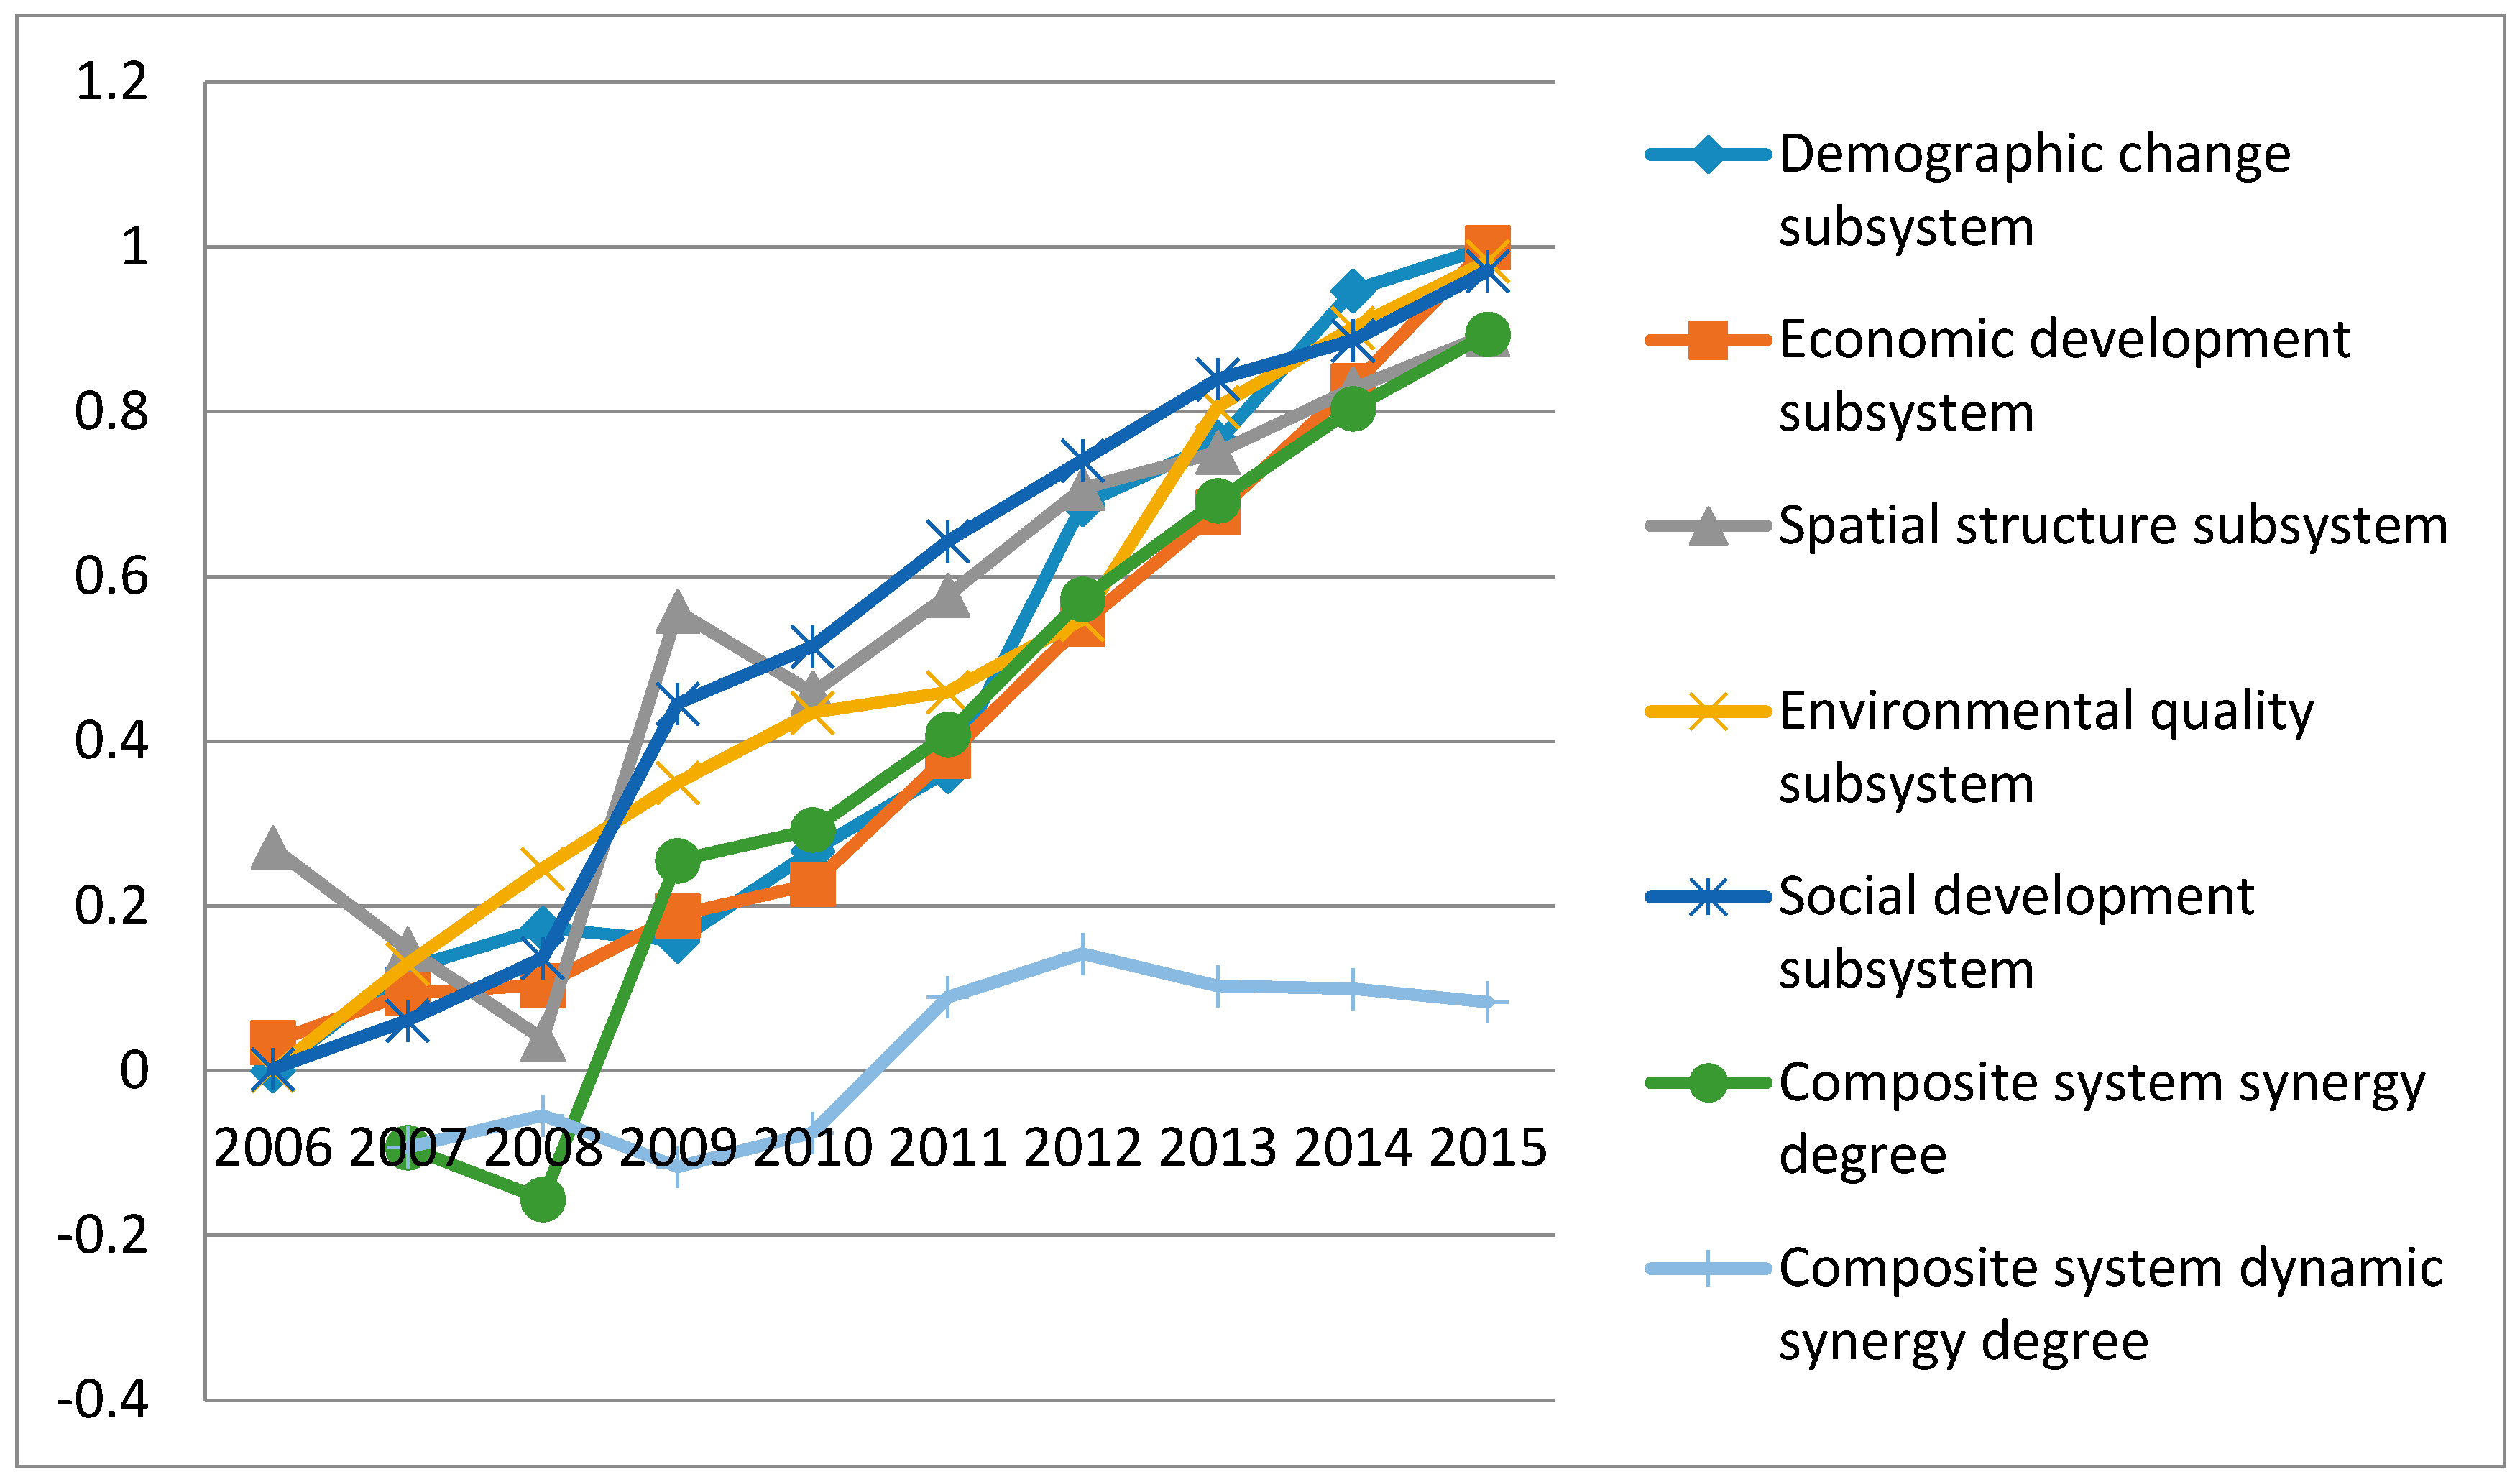
- The demographic change subsystem order degree was increasing from 2006 to 2015, with the order degree improvement particularly evident after 2011. Since the 11th Five-Year Plan, Henan province has attached great importance to an orderly population flow and a reasonable population distribution. In the past ten years, the urban population has increased by 19.31 million, and the urban unemployment rate has decreased to 3%. Further, the secondary and tertiary industry has increased urban employment opportunities, thereby contributing to the development of population urbanization. These changes appeared to suggest that the demographic change subsystem has been developing gradually into an orderly state. However, it is worth noting that the phenomenon of disequilibrium exists in Henan population urbanization.
- (2)
- The improvement of the order degree of the economic development subsystem was the same as that of the demographic change subsystem, but the fluctuations were small. As a large agricultural province, Henan’s economy has been steadily developing during urbanization. The labor force has shifted from primary industry to secondary industry, and with the further increases in the per capita GDP income level, there has been a gradual shift to the tertiary industry. At the end of 2015, the proportion of the tertiary industry increased to 40.2%, leading to an increase in the order degree of the economic development subsystem. Additionally, the progress of order degree of sustainable urbanization in Henan has also been driven by the increase in the income of residents and the increased investment in fixed assets by the government over the past ten years. In addition, in 2011, the construction of the Central Plains Economic Zone has been brought into the national 12th Five-Year Plan, which has officially risen to the national strategy, and the pace of building in Henan’s Central Plains Economic Zone has been greatly accelerated since 2011. As shown in Figure 4, from 2011, the trend curve became more inclined; however, compared with the other subsystems, the economic development in Henan province is not sufficient, which is also in line with Henan’s reality.
- (3)
- The order degree of the spatial structure subsystem first decreased from 0.271 in 2006 to the minimum value in 2008, and then increased. There were two reasons for this. First, the urban population growth and urban area expansion were not coordinated. Second, since Henan province had a large population output, the Beijing Olympic Games and the economic depression in 2008 caused limited population output, resulting in an increase in population density and a decline in the urban resident per capita road area. As the population density and the urban resident per capita road area weights were larger in the spatial structure subsystem, any changes would have a significant influence on the spatial structure subsystem order degree.
- (4)
- The order degree of the environmental quality subsystem continuously improved. Among them, the harmless treatment rate of municipal solid waste had risen significantly from 46.3% in 2006 to 96% in 2015—a significant improvement. The urban sewage treatment rate increased from 66.32% in 2006 to 93.58% in 2015, and environmental governance investment increased by almost four times over the past years, all indicating that some achievements have been made in the construction of ecological civilization, and the quality of the urban environment has been increasingly improved in Henan.
- (5)
- The order degree of the social development subsystem was increasing year on year and was somewhat higher than that the other subsystems. Due to the varying improvement degrees in each of the order parameter indices from 2006 to 2015, the system has moved in an orderly direction, as exemplified in the increase of 18.8% in the gas popularization rate, the threefold increase in the medical insurance numbers in cities and towns, and the increase to 47,766 in total amount of patent authorization, all of which demonstrated that urbanization was developing well. Compared with the other subsystems, and especially from 2009–2015, the social subsystem had the highest order degree, indicating that more attention had been paid to it.
7.2. Analysis of Synergy Degree of the Sustainable Urbanization Composite System
8. Conclusions
- (1)
- To measure the sustainable urbanization synergistic effects, this paper developed a SUSS with selected subsystem order parameters to examine the concept of sustainable urban development, the effectiveness and feasibility of which was verified in a pilot case study. The CRITIC method was used to determine the order parameters weights to avoid subjective preferences, which made the results more objective and representative.
- (2)
- Sustainable urbanization is a complex system affected by many factors and its development is a dynamic evolution process based on time series. Through the application of a synergy theory, the order degree value changes of the five subsystems and the synergy degree value changes of the composite system can be analyzed so as to scientifically reflect the systematic characteristics and development status in the process of urbanization.
- (3)
- Through the analysis of the order degree change of each subsystem and the synergy degree change of the composite system in Henan province from 2006 to 2015, it was found that although synergistic effects were developing into an ordered state, there was still much room for improvement, especially in terms of the economic development subsystem, which needs to be further reinforced.
Acknowledgments
Author Contributions
Conflicts of Interest
References
- Kumar, M.P.; Reddy, S. Analysis of Land Use/Land Cover Changes Using Remote Sensing Data and GIS at an Urban Area, Tirupati, India. Sci. World J. 2013, 2013, 268623. [Google Scholar] [CrossRef]
- Shen, L.Y.; Zhou, J.Y. Examining the effectiveness of indicators for guiding sustainable urbanization in China. Habitat Int. 2014, 44, 111–120. [Google Scholar] [CrossRef]
- Lu, S.S.; Guan, X.L.; He, C.; Zhang, J.L. Spatio-Temporal Patterns and Policy Implications of Urban Land Expansion in Metropolitan Areas: A Case Study of Wuhan Urban Agglomeration, Central China. Sustainability 2014, 6, 4723–4748. [Google Scholar] [CrossRef]
- Wang, S.J.; Fang, C.L.; Guan, X.L.; Pang, B.; Ma, H. Urbanization, energy consumption, and carbon dioxide emissions in China: A panel data analysis of China’s provinces. Appl. Energy 2014, 136, 738–749. [Google Scholar] [CrossRef]
- Liu, S.W.; Zhang, P.Y.; Jiang, X.L.; Lo, K. Measuring sustainable urbanization in China: A case study of the coastal Liaoning area. Sustain. Sci. 2013, 8, 585–594. [Google Scholar] [CrossRef]
- Liang, X.D.; Zhang, W.W.; Chen, L.; Deng, F.M. Sustainable Urban Development Capacity Measure—A Case Study in Jiangsu Province, China. Sustainability 2016, 8, 270. [Google Scholar] [CrossRef]
- Yu, A.T.W.; Wu, Y.; Zheng, B.; Zhang, X.; Shen, L. Identifying risk factors of urban-rural conflict in urbanization: A case of China. Habitat Int. 2014, 44, 177–185. [Google Scholar] [CrossRef]
- Tosics, I. The Chinese urban development dilemma: heritage and green areas as victims of rapid urbanization. Mazowieckie Biuro Planowania Regionalnego W Warszawie 2012, 9, 87–100. [Google Scholar]
- Yigitcanlar, T. Smart cities: An effective urban development and management model? Aust. Plan. 2015, 52, 27–34. [Google Scholar] [CrossRef]
- Zhou, J.Y.; Shen, L.Y.; Song, X.N.; Zhang, X. Selection and modeling sustainable urbanization indicators: A responsibility-based method. Ecol. Indic. 2015, 56, 87–95. [Google Scholar] [CrossRef]
- Sobczyk, W. Sustainable Development of Middle East Region. Problemy Ekorozw. 2015, 10, 51–62. [Google Scholar]
- Dassen, T.; Kunseler, E.; Van Kessenich, L.M. The Sustainable City: An Analytical–Deliberative Approach to Assess Policy in the Context of Sustainable Urban Development. Sustain. Dev. 2013, 21, 193–205. [Google Scholar] [CrossRef]
- Chen, Z.L.; Su, L.C.; Zhang, C. Research on the Synergy Degree of Aboveground and Underground Space along Urban Rail Transit from the Perspective of Urban Sustainable Development. Sustainability 2016, 8, 934. [Google Scholar] [CrossRef]
- Liu, Y.Q.; Xu, J.P.; Luo, H.W. An Integrated Approach to Modelling the Economy-Society-Ecology System in Urbanization Process. Sustainability 2014, 6, 1946–1972. [Google Scholar] [CrossRef]
- Srinivasan, V.; Seto, K.C.; Emerson, R.; Gorelick, S.M. The impact of urbanization on water vulnerability: A coupled; human-environment system approach for Chennai, India. Glob. Environ. Chang. 2013, 23, 229–239. [Google Scholar] [CrossRef]
- Shen, L.; Cheng, S.K.; Gunson, A.J.; Wan, H. Urbanization, sustainability and the utilization of energy and mineral resources in China. Cities 2005, 22, 287–302. [Google Scholar] [CrossRef]
- Li, S.S.; Ma, Y. Urbanization, Economic Development and Environmental Change. Sustainability 2014, 6, 5143–5161. [Google Scholar] [CrossRef]
- Zhang, H.Y.; Uwasu, M.; Hara, K.; Yabar, M. Sustainable Urban Development and Land Use Change—A Case Study of the Yangtze River Delta in China. Sustainability 2011, 3, 1074–1089. [Google Scholar] [CrossRef]
- Dewan, A.M.; Yamaguchi, Y. Effect of land cover changes on flooding: Example from Greater Dhaka of Bangladesh. Int. J. Geoinform. 2008, 4, 11–20. [Google Scholar]
- Shen, L.Y.; Peng, Y.; Zhang, X.L.; Wu, Y.Z. An alternative model for evaluating sustainable urbanization. Cities 2012, 29, 32–39. [Google Scholar] [CrossRef]
- Harris, N. Wastes, the environment and the international economy. Cities 1992, 9, 177–185. [Google Scholar] [CrossRef]
- Marcotullio, P.J. Asian urban sustainability in the era of globalization. Habitat Int. 2001, 25, 577–598. [Google Scholar] [CrossRef]
- Jaeger, J.A.G.; Bertiller, R.; Schwick, C.; Kienast, F. Suitability criteria for measures of urban sprawl. Ecol. Indic. 2010, 10, 397–406. [Google Scholar] [CrossRef]
- Huang, L.; Yan, L.J.; Wu, J.G. Assessing urban sustainability of Chinese megacities: 35 years after the economic reform and open-door policy. Landsc. Urban Plan. 2016, 145, 57–70. [Google Scholar] [CrossRef]
- Shen, L.Y.; Ochoa, J.; Shah, M.N.; Zhang, X.L. The application of urban sustainability indicators—A comparison between various practices. Habitat Int. 2011, 35, 17–29. [Google Scholar] [CrossRef]
- Mori, K.; Yamashita, T. Methodological framework of sustainability assessment in City Sustainability Index (CSI): A concept of constraint and maximization indicators. Habitat Int. 2015, 45, 10–14. [Google Scholar] [CrossRef]
- Zhang, X.L. Sustainable urbanization: a bi-dimensional matrix model. J. Clean. Prod. 2016, 134, 425–433. [Google Scholar] [CrossRef]
- Li, Y.F.; Li, Y.; Zhou, Y.; Shi, Y.L. Investigation of a coupling model of coordination between urbanization and the environment. J. Environ. Manag. 2012, 98, 127. [Google Scholar] [CrossRef] [PubMed]
- Tavernia, B.G.; Reed, J.M. Spatial extent and habitat context influence the nature and strength of relationships between urbanization measures. Landsc. Urban Plan. 2009, 92, 47–52. [Google Scholar] [CrossRef]
- Shen, L.Y.; Zhou, J.Y.; Skitmore, M.; Xia, B. Application of a hybrid Entropy–McKinsey Matrix method in evaluating sustainable urbanization: A China case study. Cities 2015, 42, 186–194. [Google Scholar] [CrossRef]
- Qiao, B.; Fang, C.G. The dynamic coupling model and its application of urbanization and eco-environment in Hexi Corridor. J. Geogr. Sci. 2005, 15, 491–499. [Google Scholar] [CrossRef]
- Buhaug, H.; Urdal, H. An urbanization bomb? Population growth and social disorder in cities. Glob. Environ. Chang. 2013, 23, 1–10. [Google Scholar] [CrossRef]
- Sato, Y.; Zenou, Y. How Urbanization Affect Employment and Social Interactions. Eur. Econ. Rev. 2015, 75, 131–155. [Google Scholar] [CrossRef]
- Haken, H. Synergetics: An Overview. Rep. Prog. Phys. 1989, 52, 515–553. [Google Scholar] [CrossRef]
- Haken, H. Basic concepts of synergetics. Appl. Phys. A Solids Surf. 1993, 57, 111–115. [Google Scholar] [CrossRef]
- Heuvel, F.V.D.; Donselaar, K.V.; Langen, P.D.; Fransoo, J. Co-Location Synergies: Specialised Versus Diverse Logistics Concentration Areas. Tijdschrift Voor Economische En Sociale Geografie 2016, 107, 331–346. [Google Scholar] [CrossRef]
- Buultjens, J.; Gale, D.; White, N.E. Synergies between Australian indigenous tourism and ecotourism: Possibilities and problems for future development. J. Sustain. Tour. 2010, 18, 497–513. [Google Scholar] [CrossRef]
- Diakoulaki, D.; Mavrotas, G.; Papayannakis, L. Determining objective weights in multiple criteria problems: The critic method. Comput. Oper. Res. 1995, 22, 763–770. [Google Scholar] [CrossRef]
- Kazan, H.; Ozdemir, O. Financial performance assessment of large scale conglomerates via TOPSIS and CRITIC methods. Int. J. Manag. Sustain. 2014, 3, 203–224. [Google Scholar]
- He, L.X.; Chen, B.X. The present situation, causes and Countermeasures of urbanization in Henan province. China’s Urban Econ. 2010, 9, 259–261. [Google Scholar]
- People’s Republic of China National Bureau of statistics. China Statistical Yearbook; China Statistics Press: Beijing, China, 2007–2016. Available online: http://www.stats.gov.cn/tjsj/ndsj/ (accessed on 11 October 2017).
- Henan Bureau of Statistics. Henan Statistical Yearbook; China Statistics Press: Beijing, China, 2007–2016. Available online: http://www.ha.stats.gov.cn/sitesources/hntj/page_pc/tjfw/tjcbw/tjnj/list1.html (accessed on 11 October 2017).


| System | Subsystem | Order Parameters of Each Subsystem | Effect |
|---|---|---|---|
| Sustainable urbanization synergy system | Demographic change | Urban unemployment rate (%) | |
| Resident population in urban areas (million persons) | |||
| Proportion of urban employment to total employment (%) | |||
| Population urbanization rate (%) | |||
| Economic development | Per capita GDP (Yuan) | ||
| Tertiary Industry Proportion (%) | |||
| Disposable income of urban residents (Yuan) | |||
| Comparison of consumption levels between urban and rural residents (rural residents = 1) | |||
| Urban fixed asset investment accounted for GDP ratio (hundred million yuan) | |||
| Spatial structure | The urban resident per capita road area (sq. m) | ||
| Urban population density (persons/sq. km) | |||
| Per capita living space of urban residents (sq. m) | |||
| Built-up areas (sq.km) | |||
| Environmental quality | Green coverage rate of built-up areas (%) | ||
| Harmless treatment rate of municipal solid waste (%) | |||
| Urban sewage treatment rate (%) | |||
| Environmental governance investment (Hundred million yuan) | |||
| Social development | Public transport standard operating vehicle numbers | ||
| Total amount of patent authorization | |||
| Gas popularization rate (%) | |||
| Medical insurance numbers in cities and towns | |||
| Internet connected computer numbers per 100 households in cities and towns | |||
| Bed numbers in hospital health centers at the end of the year (104) |
| Year | Demographic Change | Economic Development | Spatial Structure | Environmental Quality | Social Development | ||||||||||||||||||
|---|---|---|---|---|---|---|---|---|---|---|---|---|---|---|---|---|---|---|---|---|---|---|---|
| e11 | e12 | e13 | e14 | e21 | e22 | e23 | e24 | e25 | e31 | e32 | e33 | e34 | e41 | e42 | e43 | e44 | e51 | e52 | e53 | e54 | e55 | e56 | |
| 2006 | 3.5 | 3050 | 16.47 | 33.1 | 13,172 | 31 | 9810.26 | 3.4 | 39.16 | 10 | 5305.7 | 31.75 | 1679 | 32.8 | 46.3 | 66.32 | 95.15 | 12,575 | 5242 | 67.2 | 704 | 21.24 | 2.21 |
| 2007 | 3.4 | 3214 | 16.59 | 34.34 | 16,012 | 31.3 | 11,477.05 | 3.4 | 44.02 | 10.81 | 5902 | 32.3 | 1775 | 34.3 | 51.9 | 71.45 | 114.4 | 13,071 | 6998 | 68.9 | 726.03 | 24.96 | 2.43 |
| 2008 | 3.4 | 3397 | 16.72 | 36.03 | 19,181 | 29.7 | 13,231.11 | 3.4 | 48.4 | 9.9 | 5967 | 31.9 | 1857 | 35.4 | 67.3 | 77.53 | 109.88 | 15,661 | 9133 | 66.9 | 840.87 | 30.88 | 2.71 |
| 2009 | 3.5 | 3577 | 17.94 | 37.7 | 20,597 | 31 | 14,371.56 | 3.4 | 58.8 | 10.44 | 4886 | 32.8 | 1913 | 36.3 | 75.3 | 83.86 | 121.32 | 18,381 | 11,425 | 72.9 | 1970.13 | 35.21 | 3.15 |
| 2010 | 3.4 | 3651 | 18.18 | 38.5 | 24,446 | 30.6 | 15,930.26 | 3.4 | 60.34 | 10.25 | 5178 | 33.3 | 2014 | 36.5 | 82.5 | 87.58 | 132.25 | 18,912 | 16,539 | 73.4 | 2043.75 | 41.23 | 3.18 |
| 2011 | 3.4 | 3809 | 20.76 | 40.57 | 28,661 | 32.1 | 18,194.8 | 3.2 | 62.88 | 10.83 | 5124 | 34.1 | 2098 | 36.6 | 84.4 | 87.77 | 140.11 | 20,860 | 19,259 | 76.2 | 2122.26 | 56.83 | 3.29 |
| 2012 | 3.1 | 3991 | 21.99 | 42.43 | 31,499 | 33.8 | 20,422.62 | 3 | 69.46 | 11.08 | 4964 | 34.7 | 2219 | 36.9 | 86.4 | 87.82 | 178.21 | 21,852 | 26,833 | 77.9 | 2222.2 | 59.38 | 3.52 |
| 2013 | 3.1 | 4123 | 24.03 | 43.8 | 34,211 | 35.7 | 21,740.7 | 2.9 | 78.25 | 11.57 | 4982 | 34.4 | 2289 | 37.6 | 90 | 90.88 | 288.1 | 22,790 | 29,482 | 82 | 2297.2 | 66.66 | 3.66 |
| 2014 | 3.0 | 4265 | 27.27 | 45.2 | 37,072 | 37.1 | 23,672.1 | 2.7 | 85.9 | 11.67 | 5149 | 38.18 | 2375 | 38.3 | 92.8 | 92.51 | 317.58 | 25,257 | 33,366 | 83.8 | 2340.03 | 62.25 | 3.8 |
| 2015 | 3.0 | 4441 | 27.71 | 46.85 | 39,123 | 40.2 | 25,575.6 | 2.6 | 94.46 | 12.06 | 5155 | 38.35 | 2503 | 37.7 | 96 | 93.58 | 360.16 | 27,355 | 47,766 | 86 | 2344.9 | 60.61 | 3.73 |
| Subsystem | Order Parameters of Each Subsystem | Information Quantity | Order Parameters Weights |
|---|---|---|---|
| Demographic change | Urban unemployment rate (%) | 0.1112 | 0.421 |
| Resident population in urban areas (million persons) | 0.0503 | 0.191 | |
| Proportion of urban employment to total employment (%) | 0.0576 | 0.218 | |
| Population urbanization rate (%) | 0.0450 | 0.170 | |
| Economic development | Per capita GDP (Yuan) | 0.0772 | 0.197 |
| Tertiary Industry Proportion (%) | 0.1106 | 0.283 | |
| Disposable income of urban residents | 0.0592 | 0.152 | |
| Comparison of consumption level between urban and rural residents (rural residents = 1) | 0.0844 | 0.216 | |
| Urban fixed asset investment accounted for GDP ratio (Hundred million yuan) | 0.0595 | 0.152 | |
| Spatial structure | The per capita road area of urban residents (sq.m) | 0.2739 | 0.206 |
| Density of urban population (persons/sq.km) | 0.5686 | 0.428 | |
| Per capita living space of urban residents (sq.m) | 0.2731 | 0.205 | |
| Built-up area (sq.km) | 0.2143 | 0.161 | |
| Environmental quality | Green coverage rate of built-up area (%) | 0.0818 | 0.154 |
| Harmless treatment rate of municipal solid waste (%) | 0.0920 | 0.173 | |
| Urban sewage treatment rate (%) | 0.0920 | 0.173 | |
| environmental governance investment (hundred million yuan) | 0.2652 | 0.500 | |
| Social development | Public transport standard operating vehicle numbers | 0.0893 | 0.098 |
| Total amount of patent authorization | 0.1751 | 0.194 | |
| Gas popularization rate (%) | 0.1209 | 0.134 | |
| Medical insurance numbers in cities and towns | 0.2455 | 0.272 | |
| Internet computer numbers per 100 households in cities and towns | 0.1632 | 0.181 | |
| Bed numbers in hospital health centers at the end of the year (104) | 0.1088 | 0.121 |
| Year | Demographic Change | Economic Development | Spatial Structure | Environmental Quality | Social Development | ||||||||||||||||||
|---|---|---|---|---|---|---|---|---|---|---|---|---|---|---|---|---|---|---|---|---|---|---|---|
| e11 | e12 | e13 | e14 | e21 | e22 | e23 | e24 | e25 | e31 | e32 | e33 | e34 | e41 | e42 | e43 | e44 | e51 | e52 | e53 | e54 | e55 | e56 | |
| 2006 | 0.0000 | 0.0000 | 0.0000 | 0.0000 | 0.0000 | 0.1238 | 0.0000 | 0.0000 | 0.0000 | 0.0463 | 0.6117 | 0.0000 | 0.0000 | 0.0000 | 0.0000 | 0.0000 | 0.0000 | 0.0000 | 0.0000 | 0.0157 | 0.0000 | 0.0000 | 0.0000 |
| 2007 | 0.2000 | 0.1179 | 0.0107 | 0.0902 | 0.1094 | 0.1524 | 0.1057 | 0.0000 | 0.0879 | 0.4213 | 0.0601 | 0.0833 | 0.1165 | 0.2727 | 0.1127 | 0.1882 | 0.0726 | 0.0336 | 0.0413 | 0.1047 | 0.0134 | 0.0819 | 0.1384 |
| 2008 | 0.2000 | 0.2495 | 0.0222 | 0.2131 | 0.2316 | 0.0000 | 0.2170 | 0.0000 | 0.1671 | 0.0000 | 0.0000 | 0.0227 | 0.2160 | 0.4727 | 0.4225 | 0.4112 | 0.0556 | 0.2088 | 0.0915 | 0.0000 | 0.0834 | 0.2122 | 0.3145 |
| 2009 | 0.0000 | 0.3789 | 0.1308 | 0.3345 | 0.2861 | 0.1238 | 0.2893 | 0.0000 | 0.3552 | 0.2500 | 1.0000 | 0.1591 | 0.2840 | 0.6364 | 0.5835 | 0.6434 | 0.0988 | 0.3928 | 0.1454 | 0.3141 | 0.7716 | 0.3076 | 0.5912 |
| 2010 | 0.2000 | 0.4321 | 0.1521 | 0.3927 | 0.4344 | 0.0857 | 0.3882 | 0.0000 | 0.3830 | 0.1620 | 0.7299 | 0.2348 | 0.4066 | 0.6727 | 0.7283 | 0.7799 | 0.1400 | 0.4288 | 0.2657 | 0.3403 | 0.8165 | 0.4401 | 0.6101 |
| 2011 | 0.2000 | 0.5457 | 0.3817 | 0.5433 | 0.5969 | 0.2286 | 0.5318 | 0.2500 | 0.4289 | 0.4306 | 0.7798 | 0.3561 | 0.5085 | 0.6909 | 0.7666 | 0.7869 | 0.1697 | 0.5606 | 0.3296 | 0.4869 | 0.8643 | 0.7836 | 0.6792 |
| 2012 | 0.8000 | 0.6765 | 0.4911 | 0.6785 | 0.7062 | 0.3905 | 0.6731 | 0.5000 | 0.5479 | 0.5463 | 0.9278 | 0.4470 | 0.6553 | 0.7455 | 0.8068 | 0.7887 | 0.3134 | 0.6277 | 0.5077 | 0.5759 | 0.9252 | 0.8397 | 0.8239 |
| 2013 | 0.8000 | 0.7714 | 0.6726 | 0.7782 | 0.8107 | 0.5714 | 0.7568 | 0.6250 | 0.7069 | 0.7731 | 0.9112 | 0.4015 | 0.7403 | 0.8727 | 0.8793 | 0.9010 | 0.7281 | 0.6911 | 0.5700 | 0.7906 | 0.9709 | 1.0000 | 0.9119 |
| 2014 | 1.0000 | 0.8735 | 0.9609 | 0.8800 | 0.9210 | 0.7048 | 0.8793 | 0.8750 | 0.8452 | 0.8194 | 0.7567 | 0.9742 | 0.8446 | 1.0000 | 0.9356 | 0.9607 | 0.8393 | 0.8581 | 0.6614 | 0.8848 | 0.9970 | 0.9029 | 1.0000 |
| 2015 | 1.0000 | 1.0000 | 1.0000 | 1.0000 | 1.0000 | 1.0000 | 1.0000 | 1.0000 | 1.0000 | 1.0000 | 0.7512 | 1.0000 | 1.0000 | 0.8909 | 1.0000 | 1.0000 | 1.0000 | 1.0000 | 1.0000 | 1.0000 | 1.0000 | 0.8668 | 0.9560 |
| Year | u1(e1) | u2(e2) | u3(e3) | u4(e4) | u5(e5) | SD | sd |
|---|---|---|---|---|---|---|---|
| 2006 | 0 | 0.035 | 0.271 | 0 | 0.002 | ||
| 2007 | 0.124 | 0.094 | 0.148 | 0.130 | 0.061 | −0.0929 | −0.0929 |
| 2008 | 0.173 | 0.104 | 0.039 | 0.245 | 0.137 | −0.1557 | −0.0542 |
| 2009 | 0.158 | 0.189 | 0.558 | 0.350 | 0.446 | 0.2553 | −0.1165 |
| 2010 | 0.267 | 0.227 | 0.459 | 0.435 | 0.515 | 0.2928 | −0.0752 |
| 2011 | 0.364 | 0.382 | 0.577 | 0.460 | 0.643 | 0.4087 | 0.0893 |
| 2012 | 0.688 | 0.543 | 0.707 | 0.548 | 0.741 | 0.5729 | 0.1424 |
| 2013 | 0.763 | 0.679 | 0.751 | 0.806 | 0.840 | 0.6925 | 0.1028 |
| 2014 | 0.947 | 0.832 | 0.828 | 0.902 | 0.887 | 0.8038 | 0.0996 |
| 2015 | 1 | 1 | 0.894 | 0.983 | 0.971 | 0.8945 | 0.0832 |
© 2017 by the authors. Licensee MDPI, Basel, Switzerland. This article is an open access article distributed under the terms and conditions of the Creative Commons Attribution (CC BY) license (http://creativecommons.org/licenses/by/4.0/).
Share and Cite
Jiao, L.; Deng, F.; Liang, X. Sustainable Urbanization Synergy Degree Measures—A Case Study in Henan Province, China. Sustainability 2018, 10, 9. https://doi.org/10.3390/su10010009
Jiao L, Deng F, Liang X. Sustainable Urbanization Synergy Degree Measures—A Case Study in Henan Province, China. Sustainability. 2018; 10(1):9. https://doi.org/10.3390/su10010009
Chicago/Turabian StyleJiao, Leilei, Fumin Deng, and Xuedong Liang. 2018. "Sustainable Urbanization Synergy Degree Measures—A Case Study in Henan Province, China" Sustainability 10, no. 1: 9. https://doi.org/10.3390/su10010009
APA StyleJiao, L., Deng, F., & Liang, X. (2018). Sustainable Urbanization Synergy Degree Measures—A Case Study in Henan Province, China. Sustainability, 10(1), 9. https://doi.org/10.3390/su10010009