Article

Research and Development Strategy for Fishery Technology Innovation for Sustainable Fishery Resource Management in North-East Asia

1
Graduate School of Fisheries and Environmental Sciences, Nagasaki University, 1–14 Bunkyo-machi, Nagasaki 852-8521, Japan
2
Organization for Marine Science and Technology, Nagasaki University, 1-14 Bunkyo-machi, Nagasaki 852-8521, Japan
3
Institute of Aquaculture, University of Stirling, Stirling FK9 4LA, UK
4
Institute for East China Sea Research, Nagasaki University, 1551-7 Taira-machi, Nagasaki 851-2213, Japan
*
Author to whom correspondence should be addressed.
Sustainability 2018, 10(1), 59; https://doi.org/10.3390/su10010059
Submission received: 30 November 2017 / Revised: 20 December 2017 / Accepted: 26 December 2017 / Published: 28 December 2017

Abstract

:
The development of fishery technologies supports food sustainability to achieve a steady supply of fish and fishery products. However, the priorities for research and development (R&D) in fishery technologies vary by region due to differences in fish resource availability, environmental concerns, and consumer preferences for fishery products. This study examines trends in fishery technology innovations using data on patents granted as an indicator of changing R&D priorities. To clarify changes in R&D priorities, we apply a decomposition analysis framework that classifies fishery technologies into three types: harvesting, aquaculture, and new products. This study mainly focuses on China, Japan, and Korea as the major fishing countries in the north-east Asia region. The results show that the number of fishery technology patents granted increased between 1993 and 2015; in particular, the number of aquaculture patents granted has grown rapidly since 2012. However, the trend in Japan was the opposite, as the apparent priority given to aquaculture technology innovation decreased between 1993 and 2015. The trends and priority changes for fishery technology inventions vary by country and technology group. This implies that an international policy framework for fishery technology development should recognize that R&D priorities need to reflect diverse characteristics across countries and the technologies employed.

1. Introduction

Fish and fishery products are important for maintaining a healthy diet [1] and are a major source of nutrition for hundreds of millions of people worldwide [2]. Marine fishery resources are perishable goods dramatically affected by fishing and storage conditions. Furthermore, fishery is an export-oriented sector, in which information asymmetry plays a fundamental role in relation to product origins [3]. The demands for fish and fishery products are expected to increase in the future due to population expansion in developing countries [4] and to increase per capita consumption driven mainly by developing countries, especially China [5]. This report expects that food fish supply per capita will increase in China, India, and Brazil by 19.5%, 11.7%, and 32.3%, respectively, by 2025, which is the target year for the global improvements in maternal, infant and young child nutrition outlined in the Rome Declaration on Nutrition [5]. This growth is expected to significantly increase worldwide demand for fish and fishery products.
The rapid growth in demand for fish and fishery products increases the risk of stock depletion due to over-exploitation. The Food and Agriculture Organization of the United Nations (FAO) [5] has pointed out that marine fish stocks declined from 1974 to 2011, and the remainder were estimated to be fished at a biologically unsustainable level. To move towards solving the problem of overfishing, recently some indicators of sustainability (e.g., marine ecological footprint, fishprint, primary production required) have been analysed [6] and several types of tools and management strategies (e.g., total allowable catches, marine protected areas, and individual transferable quotas) have been created [7]. Additionally, marine resource management was individually established as goal 14, “Conserve and sustainably use the oceans and marine resources for sustainable development”, in the sustainable development goals (SDGs) adopted by the United Nations [8].
Technology development is another important factor in satisfying the future demand for fish and fishery products by improving the catchability of the harvesting sector and preventing resource depletion [9]. Additionally, new aquaculture technology can boost production, supply high-quality fish products, and contribute to the protection of fragile aquatic environments [10]. In addition to fishing and aquaculture technology, new fish product technologies contribute to economic development, e.g., through value-adding processing such as surimi technology [11]. Therefore, fishery technology development plays an important role in achieving sustainable fishery resource management [12].
However, the priority for research and development (R&D) differs based on the type of fishery technology due to differences in the incentives for technology development (e.g., expected profit, policy and regulation, availability of financing). Additionally, R&D strategies for fishery technology differ between countries due to varying dietary cultures and available fish resources. Understanding the diversity of fishery resources and fishery technologies available or under development is an essential step towards obtaining international agreements for fishery resource conservation [13].
To consider the characteristics of fishery technologies, we applied patent data with the fishery technology classification used by the Organisation for Economic Co-operation and Development [14]. By following this classification, we can separate fishery technologies into three types: harvesting technology, aquaculture technology, and new products technology. A description of each technology is provided in Table 1, and a list of patent classifications is introduced in Table S1 in the supplementary material.
Patent data analyses are widely applied to evaluate R&D activities in the fields of engineering, economics, and corporate management [15]. Nicol et al. [16] explained the technological development of Antarctic krill products using krill-related patents-granted data. Popp [17] analysed the effect of energy prices on R&D activities using patent data. He considered the share of energy-related patents granted of total patents granted as the proxy variable of R&D priority for energy technology. Fujii [18] uses this R&D priority idea to develop the framework of patent decomposition analysis.
Previous studies on fishery technology innovations do not clearly consider the diversity of countries and technological characteristics (e.g., Ninan et al. [19], Ninan and Sharma [20]). The objective of this study is to clarify R&D strategy changes for fishery technology development using patent data categorized by country and technology type. The novelty of this study is that it is the first to analyse R&D strategy through the use of fishery technology patent innovations and the application of a decomposition analysis framework. By using decomposition analysis, we can identify the factors affecting fishery technology patents, which is key information needed to support an effective R&D development policy.
According to Fujii and Managi [21], technology innovation is induced by future business market expansion. Additionally, fishery technology development is driven by fish resource conservation and environmental protection [22]. As explained above, demand for fish and fishery products will significantly increase, especially in developing countries. Additionally, international treaties and agreements for marine resource management become stricter every year [23]. Under strict harvesting rules for marine resources, fishery companies will need to invest in fishing gear and geographic information systems for marine resource conservation, which will decrease the incentive to continue harvesting activities [2]. Meanwhile, the opportunity for aquaculture business will increase, especially in China [2]. The demand for technology will directly affect the technological development strategy, which is a key factor in R&D activities [21].
To investigate the research objective more clearly, we established two research hypotheses.
Hypothesis 1.
The R&D priority for fishery technology development increased in fishing countries.
Hypothesis 2.
The R&D priority placed on aquaculture technology development in fishing countries increased more than that placed on harvesting technology development.

2. Materials and Methods

We employed a decomposition analysis framework to identify changes in the factors involved in fishery technological patents granted. In a decomposition analysis, we use three specific technology groups: harvesting technology, aquaculture technology, and new products technology. To decompose patents granted in the field of fisheries technology, we used three indicators: the priority of the specific fisheries technology (PRIORITY), the importance of fisheries technology in all patents granted (FISHERY), and the scale of R&D activity (SCALE).
We define the PRIORITY indicator as the number of each specific group of fishery technology patents granted divided by the total number of fishery technology patents granted, which gives us the share of specific fishery technology patents granted within the total. This indicator will increase if the number of specific fishery technology patents granted increases more quickly than the total number of fishery technology patents granted, indicating that inventors are concentrating their research resources on these specific technology areas.
Similarly, the FISHERY indicator is defined as the total number of fishery technology patents granted divided by the total number of all patents granted, which gives the share of total fishery technology patents granted within the total. This indicator will increase if the number of total fishery technology patents granted increases more quickly than the number of all patents granted, thus indicating that inventors are concentrating their research resources on fishery technology innovations.
Finally, the SCALE indicator is defined as the total number of all patents granted, which represents the scale of R&D activities. SCALE increases if the total number of all patents granted increases. The number of patents granted for fishery technologies increases due to an increase in overall R&D activities if the SCALE score increases.
Here, we introduce the decomposition approach using the harvesting technology patent group as the specific fisheries technology patents granted (see Table 1). This follows the methodology introduced by Ang et al. [24] to calculate a logarithmic mean divisia index (LMDI). The number of harvesting technology patents granted (HARVEST) is decomposed using the total fisheries technology patents granted (FTECH) and total patents granted (TOTAL), as in Equation (1).
HARVEST = HARVEST FTECH × FTECH TOTAL × TOTAL = PRIORITY × FISHERY × SCALE
Following Ang et al. [24], we obtained Equation (2) by using logarithmic function. where ω i t = ( HARVEST t HARVEST t 1 ) / ( lnHARVEST t lnHARVEST t 1 ) .
HARVEST t HARVEST t 1 = Δ HARVEST t , t 1          = ω i t ln ( PRIORITY t PRIORITY t 1 ) + ω i t ln ( FISHERY t FISHERY t 1 ) + ω i t ln ( SCALE t SCALE t 1 )
Therefore, the changes in the number of patents granted for harvesting technologies (ΔHARVEST) are decomposed by changes in PRIORITY (first term), FISHERY (second term) and SCALE (third term). The term ω i t operates as an additive weight for the estimated number of patents granted for harvesting technologies.
In this study, we apply a further transformation of the LMDI to clarify the change ratio of patents granted. We define this ratio as the percentage of change in the number of patents granted in comparison with the base year (t0). To decompose the change ratio, we transform Equation (2) to (3).
C h a n g e   r a t i o H A R V E S T t , t 0 = HARVEST t HARVEST t 0 HARVEST t 0 = Δ HARVEST t , t 0 HARVEST t 0 = ω i t l n ( PRIORITY t PRIORITY t 1 ) × 1 HARVEST t 0 + ω i t l n ( FISHERY t FISHERY t 1 ) × 1 HARVEST t 0 + ω i t l n ( SCALE t SCALE t 1 ) × 1 HARVEST t 0
One advantage of using the change ratio is that decomposition analysis results can reveal the relative change in different time periods. In this study, we propose a patent decomposition framework to distinguish the change in the priority placed on specific fishery technology innovations from that placed on total fishery technology innovations.

3. Data

We used patents granted data from PATENTSCOPE provided by the World Intellectual Property Organization (WIPO). The PATENTSCOPE database covers more than 56 million patents granted from 1978 to 2015. Data coverage by country and period is shown in Table S2 in the supplementary materials. We specified fishery technology patents based on the Organisation for Economic Co-operation and Development (OECD) [14] classification.
Since PATENTSCOPE data coverage for Japan, which is a major fishery technology innovator, started after 1993, we used a patent dataset from 1993 to 2015 (see Table S2). Following Fujii [18] and Fujii and Managi [21], we used only the primary international patent classification (IPC) code to categorize the technology group to avoid the double counting of patent data in each technology group. The limitations of patent data availability should be noted. Patent data are available only if the target country has constructed a patent registration system, which is not the case for all developing countries. Patent data analysis will therefore not be an appropriate methodology to evaluate the technology development in these countries.

4. Results and Discussion

4.1. Trend in Fishery Technology Patents Granted

In China, 50,914 fishery technology patents were granted by the state intellectual property office of the People’s Republic of China (see Table 2). China, Korea, and Japan represent 67.75% of fishery technology patents granted worldwide, and China in particular has a large share (42%). Country characteristics strongly affected the patents granted trend. The share of harvesting patents is greater than 50% in Korea and Japan, while China has a large share of aquaculture technology patents.
The number of fishery technology patents granted increased rapidly in all three technological groups (See Table 3). This rapid growth was caused by an increase in patents granted in China; in particular, aquaculture patents granted have significantly increased in the last decade. One interpretation of this result is that Chinese patent application law was revised in 2001 and 2009, making patent applications easier for Chinese companies through a subsidised programme. Additionally, the Chinese government tried to increase international market competitiveness though patents granted after China became a World Trade Organization (WTO) member in 2001 [25]. Hu et al. [26] investigated the relationship between patent applications and two economic indicators (labour productivity and R&D expenditure). They concluded that there is no significant relationship between the applicant’s internal factors and patent application behaviour, which means that a rapid increase in patent applications is mainly caused by external factors, such as a revision of patent law and a new subsidy system. Based on these points, the revision of the Chinese patent application system contributed by increasing all patent applications in China, which affected the growth of fishery technology patents.

4.2. Results of Decomposition Analysis

The results of a decomposition analysis for specific fishery technology patents granted are described in Figure 1, Figure 2 and Figure 3. The figures show the differences in the factors driving patents granted according to the type of fishery technology. In Figure 1, Figure 2 and Figure 3, the vertical axis represents the change ratios of harvesting technology patents granted based on the year 1993. The plotted line shows the change ratio of harvesting technology patents granted, and the bar chart shows the effects of three decomposed factors on the change ratio of patents granted for harvesting technologies. The sum of the bars is equivalent to the value of the plotted line.
The results of the decomposition analysis by country are described in Table 4, Table 5 and Table 6. Additionally, the patent portfolios are represented in Figures S1–S3 in the supplementary material. This study then examined whether the pattern of technology development varied across the countries and time periods.

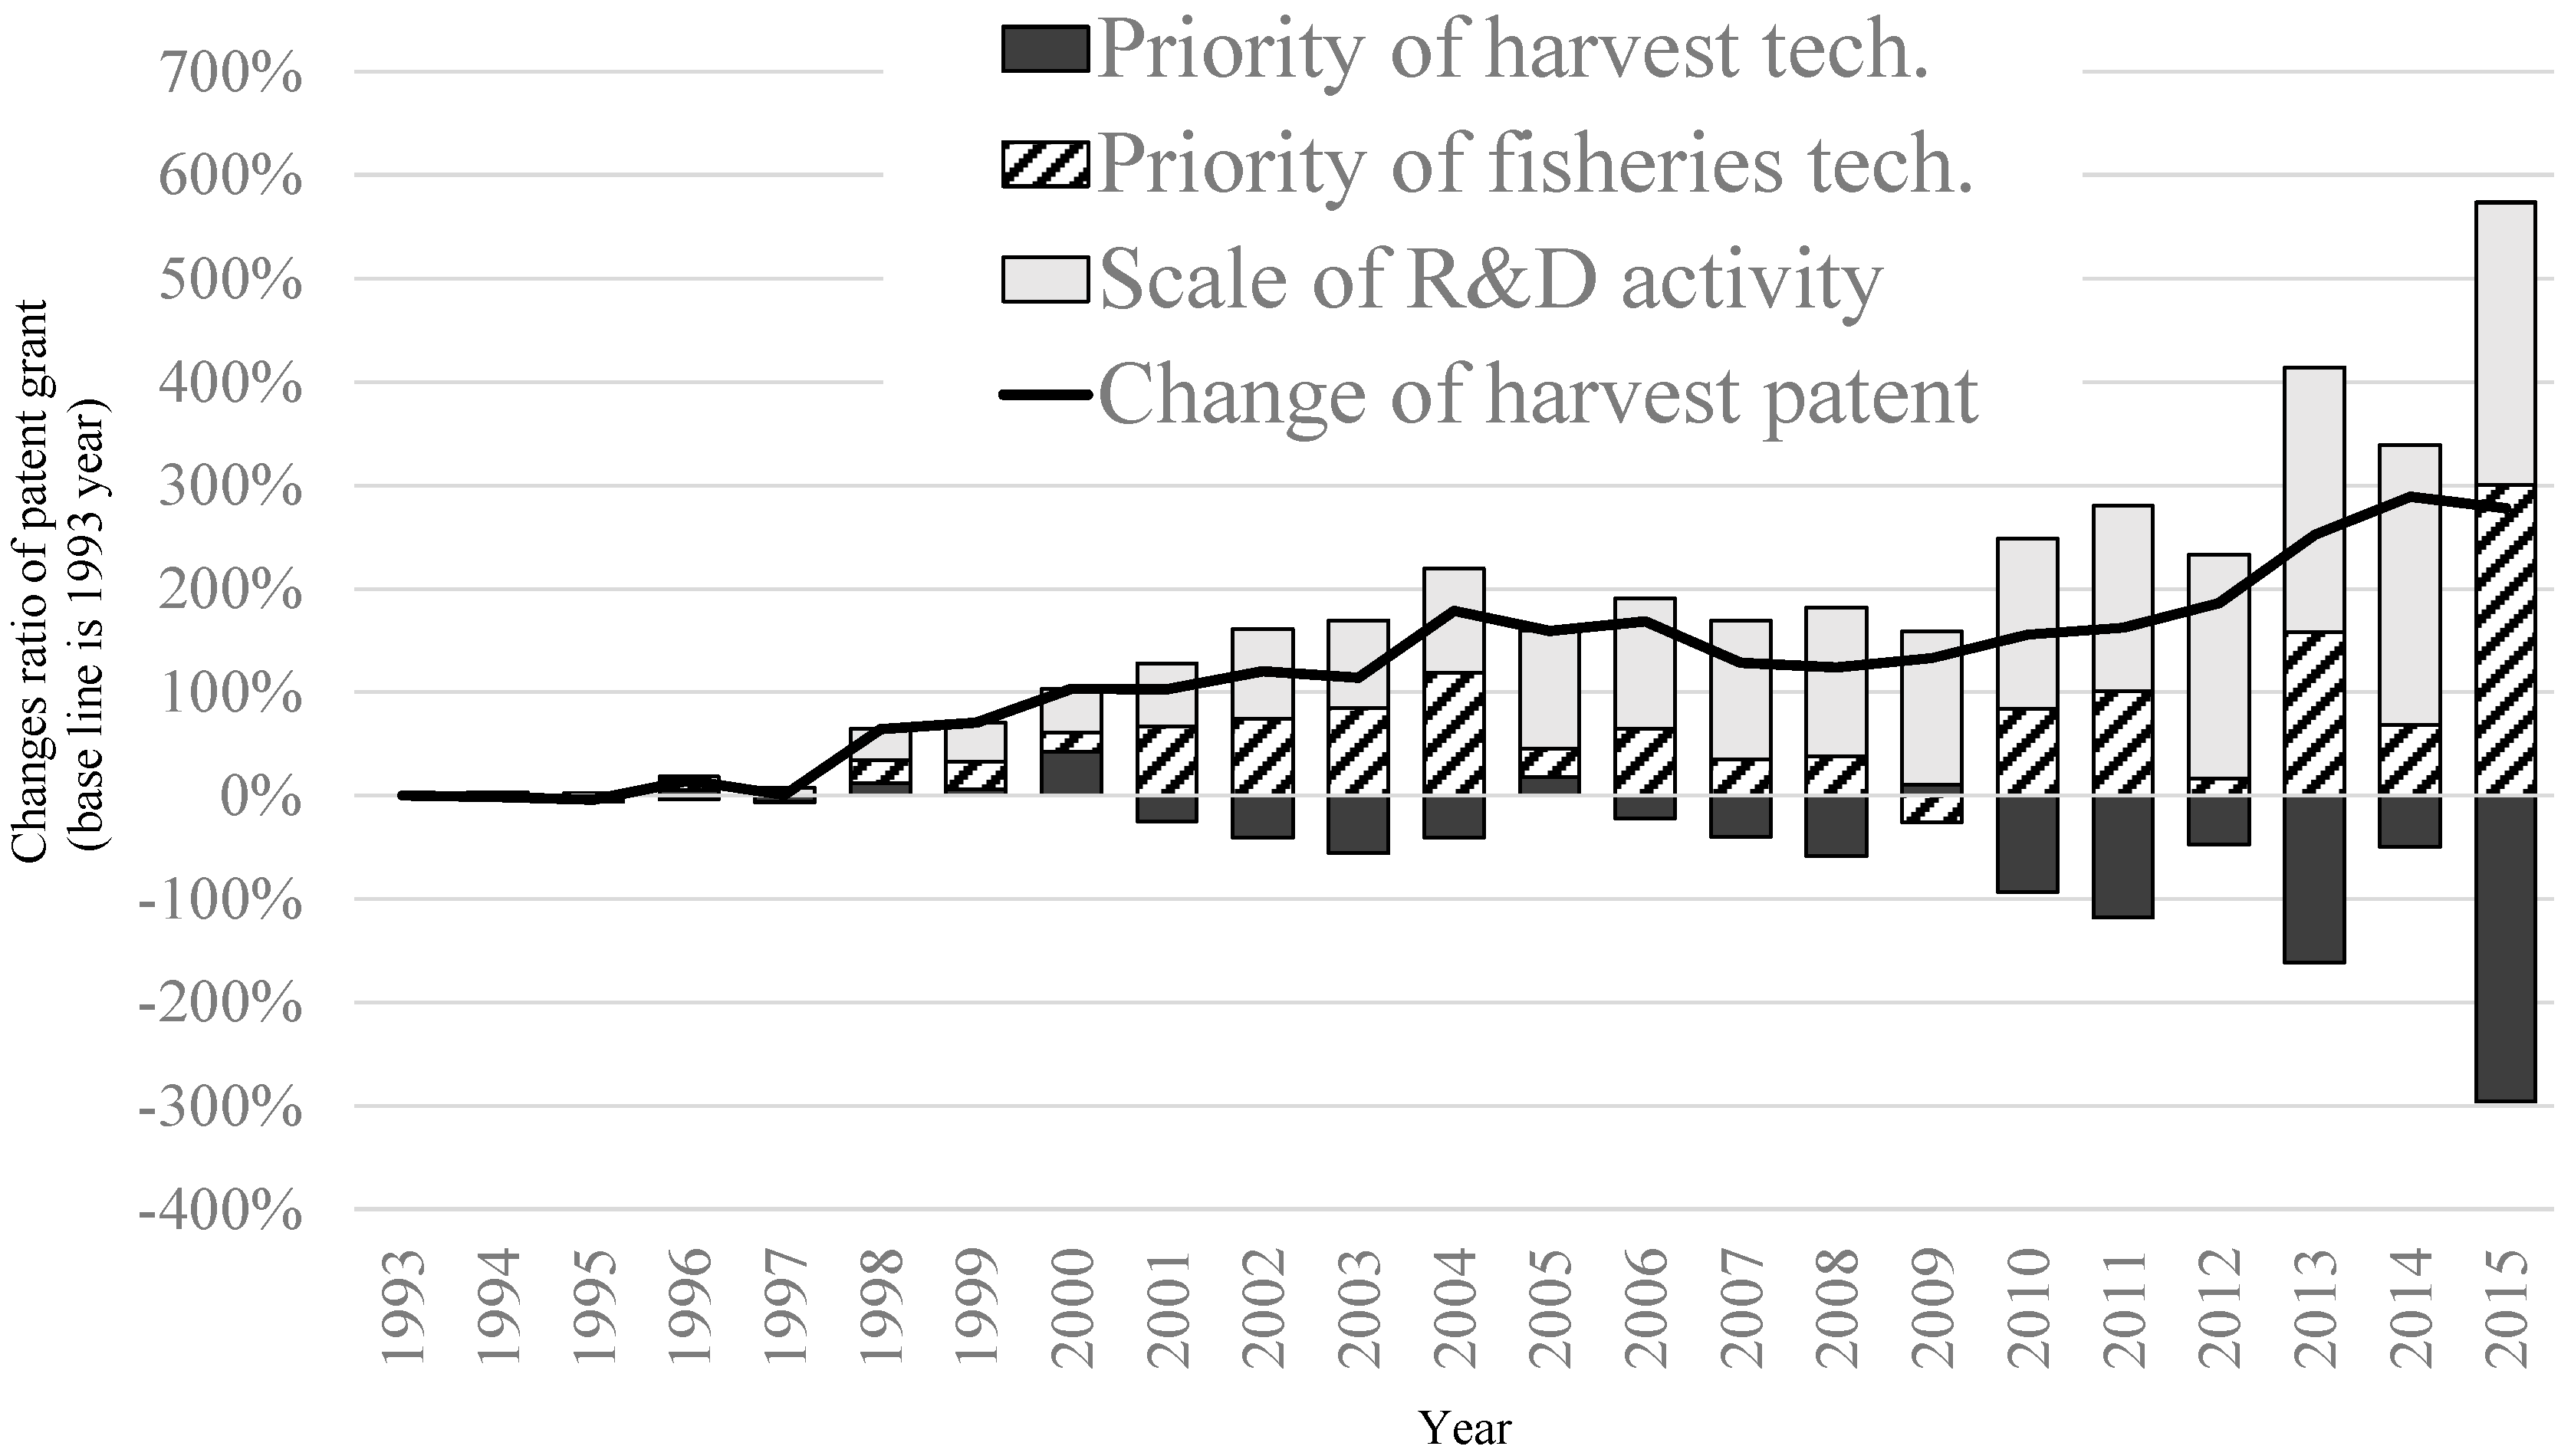
4.2.1. Harvesting Technology

The results of a decomposition analysis of patents granted for harvesting technologies are described in Figure 1. Harvest patents increased from 1997 to 2004, were relatively stable until 2011, and then increased rapidly afterwards. The decomposition analysis indicates that the main driver of the increase in harvest patents from 1997 to 2004 was an increase in the priority of fishery technologies and the scaling up of R&D activity (see bar chart in Figure 1). During this period, harvest patents increased rapidly in Korea (see Table 3). Meanwhile, the priority of harvesting technologies was relatively unchanged compared with the other two decomposed factors. This result suggests that the patents granted for harvesting technologies show a similar trend to the total fisheries technology patents granted (i.e., HARVEST/FTECH is relatively stable).
From 2004 to 2012, the change ratio is stable, while the driving factors of harvest technology patent invention fluctuate, especially from 2009 to 2011. After 2009, the priority placed on harvesting technology decreased, while the priority placed on fishery technologies increased, which indicates that R&D priorities shifted from harvesting technologies to other fishery technologies. This trend became stronger after 2012. It should be noted that these structural changes in the priority and scale factors can be observed using a decomposition approach.
The results for China and the world in Table 4 show that summing the priority of harvesting technology and the priority of fishery technology gives a value close to zero. This indicates that the rate of growth for harvest patents granted is similar to that for all patents granted. Therefore, the increase in harvest patents granted was most likely due to the expansion in the scale of R&D in China and the world.
Another finding is that opposite trends of decomposition factors can be observed between Korea and Japan. Harvest patents granted in Japan increased due to priority growth and the shrinking scale of R&D contributed to the decrease. Meanwhile, Korea increased its harvest patents granted due to an R&D scale expansion, and both priorities decreased.
These results can be interpreted by focusing on the economic situation in other industries. R&D activity in Japan continued to shrink after 1990 with persistent economic sluggishness [21], while Korea achieved rapid economic growth in the 1990s and 2000s due to increasing product competitiveness in the electronics and semi-conductor markets [27]. In this period, patent activity in Korea increased, especially for technologies from large electronics companies (e.g., Samsung and LG electronics) [28]. Therefore, active innovation, as captured by patents in other technologies, decreased the relative R&D priority for harvest and fishery technologies in Korea.
It can be seen that the patent portfolios in world were largely unchanged, while the patent portfolios for China increased the share of accessories for angling and reel technology (see Figure S1). In Japan, the patent share of reels increased and accessories for angling was declined. Finally, Korea increased other catching devices and systems using the reflection more than the other two technologies.

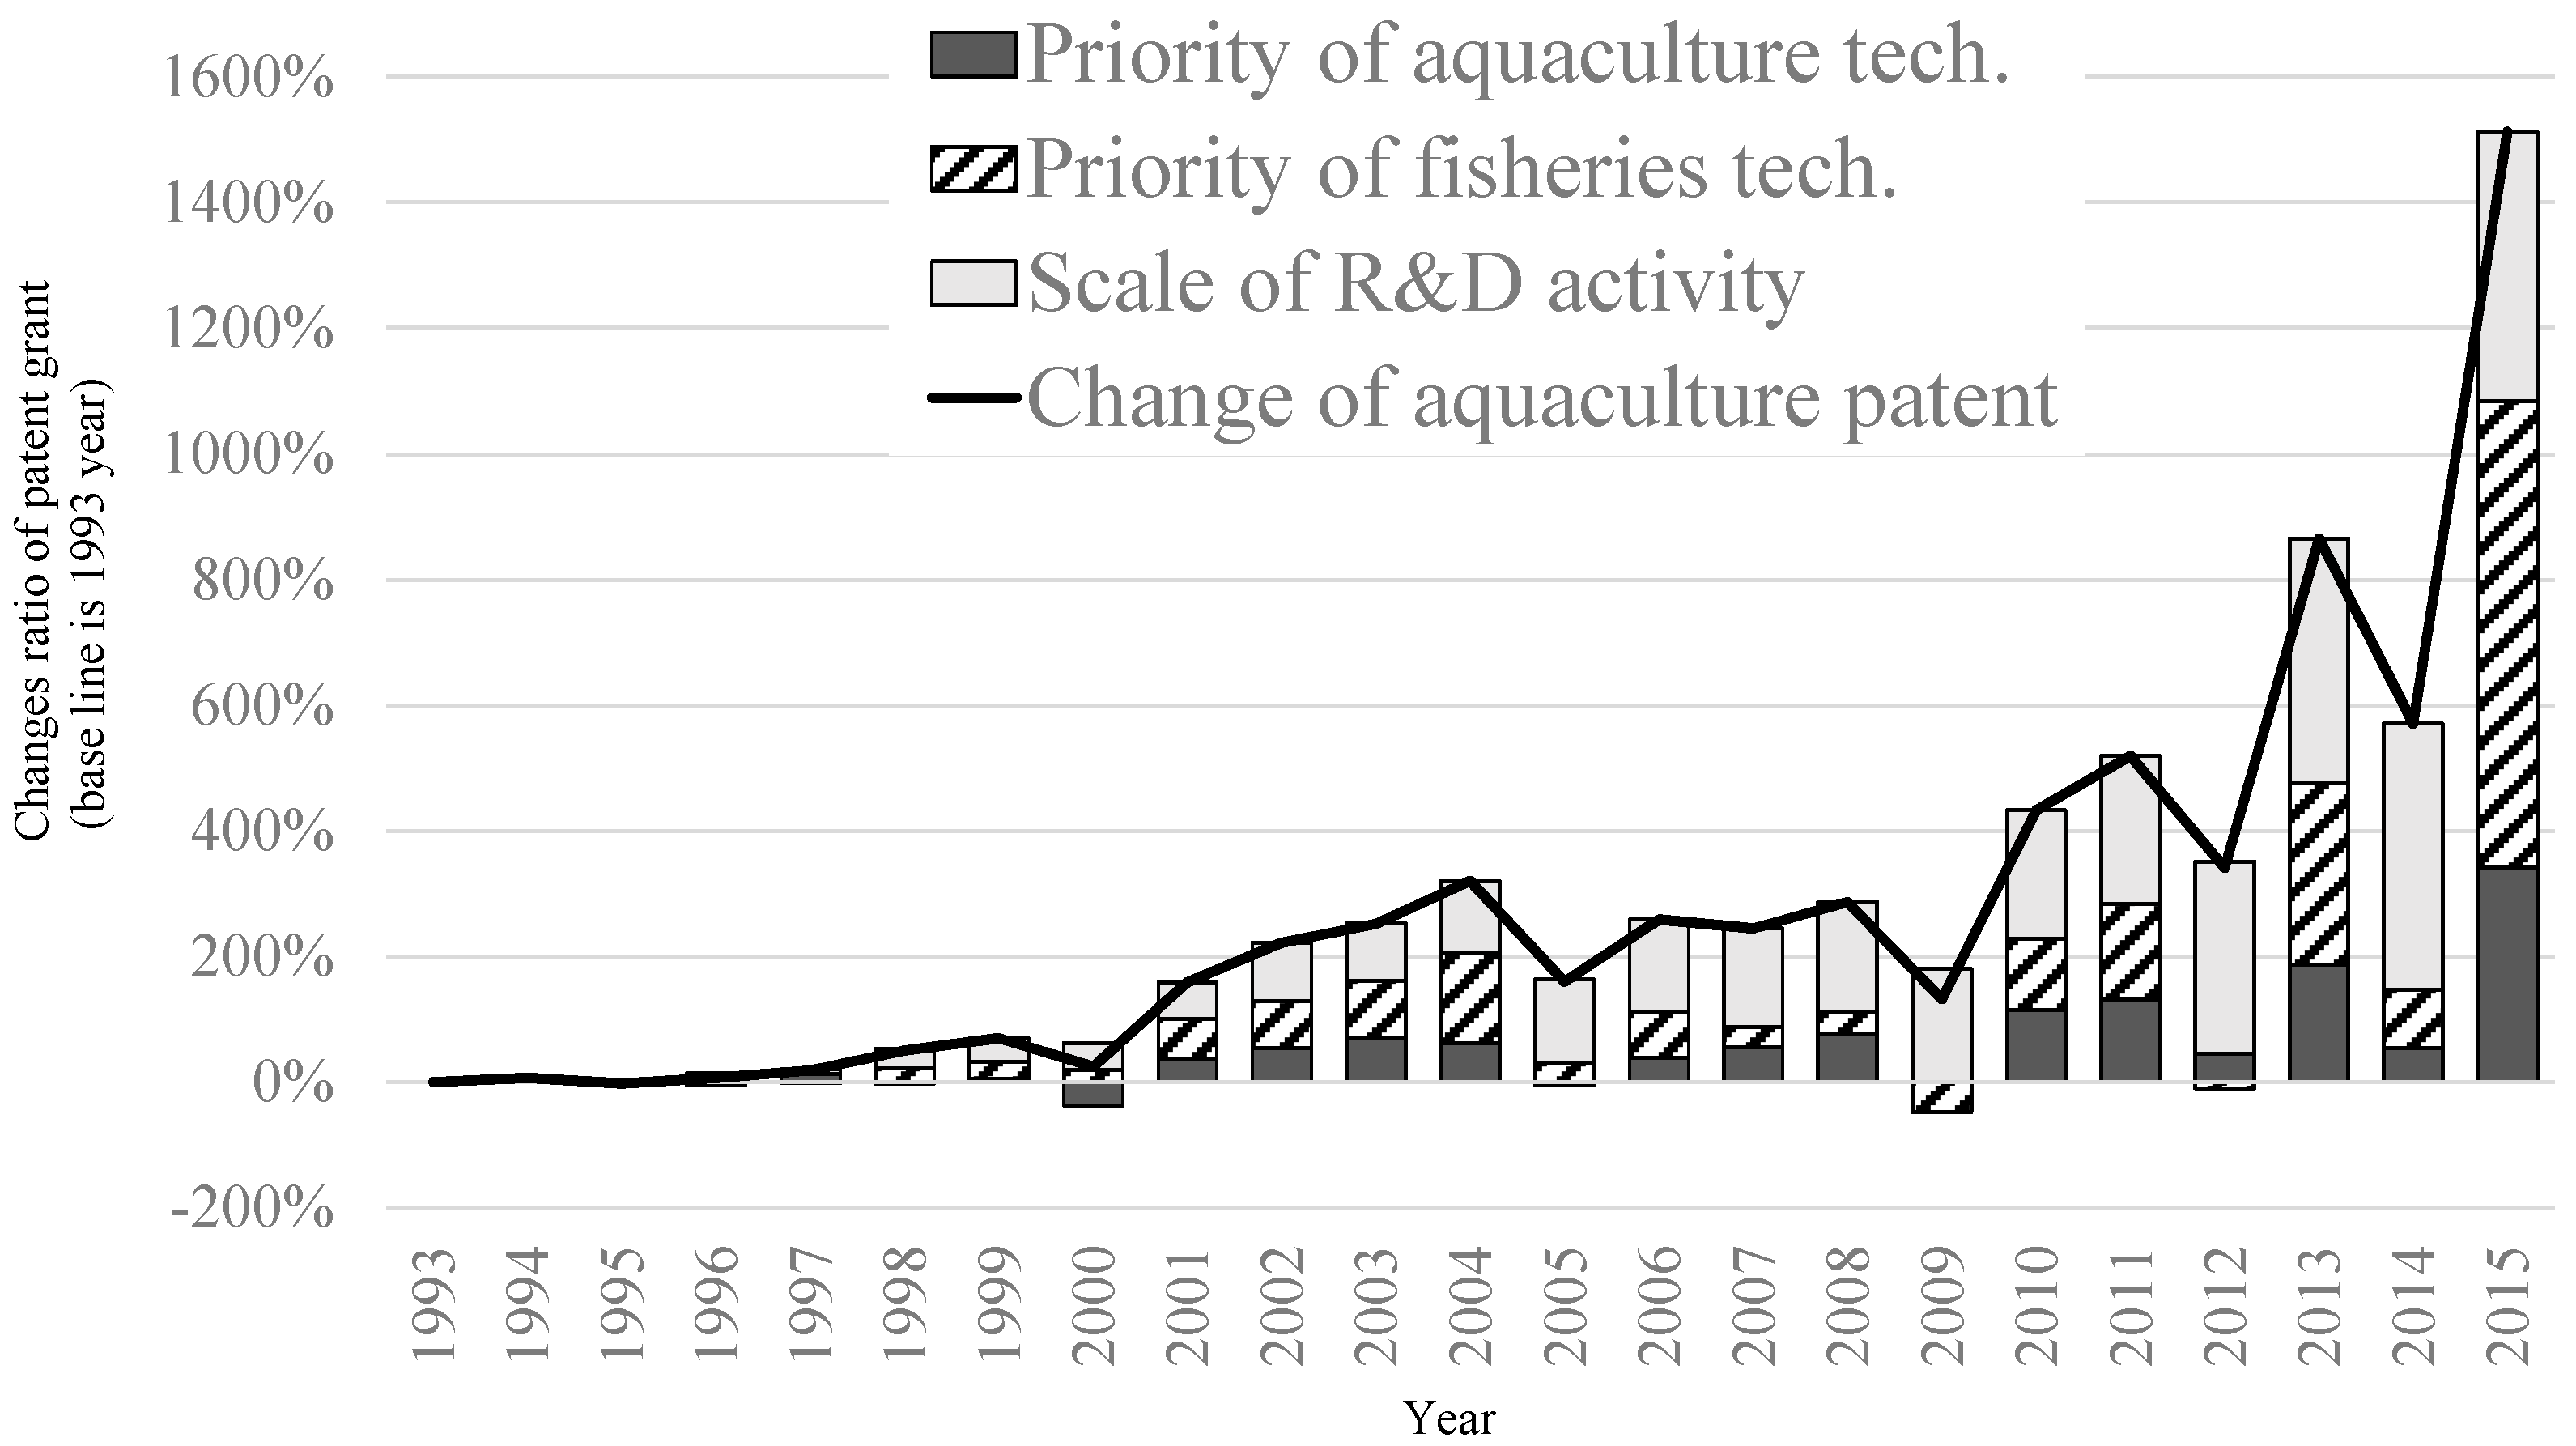
4.2.2. Aquaculture Technology

The number of patents granted for aquaculture technology increased starting in 2009 and showed particularly rapid growth from 2014 to 2015 due to an increase in priority for both aquaculture technology and fishery technology (see Figure 2). The number of patents granted for aquaculture technology increased dramatically starting in 2008. Most of this increase was attributable to China, particularly from 2009 (see Table 5).
It should be noted that approximately half of the aquaculture technology patents granted in China were attained by Chinese universities. This characteristic is unique to China, as private companies are the main patent applicants in other countries. This trend is observed in other technology fields as well (e.g., nanotechnology (see Huang and Wu [29]). Fong et al. [30] note that “China’s National Medium and Long Term Science and Technology Development Planning (2006–2020)” significantly promoted technology transfer for Chinese universities. Furthermore, they conclude that royalties and economic incentives are key factors increasing patenting by Chinese universities.
Additionally, the Chinese government set a high priority on aquaculture technology development in the 13th Five Year Plan (2016–2020) for national progress. This plan promotes the development of new aquaculture technologies among research institutes and universities. Furthermore, technology development for preventing water pollution caused by feed for aquaculture was promoted for environmental protection in China’s 12th Five-Year Plan (2011–2015). These governmental targets can be noted as key factors in the increased priority of aquaculture technology in China starting in 2010.
A total of 90% of the increase in aquaculture technology patents in the world from 1993 to 2015 was due to patents granted in the Chinese patent office (see Table 5). Japan is unique, as it was the only country to decrease the priority of aquaculture technology. This trend is completely opposite to the trend in the other two major fishing countries.
One interpretation of this result is the biased structure of the aquaculture industry in Japan. According to the Ministry of Agriculture, Forestry and Fisheries [31], 75% of inland water aquaculture entities were individually operated in Japan in 2013. Additionally, the average number of workers per entity is 3.3 persons in the inland aquaculture industry, and most of these entities target domestic markets. This type of management entity offers an interpretation for the decrease of R&D priority in Japan, because R&D expenditure and the maintenance of patent protection is costly for small-scale fish farmers [32].
Another reason is that Japanese consumers view aquaculture fish products negatively relative to wild-caught products. Uchida et al. [33], using 3370 questionnaires, found that wild-caught fish products are significantly preferred over farmed fish products by Japanese consumers. Meanwhile, the FAO [34] notes that market competitiveness between farmed and wild fish products is more variable in the U.S. and EU regions. Therefore, the relative market competitiveness of farmed fish products is lower in the Japanese market than in other countries, which decreases the incentive for aquaculture technology patents granted in Japan.
Finally, the share of rearing or breeding animals expanded and that of animal feedstuffs decreased from the 1990s to the 2000s in three countries (see Figure S2). Meanwhile, the share of culture and receptacle technologies is diverse across countries.

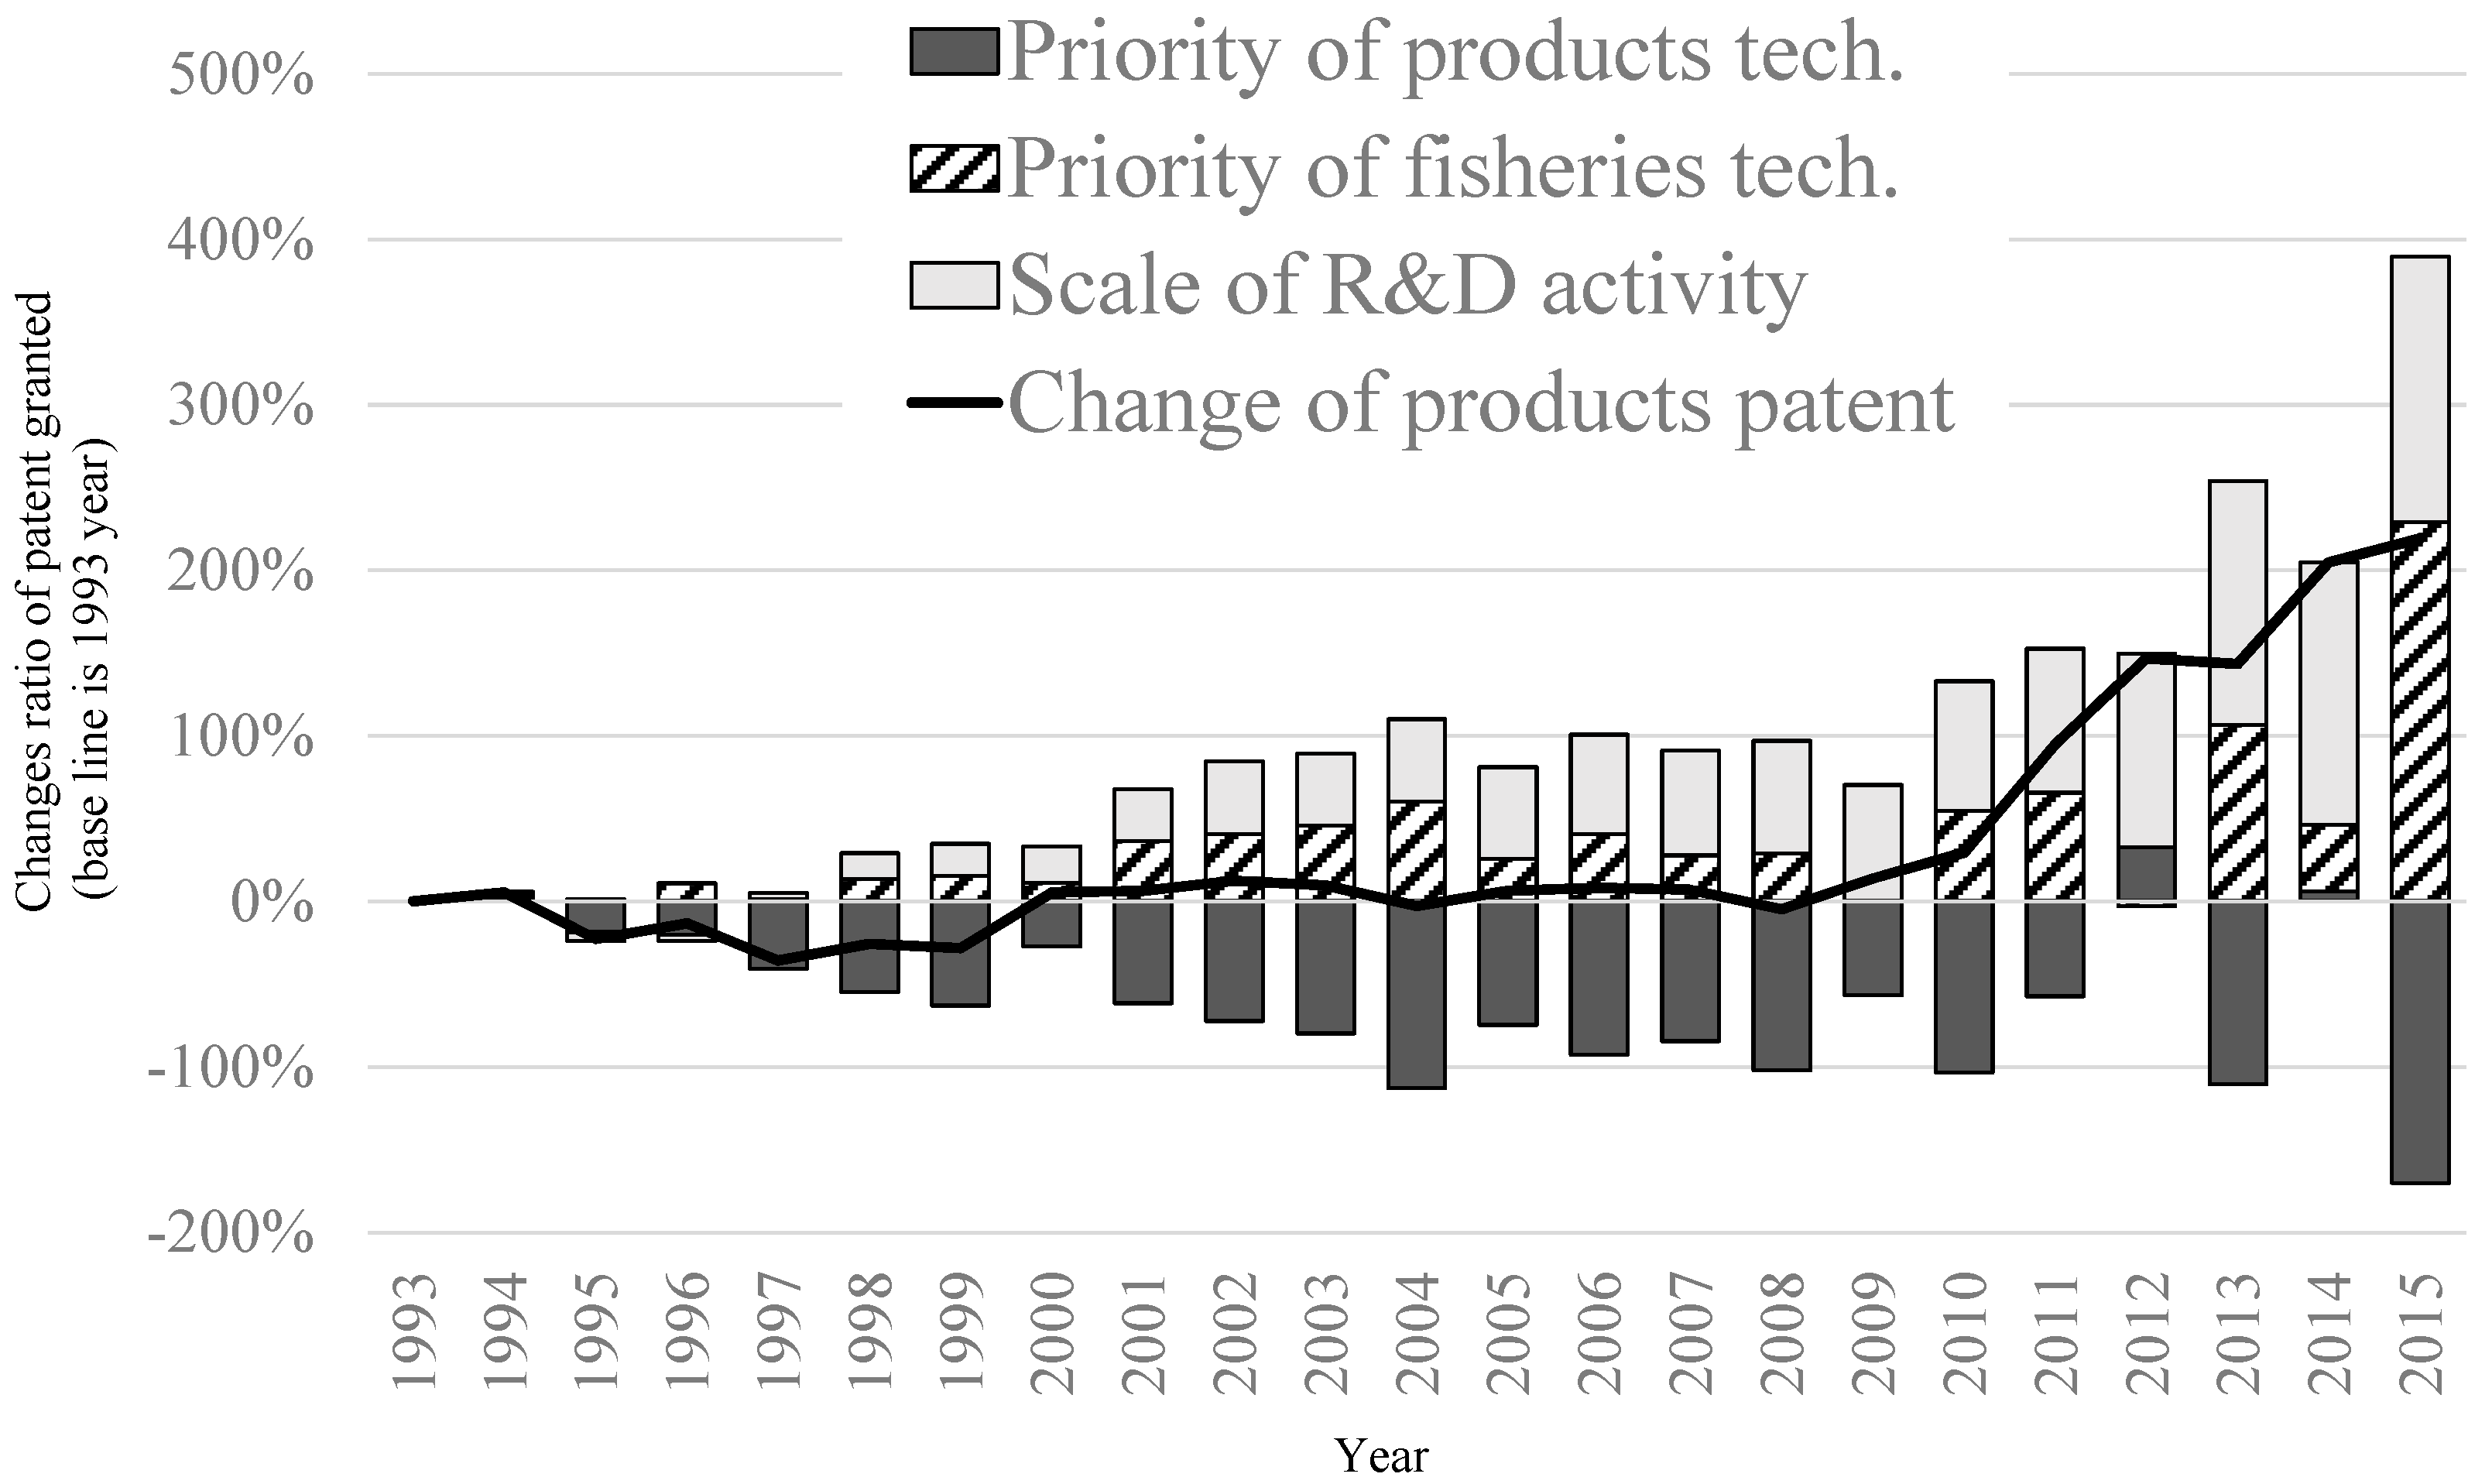
4.2.3. New Products Technology

New fishery product technologies largely did not change from 1993 to 2008, in contrast with the trends for harvest and aquaculture technology (Figure 3). In this period, the priority of product technologies steadily decreased. However, this negative effect was cancelled out by an increase in both the priority of fishery technologies and R&D scale factors.
From 2009, patents granted in product technologies increased due to the growth in both the priority of fishery technology and the scale of R&D activities. This trend is similar to that of harvesting technology (see Figure 1). One interpretation of this result is that developing technology to maintain the freshness of fish caught by marine harvesting directly contributes to an increase in market competitiveness [35]. The multilateralization of harvesting technology under the pressure of marine resource conservation provides an incentive to develop new technologies for appropriate quality maintenance and value-added processing.
Two countries, except Korea, decreased the priority of product technologies from 1993 to 2015 (see Table 6). Additionally, Japan decreased the number of patents granted for both fish and shellfish processing technologies. One interpretation of this result is changing dietary habits in Japan. According to the Fisheries Agency of Japan [36], the annual per capita consumption volume of fish and fishery products declined from 37.5 kilograms per capita in 1993 to 27.0 kilograms per capita in 2013. Fisheries of Japan [36] also noted that fish consumption is decreasing due to the difficulty of educating children about diet at home. The shrinking fish products market thus decreases new product innovation by private companies in Japan.
Meanwhile, fish meal consumption is predicted to increase in Korea and China [2]. Therefore, private companies in these countries are strongly motivated to develop fish product technologies to gain market competitiveness in an expanded fish meal market. These dramatically changed the patent portfolio in China from the 1990s to the 2000s (see Figure S3). One reason for this change is that fish meal became more popular in China [37]. From the 2000s to the 2010s, the patent share of processing for shellfish or bivalves increased in China, Korea, and Japan.

4.3. Investigation of Research Hypotheses

Based on the above analysis, we consider the two research hypotheses explained in the introduction. From the results of the decomposition analysis, we identified that the main contributor to fishery technology patent growth is the expansion of patents granted in China due to a scaling up of R&D activity. Additionally, China and Japan increased the relative priority of fishery technology innovations. However, we observe that in the Korea, the relative priority of fishery technologies declined from 1993 to 2015. Thus, we can partially support Hypothesis 1: “The R&D priority for fishery technology development increased in fishing countries”.
For Hypothesis 2, surprisingly, we observed that the priority of aquaculture technologies declined in Japan from 1993 to 2015, even though the priority of harvesting technologies increased. By contrast, aquaculture technologies had greater priority than harvesting technologies in the other two fishing countries. Therefore, we can partially support Hypothesis 2: “The R&D priority placed on aquaculture technology development increased in fishing countries more than that placed on harvesting technology development”.

5. Conclusions

This study examined the trend and priority changes in fishery technologies using patents granted data from 1993 to 2015. We focused on the following three technologies: (1) harvesting technologies, (2) aquaculture technologies, and (3) new products technologies. We clarified priority shifts, as reflected in the patents covering innovations in these three technologies, by applying the LMDI decomposition analysis. We obtained the following results.
First, the number of fishery technology patents granted increased from 1993 to 2015; in particular, there was rapid growth in aquaculture patents granted starting in 2012. The main driver of this growth was expansion in the scale of R&D activity and an increase in the priority of fishery technology innovation in China. The revision of the patent application law and subsidy system in China are noted as external factors promoting R&D activity among Chinese innovators.
Second, the priority placed on aquaculture technology innovation decreased only in Japan from 1993 to 2015. This result for the R&D strategy of fishery technologies is unexpected, because Japan is one of the major fish consuming countries [38]. This information sends a key message to the Japanese government to recognize the necessity of promoting aquaculture technology development in Japan.
Finally, we observe that the priority change for fishery technology innovation is diverse across countries and technology groups. This result has important implications for fishery technology development strategy by inter-governmental activities. For example, the target set in the SDGs was to “Increase scientific knowledge, develop research capacities and transfer marine technology taking into account the Intergovernmental Oceanographic Commission Criteria and Guidelines on the Transfer of Marine Technology” (target 14.a., United Nations [8]). The differences in fishery technology characteristics provide useful information for clarifying the technological advantage and high-priority technology type in each country, which is key information for promoting inter-governmental agreement to achieve SDG targets.

Supplementary Materials

The following are available online at www.mdpi.com/2071-1050/10/1/59/s1, Table S1: A list of patent classifications related to fishery technologies, Table S2: Patent data collection period in PATENTSCOPE database by country, Figure S1: Patent portfolio of harvesting technologies from 1993 to 2015, Figure S2: Patent portfolio of aquaculture technologies from 1993 to 2015, Figure S3. Patent portfolio of product technologies from 1993 through 2015.

Acknowledgments

This research was funded by the Organisation for Marine Science and Technology, Nagasaki University. The results and conclusions of this article do not necessarily represent the view of the funding agencies.

Author Contributions

H.F. designed the study, analysed the data, and wrote the manuscript. Y.S., A.H., J.B., K.S., and Y.M. assisted in writing the manuscript.

Conflicts of Interest

The authors declare no conflict of interest.

References

  1. World Bank. Fish to 2030: Prospects for Fisheries and Aquaculture; Agriculture and Environmental Service Discussion Paper 3, WorldBank Report Number 83177-GLB; World Bank: Washington, DC, USA, 2016. [Google Scholar]
  2. Food and Agriculture Organization of the United Nations (FAO). The State of World Fisheries and Aquaculture 2016 (SOFIA): Contributing to Food Security and Nutrition for All; Food and Agriculture Organization: Rome, Italy, 2016. [Google Scholar]
  3. De Leo, F.; Miglietta, P.P.; Pavlinović, S. Marine ecological footprint of Italian Mediterranean fisheries. Sustainability 2014, 6, 7482–7495. [Google Scholar] [CrossRef]
  4. Jennings, S.; Stentiford, G.D.; Leocadio, A.M.; Jeffery, K.R.; Metcalfe, J.D.; Katsiadaki, I.; Auchterlonie, N.A.; Mangi, S.C.; Pinnegar, J.K.; Ellis, T.; et al. Aquatic food security: Insights into challenges and solutions from an analysis of interactions between fisheries, aquaculture, food safety, human health, fish and human welfare, economy and environment. Fish Fish. 2016, 17, 893–938. [Google Scholar] [CrossRef] [Green Version]
  5. Food and Agriculture Organization of the United Nations (FAO). World Review of Fisheries and Aquaculture; FAO: Rome, Italy, 2014. [Google Scholar]
  6. De Leo, F.; Miglietta, P.P.; Pavlinović, S. Marine fisheries and mariculture in Croatia: Economic and trade analysis. J. Econ. Financ. Stud. 2014, 2, 53–61. [Google Scholar] [CrossRef]
  7. Salomon, M.; Holm-Müller, K. Towards a sustainable fisheries policy in Europe. Fish Fish. 2013, 14, 625–638. [Google Scholar] [CrossRef]
  8. United Nations. Transforming Our World: The 2030 Agenda for Sustainable Development. Outcome Document for the United Nations Summit to Adopt the Post-2015 Development Agenda. 2015. Available online: https://sustainabledevelopment.un.org/post2015/transformingourworld (accessed on 16 November 2017).
  9. Eigaard, O.R.; Marchal, P.; Gislason, H.; Rijnsdorp, A.D. Technological development and fisheries management. Rev. Fish. Sci. Aquac. 2014, 22, 156–174. [Google Scholar] [CrossRef]
  10. Burnell, G.; Allan, G. New Technologies in Aquaculture: Improving Production Efficiency, Quality and Environmental Management; Woodhead Publishing Limited: Oxford, UK, 2009. [Google Scholar]
  11. Martín-Sánchez, A.M.; Navarro, C.; Pérez-Álvarez, J.A.; Kuri, V. Alternatives for efficient and sustainable production of surimi: A review. Compr. Rev. Food Sci. Food Saf. 2009, 8, 359–374. [Google Scholar] [CrossRef]
  12. Suuronen, P.; Chopin, F.; Glass, C.; Løkkeborg, S.; Matsushita, Y.; Queirolo, D.; Rihan, D. Low impact and fuel efficient fishing—Looking beyond the horizon. Fish. Res. 2012, 119–120, 135–146. [Google Scholar] [CrossRef]
  13. Lubchenco, J.; Grorud-Colvert, K. Making waves: The science and politics of ocean protection. Science 2015, 350, 382–383. [Google Scholar] [CrossRef] [PubMed]
  14. Organization for Economic Co-Operation and Development. OECD Stat. Fisheries International Collaboration in Technology Development (Bilateral). 2015. Available online: http://stats.oecd.org/OECDStat_Metadata/ShowMetadata.ashx?DataSet=FISH_PAT_COL (accessed on 16 November 2017).
  15. Candelin-Palmqvist, H.; Sandberg, B.; Mylly, U.-M. Intellectual property rights in innovation management research: A review. Technovation 2012, 32, 502–512. [Google Scholar] [CrossRef]
  16. Nicol, S.; Foster, J.; Kawaguchi, S. The fishery for Antarctic krill—Recent developments. Fish Fish. 2012, 13, 30–40. [Google Scholar] [CrossRef]
  17. Popp, D. Induced innovation and energy prices. Am. Econ. Rev. 2002, 92, 160–180. [Google Scholar] [CrossRef]
  18. Fujii, H. Decomposition analysis of green chemical technology inventions from 1971 to 2010 in Japan. J. Clean. Prod. 2016, 112, 4835–4843. [Google Scholar] [CrossRef]
  19. Ninan, S.; Sharma, A.; Ananthan, P.S.; Ojha, S.N. Intellectual property right in fisheries sector. J. Intellect. Prop. Rights 2005, 10, 52–58. [Google Scholar]
  20. Ninan, S.; Sharma, A. Cross-sectional analysis of patents in Indian fisheries sector. World Pat. Inf. 2006, 28, 147–158. [Google Scholar] [CrossRef]
  21. Fujii, H.; Managi, S. Research and development strategy for environmental technology in Japan: A comparative study of the private and public sectors. Technol. Forecast. Soc. Chang. 2016, 112, 293–302. [Google Scholar] [CrossRef]
  22. Gorospe, K.D.; Michaels, W.; Pomeroy, R.; Elvidge, C.; Lynch, P.; Wongbusarakum, S.; Brainard, R.E. The mobilization of science and technology fisheries innovations towards an ecosystem approach to fisheries management in the Coral Triangle and Southeast Asia. Mar. Policy 2016, 74, 143–152. [Google Scholar] [CrossRef]
  23. Rickels, W.; Dovern, J.; Quaas, M. Beyond fisheries: Common-pool resource problems in oceanic resources and services. Glob. Environ. Chang. 2016, 40, 37–49. [Google Scholar] [CrossRef]
  24. Ang, B.W.; Zhang, F.Q.; Choi, K.-H. Factorizing changes in energy and environmental indicators through decomposition. Energy 1998, 23, 489–495. [Google Scholar] [CrossRef]
  25. Dang, J.; Motohashi, K. Patent statistics: A good indicator for innovation in China? Patent subsidy program impacts on patent quality. China Econ. Rev. 2015, 35, 137–155. [Google Scholar] [CrossRef]
  26. Hu, A.G.Z.; Zhang, P.; Zhao, L. China as number one? Evidence from China’s most recent patenting surge. J. Dev. Econ. 2017, 124, 107–119. [Google Scholar] [CrossRef]
  27. Holcombe, R.G. South Korea’s economic future: Industrial policy, or economic democracy? J. Econ. Behav. Organ. 2013, 88, 3–13. [Google Scholar] [CrossRef]
  28. Kim, Y. From catch-up to overtaking: Competition and innovation in the semiconductor industries of Korea and Japan. Asian J. Technol. Innov. 2011, 19, 297–311. [Google Scholar] [CrossRef]
  29. Huang, C.; Wu, Y. State-led technological development: A case of China’s nanotechnology development. World Dev. 2012, 40, 970–982. [Google Scholar] [CrossRef]
  30. Fong, P.S.W.; Chang, X.; Chen, Q. Faculty patent assignment in the Chinese mainland: Evidence from the top 35 patent application universities. J. Technol. Transf. 2015, 1–27. [Google Scholar] [CrossRef]
  31. Ministry of Agriculture, Forestry and Fisheries. The 2013 Census of Fisheries. 2016. Available online: http://www.e-stat.go.jp/SG1/estat/ListE.do?bid=000001067819&cycode=0 (accessed on 16 February 2017).
  32. Ito, F. Course of the research for sustainable aquaculture in Japan. Bull. Jpn. Fish. Res. Educ. Agency 2012, 35, 1–5. [Google Scholar]
  33. Uchida, H.; Onozaka, Y.; Morita, T.; Managi, S. Demand for ecolabeled seafood in the Japanese market: A conjoint analysis of the impact of information and interaction with other labels. Food Policy 2014, 44, 68–76. [Google Scholar] [CrossRef]
  34. Food and Agriculture Organization of the United Nations (FAO). Market. Competition between Farmed and Wild Fish: A Literature Survey; FAO Fisheries and Aquaculture, FAO Fisheries and Aquaculture Circular No. 1114; FAO: Rome, Italy, 2016. [Google Scholar]
  35. Claret, A.; Guerrero, L.; Gartzia, I.; Garcia-Quiroga, M.; Ginés, R. Does information affect consumer liking of farmed and wild fish? Aquaculture 2016, 454, 157–162. [Google Scholar] [CrossRef]
  36. Fisheries Agency of Japan. White Paper on Fisheries FY2015. 2015. Available online: http://www.jfa.maff.go.jp/j/kikaku/wpaper/pdf/hakusyo2014e.pdf (accessed on 16 November 2017).
  37. Villasante, S.; Rodriguez-Gonzalez, D.; Antelo, M.; Rivero-Rodriguez, S.; de Santiago, J.A.; Macho, G. All fish for China? Ambio 2013, 42, 923–936. [Google Scholar] [CrossRef] [PubMed]
  38. Organization for Economic Co-Operation and Development. Review of Fisheries: Country Statistics; OECD Publishing: Paris, France, 2015. [Google Scholar]
Figure 1. Decomposition analysis of patents granted for harvesting technologies.
Sustainability 10 00059 g001
Figure 2. Decomposition analysis of patents granted for aquaculture technology.
Sustainability 10 00059 g002
Figure 3. Decomposition analysis of patents granted for new product technology.
Sustainability 10 00059 g003
Table 1. Description of the aquaculture technology patent groups.
Patent GroupDescription of Patent Group
Harvesting technologyHarvesting technologies, such as more effective ways to find or harvest fish; these are typically associated with improvements in catch per unit of effort. The main categories of this patent group are IPC = A01K69 (Stationary catching devices), IPC = A01K77 (Landing-nets; Landing-spoons), and IPC = B63B35/14 (Fishing vessels).
Aquaculture technologyAquaculture technologies, such as methods to more effectively grow fish in captivity (innovation in feeds, ingredients that improve the health of aquaculture animals, etc.). The main categories of this patent group are IPC = A01K61 (Culture of fish, mussels, crayfish, lobsters, sponges, pearls and the like) and IPC = A01K63 (Receptacles for live fish, e.g., aquaria).
New products technologyNew products technologies, such as the development of new fish products (food technologies/processing, such as the development of surimi as a crabmeat substitute) and improvement in processing lines. The main categories of this patent group are IPC = A22C25 (Processing fish; curing of fish; stunning of fish by electric current; investigating fish by optical means) and IPC = A22C29 (Processing shellfish or bivalves and devices therefor; processing lines).
Source: OECD [14].
Table 2. Fishery technology patents granted in north-east Asian countries from 1993 to 2015.
Country and RegionFisheries Technology PatentsBreakdown by Technology Type (%)
Number of Patent Granted (Item)Share (%)HarvestingAquacultureProducts
China50,91442.06%22%74%3%
Korea, Republic of15,87913.12%56%40%4%
Japan15,21212.57%50%46%4%
World 1121,059100.00%35%61%4%
Note: 1 “World” indicates the summation of patents granted in all countries and regions listed in Table S2.
Table 3. Trend in fishery technology patents granted by industry type.
TechnologyCountry1993–19971998–20022003–20072008–20122013–2015
HarvestChina184929180133635293
Korea7592977231717861463
Japan8451056269021661156
World342762078552816710,336
AquacultureChina5251180314910,63522,690
Korea3761485164817131353
Japan10831214252213961124
World3472594211,73514,94528,321
ProductChina2737105552912
Korea38140183124123
Japan2471341298187
World5365196117741384
Table 4. Decomposition analysis of harvesting patents granted from 1993 to 2015.
Change in Harvesting Tech.Decomposed FactorsMost Increased Patent Technology (IPC)
Priority of Harvesting Tech.Priority of Fisheries Tech.Scale
China1841−120111251917Accessories for angling (A01K97)
Korea115−214−102431Accessories for angling (A01K97)
Japan97128163−194Reels (A01K89)
World2327−247725162287Systems using the reflection of acoustic waves (G01S15)
Table 5. Decomposition analysis of aquaculture patents granted from 1993 to 2015.
Change in Aquaculture Tech.Decomposed FactorsMost Increased Patent Technology (IPC)
Priority of Aquaculture Tech.Priority of Fisheries Tech.Scale
China11,736144149495346Animal feeding stuffs for aquatic animals (A23K1)
Korea231192−164202Culture of fish, mussels, crayfish, lobsters, sponges, pearls or the like (A01K61)
Japan82−46278−149Rearing or breeding animals not otherwise provided for (A01K67)
World12,769288462623623Animal feeding stuffs for aquatic animals (A23K1)
Table 6. Decomposition analysis of product innovation patents granted from 1993 to 2015.
Change in Products TechnologyDecomposed FactorsMost Increased Patent Technology (IPC)
Priority of Products TechnologyPriority of Fisheries TechnologyScale
China345−116213248Processing fish (A22C25)
Korea2616−1020Processing fish (A22C25)
Japan−57−7733−12Both technology groups decreased
World318−247332232Processing shellfish or bivalves (A22C29)

