Assessing Green and Blue Water Footprints in the Supply Chain of Cocoa Production: A Case Study in the Northeast of Colombia
Abstract
:1. Introduction
2. Materials and Methods
- ETc = total crop evapotranspiration;
- Kc = crop specific coefficient;
- Ks = water stress coefficient;
- ET0 = evapotranspiration of the reference crop; and
- ETc adj = crop evapotranspiration in non-optimal conditions.
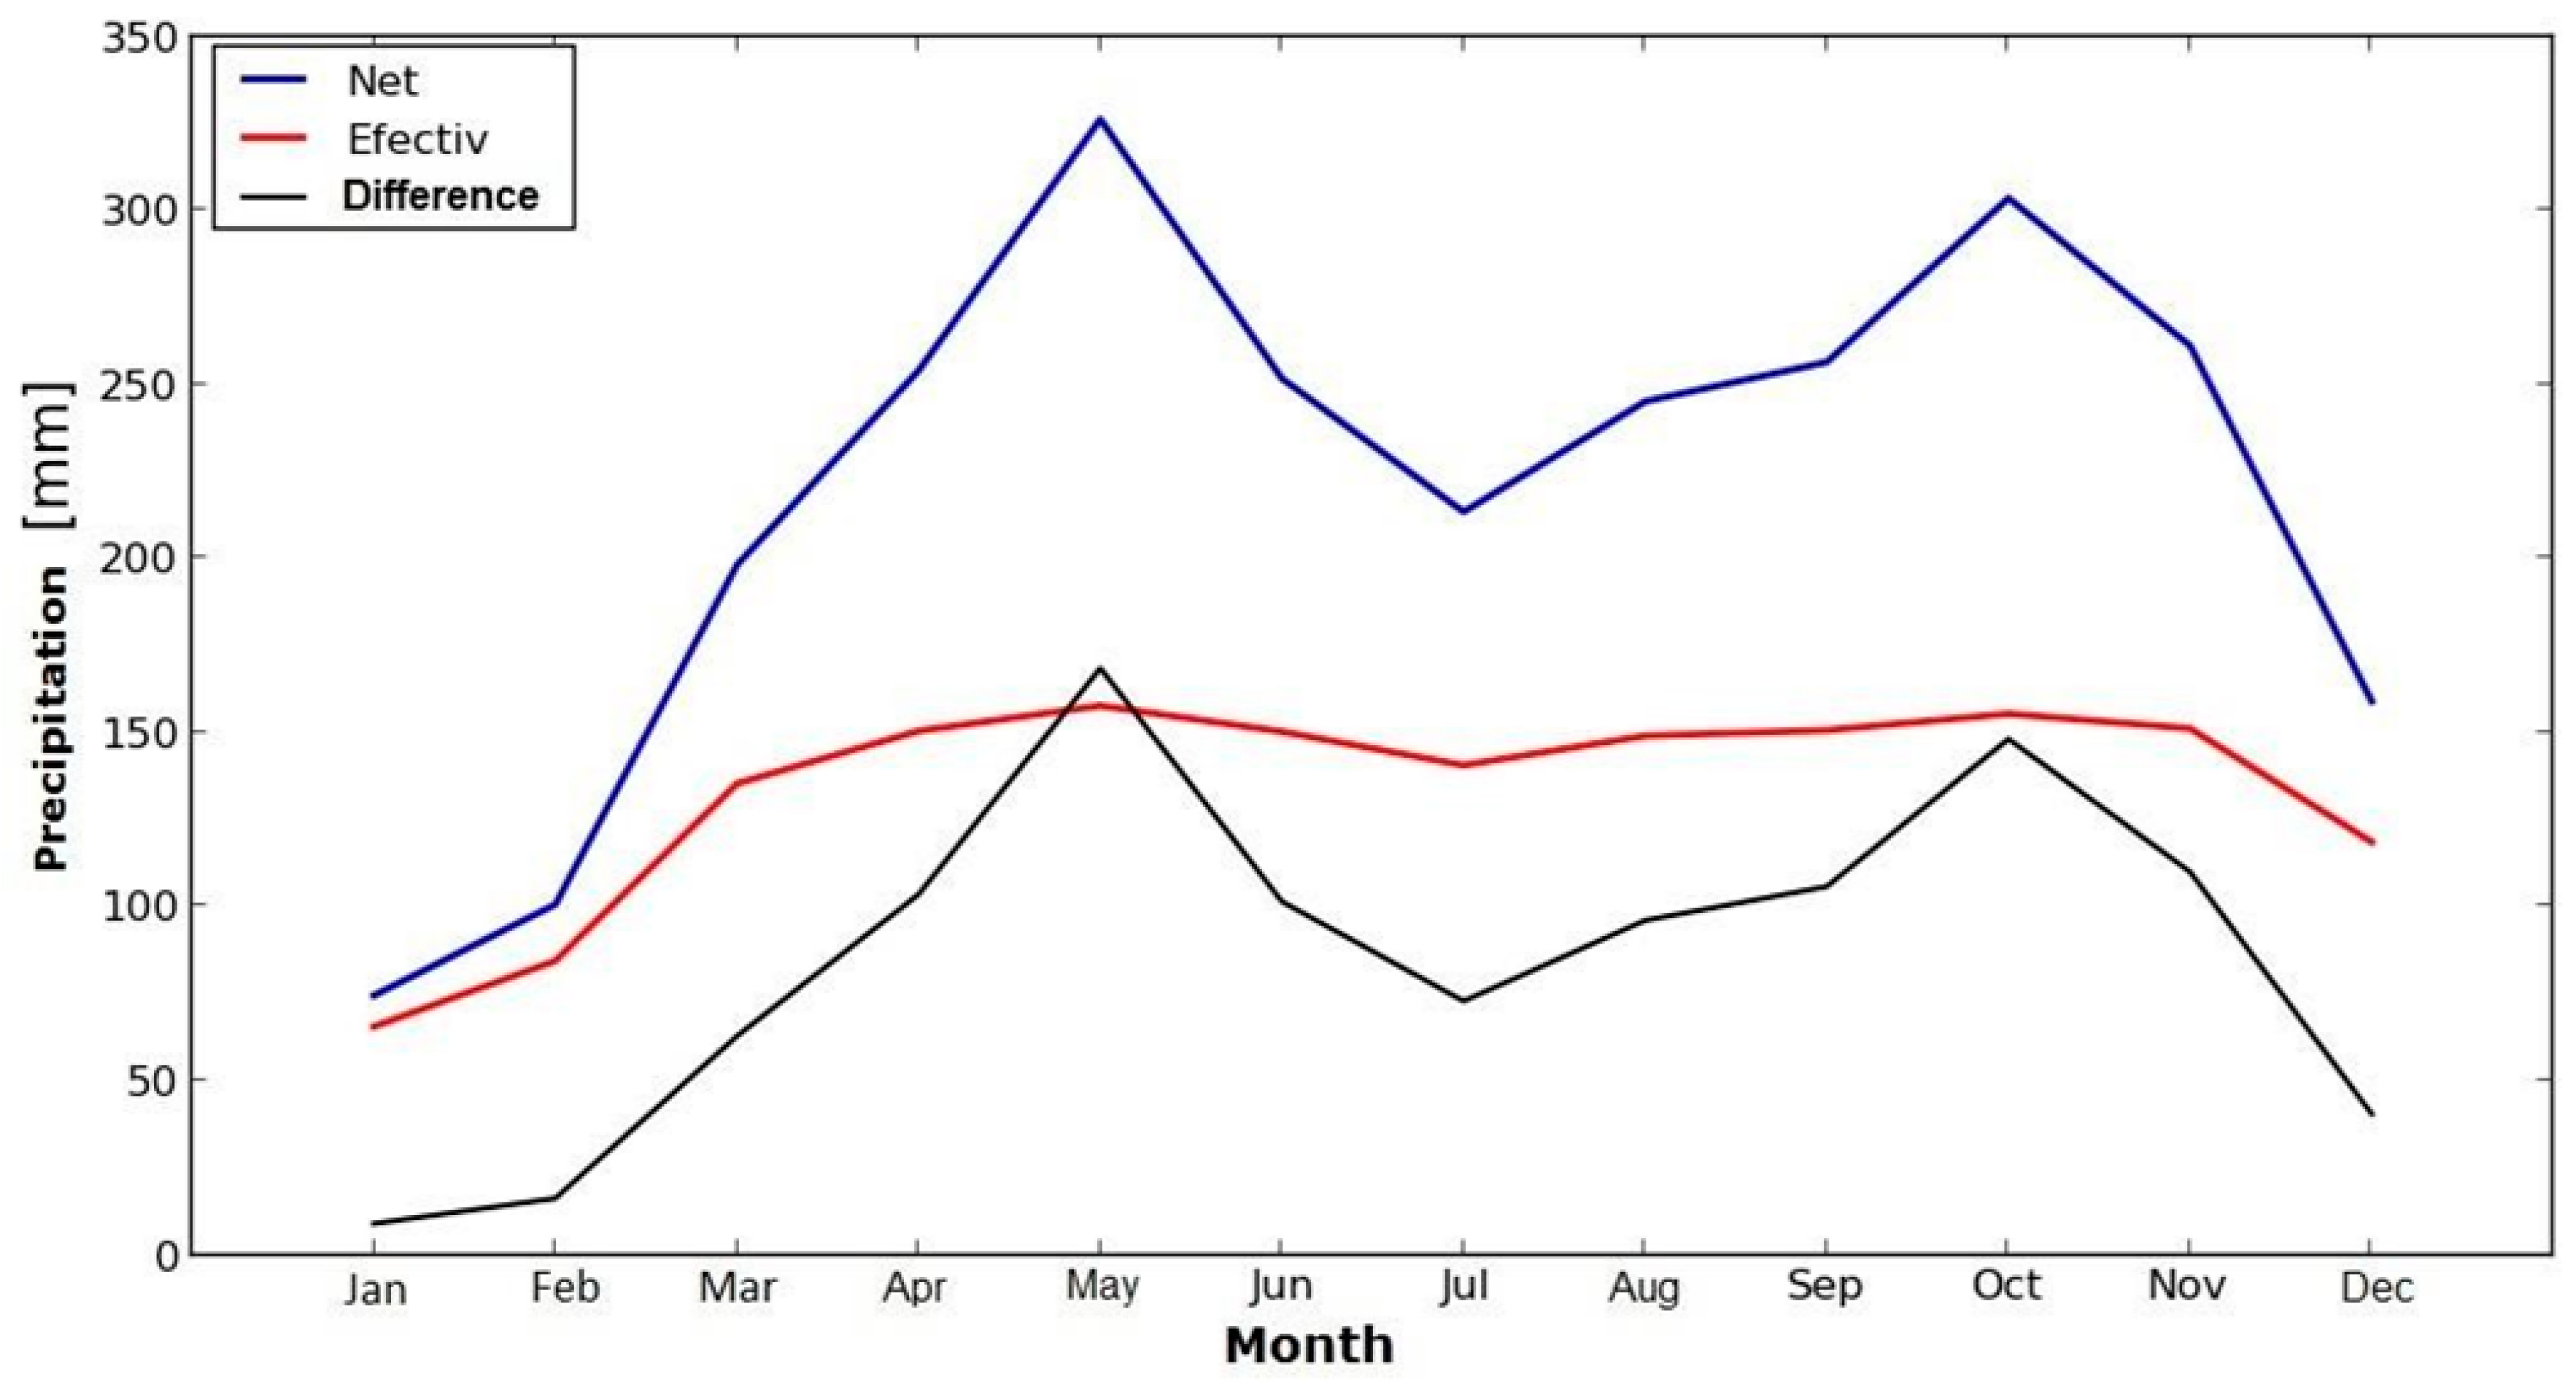
- Pef = effective precipitation; and
- Blue evapotranspiration (ETblue) was estimated using Equation (5):ETblue = max {0, ETc − Pef}
- CWUgreen = the green component of crop water usage (m3/ha);
- CWUblue = the blue component of crop water usage (m3/ha); and
- Y = crop yield (ton/ha).
- Root depth for the adult crop was assumed to be 1 m.
- Crop development time was assumed to be 360 days because, although cocoa takes four to five years to start producing, once it does, it yields one yearly harvest.
- The soil’s initial water deficit was assumed to be 30%.
- A 12-h daily sunshine period was uniformly assumed for all the months of the year. This data was considered because Colombia is located at 4° north latitude.
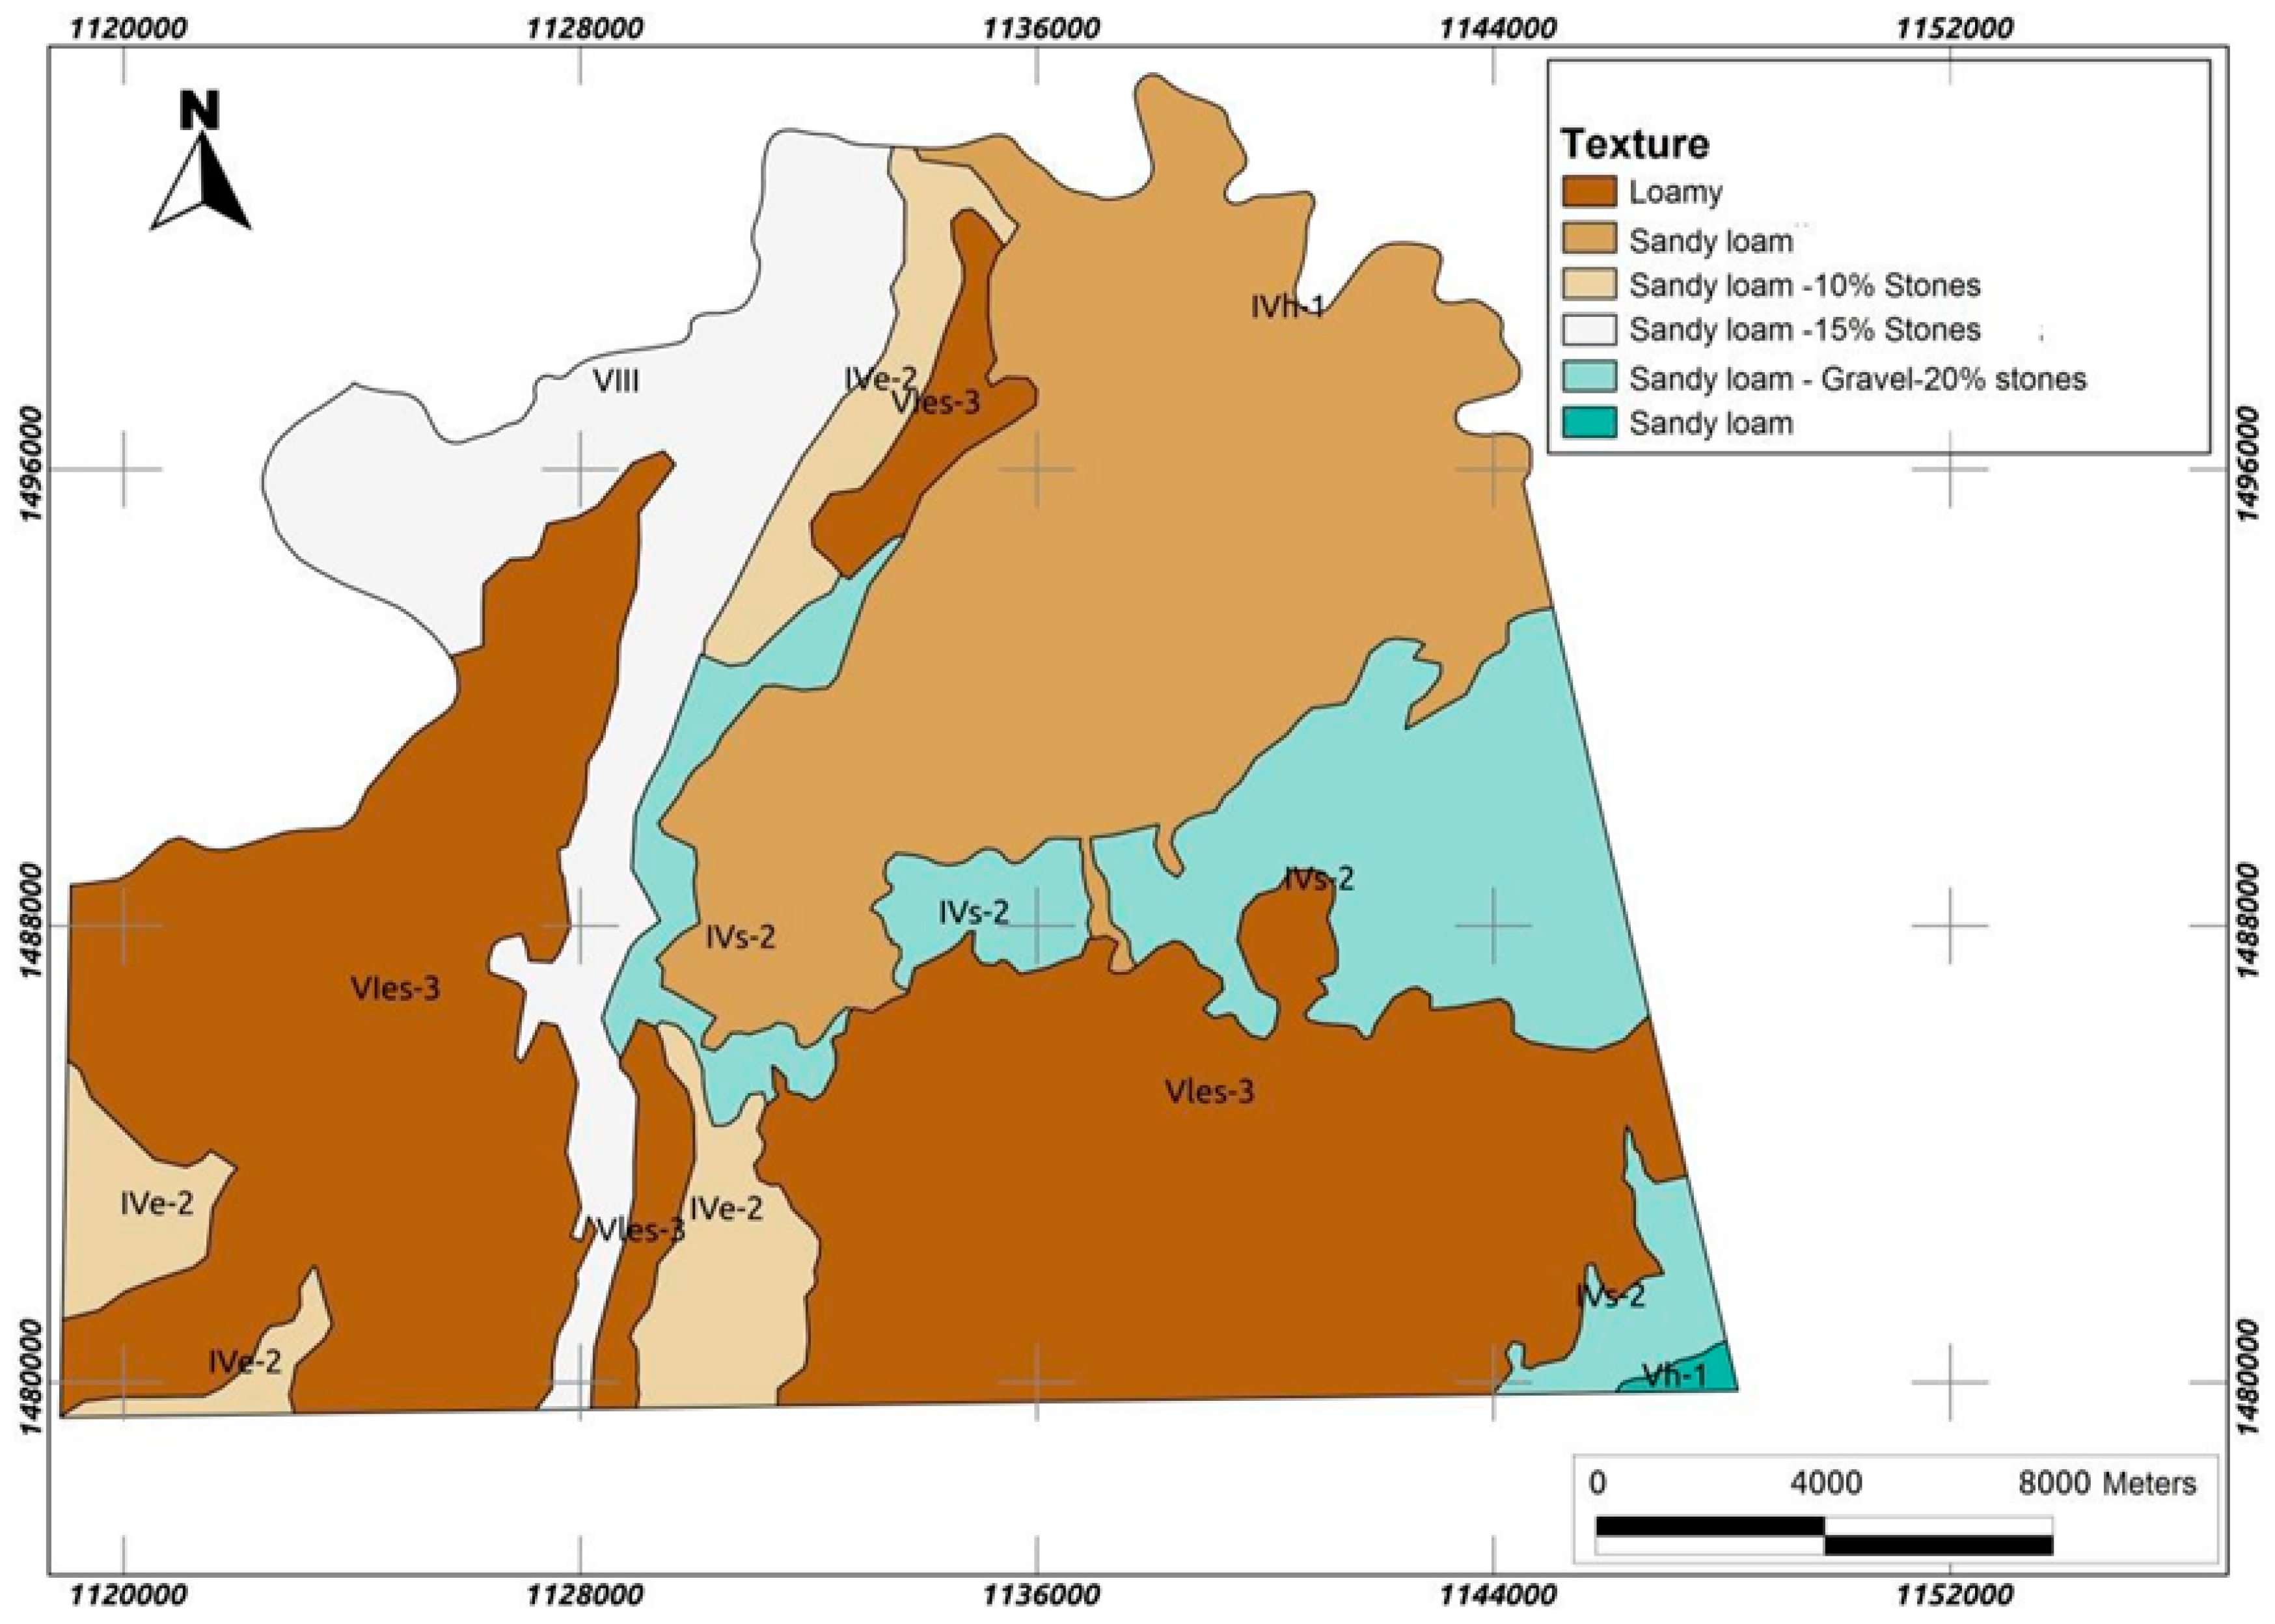
- Soil texture data was based on the soil texture map number 57 of the general soil and land study of the department of Norte de Santander (see Figure 1).
3. Results
4. Discussion
5. Conclusions
Acknowledgments
Author Contributions
Conflicts of Interest
References
- García-Cáceres, R.G.; Perdomo, P.; Ortiz, O.; Beltrán, P.; López, K. Characterization of the supply and value chains of Colombian cocoa. Dyna 2014, 81, 30–40. [Google Scholar] [CrossRef]
- Ortiz-R, O.O.; Villamizar, R.V.; Rangel, J.M. Applying life cycle management of Colombian cocoa production. Food Sci. Technol. 2014, 34, 62–68. [Google Scholar] [CrossRef]
- International Cocoa Organization (ICCO). Abidjan Cocoa Declaration and Global Cocoa Agenda. World Cocoa Conference 2012. Available online: http://www.icco.org (accessed on 4 April 2016).
- Bradley, G.; Pfister, S. A revised approach to water footprinting to make transparent the impacts of consumption and production on global freshwater scarcity. Glob. Environ. Chang. 2010, 20, 113–120. [Google Scholar]
- Jefferies, D.; Muñoz, I.; Hodges, J.; King, V.; Aldaya, M.; Ercin, A.E.; Milà i Canals, L.; Hoekstra, A.Y. Water Footprint and Life Cycle Assessment as approaches to assess potential impacts of products on water consumption. Key learning points from pilot studies on tea and margarine. J. Clean. Prod. 2012, 33, 155–166. [Google Scholar] [CrossRef]
- Duarte, R.; Pinilla, V.; Serrano, A. The effect of globalisation on water consumption: A case study of the Spanish virtual water trade, 1849–1935. Ecol. Econ. 2014, 100, 96–105. [Google Scholar] [CrossRef]
- Ercin, A.E.; Mekonnen, M.M.; Hoekstra, A.Y. Sustainability of national consumption from a water resources perspective: The case study for France. Ecol. Econ. 2013, 88, 133–147. [Google Scholar] [CrossRef]
- Newton, P.; Agrawal, A.; Wollenberg, L. Enhancing the sustainability of commodity supply chains in tropical forest and agricultural landscapes. Glob. Environ. Chang. 2013, 23, 1761–1772. [Google Scholar] [CrossRef]
- Falkenmark, M.; Lannerstad, M. Consumptive water use to feed humanity—Curing a blind spot. Hydrol. Earth Syst. Sci. 2005, 9, 15–28. [Google Scholar] [CrossRef]
- Singh, S.P.; Singh, B.; Kumar, U. Water Management Strategies for Achieving Food Security. APCBEE Procedia 2013, 5, 423–428. [Google Scholar] [CrossRef]
- Ercin, A.E.; Hoekstra, A.Y. Water footprint scenarios for 2050: A global analysis. Environ. Int. 2014, 64, 71–82. [Google Scholar] [CrossRef] [PubMed]
- Misra, A.K. Climate change and challenges of water and food security. Int. J. Sustain. Built Environ. 2014, 3, 153–165. [Google Scholar] [CrossRef]
- Ortiz, O.O.; Villamizar, R.A.; Naranjo, C.A.; García, R.G.; Castañeda, M.T. Carbon footprint of the colombian cocoa production. Eng. Agríc. 2016, 36, 260–270. [Google Scholar] [CrossRef]
- Chen, H.; Yada, R. Nanotechnologies in agriculture: New tools for sustainable development. Trends Food Sci. Technol. 2011, 22, 585–594. [Google Scholar] [CrossRef]
- Parish, E.S.; Kodra, E.; Steinhaeuser, K.; Ganguly, A. Estimating future global per capita water availability based on changes in climate and population. Comput. Geosci. 2012, 42, 79–86. [Google Scholar] [CrossRef]
- Hseu, Z.-Y.; Chen, Z.-S. Review Experiences of Mass Pig Carcass Disposal Related to Groundwater Quality Monitoring in Taiwan. Sustainability 2017, 9, 46. [Google Scholar]
- Perveen, S.; James, L.A. Scale invariance of water stress and scarcity indicators: Facilitating cross-scale comparisons of water resources vulnerability. Appl. Geogr. 2011, 31, 321–328. [Google Scholar] [CrossRef]
- Zeng, Z.; Liu, J.; Savenije, H.G. A simple approach to assess water scarcity integrating water quantity and quality. Ecol. Indic. 2013, 34, 441–449. [Google Scholar] [CrossRef]
- Hoekstra, A.Y. The Water Footprint Assessment Manual: Setting the Global Standard; Water Footprint Network: London, UK; Washington, DC, USA, 2011. [Google Scholar]
- Rinaldi, S.; Bonamente, E.; Scrucca, F.; Merico, M.C.; Asdrubali, F.; Cotana, F. Water and Carbon Footprint of Wine: Methodology Review and Application to a Case Study. Sustainability 2016, 8, 621. [Google Scholar] [CrossRef]
- Bonamente, E.; Rinaldi, S.; Nicolini, A.; Cotana, F. National water footprint: Toward a comprehensive approach for the evaluation of the sustainability of water use in Italy. Sustainability 2017, 9, 1341. [Google Scholar] [CrossRef]
- Hoekstra, A.Y. Virtual Water Trade: Proceedings of the International Expert Meeting on Virtual Water Trade; Value of Water Research Report Series No. 12; UNESCO-IHE: Delft, The Netherlands, 2003. [Google Scholar]
- Martínez-Ángel, J.D.; Villamizar-G, R.A.; Ortíz-Rodriguez, O.O. Characterization and evaluation of cocoa (Theobroma cacao L.) pod husk as a renewable energy source. Agrociencia 2015, 49, 329–345. [Google Scholar]
- Food and Agriculture Organization (FAO) of the United Nations. CROPWAT 8.0 Model 2009. Available online: http://www.fao.org/land-water/databases-and-software/cropwat/es/ (accessed on 6 April 2014).
- Allen, G.A. Crop Evapotranspiration—Guidelines for Computing Crop Water Requirement; FAO Irrigation and Drainage Paper 56; FAO: Rome, Italy, 1998. [Google Scholar]
- Instituto Geográfico Agustín Codazzi (IGAC) (Ed.) General Soil and Land Study of the Department of Norte de Santander; Document Available in Spanish, Código: AGC0332; IGAC: Bogotá, Colombia, 2007; ISBN 9789588323015. [Google Scholar]
- Lawford, R.; Strauch, A.; Toll, D.; Fekete, B.; Cripe, D. Earth observations for global water security. Curr. Opin. Environ. Sustain. 2013, 5, 633–643. [Google Scholar] [CrossRef]
- Van Oel, P.R.; Mekonnen, M.M.; Hoekstra, A.Y. The external water footprint of the Netherlands: Geographically-explicit quantification and impact assessment. Ecol. Econ. 2009, 69, 82–92. [Google Scholar] [CrossRef]
- Mekonnen, M.M.; Hoekstra, A.Y. The Green, Blue and Grey Water Footprint of Crops and Derived Crop Products; Value of Water Research Report Series No. 47; UNESCO-IHE: Delft, The Netherlands, 2010. [Google Scholar]
- Pfister, S.; Bayer, P. Monthly water stress: Spatially and temporally explicit consumptive water footprint of global crop production. J. Clean. Prod. 2014, 73, 52–62. [Google Scholar] [CrossRef]
- Läderach, P.; Martinez-Valle, A.; Schroth, G.; Castro, N. Predicting the future climatic suitability for cocoa farming of the world’s leading producer countries, Ghana and Côte d’Ivoire. Clim. Chang. 2013, 119, 841–854. [Google Scholar] [CrossRef]
- Castro-Díaz, R. Evaluation of MODIS Land products for air temperature estimations in Colombia. Agron. Colomb. 2013, 31, 223–233. [Google Scholar]
- Barbieri, J.D.; Dallacort, R.; Santi, A.; Pereira Rocha, R.; Camillo de Carvalho, M.A. Zoneamento agroclimático de amendoinzeiro para a Bacia do Alto Paraguai (MT). Pesq. Agropecu. Trop. 2015, 45, 231–240. [Google Scholar] [CrossRef]


| ID | Soil | Texture | Area | Weight | Hu | Ks |
|---|---|---|---|---|---|---|
| 1 | Vh-1 | Sandy loam | 9.81 × 10⁵ | 0.00 × 100 | 1.80 × 10² | 2.64 × 10² |
| 2 | IVs-2 | Sandy loam–Gravel-20% stones | 4.15 × 10⁷ | 8.00 × 10⁻² | 8.00 × 101 | 2.50 × 10² |
| 3 | IVs-2 | Sandy loam–Gravel-20% stones | 6.75 × 10⁶ | 1.00 × 10⁻² | 8.00 × 101 | 2.50 × 10² |
| 4 | Vles-3 | Loamy | 1.05 × 10⁸ | 2.10 × 10⁻¹ | 1.20 × 10² | 1.75 × 101 |
| 5 | IVs-2 | Sandy loam– Gravel-20% stones | 6.68 × 10⁶ | 1.00 × 10⁻² | 8.00 × 101 | 2.50 × 10² |
| 6 | Vles-3 | Loamy | 5.54 × 10⁶ | 1.00 × 10⁻² | 1.20 × 10² | 1.75 × 101 |
| 7 | IVe-2 | Sandy loam–10% Stones | 2.99 × 10⁶ | 1.00 × 10⁻² | 1.00 × 10² | 2.85 × 10² |
| 8 | IVs-2 | Sandy loam–Gravel-20% Stones | 1.12 × 10⁷ | 2.00 × 10⁻² | 8.00 × 101 | 2.50 × 10² |
| 9 | VIes-3 | Loamy | 7.12 × 10⁶ | 1.00 × 10⁻² | 1.20 × 10² | 1.75 × 101 |
| 10 | IVh-1 | Sandy loam | 1.23 × 10⁸ | 2.50 × 10⁻¹ | 1.40 × 10² | 8.09 × 101 |
| 11 | IVe-2 | Sandy loam–10% Stones | 1.09 × 10⁷ | 2.00 × 10⁻² | 1.00 × 10² | 2.85 × 10² |
| 12 | IVe-2 | Sandy loam–10% Stones | 1.23 × 10⁷ | 3.00 × 10⁻² | 1.00 × 10² | 2.85 × 10² |
| 13 | IVe-2 | Sandy loam–10% Stones | 7.30 × 10⁶ | 1.00 × 10⁻² | 1.00 × 10² | 2.85 × 10² |
| 14 | VIes-3 | Loamy | 9.30 × 10⁷ | 1.90 × 10⁻¹ | 1.20 × 10² | 1.75 × 101 |
| 15 | VIII | Sandy loam–15% Stones | 5.70 × 10⁷ | 1.20 × 10⁻¹ | 8.00 × 101 | 9.12 × 10² |
| Month (Average) | Etc mm/Day | Etadj mm/Period | Pef mm/Period | Irri Req mm/Period | ET Green mm/Period | ET Blue mm/Period | Cd |
|---|---|---|---|---|---|---|---|
| May | 6.95 | 71.83 | 52.50 | 19.37 | 52.50 | 19.33 | 0.22 |
| June | 7.13 | 71.27 | 50.00 | 21.27 | 50.00 | 21.27 | 0.21 |
| July | 7.18 | 74.23 | 46.87 | 27.30 | 46.87 | 27.37 | 0.21 |
| August | 7.18 | 74.17 | 49.63 | 24.53 | 49.63 | 24.53 | 0.21 |
| September | 6.72 | 67.20 | 50.27 | 16.93 | 50.27 | 16.93 | 0.23 |
| October | 6.26 | 64.60 | 51.77 | 12.83 | 51.77 | 12.83 | 0.25 |
| November | 5.56 | 55.63 | 50.33 | 5.33 | 50.33 | 5.30 | 0.28 |
| December | 5.01 | 51.83 | 39.50 | 12.37 | 39.50 | 12.33 | 0.30 |
| January | 5.34 | 55.23 | 21.87 | 33.40 | 21.87 | 33.37 | 0.29 |
| February | 5.71 | 53.27 | 28.13 | 25.13 | 28.13 | 25.13 | 0.27 |
| March | 6.05 | 62.50 | 45.07 | 17.43 | 45.07 | 17.43 | 0.26 |
| April | 6.41 | 53.30 | 41.63 | 5.53 | 41.63 | 11.67 | 0.24 |
© 2017 by the authors. Licensee MDPI, Basel, Switzerland. This article is an open access article distributed under the terms and conditions of the Creative Commons Attribution (CC BY) license (http://creativecommons.org/licenses/by/4.0/).
Share and Cite
Naranjo-Merino, C.A.; Ortíz-Rodriguez, O.O.; Villamizar-G, R.A. Assessing Green and Blue Water Footprints in the Supply Chain of Cocoa Production: A Case Study in the Northeast of Colombia. Sustainability 2018, 10, 38. https://doi.org/10.3390/su10010038
Naranjo-Merino CA, Ortíz-Rodriguez OO, Villamizar-G RA. Assessing Green and Blue Water Footprints in the Supply Chain of Cocoa Production: A Case Study in the Northeast of Colombia. Sustainability. 2018; 10(1):38. https://doi.org/10.3390/su10010038
Chicago/Turabian StyleNaranjo-Merino, Carlos Andrés, Oscar Orlando Ortíz-Rodriguez, and Raquel A. Villamizar-G. 2018. "Assessing Green and Blue Water Footprints in the Supply Chain of Cocoa Production: A Case Study in the Northeast of Colombia" Sustainability 10, no. 1: 38. https://doi.org/10.3390/su10010038
APA StyleNaranjo-Merino, C. A., Ortíz-Rodriguez, O. O., & Villamizar-G, R. A. (2018). Assessing Green and Blue Water Footprints in the Supply Chain of Cocoa Production: A Case Study in the Northeast of Colombia. Sustainability, 10(1), 38. https://doi.org/10.3390/su10010038


