How to Evaluate Smart Cities’ Construction? A Comparison of Chinese Smart City Evaluation Methods Based on PSF


Abstract
:1. Introduction
Literature Review
2. Evaluation Index System of Smart City
2.1. Evaluation Index System Based on PSF Evaluation Model
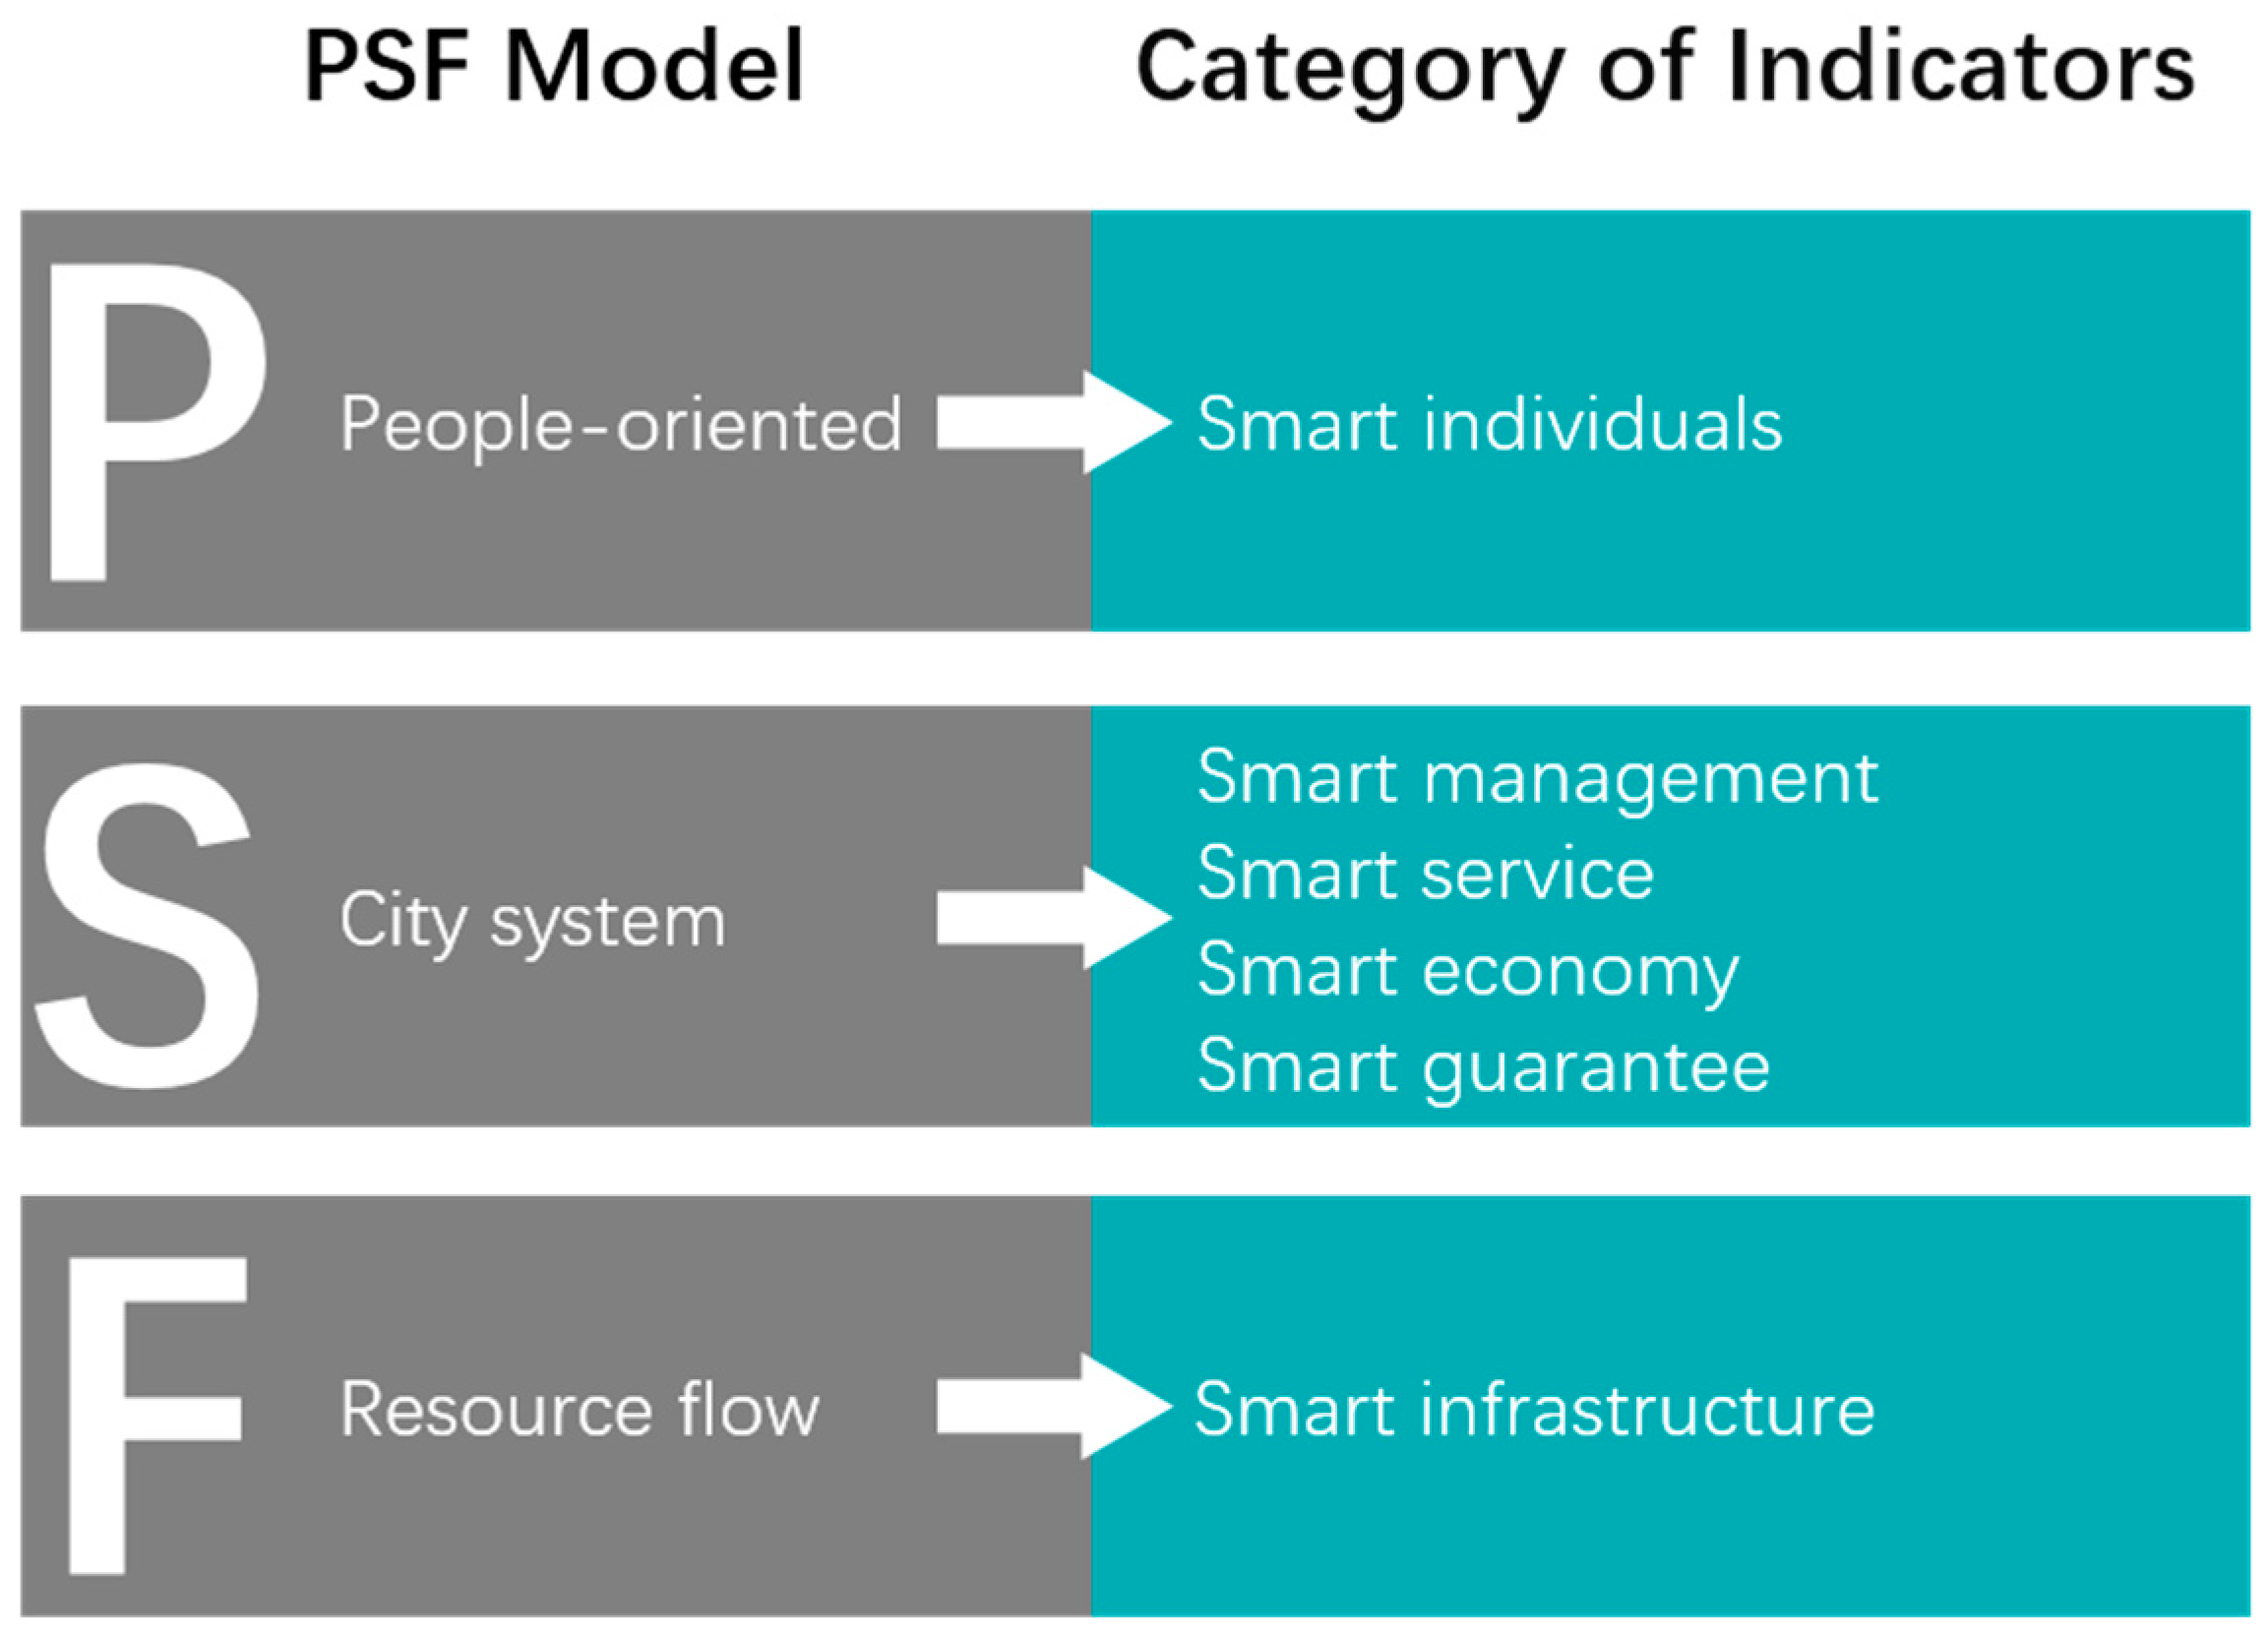
2.1.1. PSF Evaluation Model
- (1)
- Input support layer, corresponding to resource flow. It covers the infrastructure, the service platform, the flow of resources, the flow of funds, and so on, to meet the flow of resources and exchange, thus providing important material for the urban wisdom and development process.
- (2)
- System application layer, corresponding to the urban system. Mainly includes environmental protection, urban planning management operations, seamless link wisdom industry development, social system, and intelligent application links such as input and output analysis. It is based on the emergence of large data, such as deep learning technology, providing personalized, customized services for the city, and urban economy to communication, management, service, security, and so on.
- (3)
- Core target layer, corresponding to people-oriented. “People-oriented” is the core goal of urban smart development. It contains citizens as the core service object, service, and value for the implementation of the people’s livelihood, with the people’s actual demand in the urban development as the basic goal of urban development and guides residents in seeking a superior work environment, life scenes, and community experience, providing a sustained and effective power.
2.1.2. Comprehensive Evaluation Index System
3. Construction of Comprehensive Evaluation Model
3.1. Modeling Tools and Methods
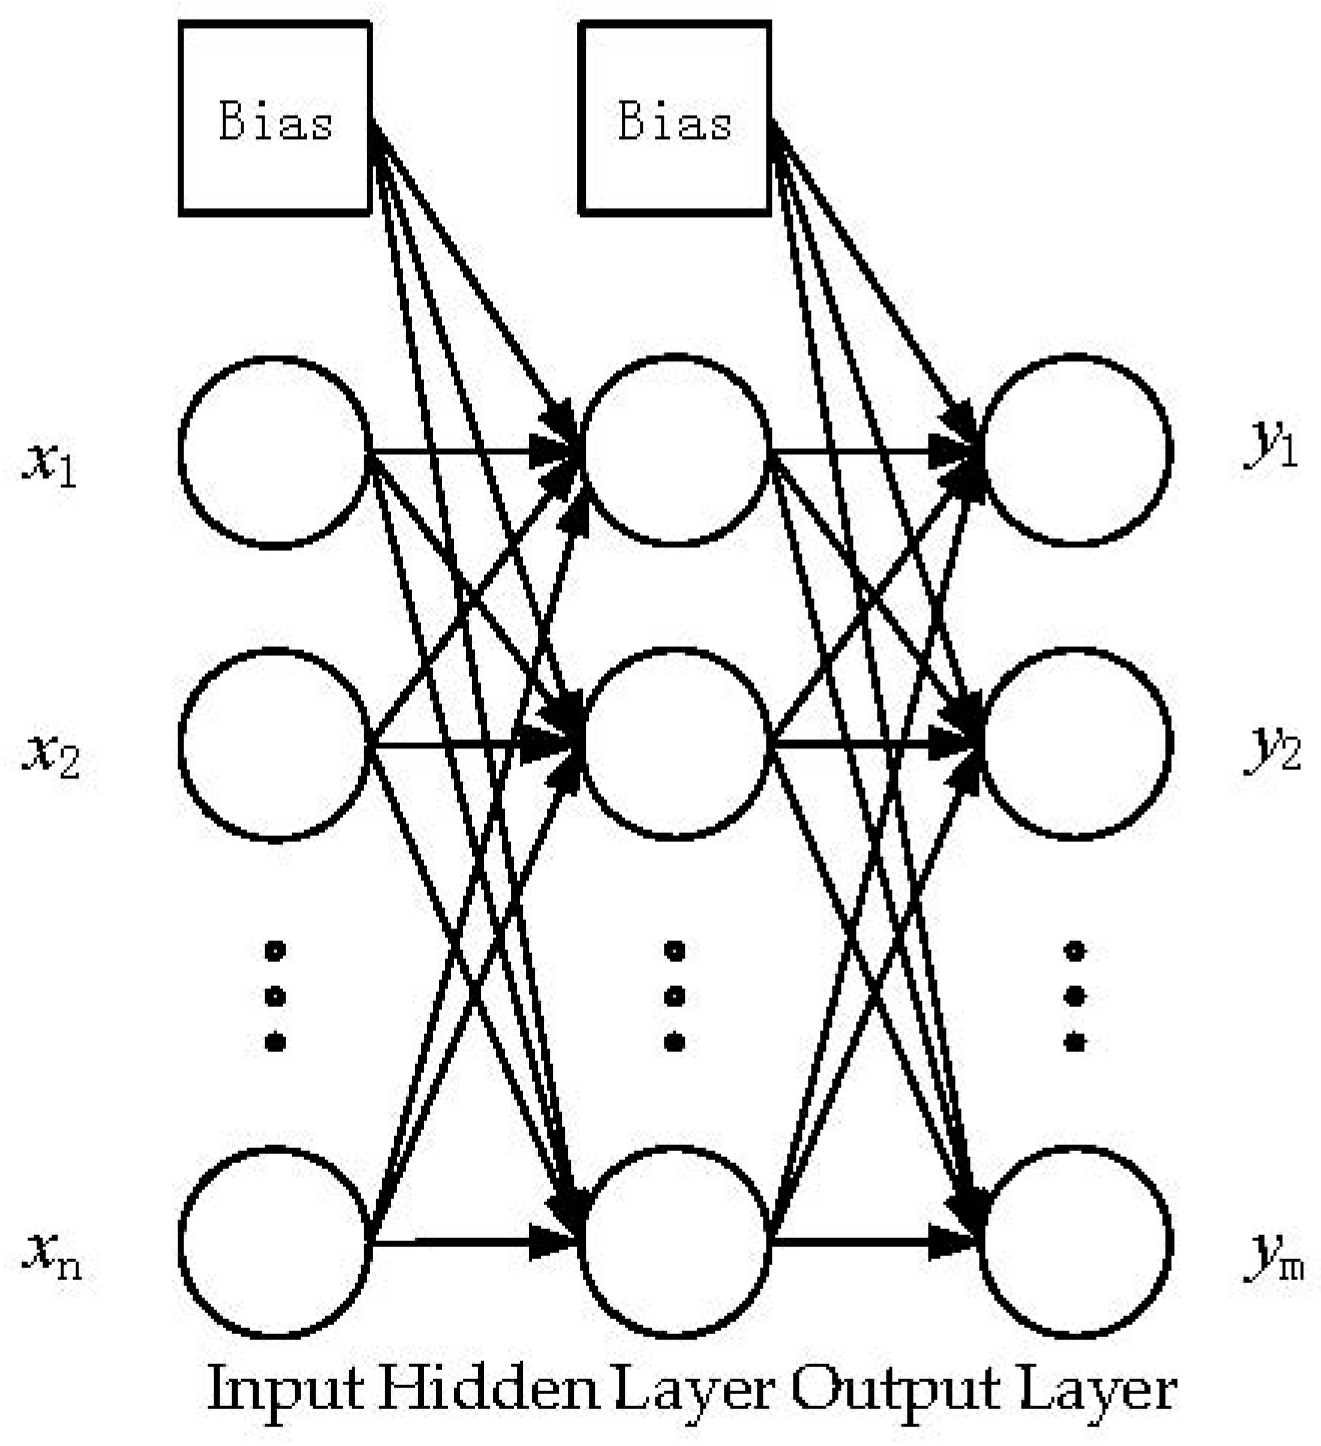
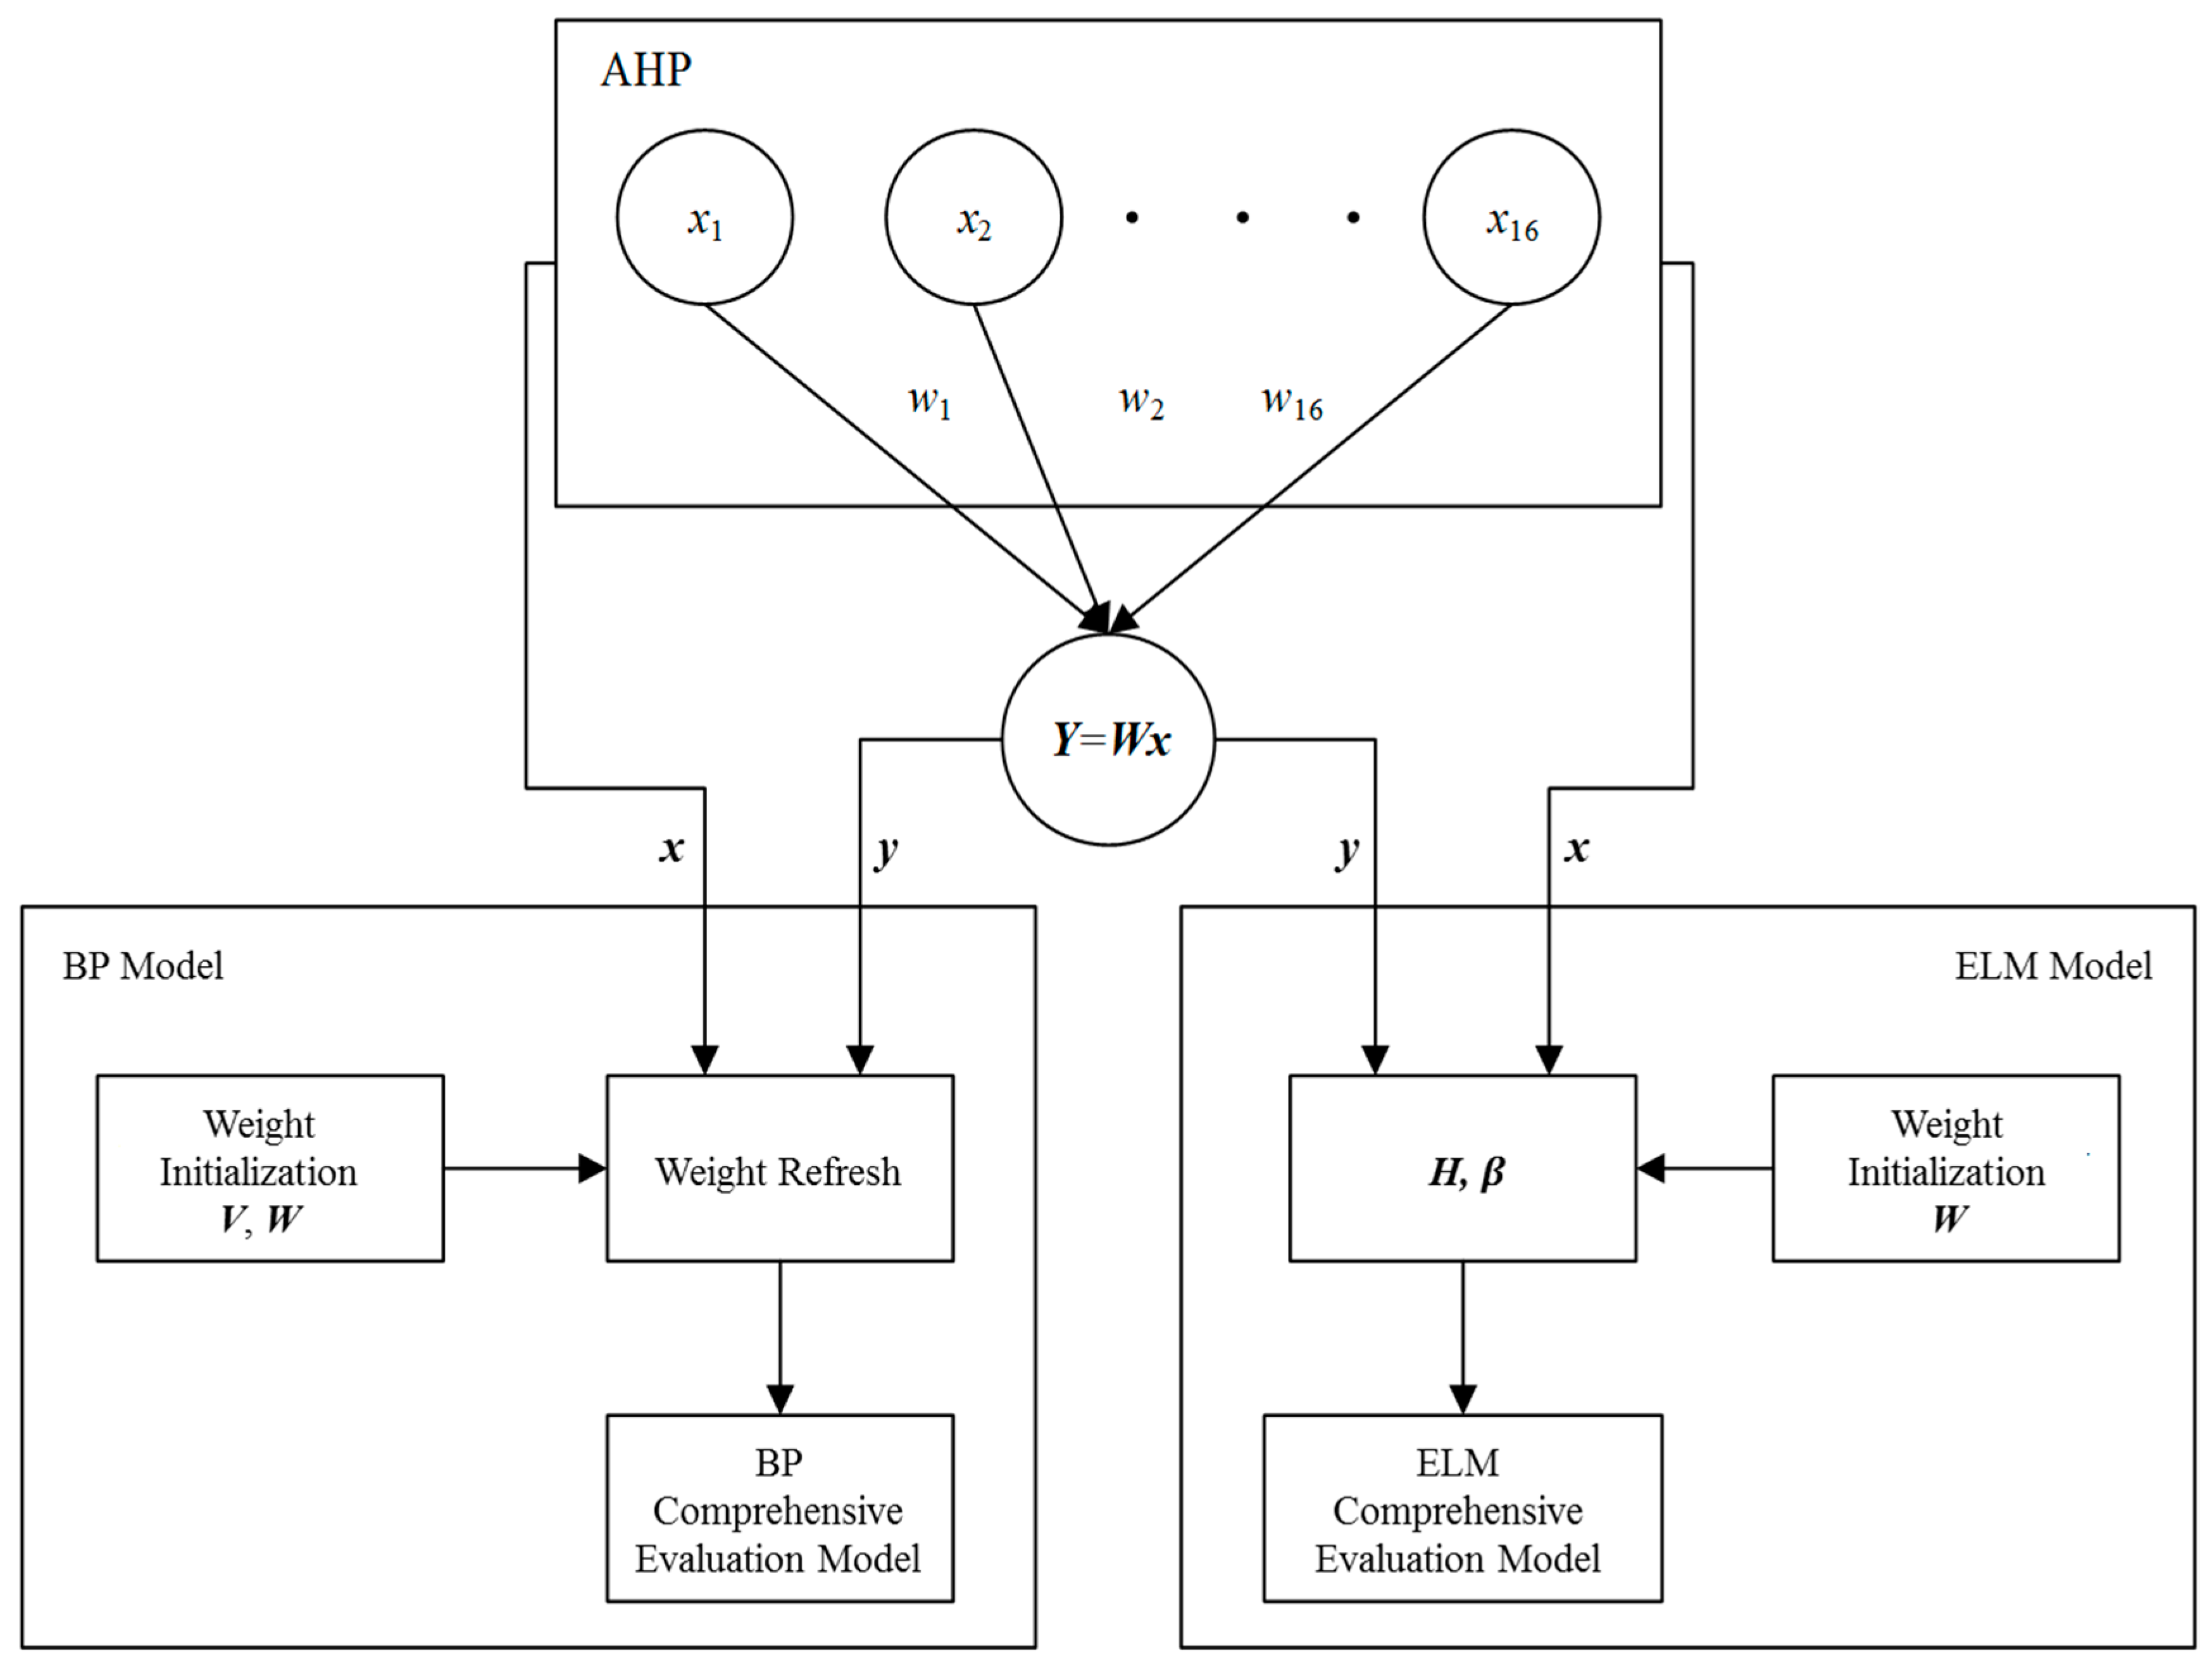
3.1.1. Hybrid Neural Network Model
3.1.2. ELM Model
3.2. Synthesis and Processing of Comprehensive Evaluation Model
3.2.1. Data Normalization Processing
3.2.2. The Determination of Index Weight
3.2.3. Determination of the Sample Target Value
3.2.4. Comprehensive Evaluation Model
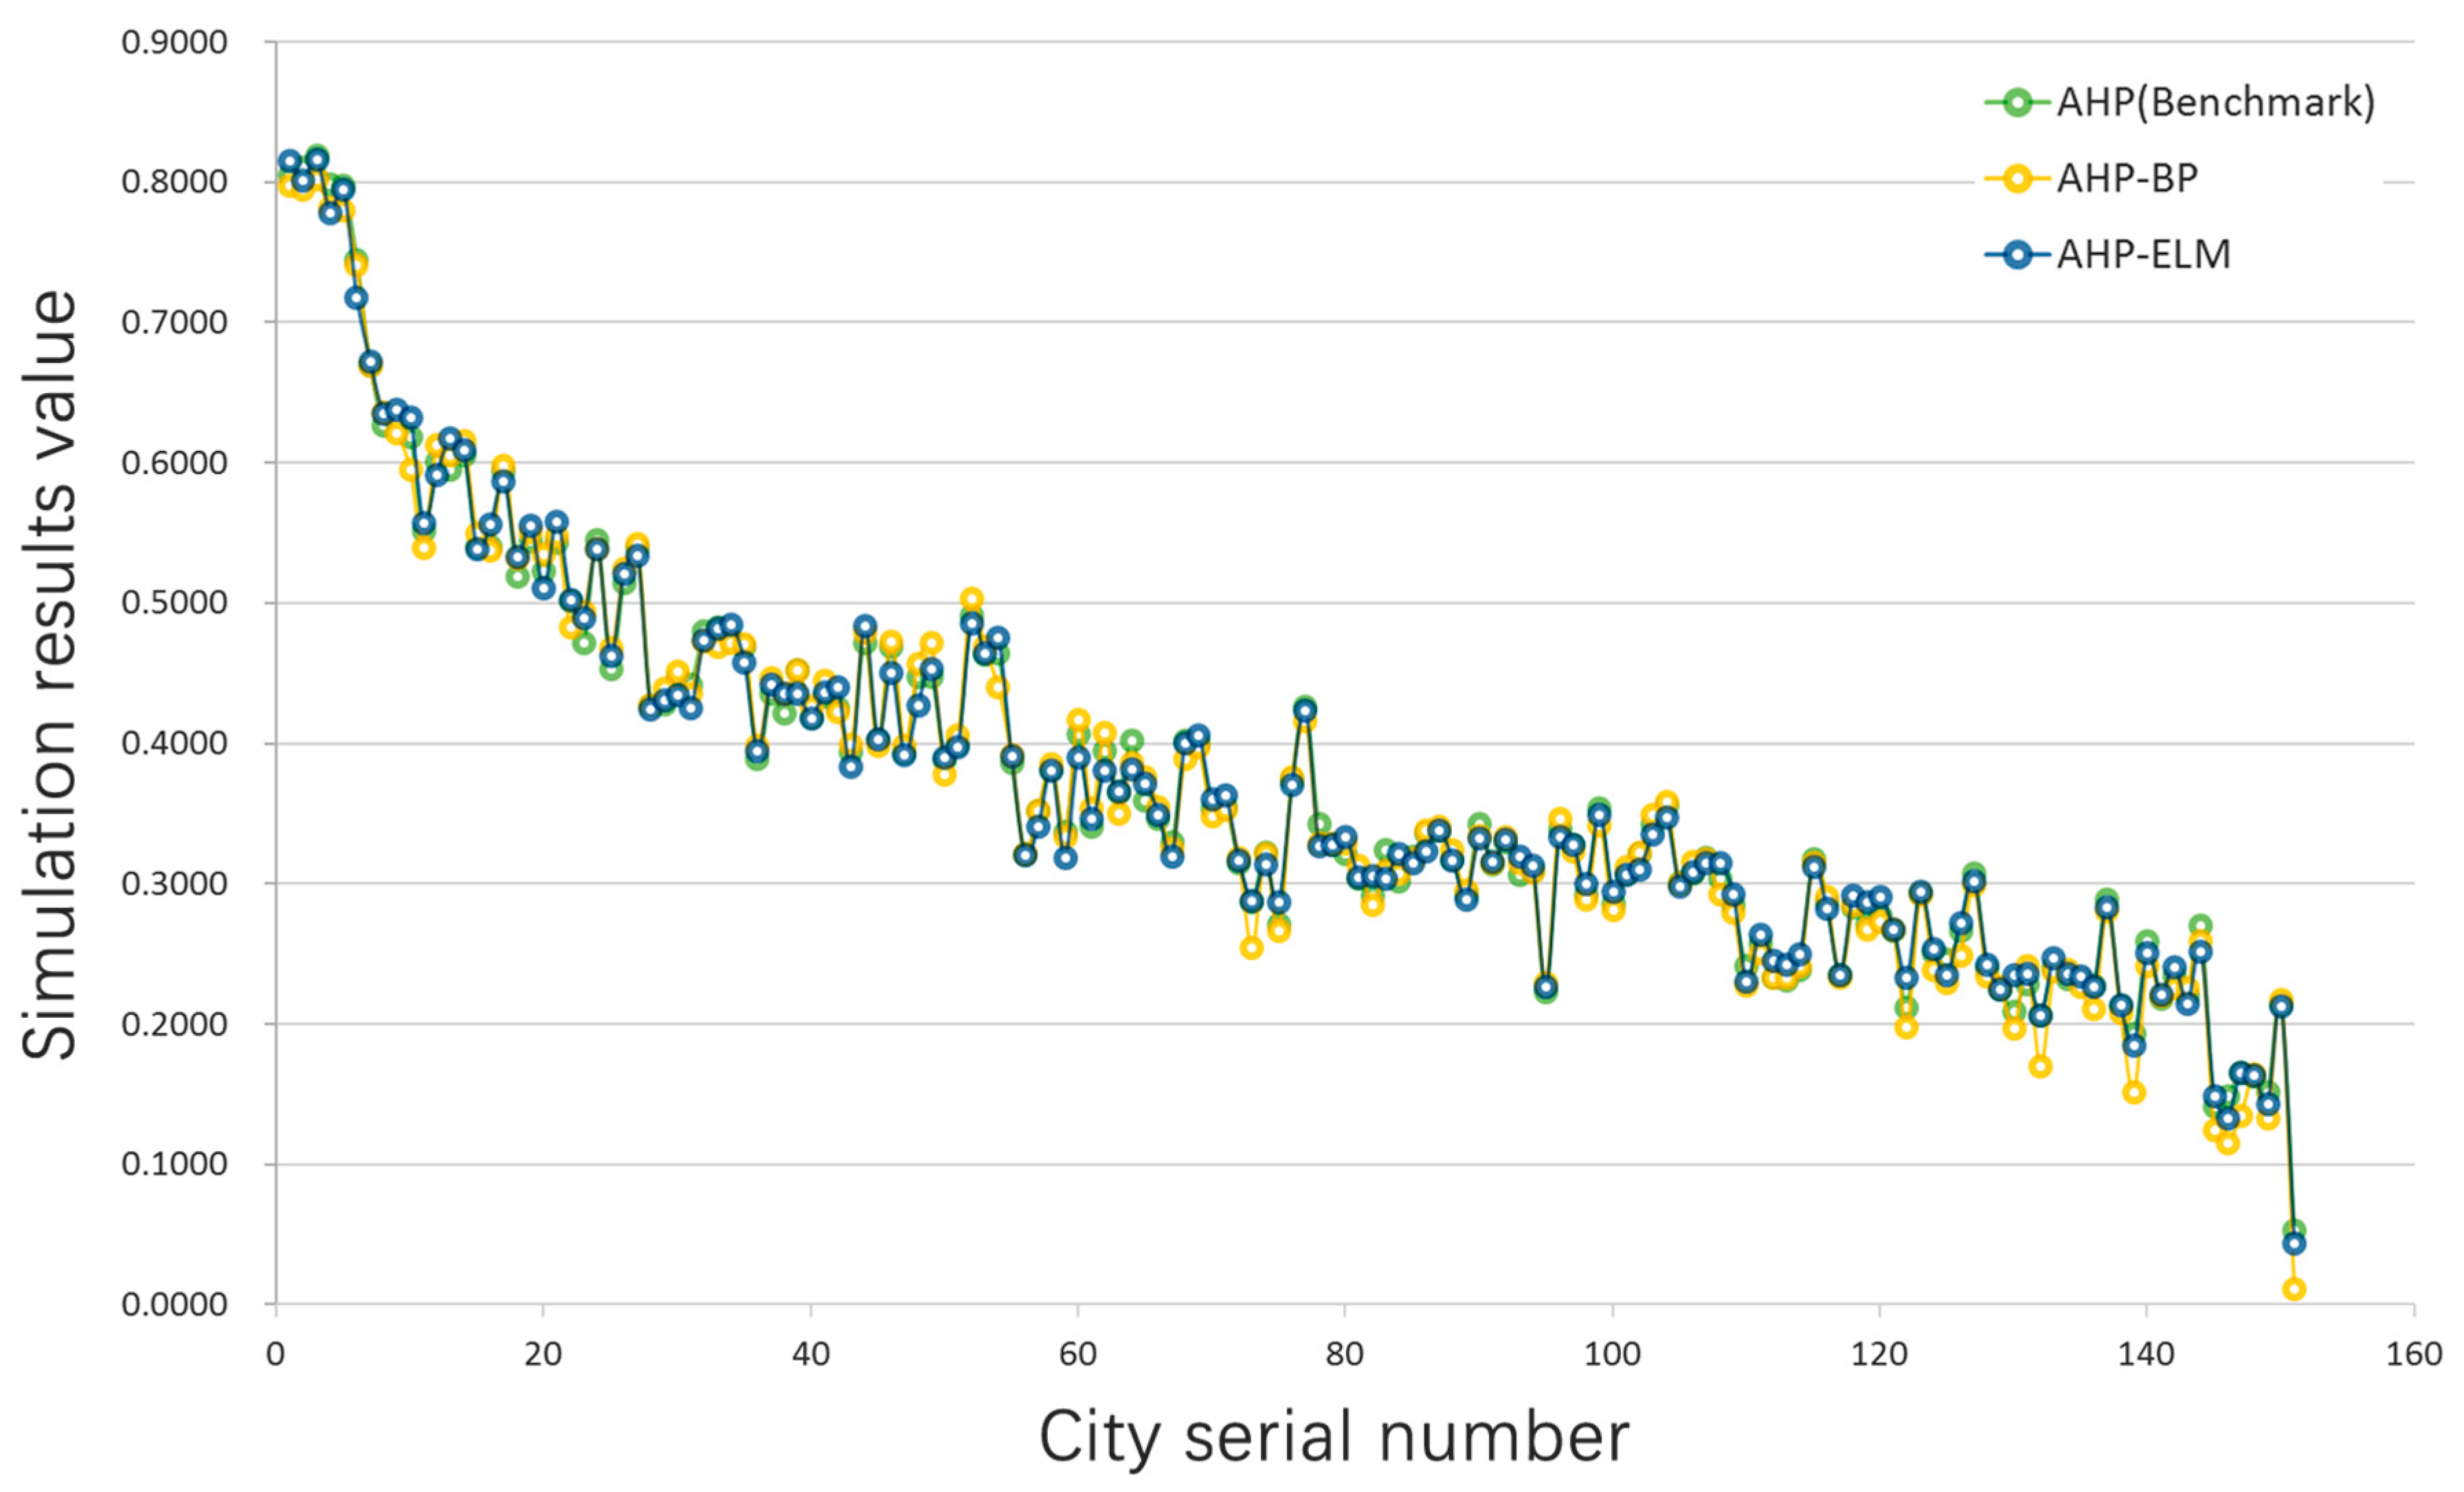
4. Results
5. Further Research
6. Conclusions
Acknowledgments
Author Contributions
Conflicts of Interest
Abbreviations
| PSF | People-Oriented, City-System and Resources-Flow |
| AHP | Analytic Hierarchy Process |
| BP | Back Propagation |
| ELM | Extreme Learning Machine |
| IoTs | Internet of Things |
| ANNs | Artificial Neural Networks |
| SVD | Single Value Decomposition |
References
- Chen, Y.Y. Study on the reasons and policies towards the rapid expansion of large cities. J. City Plan. Rev. 2003, 24, 33–41. (In Chinese) [Google Scholar]
- Zhang, H.B. Analysis of logical path of smart city. J. Intell. Build. 2014, 12, 59–63. (In Chinese) [Google Scholar]
- Harrison, C.; Eckmane, B.; Hamilton, R. Foundations for smarter cities. IBM J. Res. Dev. 2010, 54, 1–16. [Google Scholar] [CrossRef]
- Wang, Z.Q.; He, Y. Research on key technologies of smart city construction. J. Intell. Process. Appl. 2016, 6, 69–73. (In Chinese) [Google Scholar]
- Komninos, N. Intelligent cities: Innovation, knowledge systems, and digital spaces. Int. J. Technol. Manag. 2004, 28, 646–649. [Google Scholar]
- Lazaroiu, G.C.; Roscia, M. Definitional Methodology for the Smart Cities Model. Energy 2012, 47, 326–332. [Google Scholar] [CrossRef]
- Feng, J.W. Global smart city is entering a phase of rapid development. J. Internet Things Technol. 2016, 12, 12–18. (In Chinese) [Google Scholar]
- The Sixth (2016) China Prospective Industry Research Report; Forward-Looking Industry Research Institute: Shenzhen, China, 2017; Available online: http://en.qianzhan.com/ (accessed on 1 March 2016).
- Graham, S. Telecommunications and the Future of Cities: Debunking the Myths. Cities 1997, 14, 21–29. [Google Scholar] [CrossRef]
- Pomeroy, S.M. City of bits: Space, place, and the infobahn. Geogr. Rev. 2000, 90, 636–645. [Google Scholar] [CrossRef]
- Allwinkle, S.; Cruickshank, P. Creating smart-er cities: An overview. J. Urban Technol. 2011, 18, 1–16. [Google Scholar] [CrossRef]
- Washburn, D.; Sindhu, U. Helping CIOs understand “Smart City” initiatives. J. Growth 2009, 23, 24–32. [Google Scholar]
- Giffinger, R.; Kramar, H.; Haindl, G. The Role of Rankings in Growing City Competition. In Proceedings of the XI EURA Conference, Milan, Italy, 9–11 October 2008. [Google Scholar] [CrossRef]
- Etzkowitz, H. The Triple Helix: University-Industry-Government Innovation in Action; Routledge: Oxon, UK, 2008. [Google Scholar] [CrossRef]
- Leydesdorff, L.; Deakin, M. The Triple Helix of Smart Cities: A Neo-Evolutionist Perspective. J. Urban Technol. 2011, 18, 53–63. [Google Scholar] [CrossRef]
- Deakin, M. A Review of City Portals: The Transformation of Service Provision under the Democratization of the Fourth Phase. In Politics, Democracy and E-Government: Participation and Service Delivery; Reddick, C., Ed.; IGI: Hershey, PA, USA, 2010. [Google Scholar]
- Deakin, M. SCRAN’s Development of a Trans-National Comparator for the Standardisation of E-Government Services. In Comparative E-Government: An Examination of E-Government across Countries; Reddick, C., Ed.; Springer: Berlin, Germany, 2010. [Google Scholar]
- Deakin, M. The Embedded Intelligence of Smart Cities. Int. J. Intell. Build. 2011, 3, 179–187. [Google Scholar] [CrossRef]
- Deakin, M. Smart Cities: The State-of-the-Art and Governance Challenge. Triple Helix 2014, 1, 1–16. [Google Scholar] [CrossRef]
- Deakin, M. (Ed.) Creating Smarter Cities; Routledge: Oxon, UK, 2012. [Google Scholar]
- Deakin, M. (Ed.) Smart Cities: Governing, Modelling and Analysing the Transition; Routledge: Oxon, UK, 2013. [Google Scholar]
- Lombardi, P.; Del Bo, C.; Caragliu, A.; Deakin, M.; Nijkamp, P. An Advanced Triple-Helix Network Model for Smart Cities Performance. In Green and Ecological Technologies for Urban Planning; Ercoskun, O., Ed.; IGI Publisher: Hershey, PA, USA, 2011. [Google Scholar] [CrossRef]
- Lombardi, P.; Giordano, S.; Farouh, H.; Yousef, W. Modelling the Smart City Performance. Innov. Eur. J. Soc. Sci. Res. 2012, 25, 137–150. [Google Scholar] [CrossRef]
- Li, R.D.; Yao, Y.; Shao, Z.F. Big data in smart city. J. Geomat. Inf. Sci. Wuhan Univ. 2015, 58, 1–12. (In Chinese) [Google Scholar]
- Zhou, J. Study on Evaluation System of Smart City; Huazhong University of Science and Technology: Wuhan, China, 2013. (In Chinese) [Google Scholar]
- Kirkman, G.S.; Osorio, C.A.; Sachs, J.D. The Networked Readiness Index: Measuring the Preparedness of Nations for the Networked World. In The Global Information Technology Report 2001–2002; Oxford University Press: Oxford, UK, 2002. [Google Scholar]
- World Economic Forum Annual Report 2015–2016. Available online: http://www3.weforum.org/docs/WEF_Annual_Report_2015-2016.pdf (accessed on 1 March 2016).
- Global Information Technology Report. Available online: https://www.insead.edu/ (accessed on 1 March 2016).
- Global Information Technology Report. 2015. Available online: http://reports.weforum.org/global-information-technology-report-2015/economies/ (accessed on 1 March 2016).
- Wang, W. 21st century ubiquitous network society—A brief discussion on Japan’s U-Japan and Korea’s U-Korea strategy. J. Inf. Netw. 2005, 11, 1–4. (In Chinese) [Google Scholar]
- Sawicki, D. The rise of the creative class: And how it’s transforming work, leisure, community and everyday life. J. Am. Plan. Assoc. 2003, 69, 90–91. [Google Scholar]
- Komninos, N. Intelligent cities: Towards interactive and global innovation environments. Int. J. Innov. Reg. Dev. 2009, 1, 62–71. [Google Scholar] [CrossRef]
- National Center for Intelligent Urban Research. The Fifth Annual (2015) Assessment Report on the Development of Smart Cities in China; National Center for Intelligent Urban Research: Beijing, China, 2016. [Google Scholar]
- Huang, G.B.; Zhu, Q.Y.; Siew, C.K. Extreme learning machine: A new learning scheme of feedforward neural networks. In Proceedings of the 2004 IEEE International Joint Conference on Neural Networks, Budapest, Hungary, 25–29 July 2004; Volume 12, pp. 85–90. [Google Scholar]
- Huang, G.B.; Zhu, Q.Y.; Siew, C.K. Extreme learning machine: Theory and applications. Neurocomputing 2006, 70, 489–501. (In Chinese) [Google Scholar] [CrossRef]
- Dinkel, H.; Michael, S.; Weatheritt, R.J. ELM—The database of eukaryotic linear motifs. Nucleic Acids Res. 2012, 40, D242–D257. [Google Scholar] [CrossRef] [PubMed]
- China Statistical Yearbook in 2015. Available online: http://www.stats.gov.cn/tjsj/ndsj/2015/indexch.htm (accessed on 1 March 2016).
- Report of Tongheng Smart City Institute. Available online: http://www.govmade.cn/index.php?m=content&c=index&a=lists&catid=111 (accessed on 1 March 2016).


| Target Layer (A) | Primary Index (B) | Secondary Index (X) |
|---|---|---|
| Comprehensive evaluation index system for urban intelligent development | B1 Smart individual | X1 Information service industry practitioners |
| X2 People’s life network level | ||
| B2 Smart management | X3 Government online service level | |
| X4 Public resource trading platform | ||
| X5 Social media engagement | ||
| B3 Smart service | X6 Social welfare service level | |
| X7 Open data service levels | ||
| B4 Smart economy | X8 Urban innovation and entrepreneurship level | |
| X9 Energy consumption level of economic output | ||
| X10 Level of Internet industry development | ||
| B5 Smart guarantee | X11 Development plan formulation | |
| X12 Information publicity and training | ||
| X13 Performance appraisal | ||
| B6 Smart infrastructure | X14 Basic network construction | |
| X15 Building and sharing of basic information resources | ||
| X16 Application of urban Cloud Platform |
| Target Layer | Primary Index | Weight Coefficient | Consistency Test Results | Secondary Indicators | Weight Coefficient | Consistency Test Results |
|---|---|---|---|---|---|---|
| A1 Comprehensive evaluation index system for urban intelligent development | B1 | 0.1889 | X1 | 0.5 | ||
| X2 | 0.5 | |||||
| B2 | 0.2365 | X3 | 0.33 | |||
| X4 | 0.33 | |||||
| X5 | 0.33 | |||||
| B3 | 0.1156 | X6 | 0.5 | |||
| X7 | 0.5 | |||||
| B4 | 0.0771 | X8 | 0.25 | |||
| X9 | 0.25 | |||||
| X10 | 0.5 | |||||
| B5 | 0.1534 | X11 | 0.25 | |||
| X12 | 0.5 | |||||
| X13 | 0.25 | |||||
| B6 | 0.2284 | X14 | 0.2 | |||
| X15 | 0.2 | |||||
| X16 | 0.6 |
| m | 8 | 9 | 10 | 11 | 12 | 13 | 14 | 15 |
| Testing Error | 2.84 × 10⁻³ | 2.66 × 10⁻³ | 2.43 × 10⁻³ | 2.25 × 10⁻³ | 1.49 × 10⁻³ | 1.34 × 10⁻³ | 2.00 × 10⁻⁴ | 2.21 × 10⁻⁴ |
| m | 16 | 17 | 18 | 19 | 20 | 21 | 22 | 23 |
| Testing Error | 2.40 × 10⁻⁴ | 2.31 × 10⁻⁴ | 3.73 × 10⁻³ | 3.74 × 10⁻³ | 5.00 × 10⁻³ | 6.44 × 10⁻³ | 3.21 × 10⁻³ | 6.35 × 10⁻³ |
| m | 8 | 9 | 10 | 11 | 12 | 13 | 14 | 15 |
| Testing Error | 3.46× 10⁻³ | 3.67 × 10⁻³ | 3.36 × 10⁻³ | 2.94 × 10⁻³ | 2.62 × 10⁻³ | 2.35 × 10⁻³ | 2.02 × 10⁻³ | 1.94 × 10⁻³ |
| m | 16 | 17 | 18 | 19 | 20 | 21 | 22 | 23 |
| Testing Error | 1.86 × 10⁻³ | 1.89 × 10⁻³ | 8.22 × 10⁻⁴ | 9.05 × 10⁻⁴ | 8.05 × 10⁻⁵ | 9.12 × 10⁻⁴ | 9.51 × 10⁻⁴ | 9.30 × 10⁻⁴ |
| Cities | Classification | Classification | Classification | ||||
|---|---|---|---|---|---|---|---|
| Training samples | Wuxi | 0.8054 | Excellent | 0.7977 | Good | 0.8155 | Excellent |
| Shanghai | 0.8113 | Excellent | 0.7952 | Good | 0.8013 | Excellent | |
| Beijing | 0.8195 | Excellent | 0.8021 | Excellent | 0.8165 | Excellent | |
| Hangzhou | 0.7992 | Good | 0.7824 | Good | 0.7788 | Good | |
| Ningbo | 0.7978 | Good | 0.7806 | Good | 0.7950 | Good | |
| Shenzhen | 0.7453 | Good | 0.7409 | Good | 0.7179 | Good | |
| Zhuhai | 0.6698 | Good | 0.6696 | Good | 0.6722 | Good | |
| Foshan | 0.6273 | Good | 0.6365 | Good | 0.6351 | Good | |
| … | … | … | … | … | … | … | |
| Huainan | 0.2863 | Pass | 0.2818 | Pass | 0.2948 | Pass | |
| Test samples | Yichun | 0.3078 | Pass | 0.3121 | Pass | 0.3063 | Pass |
| Hulun Buir | 0.3220 | Pass | 0.3225 | Pass | 0.3100 | Pass | |
| Zunyi | 0.3431 | Pass | 0.3490 | Pass | 0.3354 | Pass | |
| Lianyungang | 0.3556 | Pass | 0.3584 | Pass | 0.3471 | Pass | |
| Xuzhou | 0.3009 | Pass | 0.3000 | Pass | 0.2985 | Pass | |
| Baoji | 0.3078 | Pass | 0.3158 | Pass | 0.3084 | Pass | |
| Anshan | 0.3192 | Pass | 0.3176 | Pass | 0.3153 | Pass | |
| Shijiazhuang | 0.3036 | Pass | 0.2931 | Pass | 0.3148 | Pass | |
| … | … | … | … | … | … | … | |
| Luohe | 0.0533 | Fail | 0.0113 | Fail | 0.0439 | Fail |
| AHP-BP | AHP-ELM | |
|---|---|---|
| Computation Cost (s) | 14.11 s | 0.42 s |
© 2017 by the authors. Licensee MDPI, Basel, Switzerland. This article is an open access article distributed under the terms and conditions of the Creative Commons Attribution (CC BY) license (http://creativecommons.org/licenses/by/4.0/).
Share and Cite
Shi, H.; Tsai, S.-B.; Lin, X.; Zhang, T. How to Evaluate Smart Cities’ Construction? A Comparison of Chinese Smart City Evaluation Methods Based on PSF. Sustainability 2018, 10, 37. https://doi.org/10.3390/su10010037
Shi H, Tsai S-B, Lin X, Zhang T. How to Evaluate Smart Cities’ Construction? A Comparison of Chinese Smart City Evaluation Methods Based on PSF. Sustainability. 2018; 10(1):37. https://doi.org/10.3390/su10010037
Chicago/Turabian StyleShi, Hongbo, Sang-Bing Tsai, Xiaowei Lin, and Tianyi Zhang. 2018. "How to Evaluate Smart Cities’ Construction? A Comparison of Chinese Smart City Evaluation Methods Based on PSF" Sustainability 10, no. 1: 37. https://doi.org/10.3390/su10010037
APA StyleShi, H., Tsai, S.-B., Lin, X., & Zhang, T. (2018). How to Evaluate Smart Cities’ Construction? A Comparison of Chinese Smart City Evaluation Methods Based on PSF. Sustainability, 10(1), 37. https://doi.org/10.3390/su10010037