Risk Identification in the Early Design Stage Using Thermal Simulations—A Case Study

Abstract
:1. Introduction
2. Problem Statement
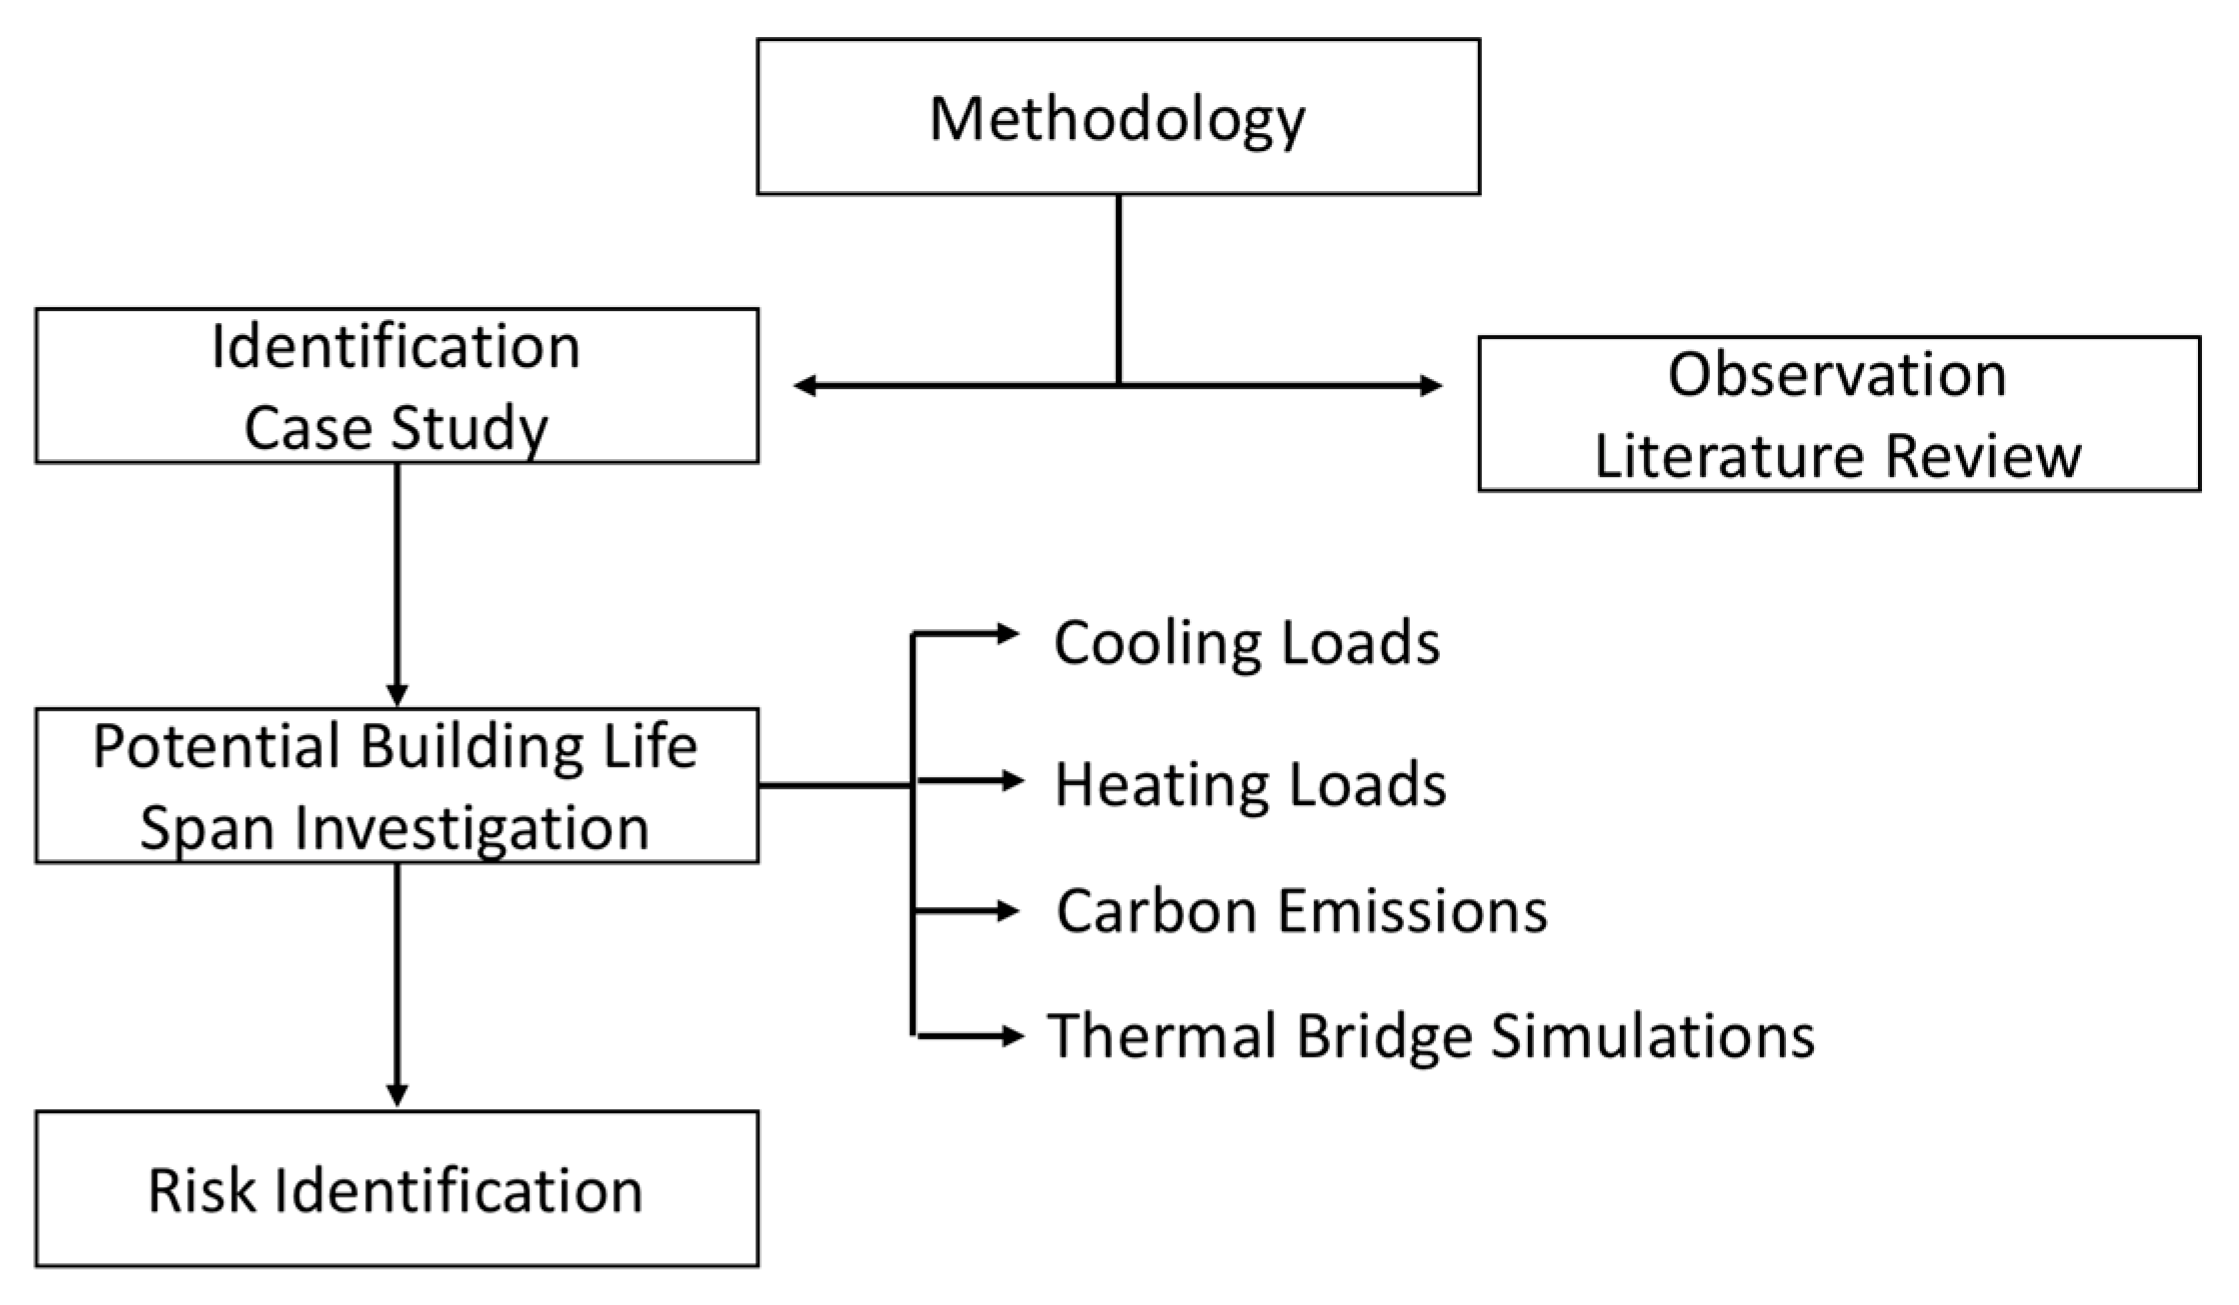
3. Methodology
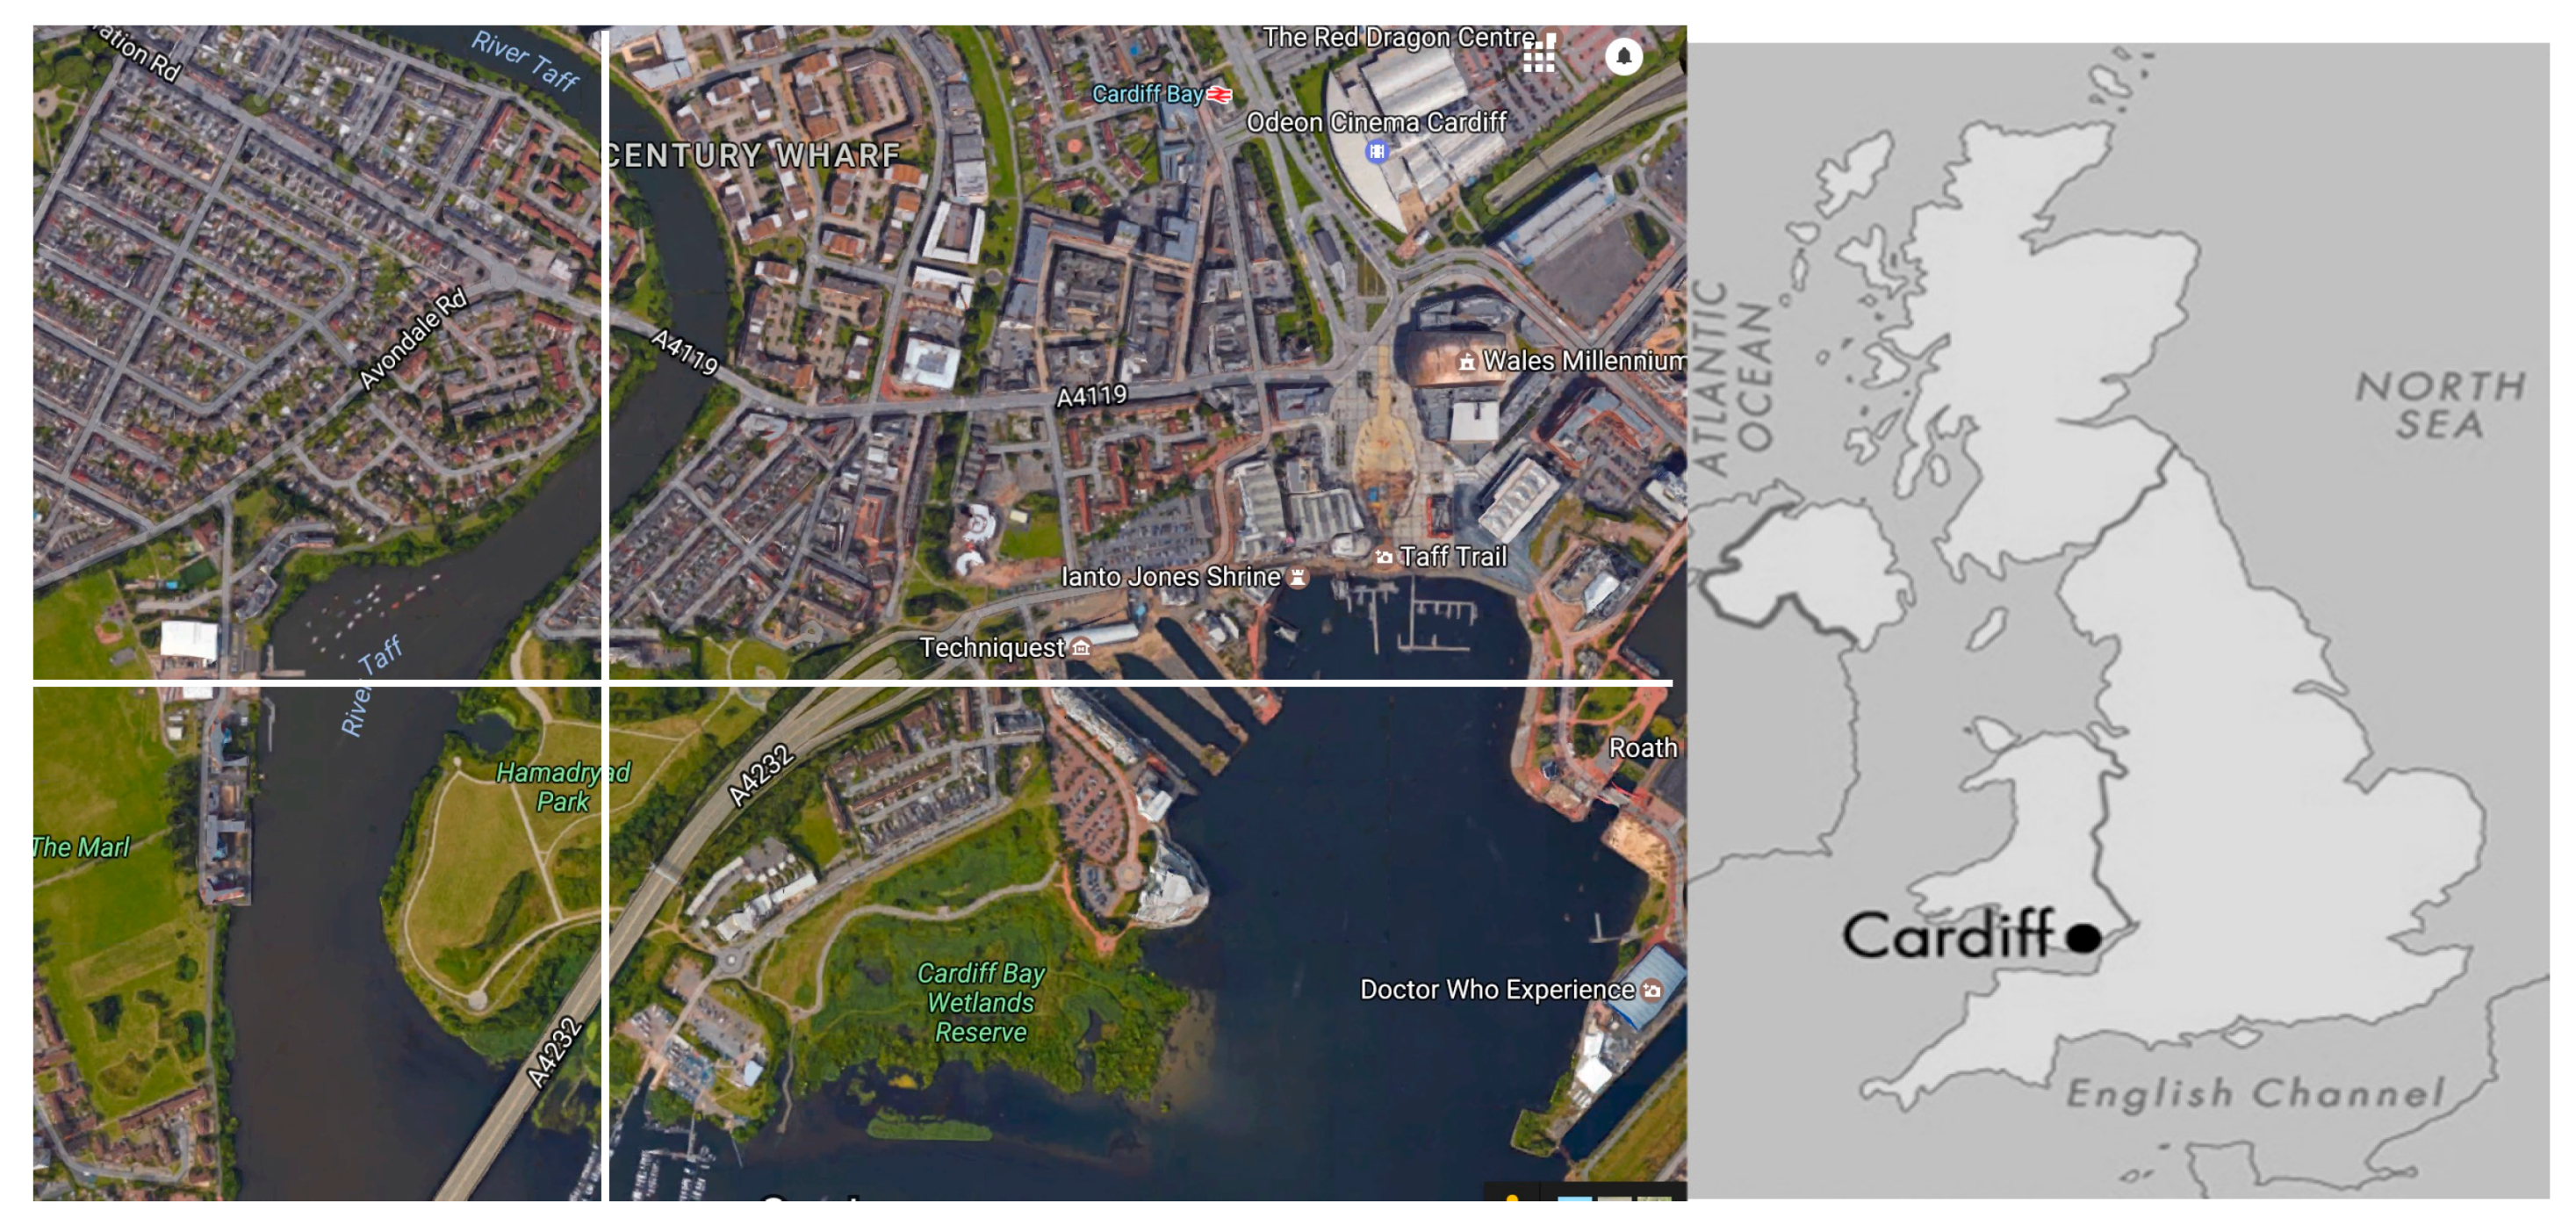
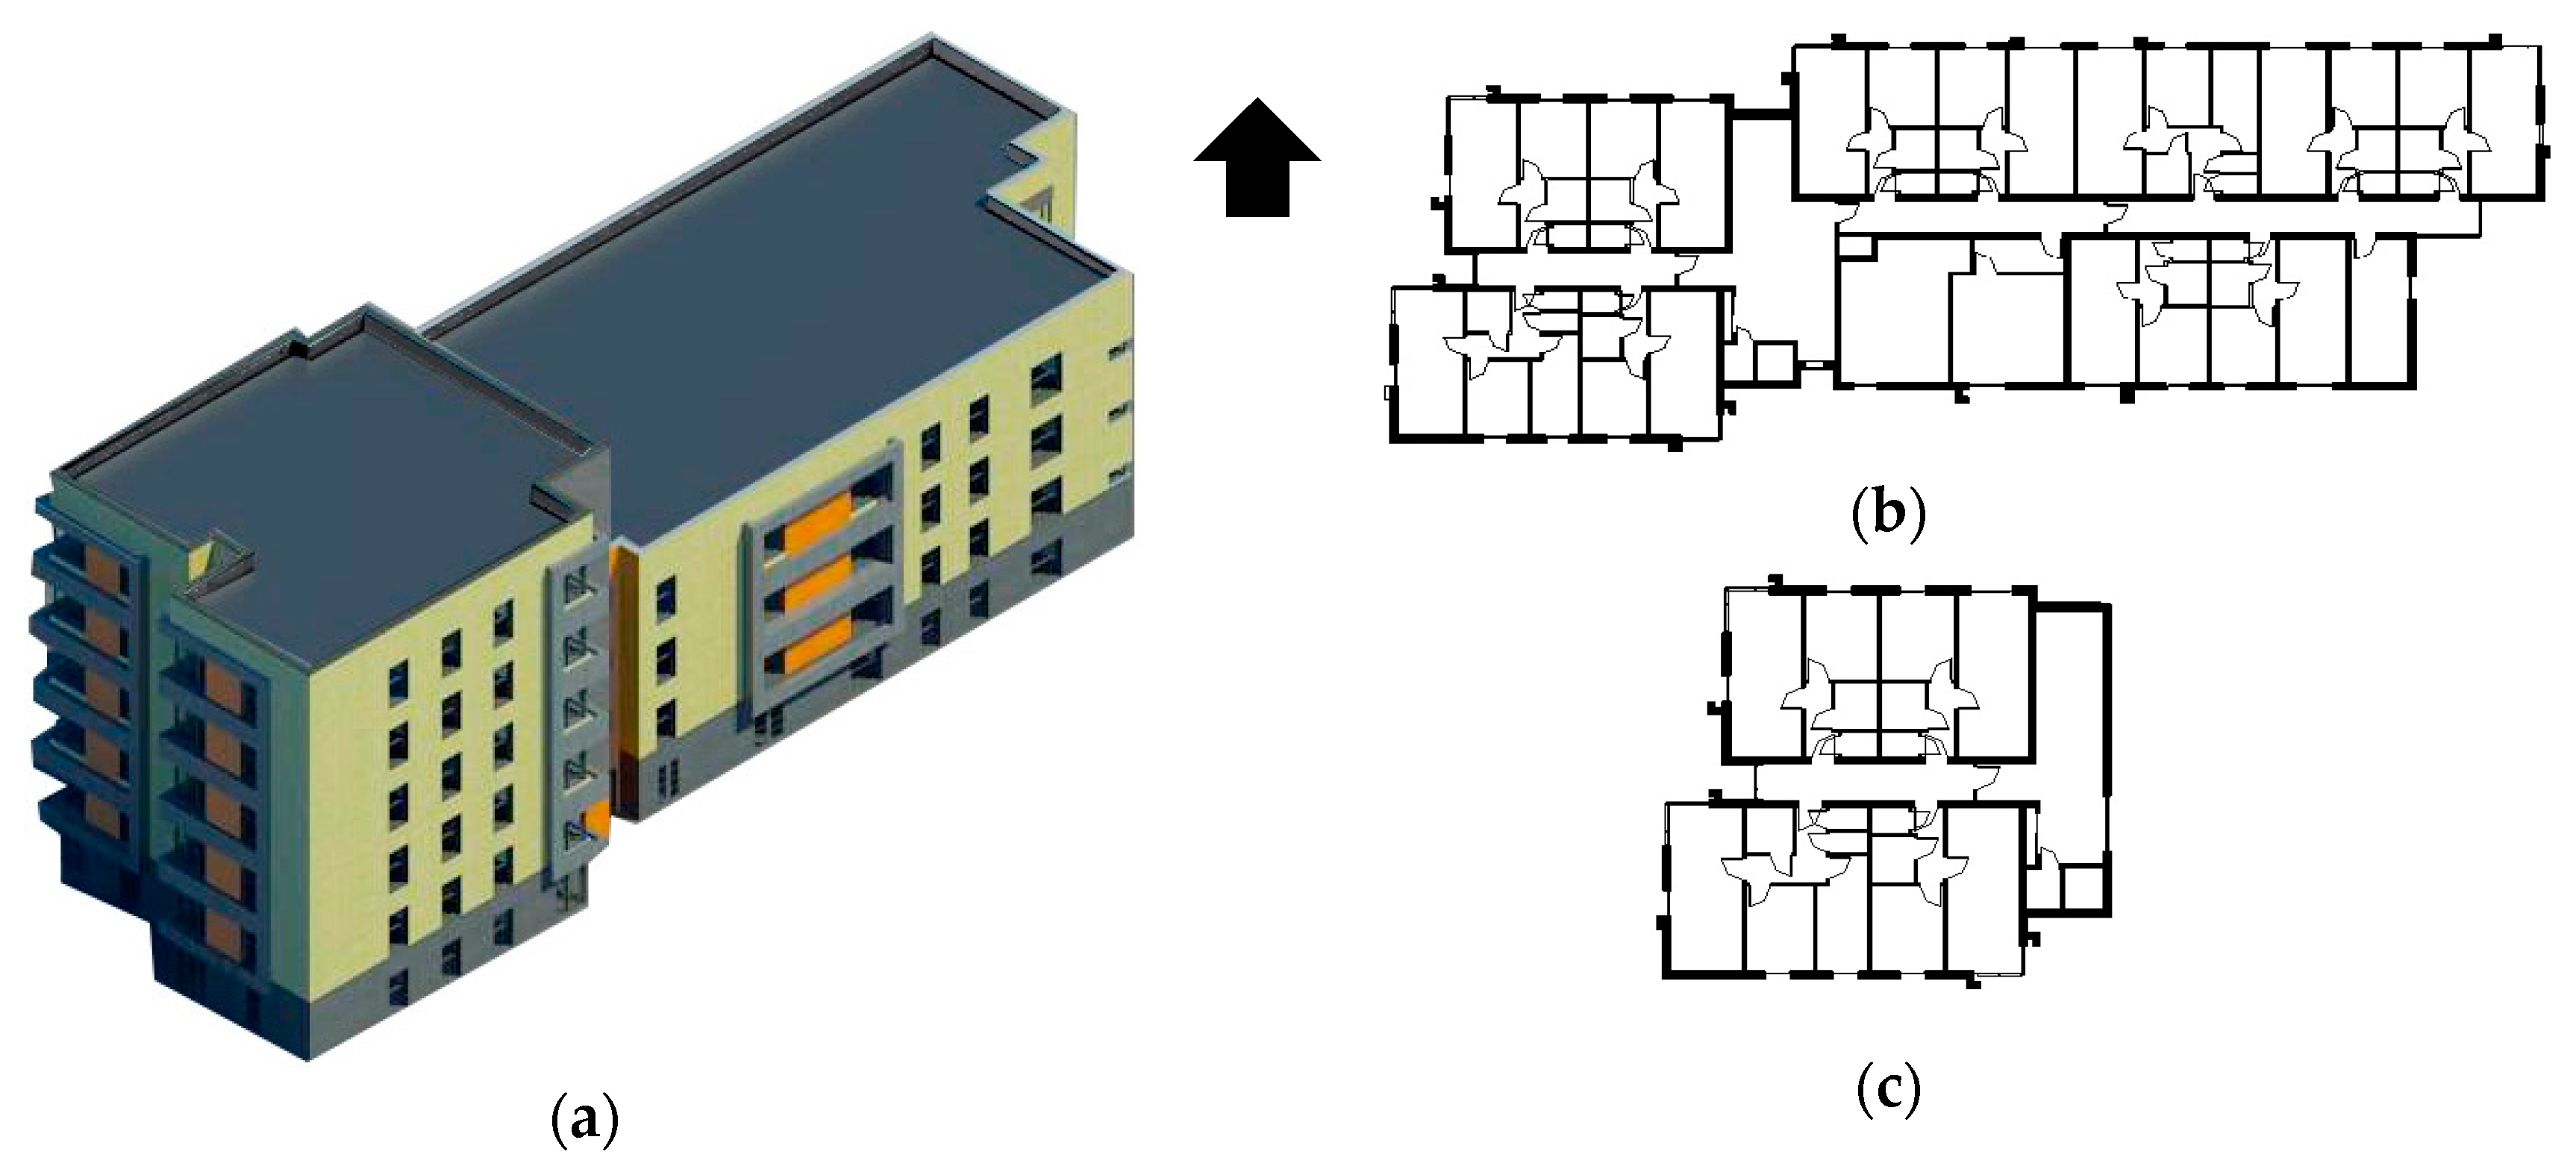
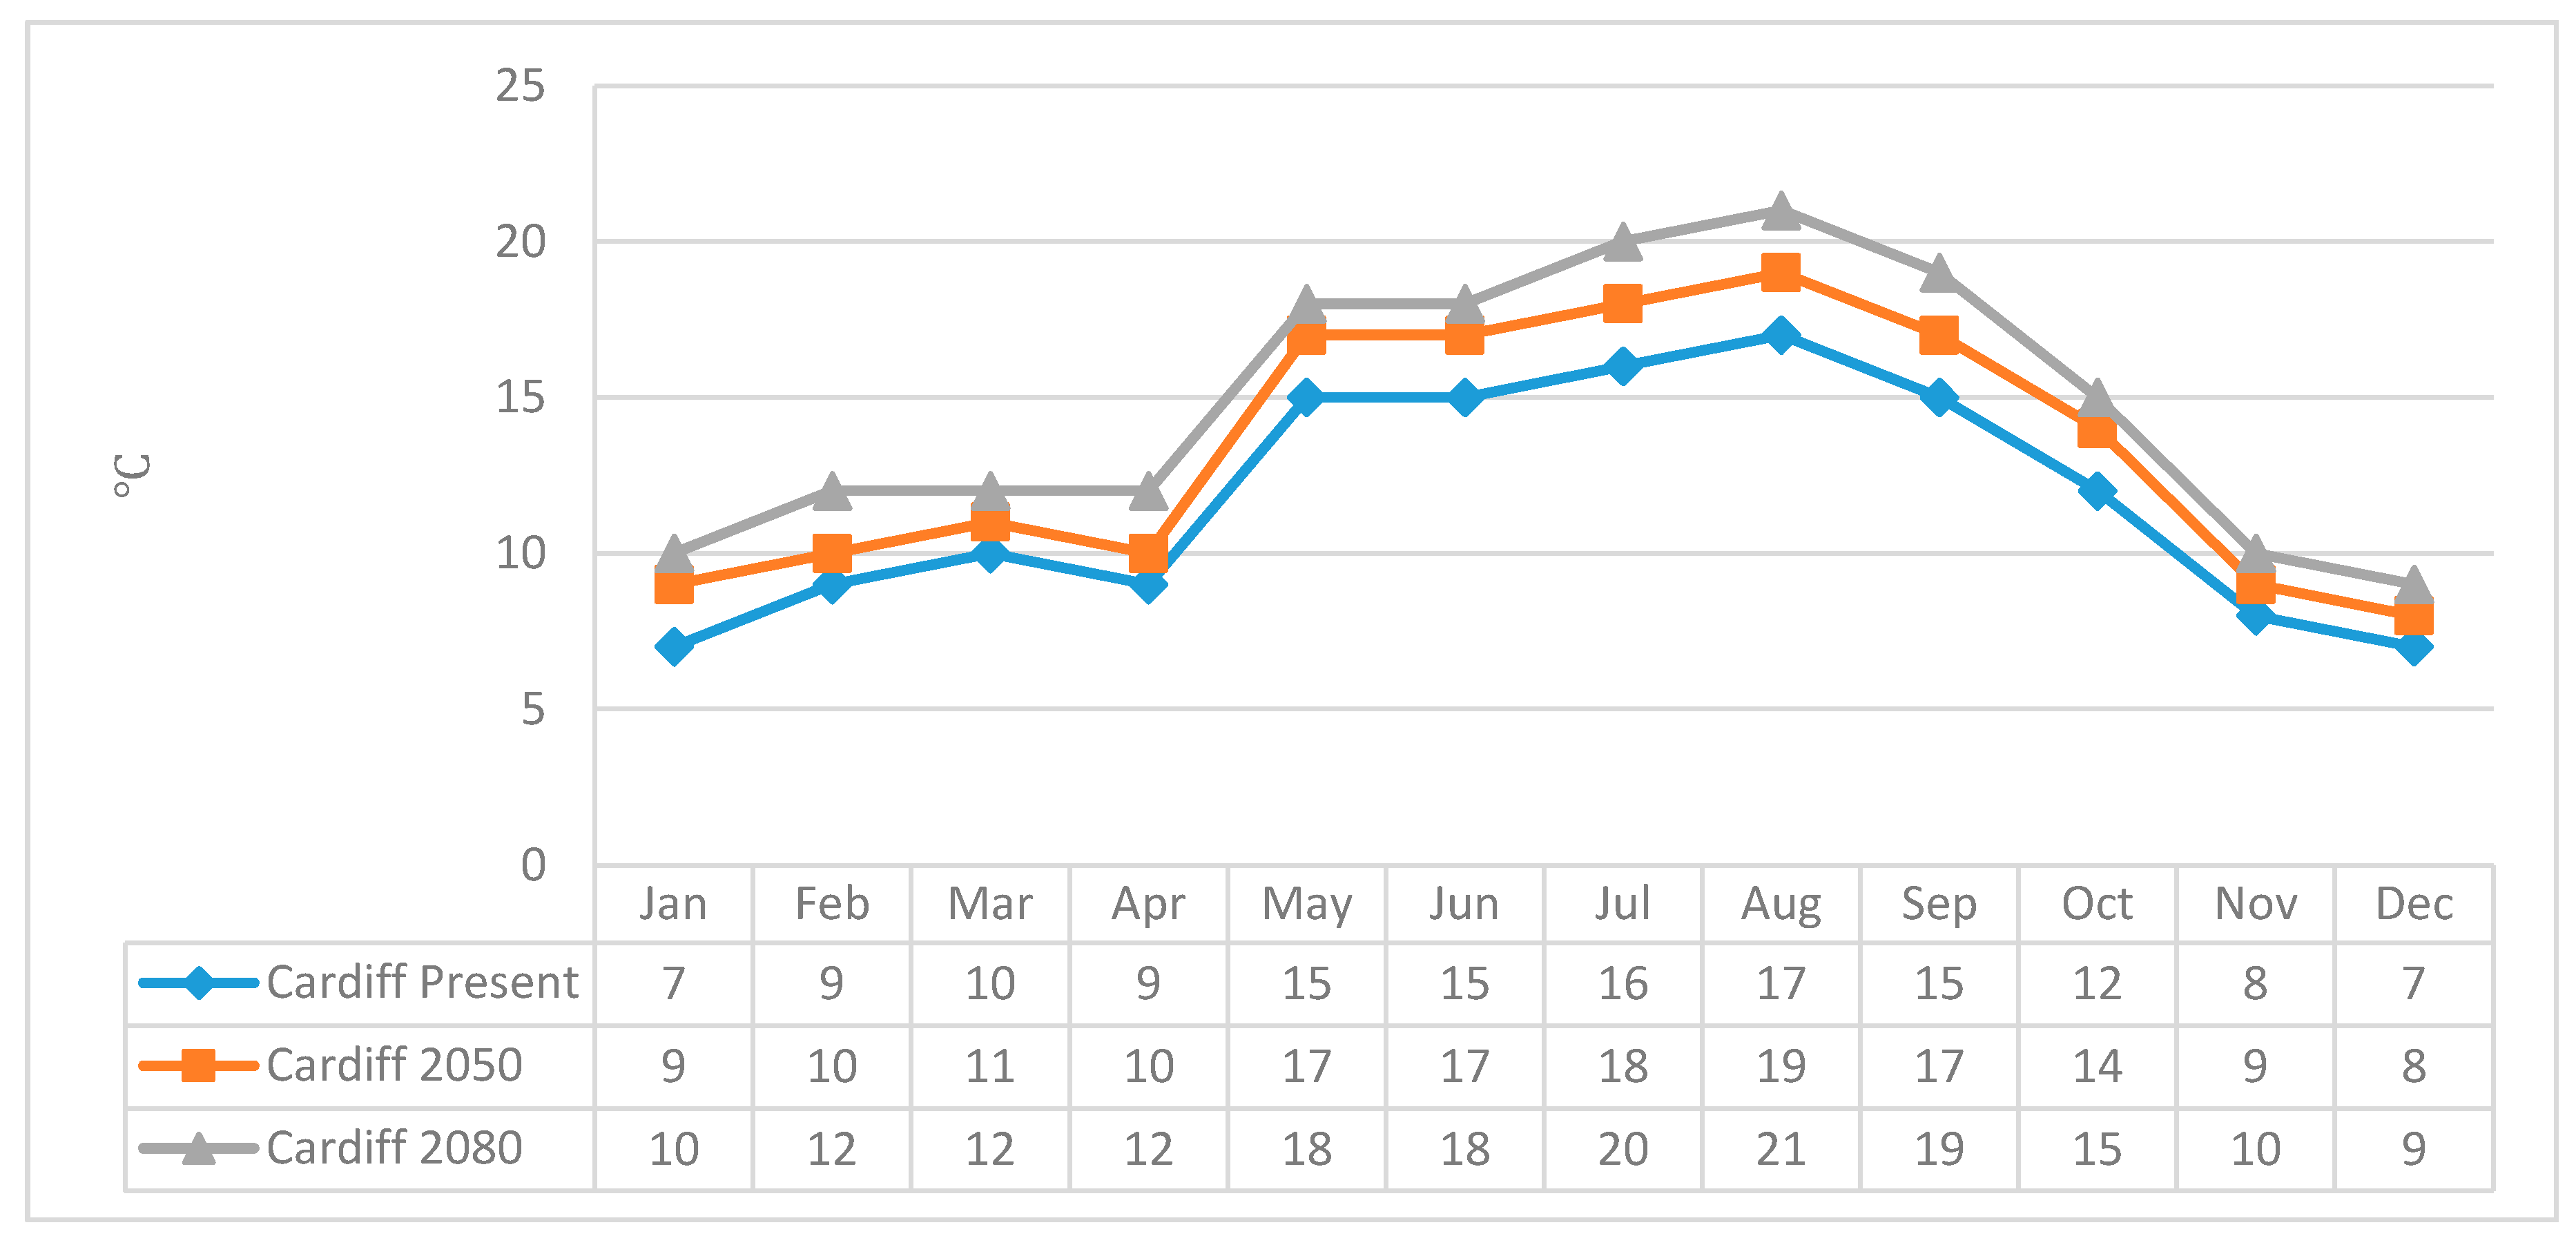
3.1. Case Study
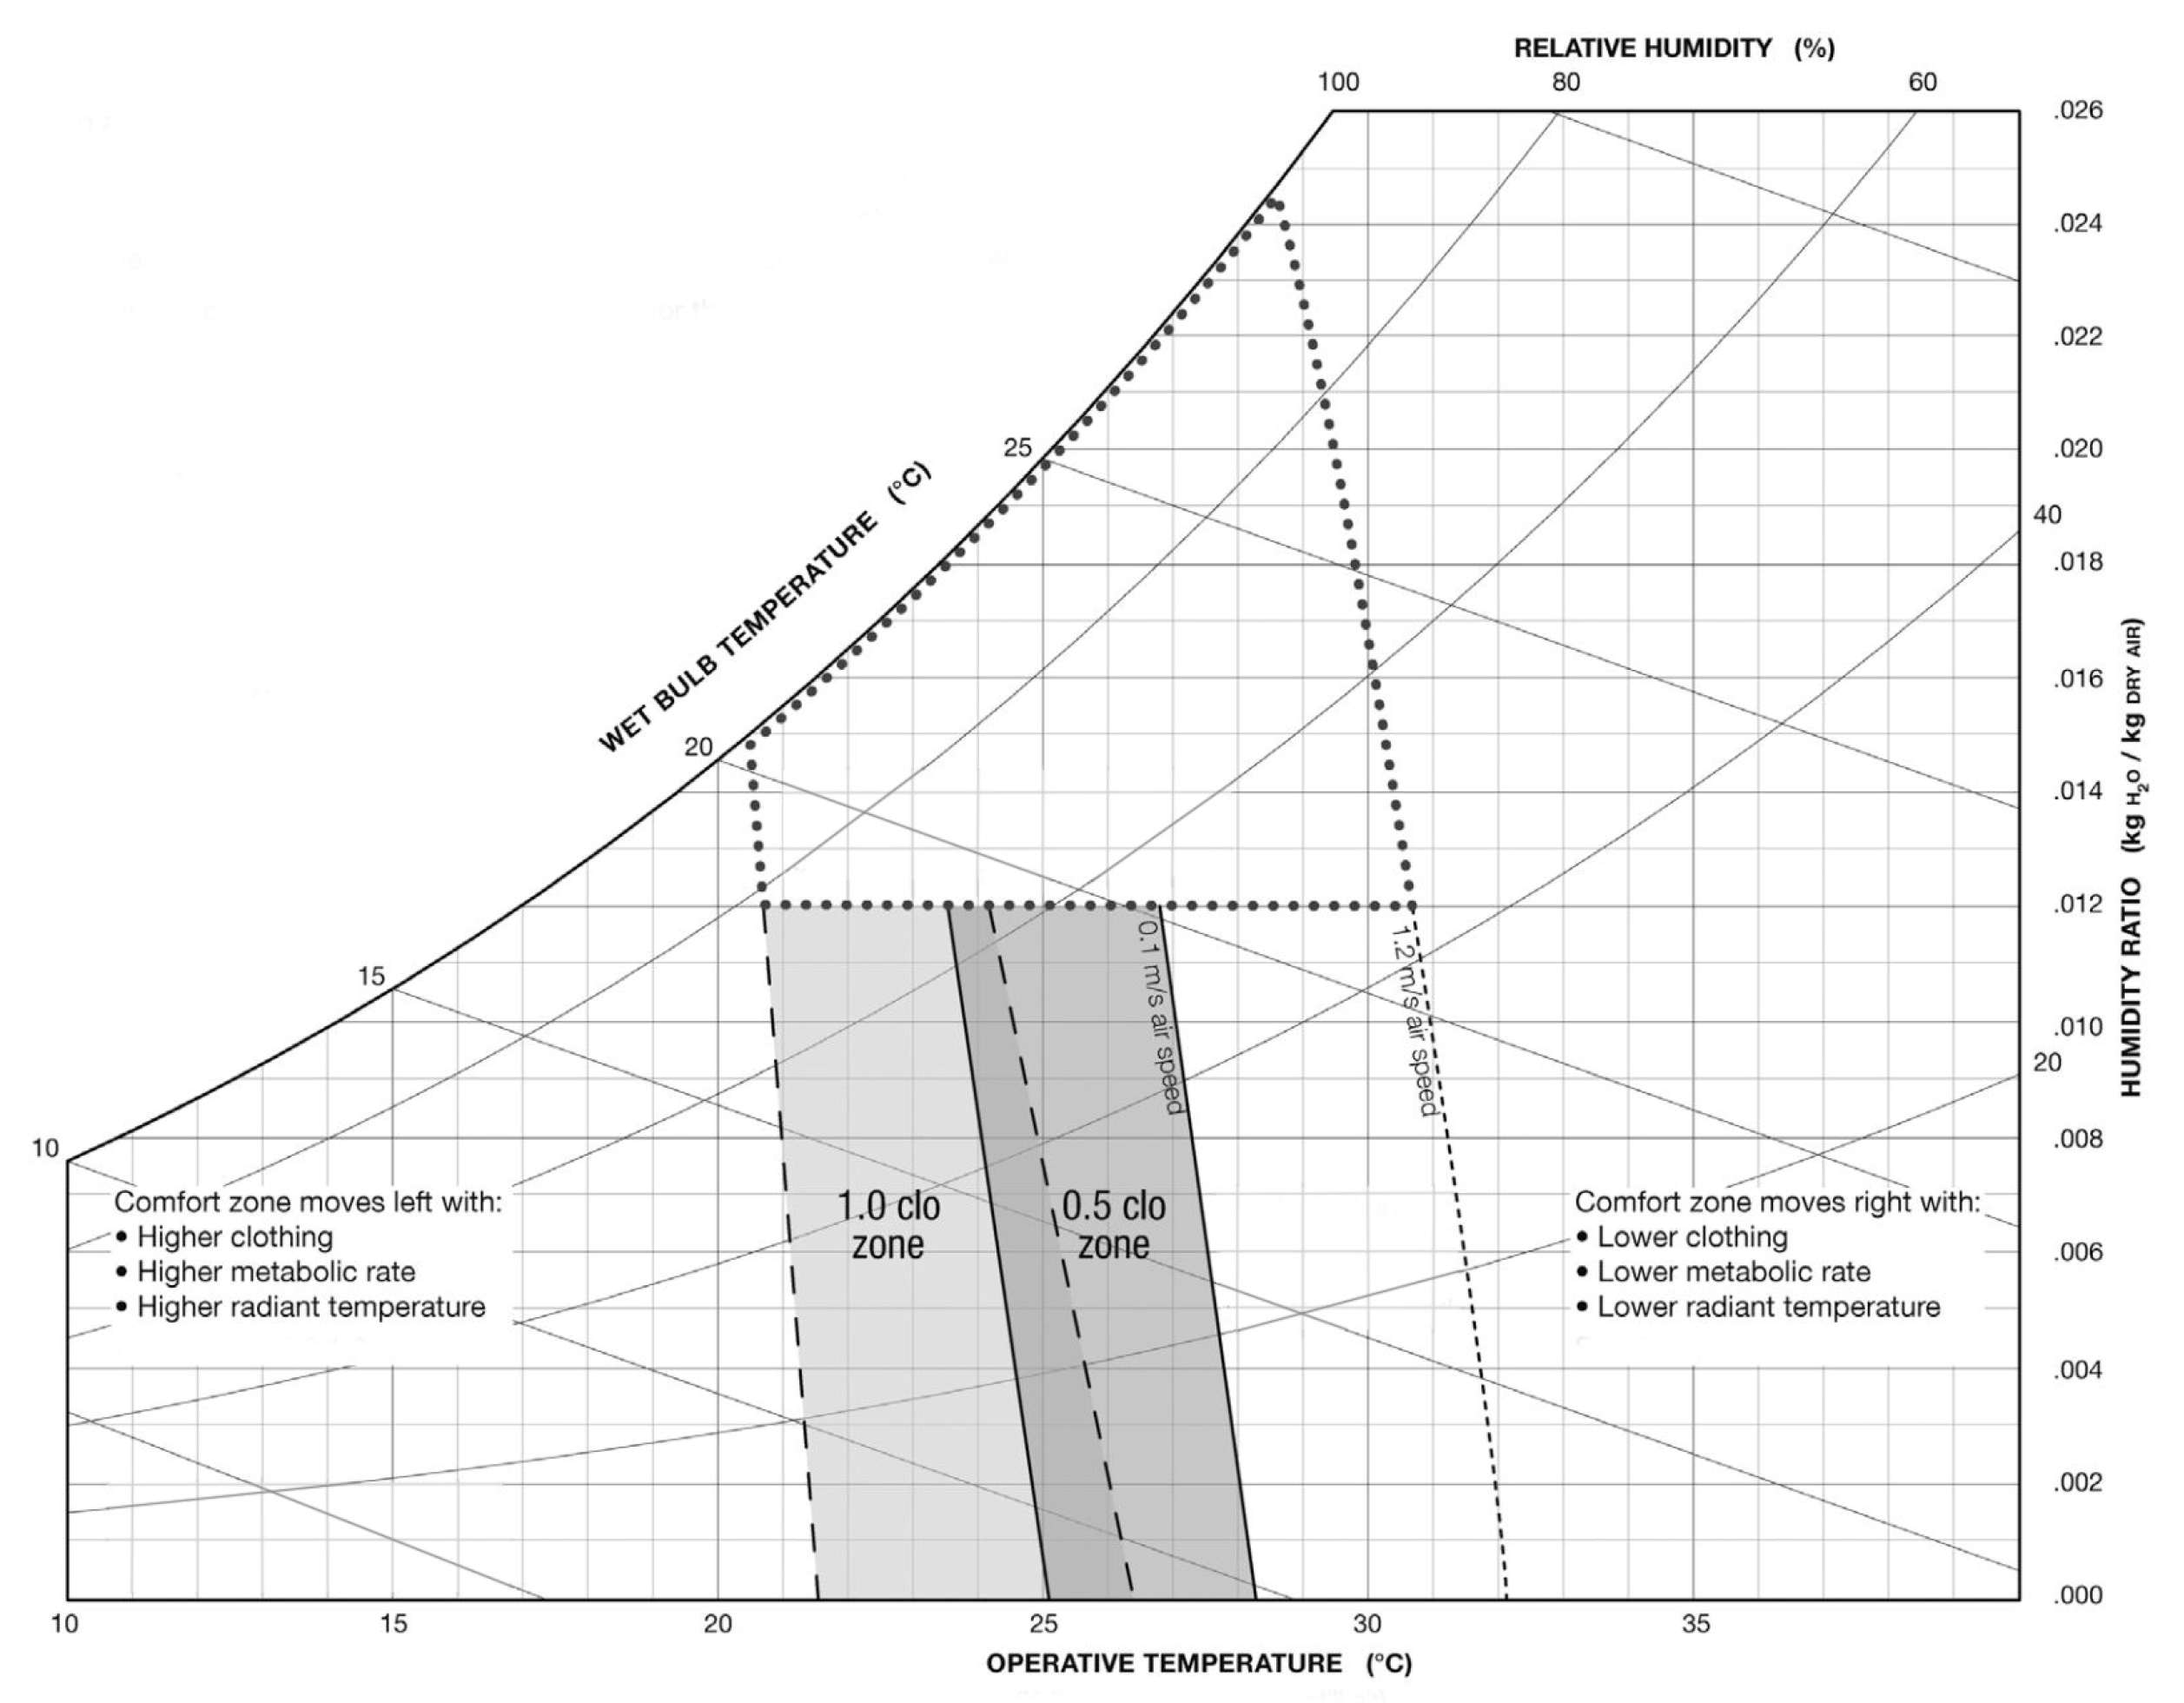
3.2. Comfort Zone
4. Results and Discussion
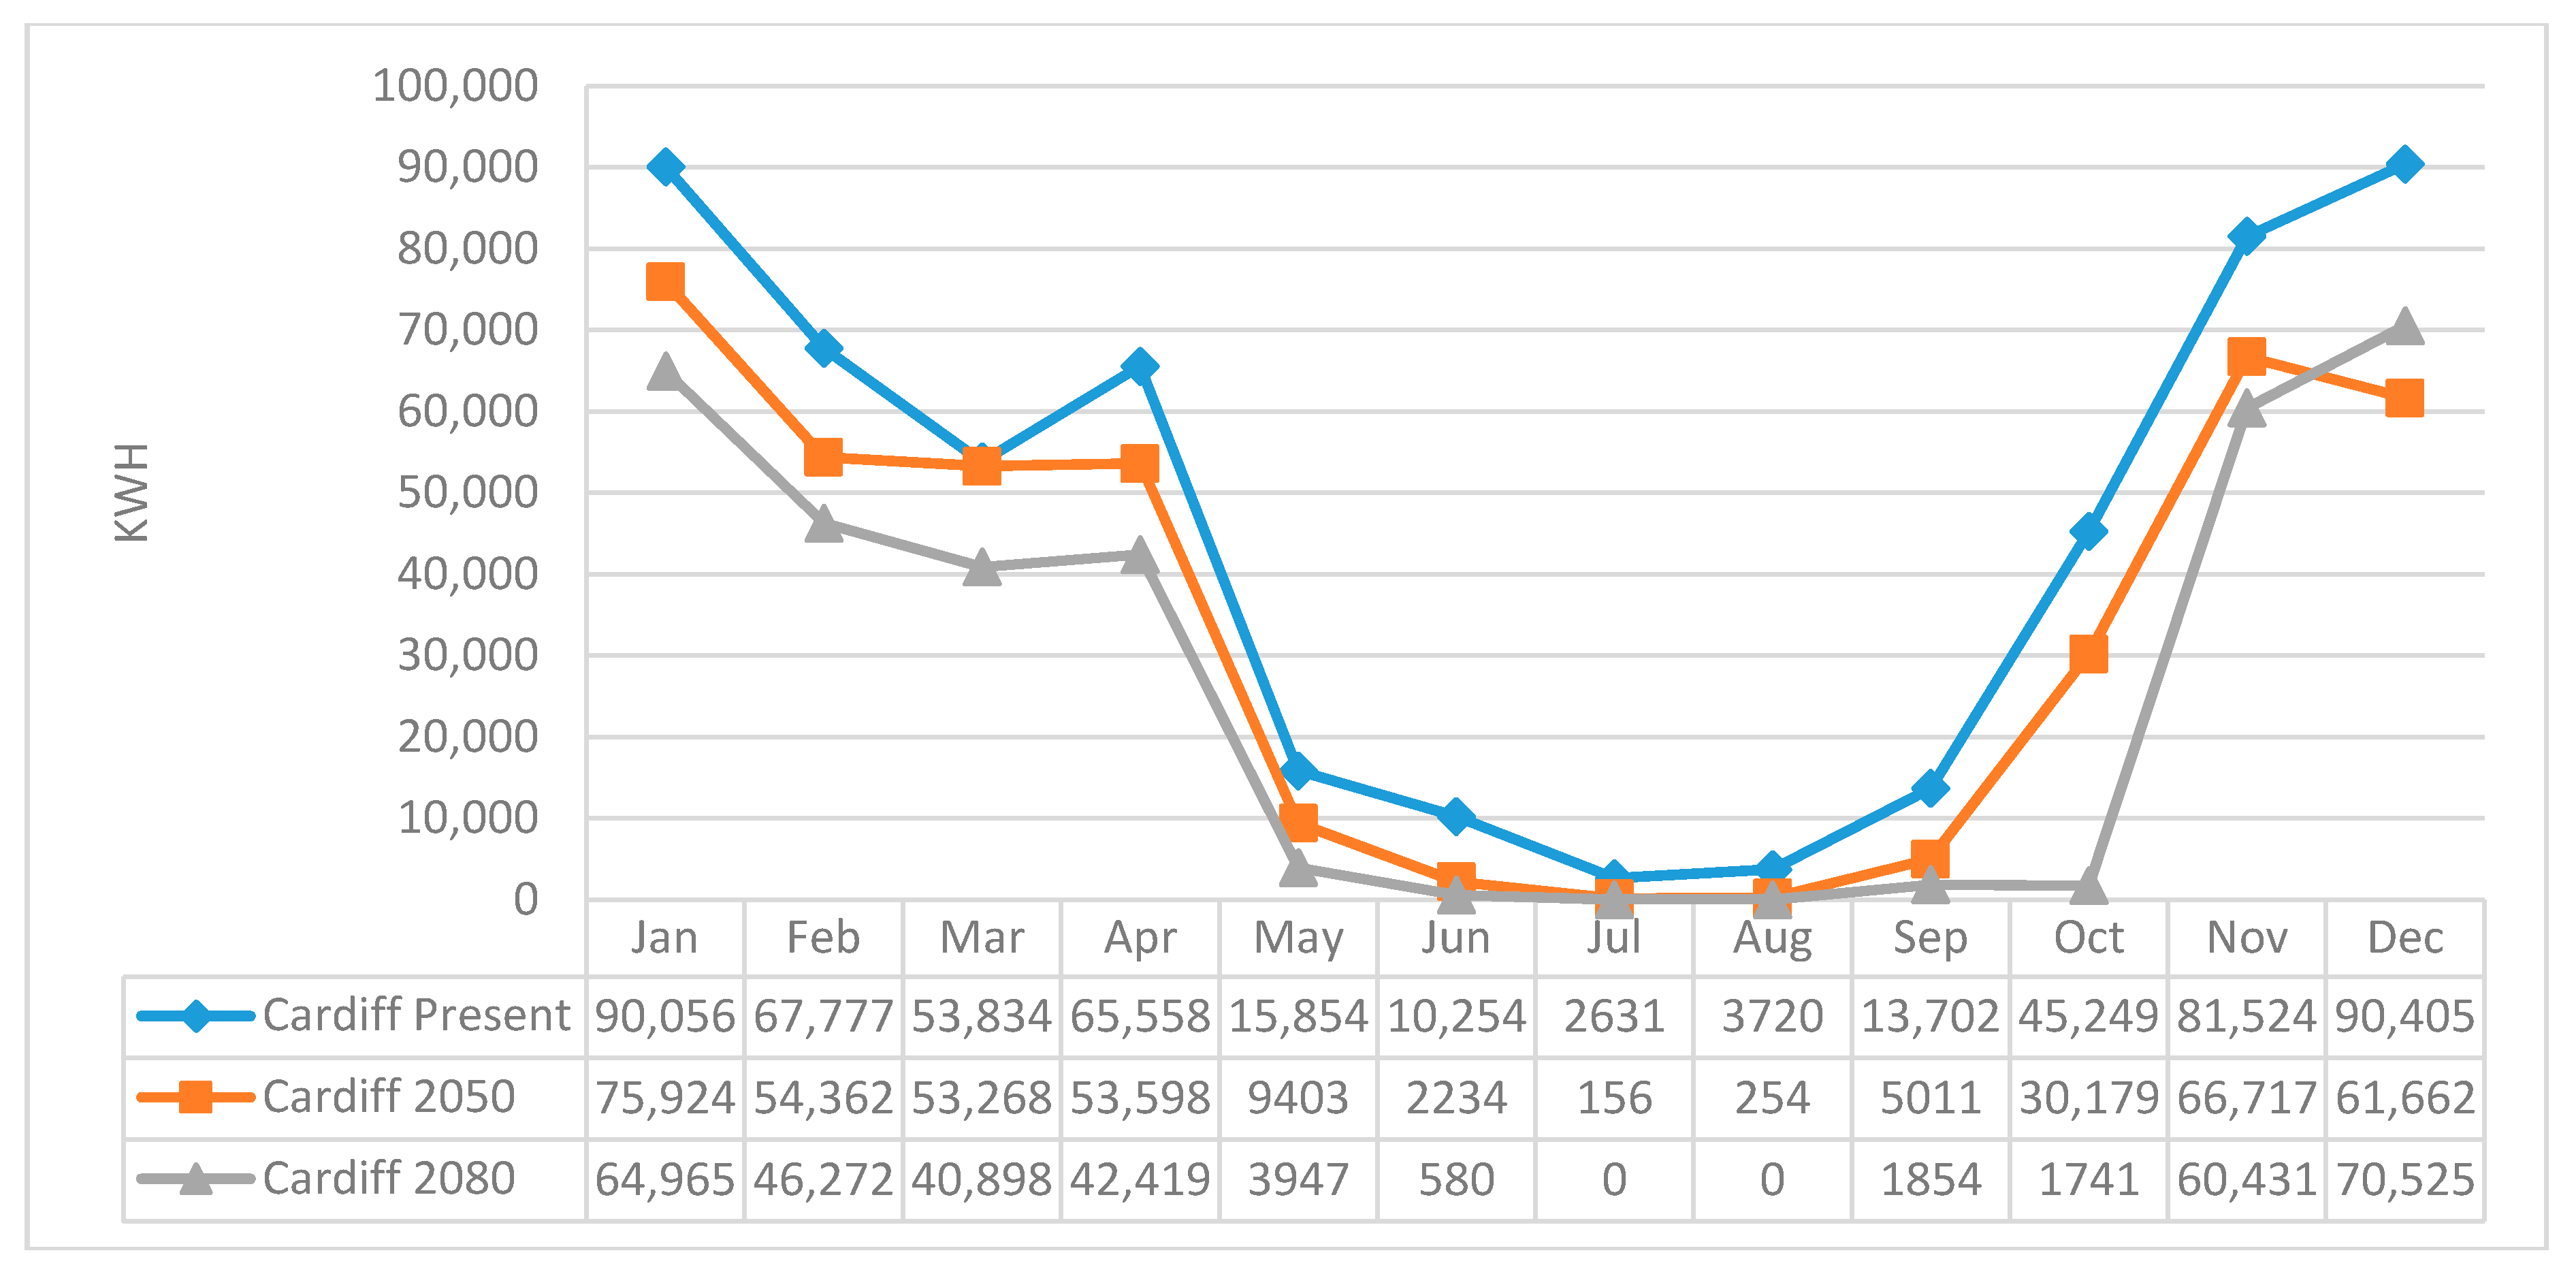
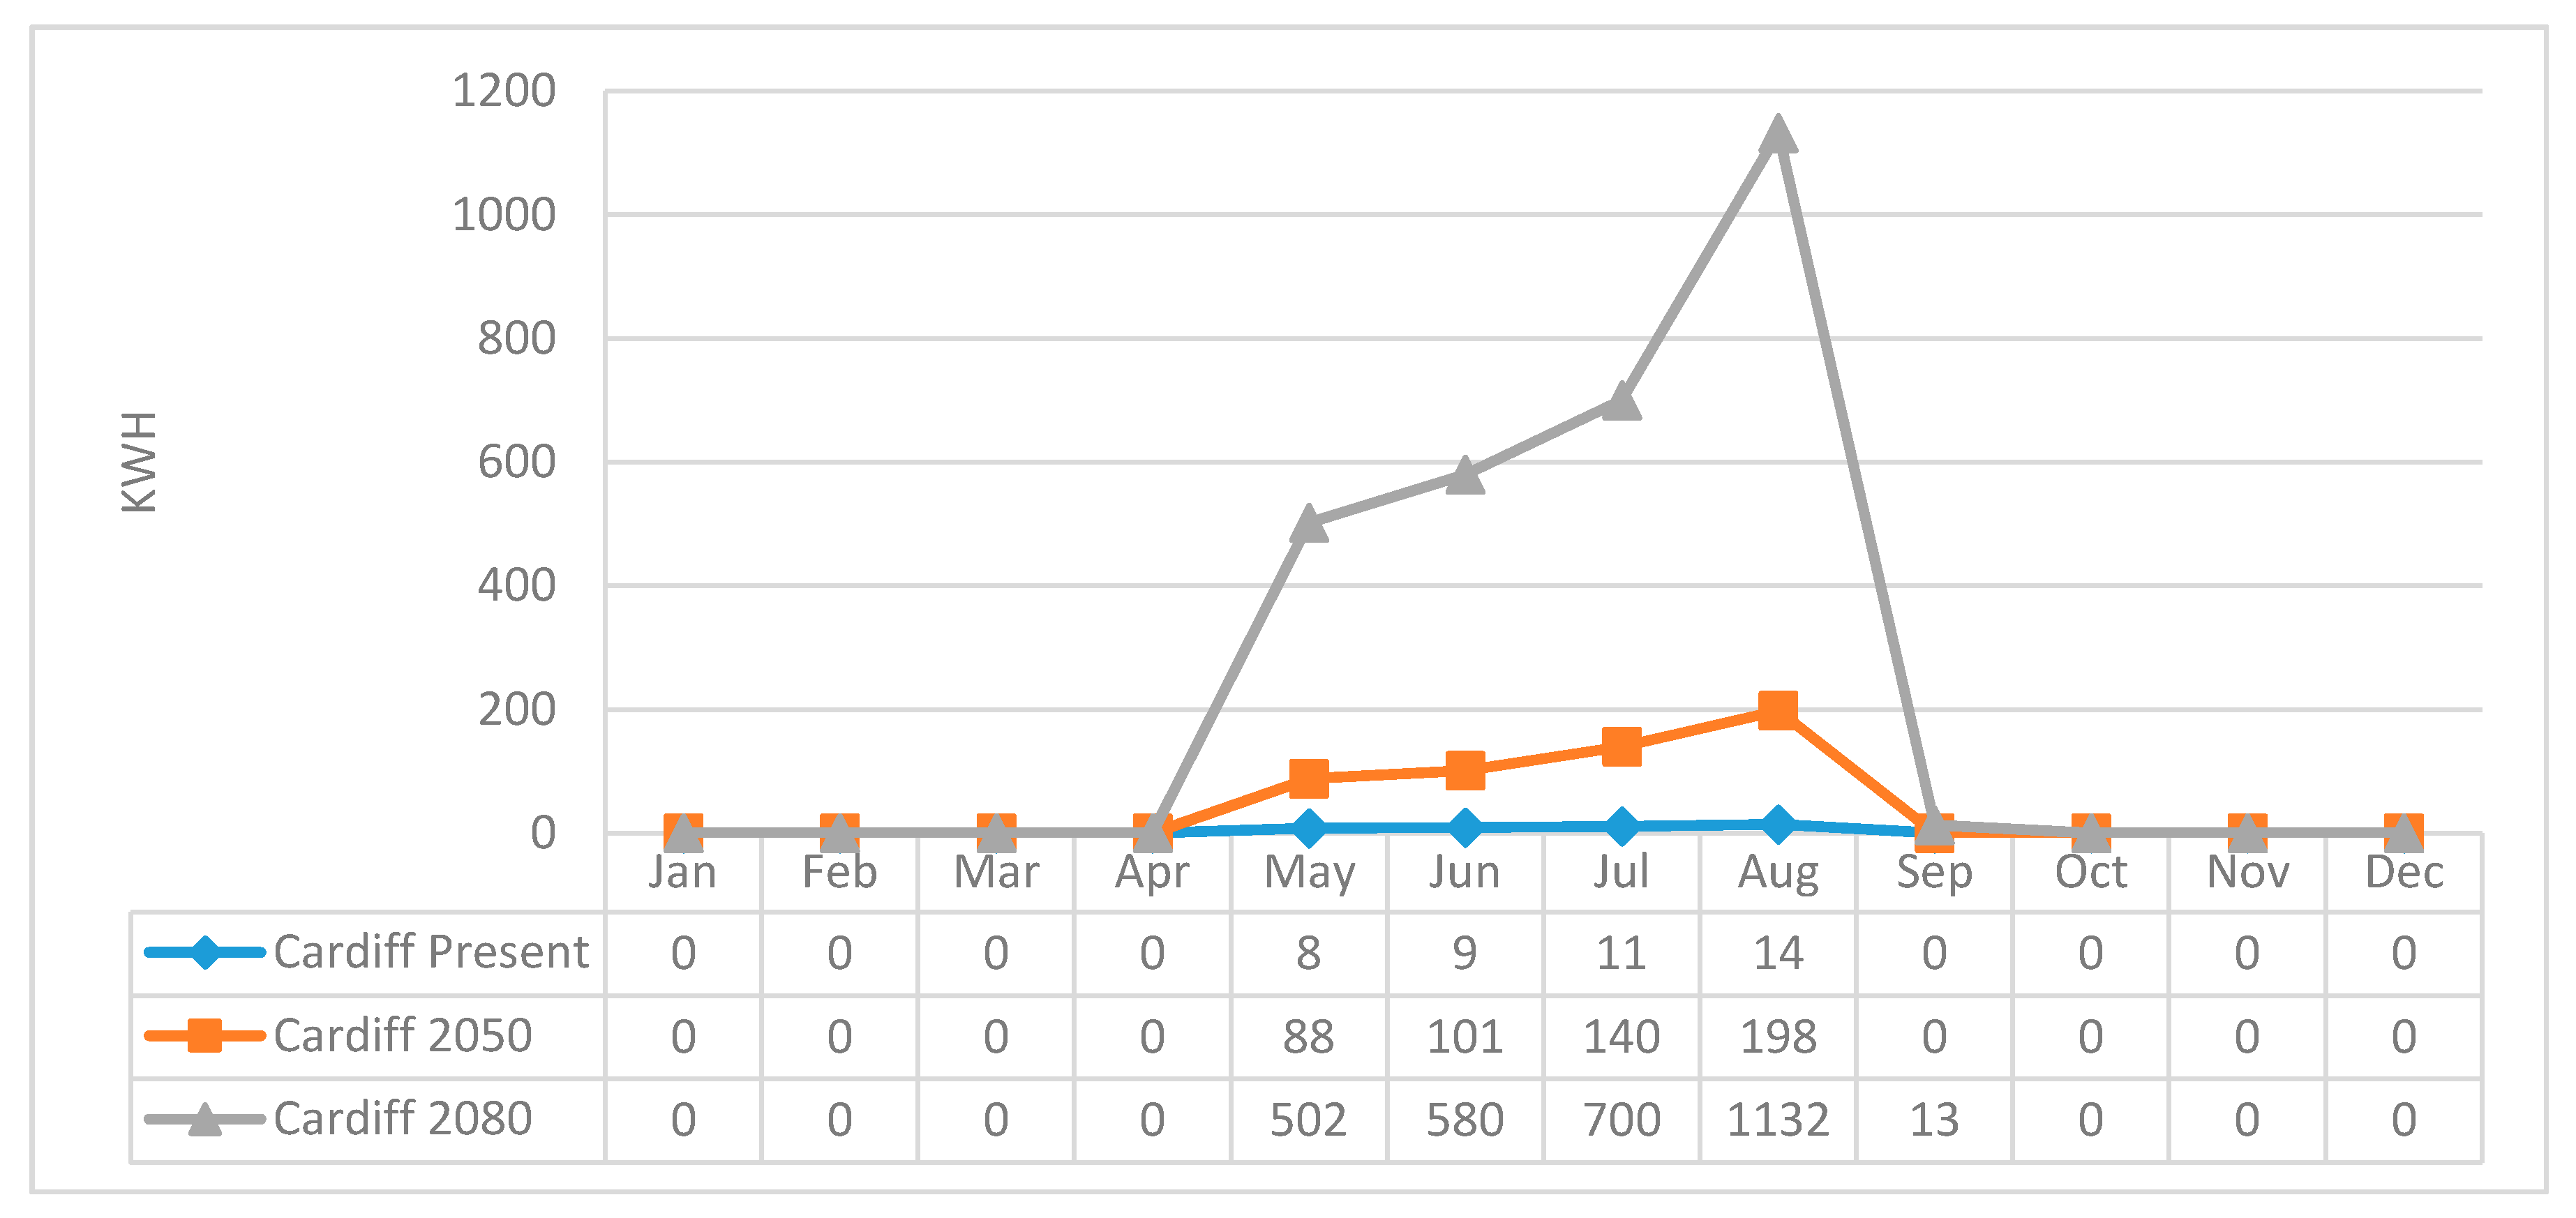
4.1. Heating and Cooling Loads
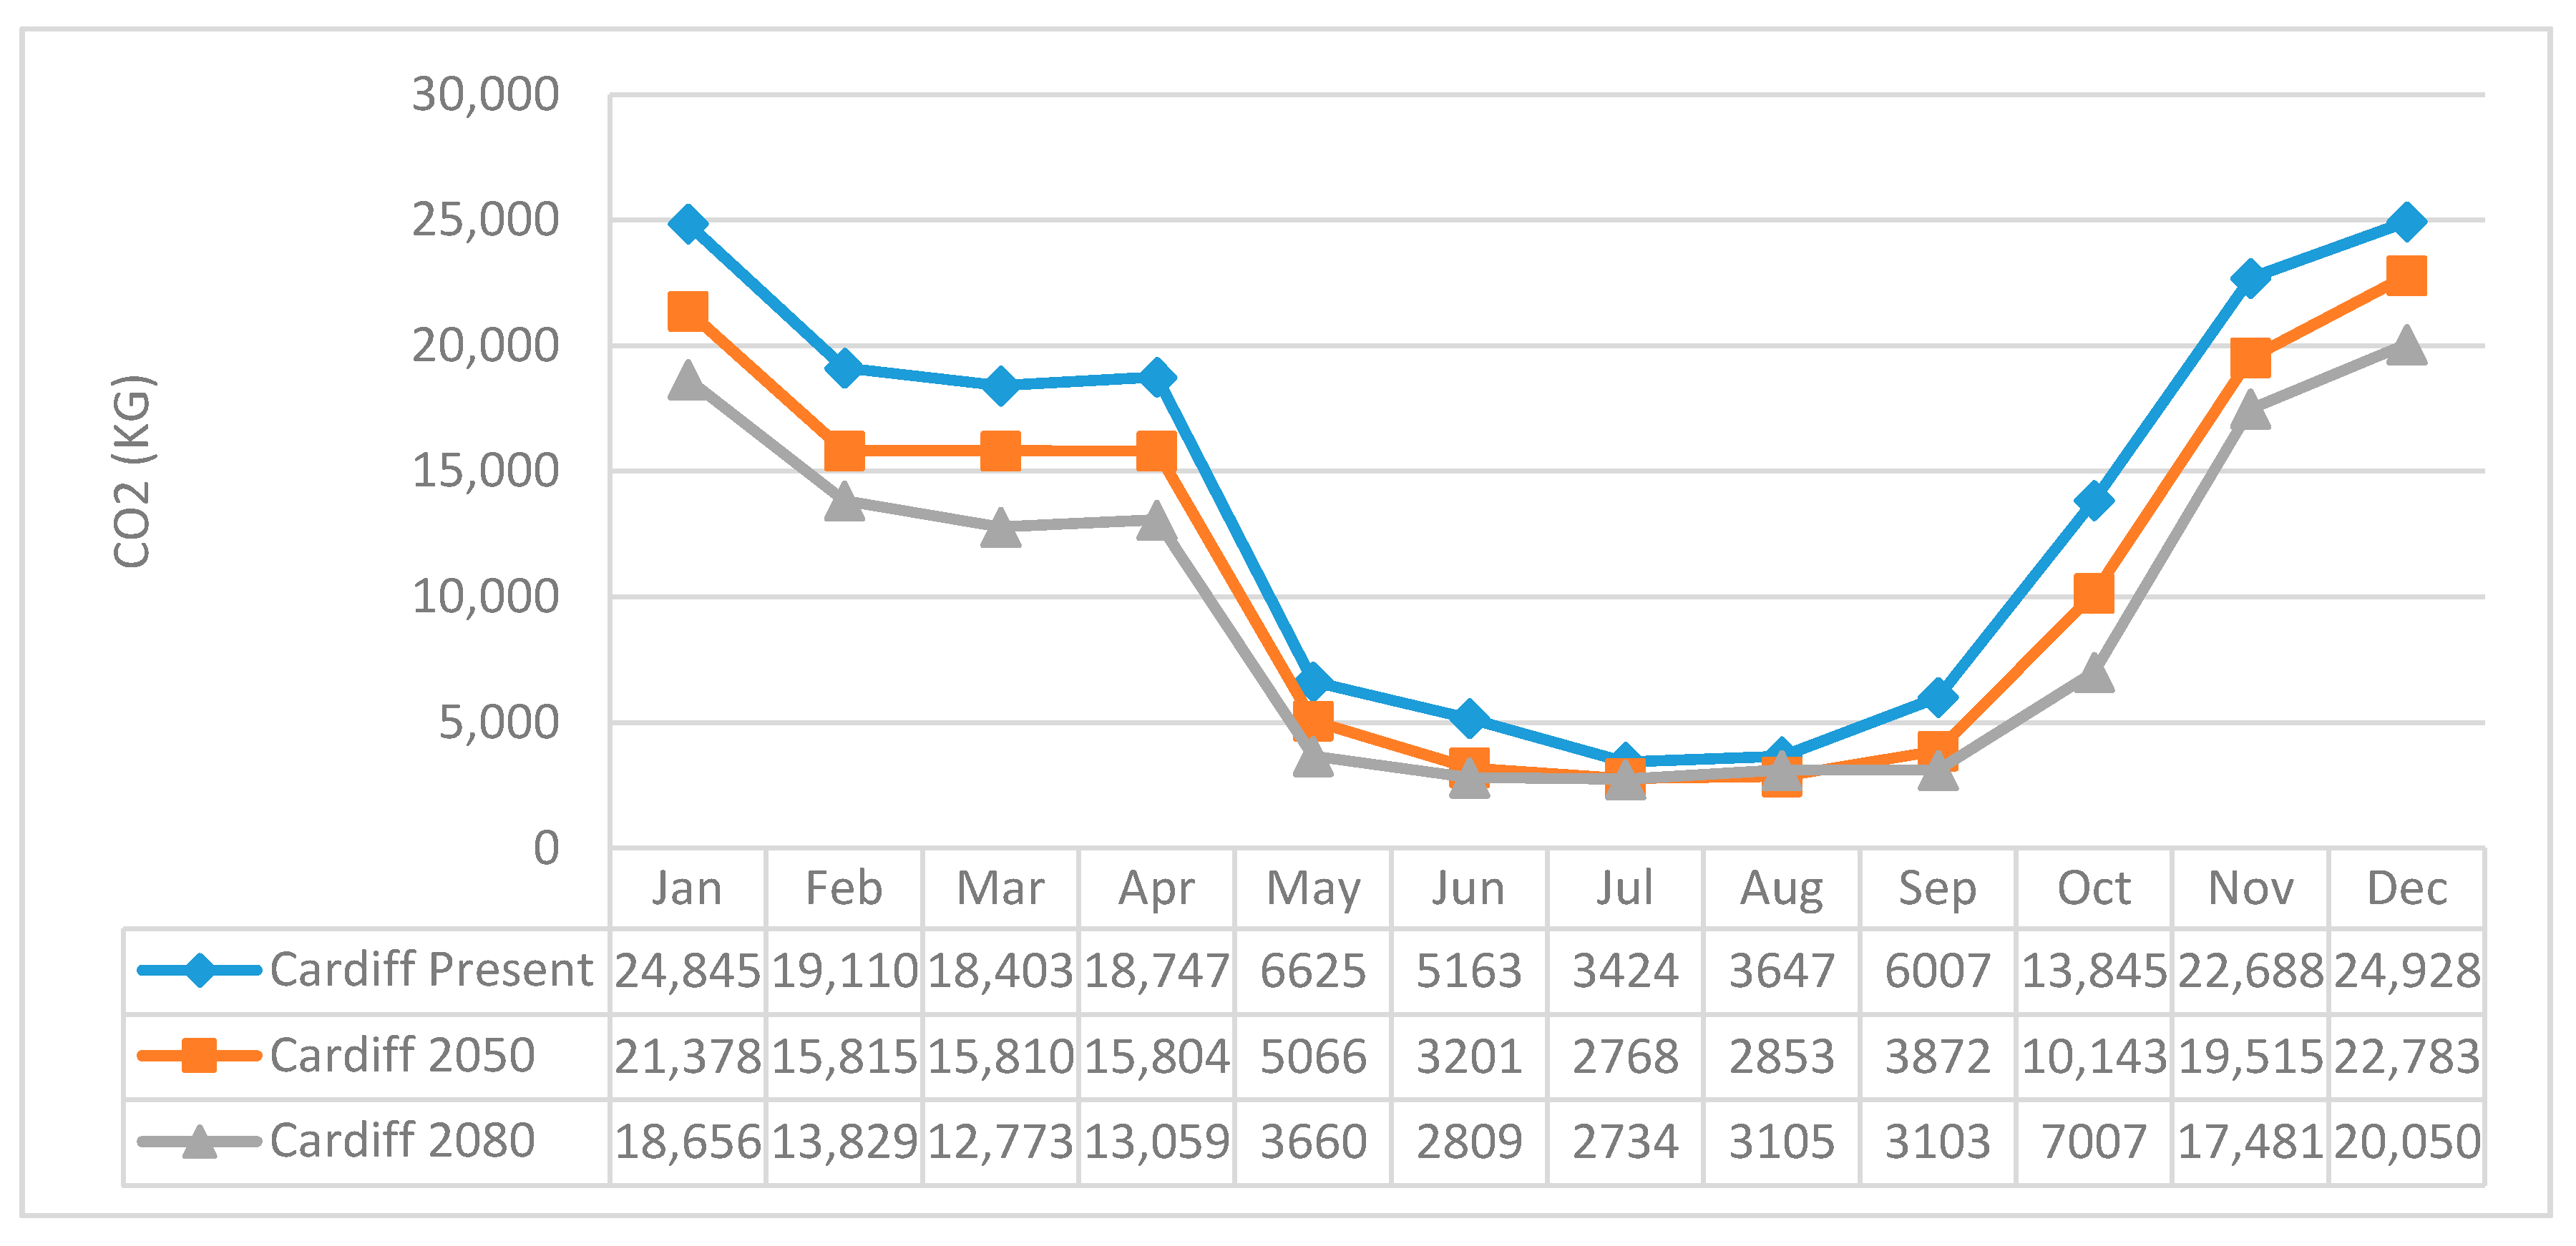
4.2. Carbon Emissions
4.3. Thermal Bridge Analysis
5. Conclusions
Acknowledgment
Conflicts of Interest
References
- Department for Communities and Local Government (DCLG). Homes for Future: More Affordable, More Sustainable; Department for Communities and Local Government: London, UK, 2007.
- HM Government. Industrial Strategy: Government and Industry in Partnership; Department for Communities and Local Government: London, UK, 2013.
- Athienitis, A.K.; Santamouris, K. Thermal Analysis and Design of Passive Solar Buildings; James & James Ltd.: London, UK, 2005. [Google Scholar]
- British Standards (BSi). Thermal Performance of Buildings-Calculation of Energy NEEDS for Space Heating and Cooling Using Dynamic Methods—General Criteria and Validation Procedures; British Standards: London, UK, 2007. [Google Scholar]
- Gething, B. Design for Future Climate: Opportunities for Adaptation in the Built Environment; Technology Strategy Board: Swindon, UK, 2010. [Google Scholar]
- Hacker, J.N.; Belcher, S.E.; Connell, R.K. Beating the Heat: Keeping UK Buildings Cool in a Warming Climate. 2005. Available online: http://www.arup.com/_assets/_download/download396.pdf (accessed on 8 March 2016).
- Sajjadian, S.M. Future Proofing UK Sustainable Homes under Conditions of Climatic Uncertainty. Ph.D. Thesis, University of Liverpool, Liverpool, UK, 2015. [Google Scholar]
- Orme, M.; Palmer, J.; Irving, S. Control of overheating in well-insulated housing. In Proceedings of the IBSE/ASHRAE Conference: Building Sustainability, Value and Profit, Edinburgh, UK, 24–26 September 2003. [Google Scholar]
- Andric, I.; Pina, A.; Ferraro, P.; Fournier, J.; Lacarriere, B.; Le Corre, O. The impact of climate change on building heat demand in different climate types. Energy Build. 2017, 149, 225–234. [Google Scholar] [CrossRef]
- Three Regions Climate Change Group. Your Home in a Changing Climate: Retrofitting Existing Homes for Climate Change Impacts; Three Regions Climate Change Group: London, UK, 2008. [Google Scholar]
- Gaterell, M.; McEvoy, M. The impact of climate change uncertainties on the performance of energy efficiency meeasures applied to dwellings. Energy Build. 2005, 37, 982–995. [Google Scholar] [CrossRef]
- Hulme, M.; Jenkins, J.; Lu, X.; Turnpenny, J.; Mitchell, T.; Jenkins, G.; Jones, R.; Lowe, J.; Murphy, J.; Hassell, D.; et al. Climate Change Scenarios for the United Kingdom; The UKCIP Scientific Report; Tyndall Centre for Climatic Change Research, School of Environmental Engineering, University of East Anglia: Norwich, UK, 2009. [Google Scholar]
- Department for Communities and Local Government (DCLG). English Housing Survey: Housing Stock Report; DCLG: London, UK, 2008.
- Department for Communities and Local Government (DCLG). 2015 UK Greenhouse Gas Emissions, Final Figures; DCLG: London, UK, 2017.
- Zero Carbon Hub. Carbon Complance for Tomorrow’s New Homes: A Review of the Modelling Tool and Assumption Topic 3: Future Climate Change; Zero Carbon Hub: London, UK, 2010. [Google Scholar]
- Collins, L.; Natarajan, S.; Levermore, G. Climate change and future energy consumption in UK housing stock. Build. Serv. Eng. Res. Technol. 2010, 31, 80–86. [Google Scholar] [CrossRef]
- Muphy, J.; Sexton, D.; Jenkins, G.; Boorman, P.; Booth, B.; Brown, K.; Clark, R.; Collins, M.; Harris, G.; Kendon, L.; et al. UK Climate Projections Science Report: Climate Change Projections. Version 3. 2010. Available online: http://ukclimateprojections.defra.gov.uk/images/stories/projections_pdfs/UKCP09_Projections_V2.pdf (accessed on 8 July 2015).
- University of Southampton, Sustainable Energy Research Group. Available online: http://www.serg.soton.ac.uk/ccweathergen/ (accessed on 8 July 2015).
- Sajjadian., S.M.; Lewis, J.; Sharples, S. Interpretation and determination of thermal comfort in climate change context. In Proceedings of the International Post Graduate Research Conference IPGRC, University of Salford, Salford, UK, 8–10 April 2013; pp. 1106–1113. [Google Scholar]
- Nicol, F.; Roaf, S. Pioneering new indoor temperature standard: The Pakistan project. Energy Build. 1996, 23, 169–174. [Google Scholar] [CrossRef]
- Humphreys, M.A. Comfortable indoor temperatures related to the outdoor air temperature. Build. Serv. Eng. 1976, 44, 5–27. [Google Scholar]
- De Dear, R.; Brager, G.S. Developing and adaptive model of thermal comfort and preference. Energy Build. 1998, 104, 145–167. [Google Scholar]
- American Society of Heating, Refrigerating and Air-conditioning Engineers organization (ASHRAE). Thermal Environment Conditions for Human Occupancy; American Society of Heating, Refrigerating and Air-conditioning Engineers organization: Atlanta, GA, USA, 2010. [Google Scholar]
- Department for Communities and Local Government. Building a Greener Future: Policy Statement; Department for Communities and Local Government: London, UK, 2007.
- Department of Energy & Climate Change (DECC). SAP 2009: The Government’s Standard Assessment Procedure for Energy Rating of Dwellings; 2009 Edition; Building Research Establishment: Watford, UK, 2010. [Google Scholar]
- HM Government. Approved Document Part L1A: Conservation of Fuel and Power in New Dwellings; 2010 Edition; Communities and Local Government: London, UK, 2010.
- European Committee for Standardization. Thermal Bridges in Building Construction—Heat Flows and Surface Temperatures—Detailed Calculations; European Committee for Standardization: Brussels, Belgium, 2007. [Google Scholar]


| Fabric | Type | Detail |
|---|---|---|
| External Wall 1 | Hybrid Steel frame construction | U-Value 0.17 |
| Sheltered Wall 1—to unheated communal areas | Twin steel stud construction | U-Value 0.18 |
| Party wall 1 | Fully filled and sealed party wall | |
| Floor 1—Ground | Solid concrete 150 mm slab | U-Value 0.17 |
| Floor 2—Over Plant room | No flats over this area | U-Value 0.18 |
| Roof | Warm flat roof construction | U-Value 0.11 |
| Windows | Based upon aluminium windows | U-Value 1.5 |
| Doors—to unheated communal areas | U-Value 1.5 | |
| Heating Systems | ||
| Main heating | Community heating based on gas boilers | 88.6% efficiency |
| Heat distribution | Pre-insulated low temperature/variable flow | |
| Emitters | Radiators | |
| Secondary heating | None | |
| PVs | Minimum of 13.6 kWp. south orientation and based upon a maximum collector tilt of 30° | <20% shading assumed |
| Other | ||
| Thermal mass | Low | |
| Lighting | 100% low energy lighting | |
| Ventilation/Mechanical Cooling | Mechanical ventilation is used/no mechanical cooling | |
| No Thermal Bridge | Thermal Bridge | Need Further Investigation |
|---|---|---|
 |  |  |
 |  |  |
© 2018 by the author. Licensee MDPI, Basel, Switzerland. This article is an open access article distributed under the terms and conditions of the Creative Commons Attribution (CC BY) license (http://creativecommons.org/licenses/by/4.0/).
Share and Cite
Sajjadian, S.M. Risk Identification in the Early Design Stage Using Thermal Simulations—A Case Study. Sustainability 2018, 10, 262. https://doi.org/10.3390/su10010262
Sajjadian SM. Risk Identification in the Early Design Stage Using Thermal Simulations—A Case Study. Sustainability. 2018; 10(1):262. https://doi.org/10.3390/su10010262
Chicago/Turabian StyleSajjadian, Seyed Masoud. 2018. "Risk Identification in the Early Design Stage Using Thermal Simulations—A Case Study" Sustainability 10, no. 1: 262. https://doi.org/10.3390/su10010262
APA StyleSajjadian, S. M. (2018). Risk Identification in the Early Design Stage Using Thermal Simulations—A Case Study. Sustainability, 10(1), 262. https://doi.org/10.3390/su10010262