Article

A System Analysis on Steppe Sustainability and Its Driving Forces—A Case Study in China

1
Shandong Province “3S” Engineering Research Center, Shandong University of Science and Technology, Qianwangang Road, Qingdao 266590, China
2
State Key Laboratory of Resources and Environmental Information System, Institute of Geographic Science and Natural Resources Research, Chinese Academy of Sciences, Datun Road, Beijing 100049, China
3
Key Laboratory of Environmental Change and Natural Disaster, Ministry of Education, Beijing Normal University, Beijing 100875, China
4
Faculty of Geographical Science, Beijing Normal University, Beijing 100875, China
5
School of Geographical Sciences and Planning, Guangxi Teachers Education University, Nanning 530001, China
6
Education Ministry Key Laboratory of Environment Evolution and Resources Utilization in Beibu Bay, Guangxi Teachers Education University, Nanning 530001, China
*
Authors to whom correspondence should be addressed.
Sustainability 2018, 10(1), 233; https://doi.org/10.3390/su10010233
Submission received: 29 November 2017 / Revised: 2 January 2018 / Accepted: 15 January 2018 / Published: 18 January 2018
(This article belongs to the Special Issue Degradation and Sustainable Management of Land)

Abstract

:
Steppe is an indispensable component for terrestrial ecosystems and it is of great significance to systematically analyze steppe sustainability and its driving forces. In this study, we propose a steppe dynamics ranking method based on Pauta criterion and a steppe sustainability assessment method with an effect matrix. The natural driving forces on steppe sustainability were systematically analyzed using the copula model, and the anthropogenic driving factors, including land use, were analyzed by using spatial overlay and statistical analysis methods. The results showed the following: (1) in general, steppe sustainability showed a trend of improvement from 2001 to 2010 in China. However, there were still some degraded areas scattered within the study area; (2) the consistent effect of steppe dynamics on steppe sustainability was significant on the whole, although there was a diverse effect on it; (3) among the natural factors, precipitation was the strongest positive driving force, followed by temperature average, while sunshine duration had strong negative driving force. The impact caused by land use factors was controlled during that decade, and the steppe land that evolved from urban and built-up land, cropland, and forest was vulnerable and resulted in steppe sustainability degradation.

1. Introduction

The natural steppe accounts for nearly 40% of terrestrial area in the world [1,2,3], offers ecological service functions [4], and plays an important role in ecosystem balance and sustainability [5,6,7,8,9]. However, population growth and economic development during the past few decades [10,11,12], rapid urbanization [13,14,15], excessive deforestation [16,17], massive land reclamation [6,9] and overgrazing [3,7] have made substantial changes to steppe landscapes and ecosystem functioning. These human disturbances, coupled with poor natural conditions, have left to approximately 49.25% of steppe land worldwide suffering from degradation, with nearly 5% of these steppes suffering from serious degradation [18]. As a result, the sustained development of desertification in some areas has led to serious environmental and ecological health problems [8,19,20,21,22,23,24]. Therefore, it undoubtedly is of great significance to systematically assess the dynamics of steppe sustainability and reveal the natural and anthropogenic driving forces for promoting the sustainable development of the global steppe.
Central and Inner Asia is a major dust source and transport region with the potential for significant impact on human populations, and one reason for the worsening desertification in this area is steppe degradation caused by natural or anthropogenic factors [18,19]. China has 8% of the world’s steppe area and is an indispensable component of the Eurasian steppe [7,19,25]. Extending from northeast to southwest China, the steppe forms a natural ecological barrier [7,26], cultivates important husbandry bases [22,24,27], constitutes a massive gene pool of flora and fauna [28], and is the original location of “one belt and one road” initiative [29]. However, because the steppe is mainly located in arid, semiarid, or desertified regions in China, it is very fragile and vulnerable to the impact of natural and anthropogenic factors [7,19,20,21,25,30, Obviously, steppe degradation in China will have a serious impact on dust sources and transportation in the Asian inland region [7,19,25]. On the other hand, if the steppe in China improves continuously, it will help reduce dust in the Asian inland and be beneficial to the health of the population [19,25]. Therefore, the scientific significance of the research on Chinese steppe sustainability and its driving forces is not only limited to China, but also extends also to the ecological health of Asia and the world.
Previous studies have focused on steppe monitoring by field sampling and remote sensing [31,32,33,34,35], while research on monitoring and assessing steppe sustainability systemically and effectively is rare and hence remains imperative. The traditional methods of field sampling monitoring have gradually become auxiliary due to their great cost, their long duration, and their small range [36]. Meanwhile, remote sensing has become the most widely used method for steppe dynamics monitoring due to the advantages of wide range, short time cycle, and low cost [7,35,37,38,39,40]. In recent research, NDVI has been the most commonly used indicator for monitoring steppe dynamics [17,41,42,43,44,45,46,47,48,49], and NPP was the most commonly used indicator for monitoring dynamics of steppe sustainability [33,50,51,52,53,54,55]. Although NDVI and NPP are applied as steppe monitoring indicators at different spatial scales, there are still some problems to be solved. The system analysis method with NDVI and NPP remains to be studied with respect to the effect of steppe dynamics on steppe sustainability [56]. The dynamics of steppes and steppe sustainability were subjectively ranked in previous studies [23,48,57,58], but there is no ranking standard or standardized method for assessing the dynamics.
The dynamics of a steppe constitute a complicated ecological process that is influenced by natural factors and anthropogenic factors and accurate analysis of driving forces on dynamics of steppe sustainability remains difficult [9,31,40,59]. The most popular method for driving factor analysis is to distinguish between natural factors and anthropogenic factors in steppe sustainability changes, by calculating the difference between actual and potential NPP. However, this method is crude, and erroneous conclusions can be made in some scenarios [18,40,60,61,62,63,64]. Linear regression and linear correlation analysis are another of the most commonly used methods for assessing the contributions of natural factors and pasture density to steppe degradation [48,54,63,65,66]. However, steppe sustainability degradation is very complicated [18,55], and its relationships with these factors are usually nonlinear, so the appropriate result is often distorted when linear modeling is utilized in analysis. Therefore, the possibility of using nonlinear models to analyze the driving forces should be explored.
Based on the above, the main goal of this study is to propose a system of analysis methods for assessing the steppe sustainability and its driving forces and to provide decision support for sustainable steppe development. In the following sections, the dynamics of steppe sustainability will be assessed by taking Chinese steppe from 2001–2010 as a study case. Then, the driving forces of steppe sustainability will be analyzed in terms of both natural factors and anthropogenic factors. Finally, the method and the research findings will be discussed in detail.

2. Materials and Methods
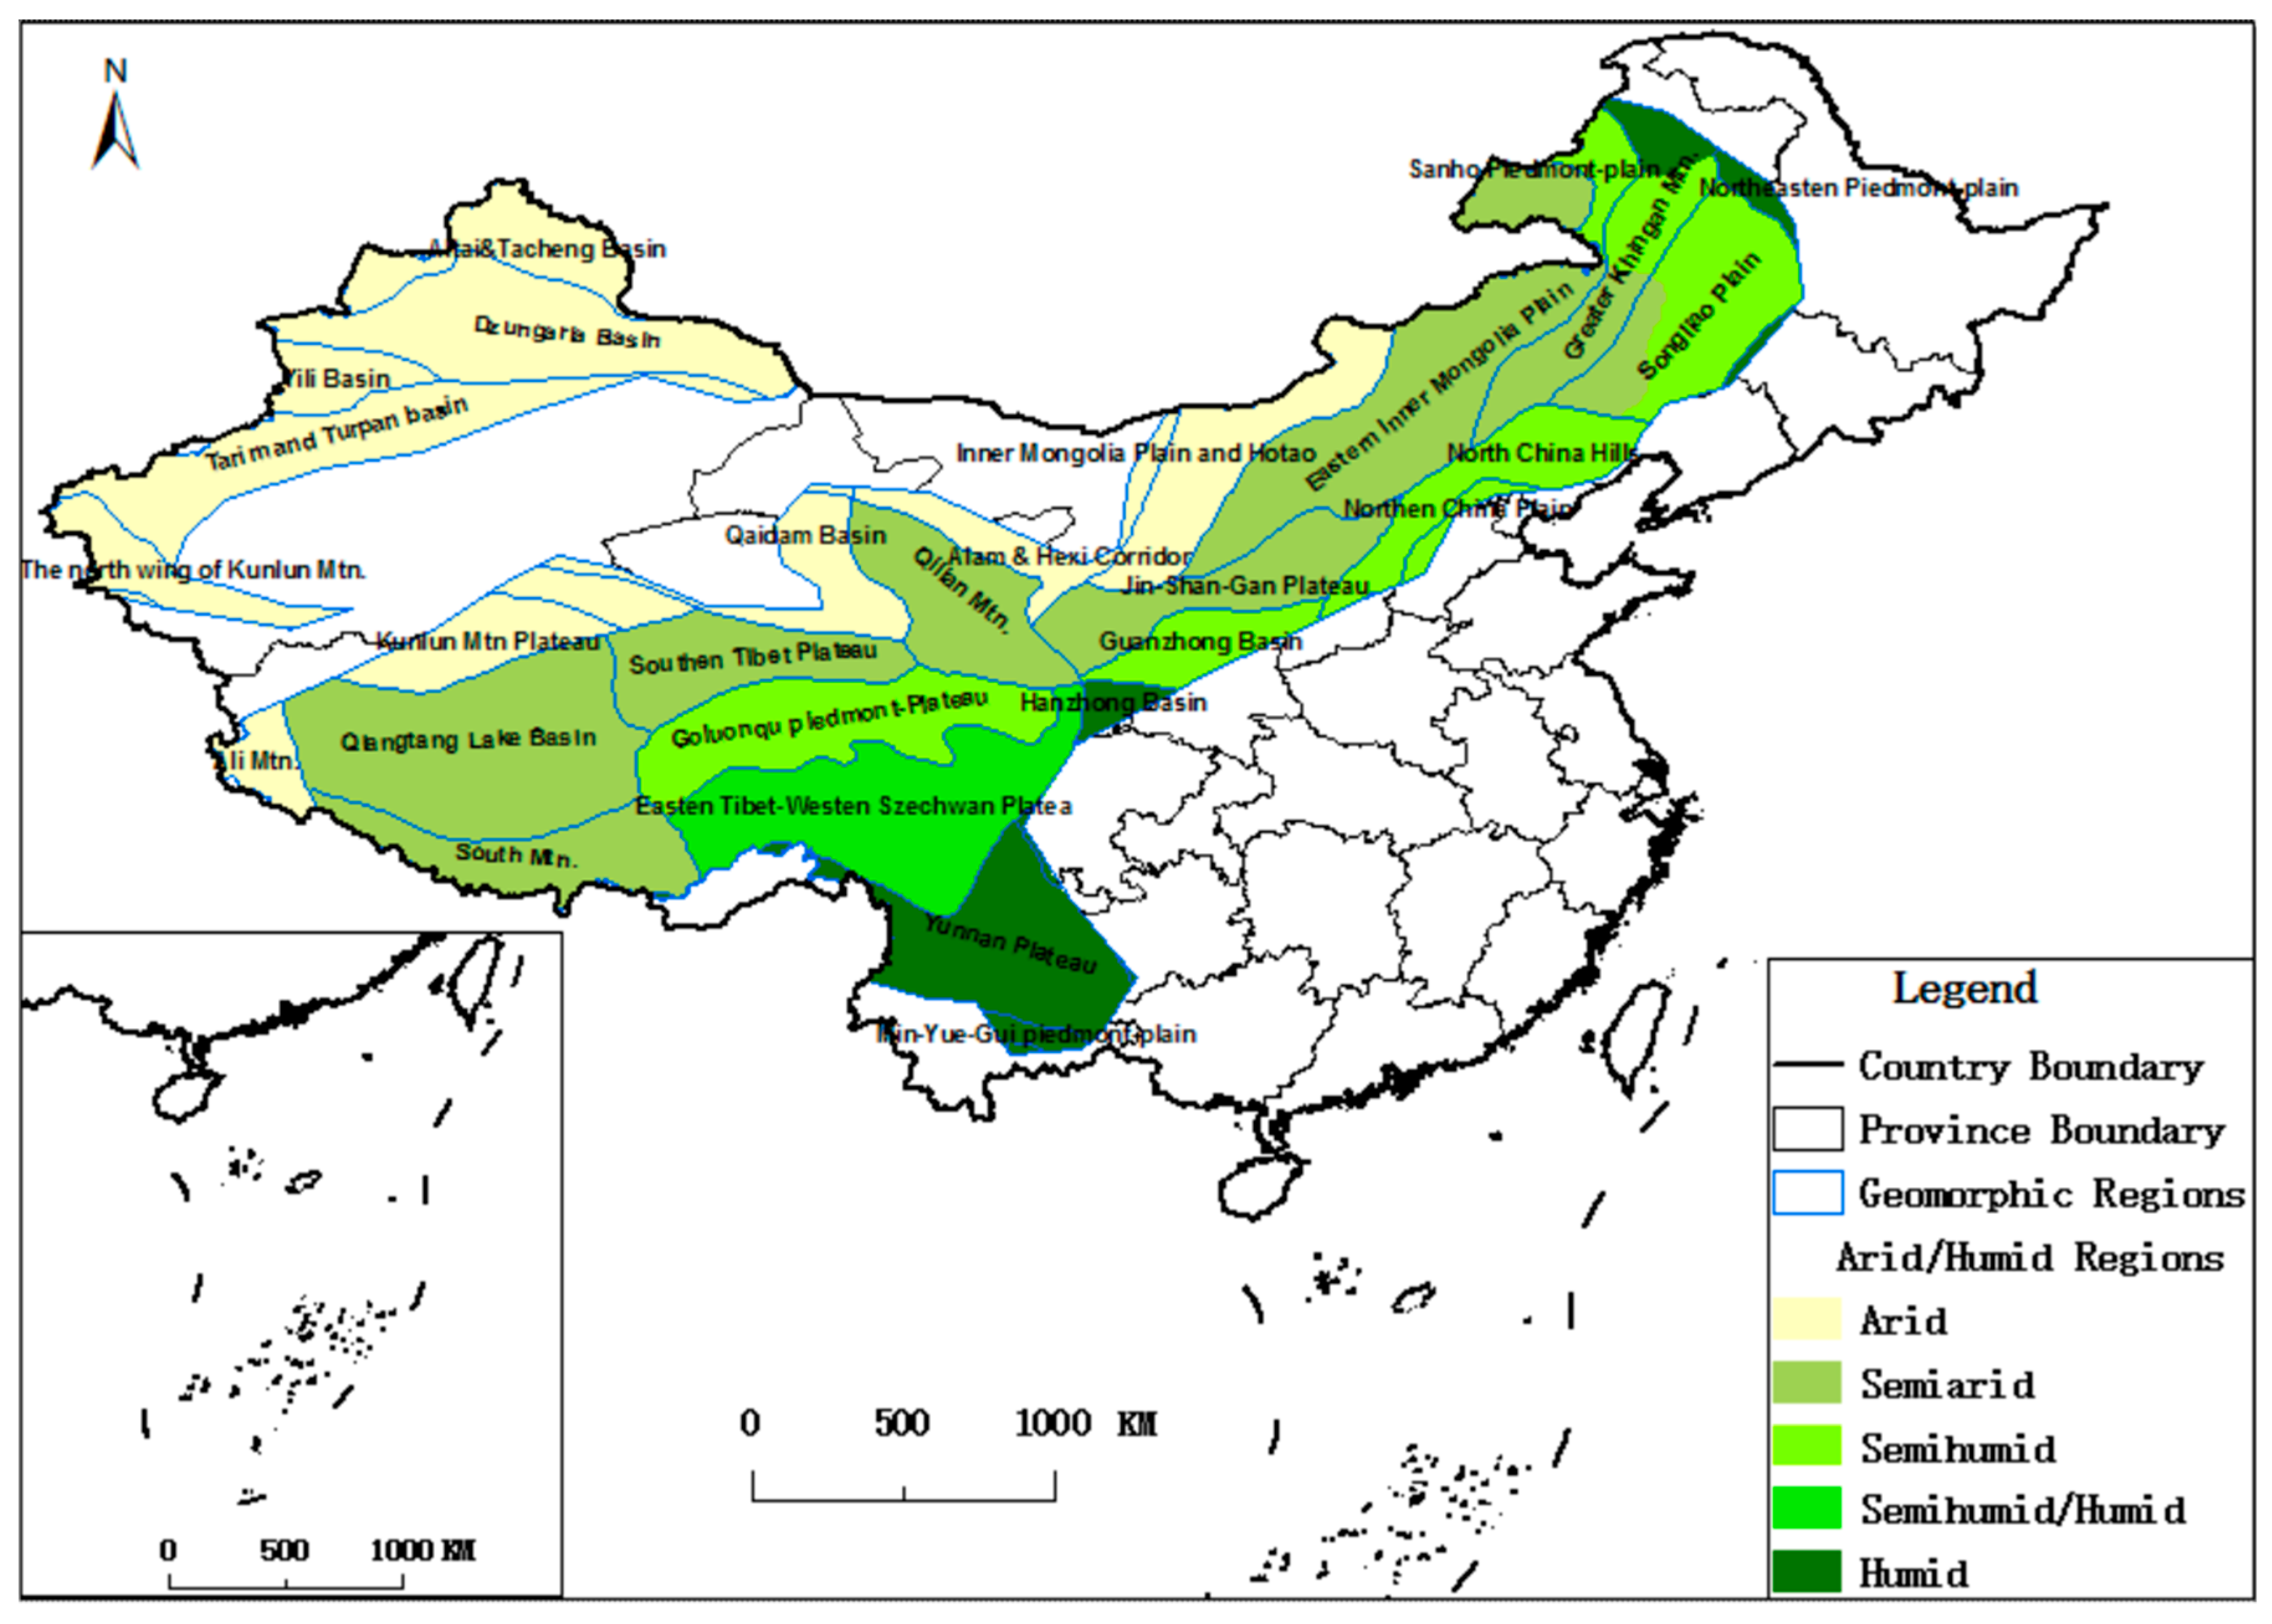
2.1. Study Area

The steppes in the north and west of China account for 85% of the total steppe resources in China and have obvious regional characteristics [67]. Because of this, we chose the steppe land in China as the study area in this paper (Figure 1). In these steppe areas, the main types of arid/humid regions include arid, semi-arid, semi-humid, semi-humid/humid and humid. The area of the study area totals 188,515 km2, and the site’s spatial extents are 3.86°N–53.55°N and 73.66°E–135.05°E, crossing 20 provinces in northern and western China (Figure 1). The main land use types include steppe, wetland, woodland, waters, town and county, industrial and mineral, residential land, and farmland. The steppe in the research site contains six husbandry bases in China [24], and the livestock carrying capacity and ecological balance are significantly impacted by natural factors such as precipitation and air temperature, as well as human-caused factors including land use and overgrazing. The Chinese government started to carry out projects and programs in 2000 to protect the steppe ecosystem and realize the goal of reasonable utilization and sustainability for steppe resources [68]. However, few comprehensive studies were conducted to determine the pattern of steppe dynamics, its effects on steppe sustainability, and its driving factors at a regional scale within the study area in the 21st century [32,61,69].

2.2. Data Source and Processing

MODIS land-cover data from 2001 to 2010 were derived from the USGS website https://lpdaac.usgs.gov. The spatial resolution of the data was 1 km × 1 km, and the data format was HDF. The MODIS tiles were mosaicked and projected to WGS84 with MODIS Reprojection Tools (MRT). The classifications of land-cover in the data were combined into 7 classes: water area, forest, steppe, farmland, urban and built-up land, bare land, and others. The steppe regional data was acquired with land-cover data for that decade, and the desert regions without steppe land in northwestern China were removed from the data (Figure 1).
NDVI and NPP data was the MODIS annual average productions derived from the NASA website http://modis.gsfc.nasa.gov. The spatial resolution of the data was 1 km × 1 km, and the data format was HDF. The MODIS tiles were mosaicked and projected to WGS84 with MRT. We applied the steppe regional data as a mask to execute mask extraction for NDVI and NPP data so that the two types of data would have an identical spatial extent.
The meteorological data was derived from the China Meteorological Data Service Center (CMDC) website http://data.cma.cn. For this study, we downloaded the air temperature (0.1 °C), precipitation (0.1 mm), and sunshine duration (1 h) data, obtained from 758 meteorological stations between January 2001 and December 2010, and we calculated the annual average value of the meteorological data. Then, we applied the ordinary Kriging method to construct a spatial interpolation for the climate data. To select semi-variant models for ordinary Kriging, we conducted cross-validation experiments and found that a spherical model was suitable for temperature data and the Gaussian model was suitable for sunshine duration and precipitation data. Finally, we applied the steppe regional data as a mask to execute mask extraction for the interpolated meteorological data to give the data an identical spatial extent.
The basic geographic data—including China’s national and provincial boundaries, geomorphic data, and aridity/humidity distribution data—was provided in shapefile format by the Data Center for Resources and Environmental Sciences, Chinese Academy of Sciences (RESDC) website http://www.resdc.cn).

2.3. Assessing Methods on Dynamics of Steppe Sustainability

Steppe dynamics directly affect steppe sustainability, and the dynamics of steppe sustainability can be well understood by looking at steppe dynamics and their effect. The most popular methods used recently are to monitor Steppe dynamics with NDVI [17,41,42,43,44,45,46,47,48,49] and to monitor dynamics of ecosystem productivity with NPP [33,50,51,52,53,54,55]. In addition, the most important indicator of steppe sustainability is ecosystem productivity; therefore, steppe dynamics has been monitored with NDVI, and the dynamics of steppe sustainability were assessed with NPP in this study. Then, the effects of steppe dynamics on steppe sustainability were assessed using an effect matrix that we proposed.

2.3.1. Monitoring Method on Steppe Sustainability Dynamics

Standard deviation is a very important parameter for exploratory data analysis [70] and it has been used successfully to predict the requirement of reserve for wind power [71], appreciate the reliability of measures in sports medicine and science [72], assess agreement between methods of clinical measurement [73], estimate noise levels of image, and so on. According to the Pauta criterion, the standard deviation (namely mean square error in error analysis) multiplied by 1, 2, and 3 can reflect the fluctuation of NDVI or NPP difference data with different degrees or confidence [74,75,76], where positive fluctuation denotes an improved case and negative fluctuation denotes a degraded case. As a result, the standard deviation can be used as the indicator when evaluating the steppe dynamics.
Firstly, the difference values (NDVI-DV, where DV means difference values) between the NDVI data in adjacent two years were calculated at the pixel level, and the dynamics of the steppe between the adjacent two years were inferred with the NDVI-DV. The NDVI-DV obeys an approximately normal distribution, so the steppe dynamics were ranked into five grades (significantly degraded, slightly degraded, balanced, slightly improved, and significantly improved) based on Pauta criterion. The threshold values, respectively, are −3σ, −σ, σ, and 3σ (σ is the standard deviation of NDVI-DV).
Similarly, the difference values (NPP-DV, where DV means difference values) between the NPP data in two adjacent years were calculated and the dynamics of steppe sustainability were ranked into five grades based on Pauta criterion.

2.3.2. Effect on Steppe Sustainability Analysis Base on Effect Matrix

Steppe dynamics have a certain effect on steppe sustainability, and the response of steppe sustainability to this effect can be measured with the spatial correlation between NDVI dynamics and NPP dynamics [77,78]. In this study, we proposed a method for evaluating the effect of steppe dynamics on the dynamics of steppe sustainability based on the effect matrix. The effect matrix, defined as EMat S T , S S , is comprised of effect estimations for each combination of steppe dynamics grade and steppe sustainability grade, and the calculation equation was defined as Equation (1).
EMat S T , S S = [ E S T 1 , S S 1 E S T 1 , S S n E S T m , S S 1 E S T m , S S n ]
E S T i , S S j = A S T i , S S j / A S S j
In Equation (1), E S T i , S S j refers to the effect of the grade i zones, in terms of steppe dynamics, on the grade j zones, in terms of the dynamics of steppe sustainability ( i = 1 , , m ; j = 1 , , n ). In E S T m , S S n , m refers to the number of grades of the steppe dynamics, and n refers to the number of grades of the dynamics of steppe sustainability. In Equation (2), A S T i , S S j refers to refers to the common area between the grade i zone in terms of steppe dynamics and the grade j zones in terms of the dynamics of steppe sustainability, while A S S j refers to the area of the grade j zones in terms of the dynamics of steppe sustainability.

2.4. Analysis Methods on Driving Forces of Steppe Sustainability Dynamics

Precipitation, temperature average and sunshine duration are the key natural driving factors and land use is one of the important anthropogenic driving factors of the dynamics of steppe sustainability [18,40,55,60,61,62,63,64]. We analyzed the natural driving factors with a copula model based on precipitation, temperature average and sunshine duration data, and analyzed the anthropogenic driving factors with the difference analysis method of the land-cover class conversions.

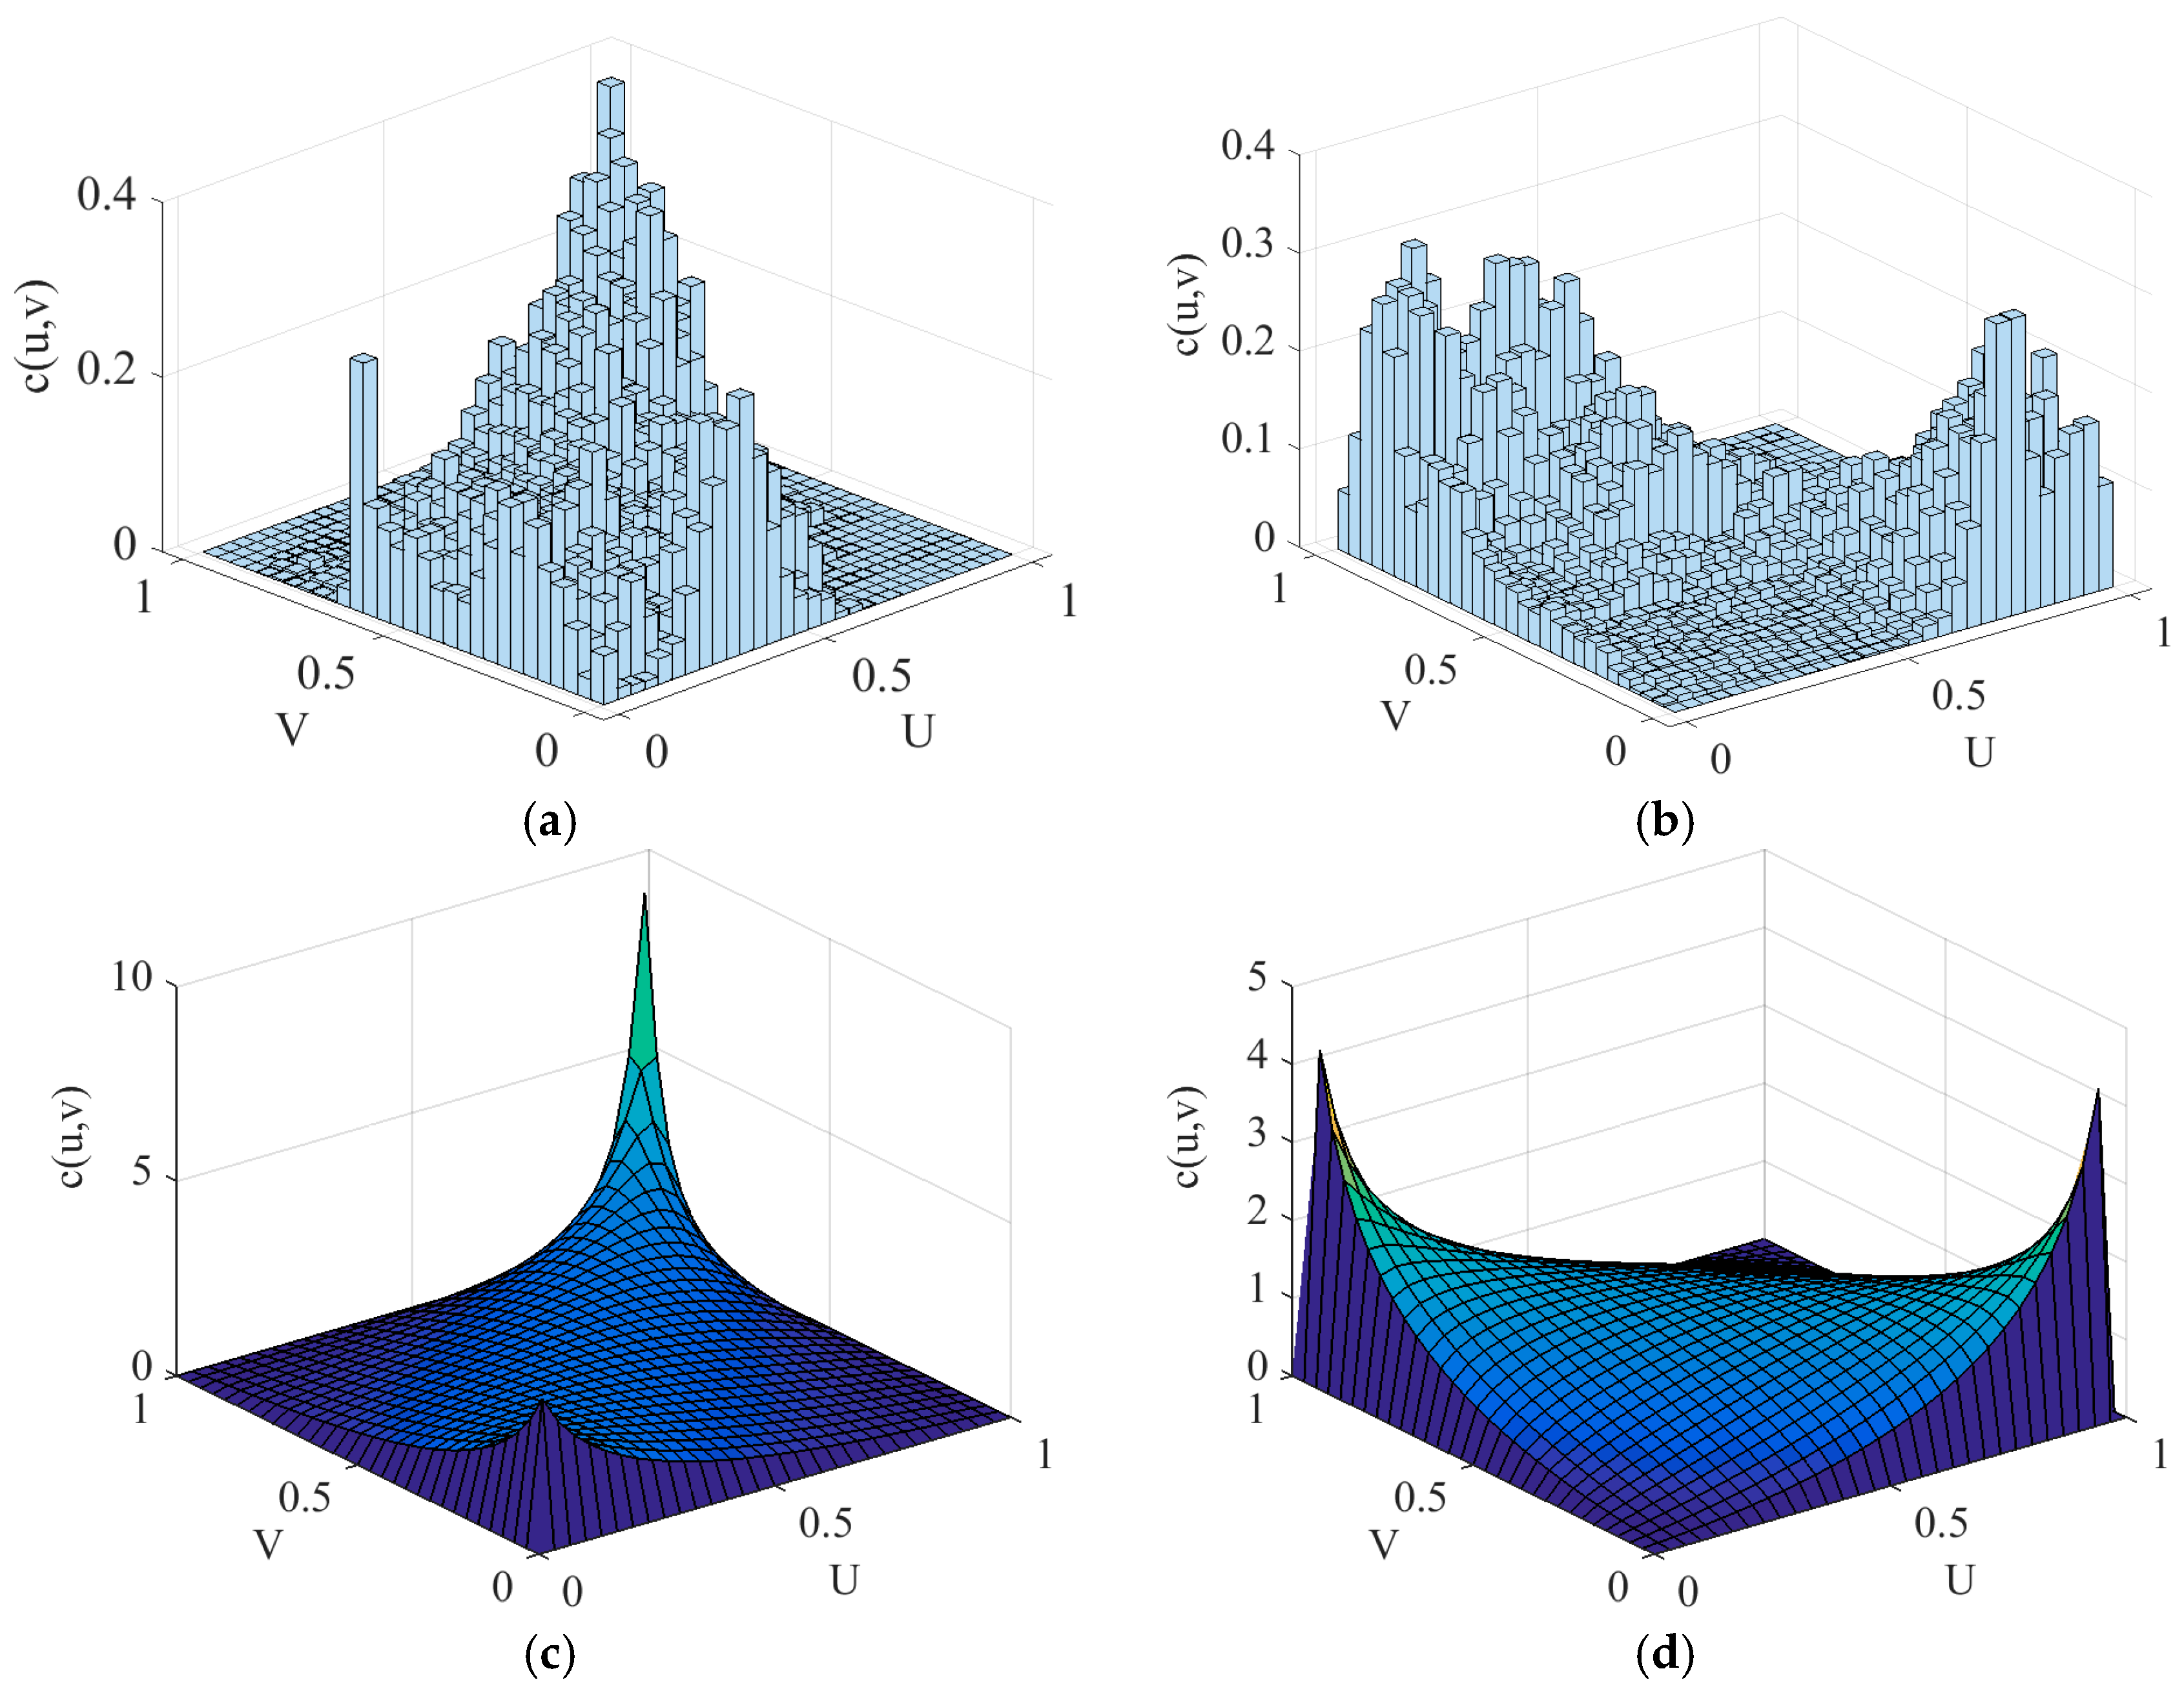
2.4.1. Natural Driving Forces Analysis with Copula Model

Correlation between NPP and meteorological factors can be used to measure the driving forces of meteorological factors on steppe sustainability [53,54]. However, steppe sustainability degradation is very complicated, and its relationship with its driving factors is usually nonlinear [18,55], so the appropriate result is often distorted when linear modeling is applied to make an analysis. Compared to linear models, a copula model can be applied to analyze nonlinear correlation between variables with the following advantages: (1) A copula model captures abnormal information by visually displaying the tail features of the variable distribution, so it can capture abnormal information about NPP and meteorological factors. (2) A copula model is suitable for variables obeying any type of distribution, and (3) a copula model is powerful for analyzing the nonlinear correlation between variables [79,80,81,82]. Recently, the copula model has been used to predict flooding using meteorological factors [69,70] and applied with satisfactory results in geoscience, hydrology, finance, and other fields [71,72,73]. Consequently, the copula model was a reasonable choice for analyzing correlations between NPP changes and meteorological factors in this study.
NPP and precipitation are expressed as X and Y respectively. The process of analyzing driving forces is based on a copula model and is described as follows. First of all, the marginal distribution of the random variables X and Y is determined, and the determination methods of random variable distribution include the parameter method and the non-parameter method. The parameter method assumes that the random variable obeys some type of distribution with parameters, such as a normal distribution or t distribution. Then, the parameters in the distribution can be estimated according to the sample data. Finally, the estimated distribution is tested. When it comes to the non-parameter method, the experience distribution function of the sample serves as the approximated distribution of the population random variable, or the distribution of the population random variable is determined based on the kernel density estimation according to the sample data. After the X marginal distribution (U = F(x)) and the Y marginal distribution (V = G(y)) are determined, the suitable copula model can be selected according to the bivariate histogram. Specifically, the bivariate frequency number histogram is drawn firstly, and then the frequency histogram is drawn on the basis of the frequency number histogram. The Gumbel copula model can be selected to describe the correlation structure of the data when the bivariate frequency histogram has asymmetric tails including high upper tail and low lower tail. The normal copula model or the t~copula model can be applied when the bivariate frequency histogram has symmetric tails. If the marginal distribution contains unknown parameters, as may be the case when the Gumbel copula model is applied with unknown parameters, for instance, then the unknown parameters should be estimated. The kernel distribution estimation method can be applied to obtain the marginal distribution of the random variables X and Y, and then the copula fit function can be called to estimate the unknown parameters. After the copula parameters are estimated, the copula statistic function is called to obtain the Spearman rank correlation coefficient [83].
According to the result of the correlation analysis between NPP meteorological factors, the driving forces of meteorological factors on steppe sustainability can be analyzed. The driving forces are stronger when the correlation is larger and vice versa.

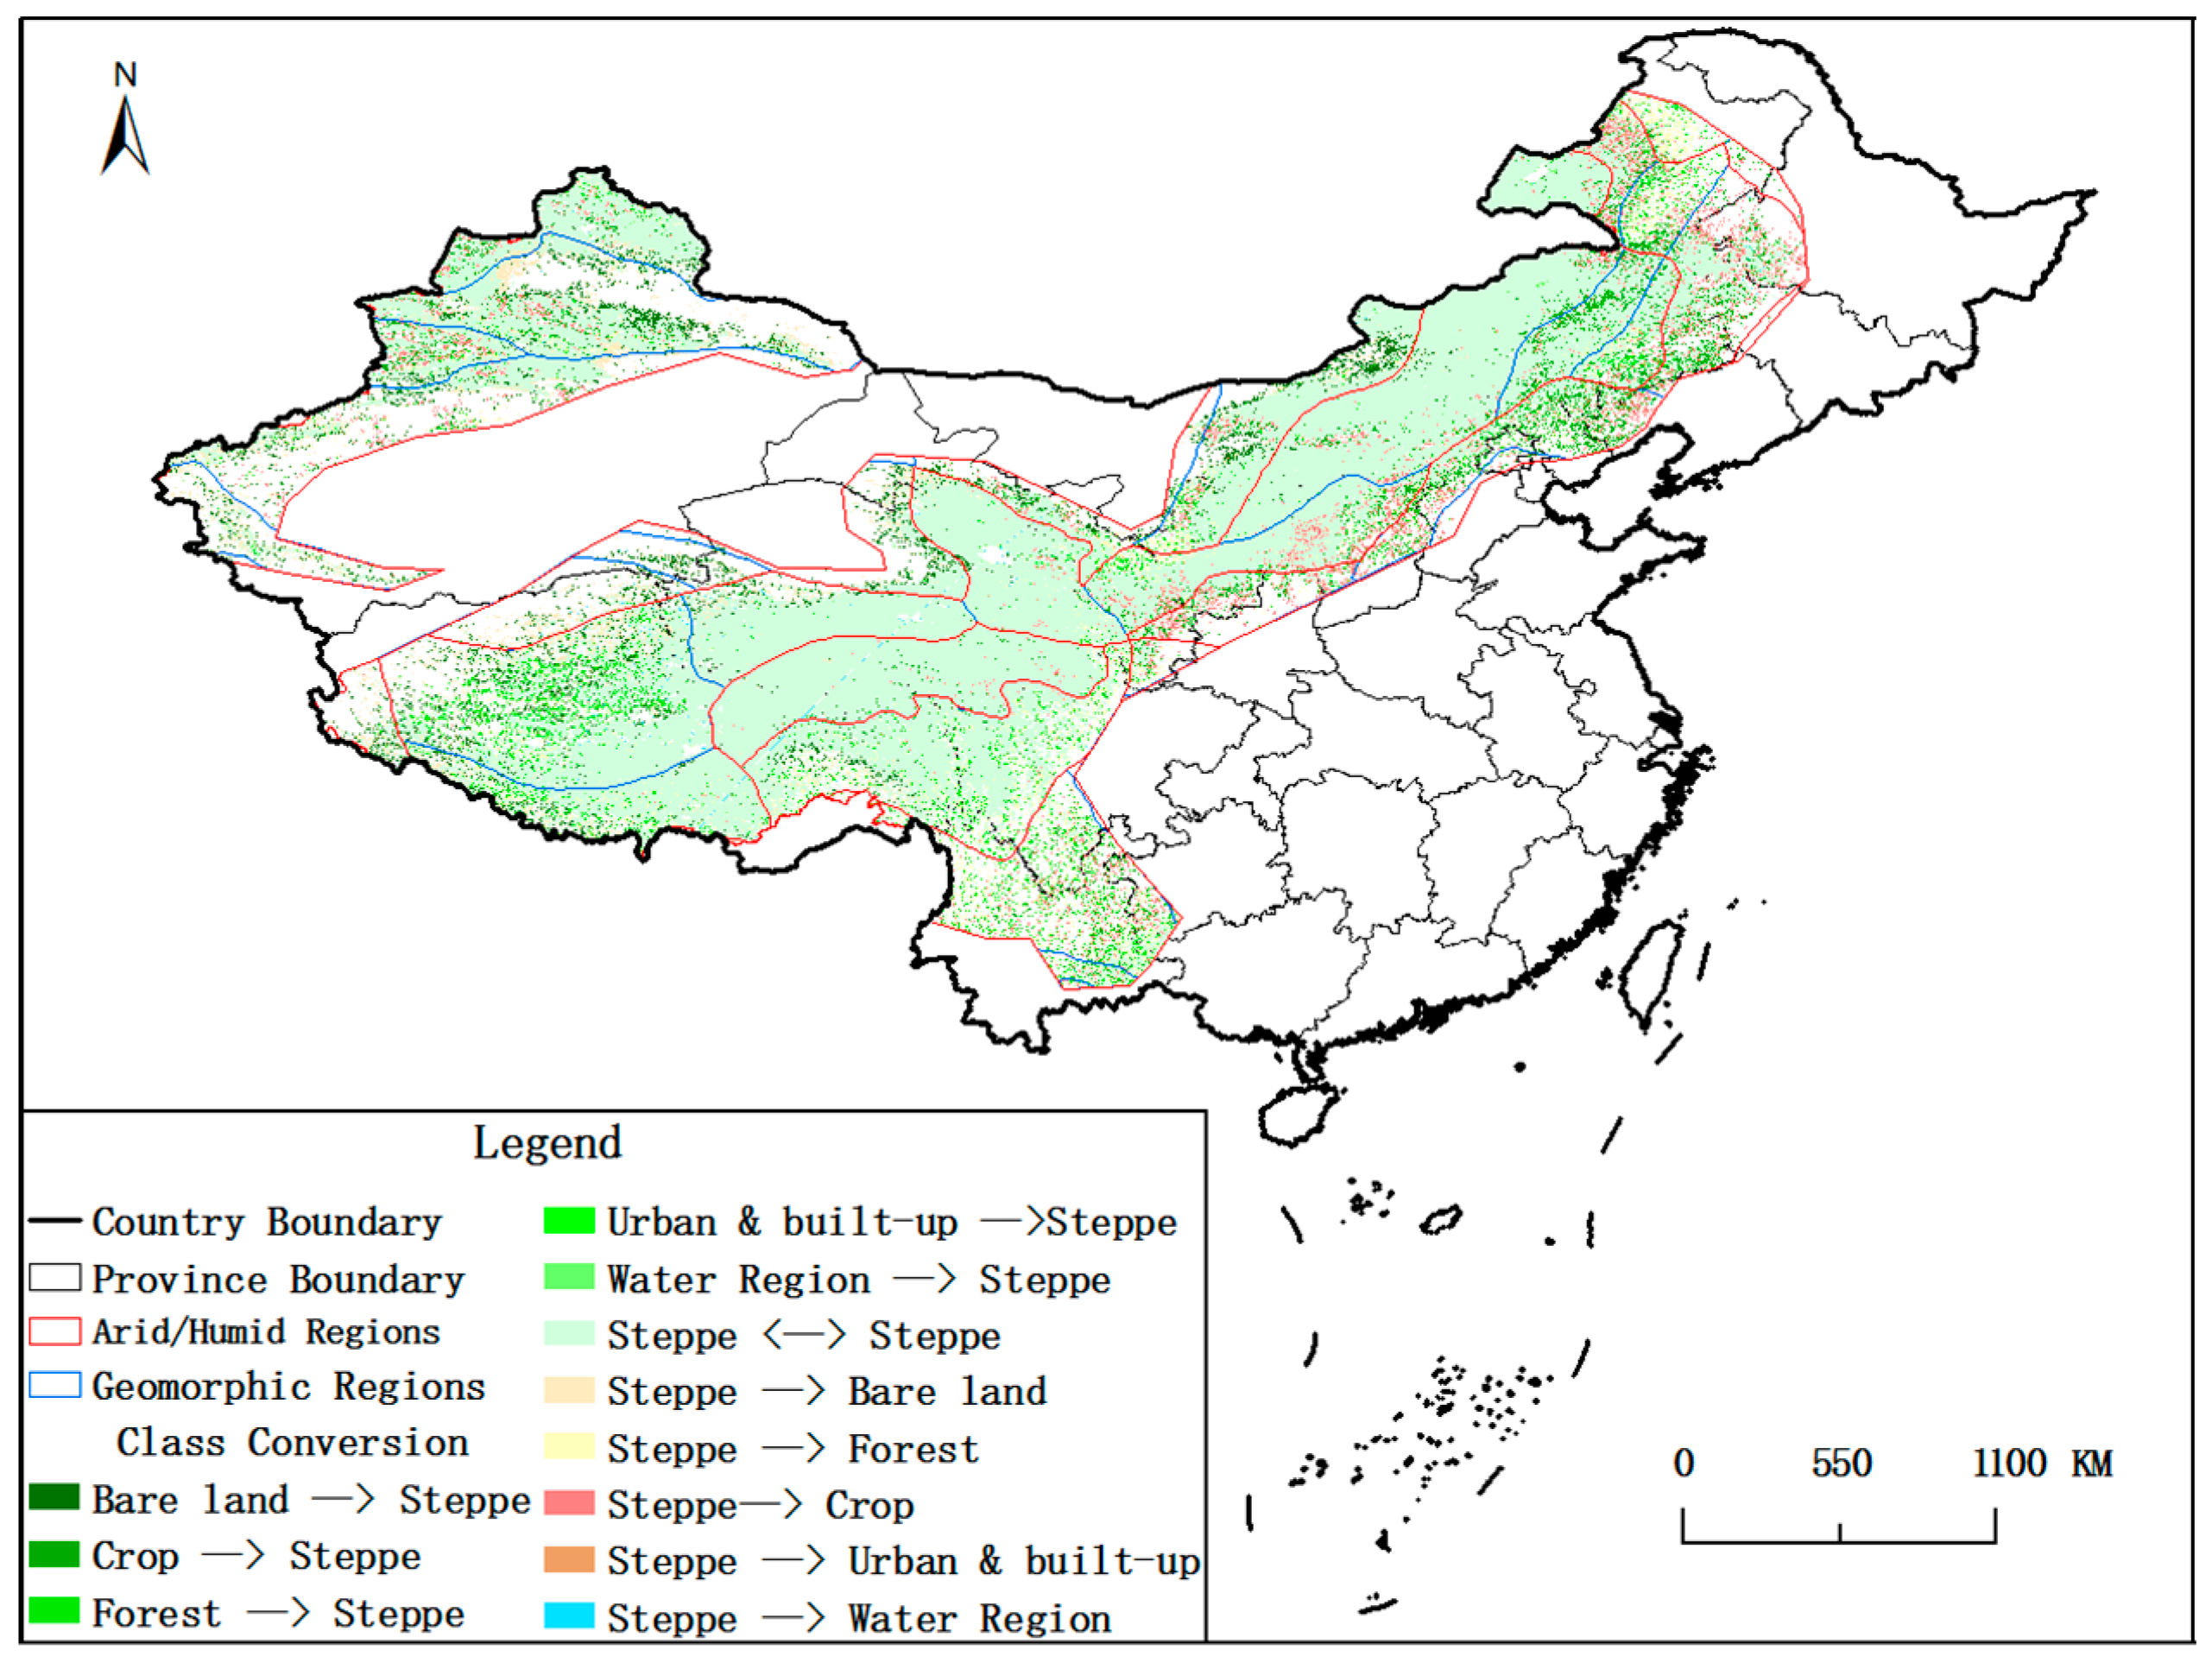
2.4.2. Anthropogenic Driving Forces Analysis Based on Land-Cover Class Conversions

Land-cover/use data is commonly applied to analyze the effect of anthropogenic factors on steppe dynamics [84,85,86,87,88]. Land-cover/use data contains information on land use by humans, which has a great effect on steppe sustainability. So the MODIS land-cover data can be applied to analyze this effect. The MODIS land-cover data was classified into 17 classes (Table 1) defined by the International Geosphere-Biosphere Programme (IGBP) [89,90]. In order to facilitate statistical analysis, we condensed these 17 classes into 7 classes (Table 1), of which there were 3 classes (crop land, urban and built-up land and forestland) related to land use. A spatial statistical method was applied to analyze the conversion area between steppe and exploited and utilized lands. The differences within the conversion area indicated steppe sustainability changes caused by land use factors. It is abbreviated as the difference analysis method of the land-cover class conversions.

3. Results

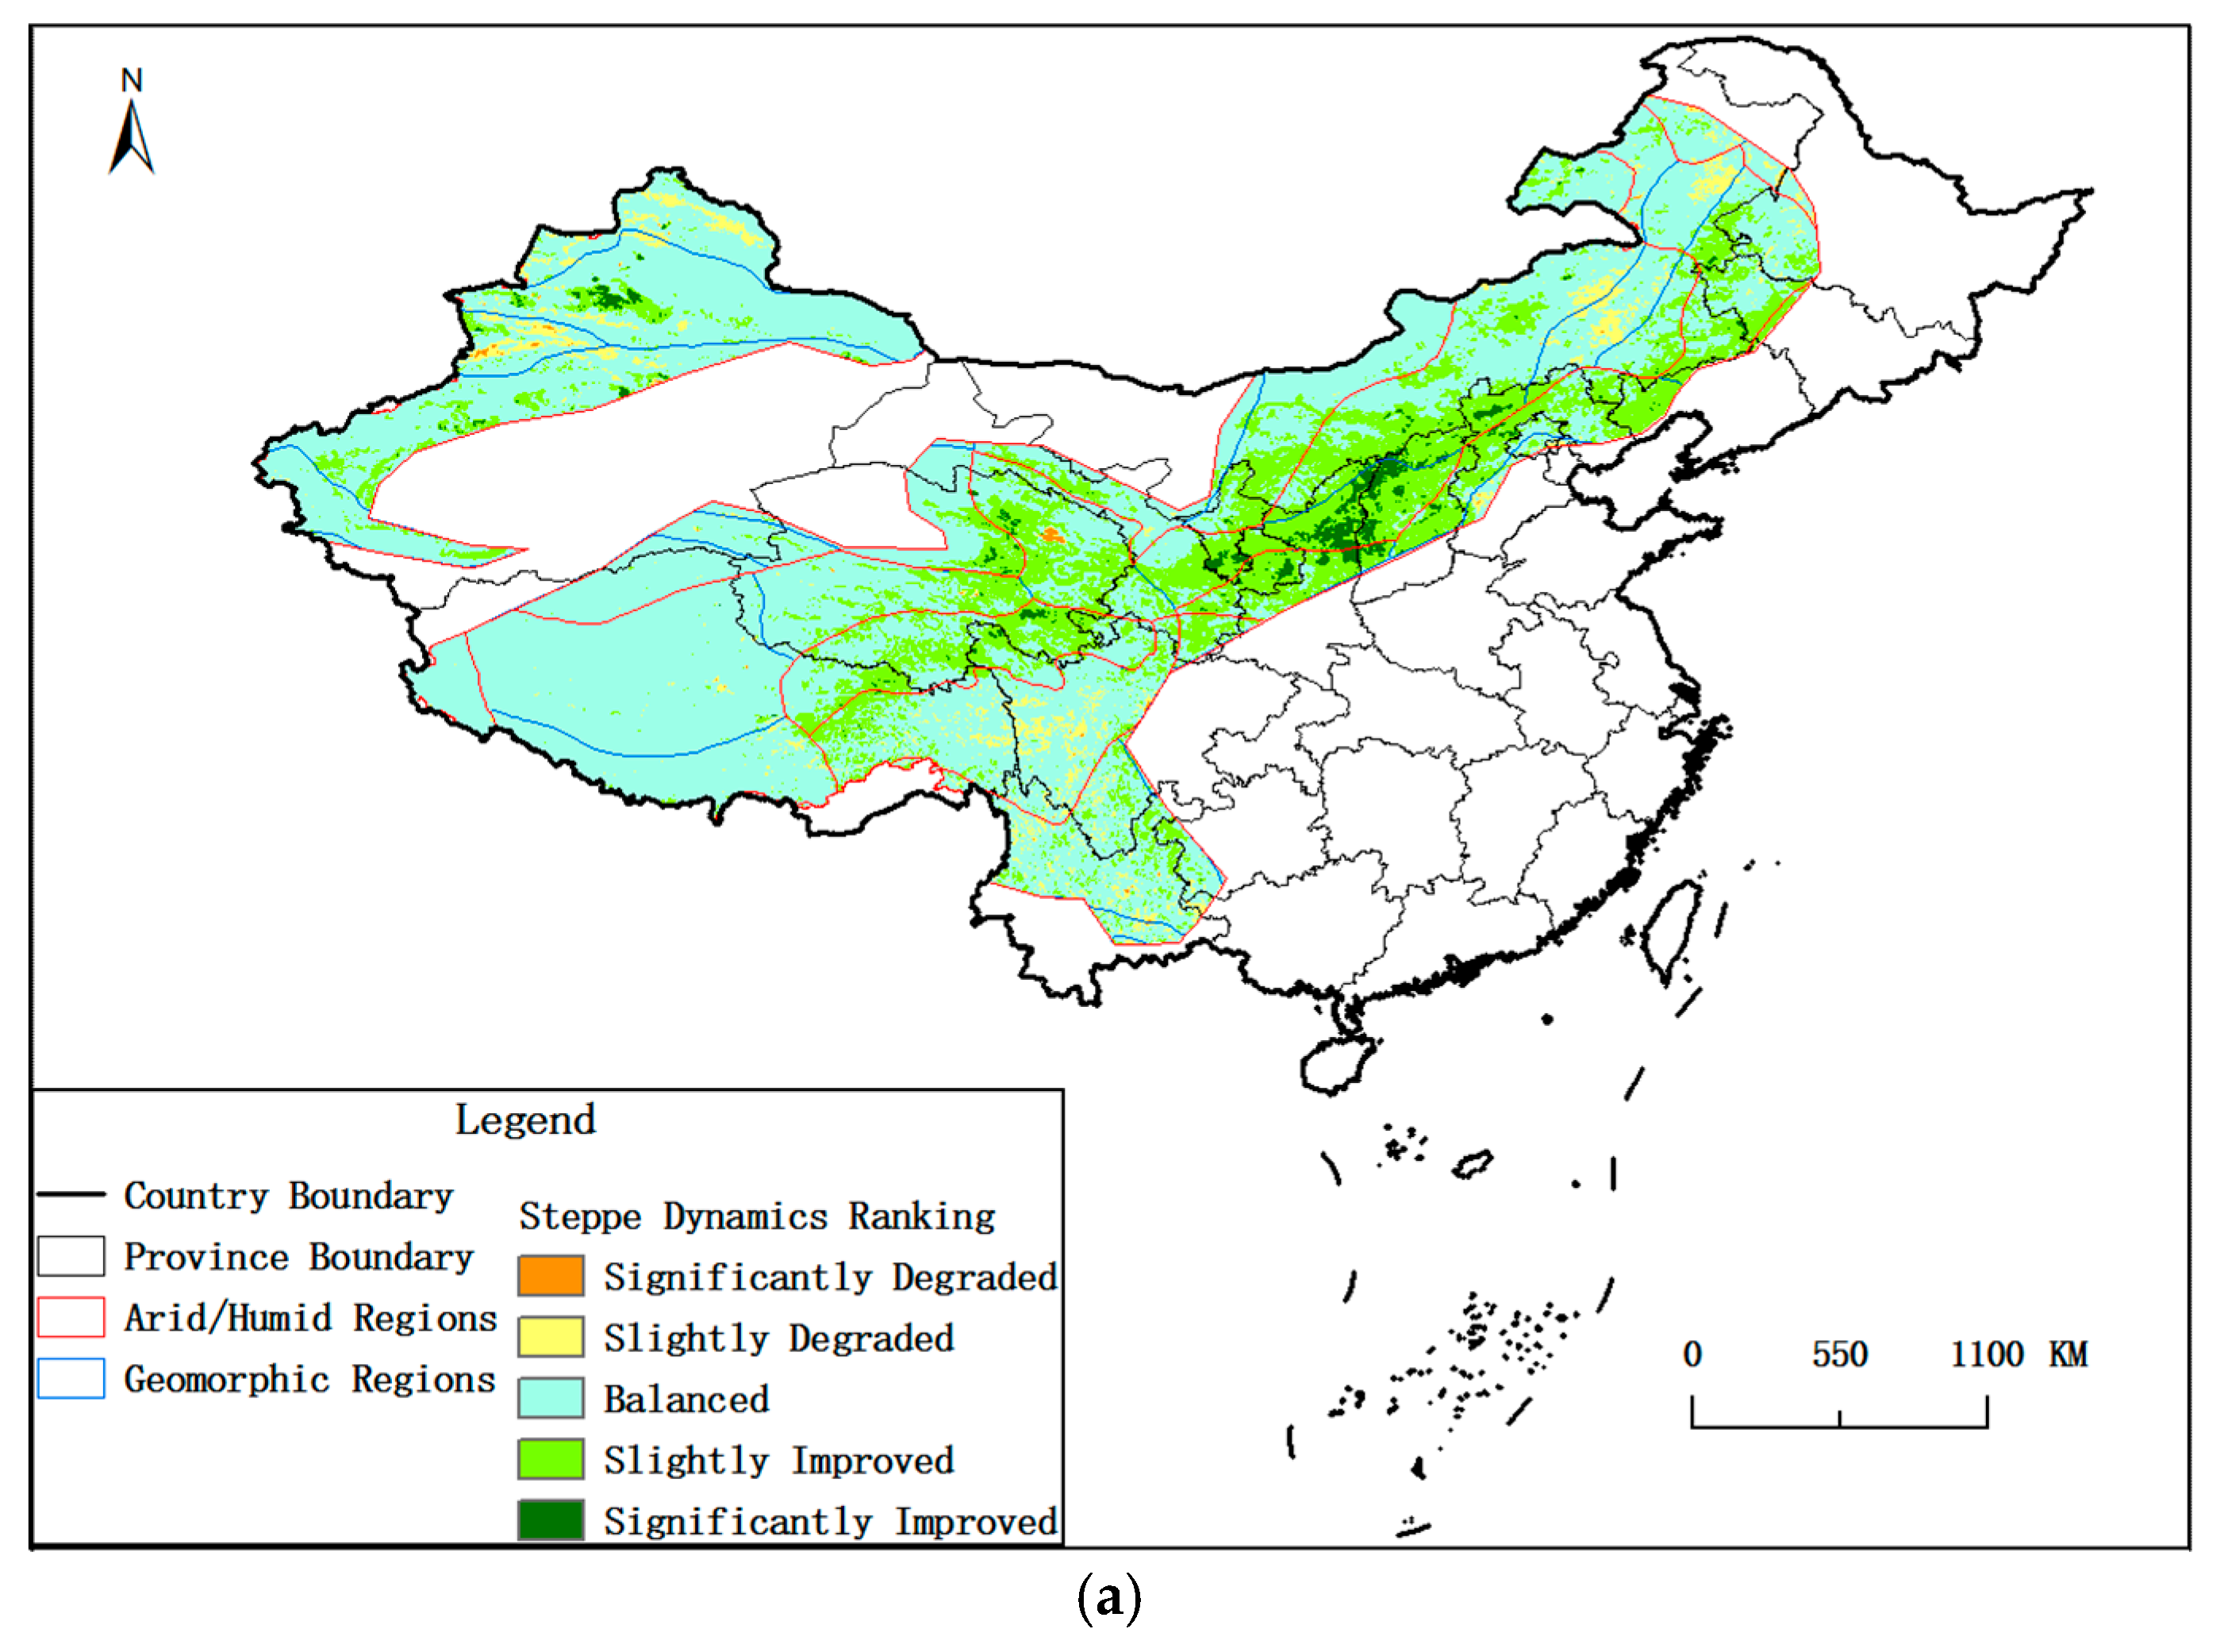
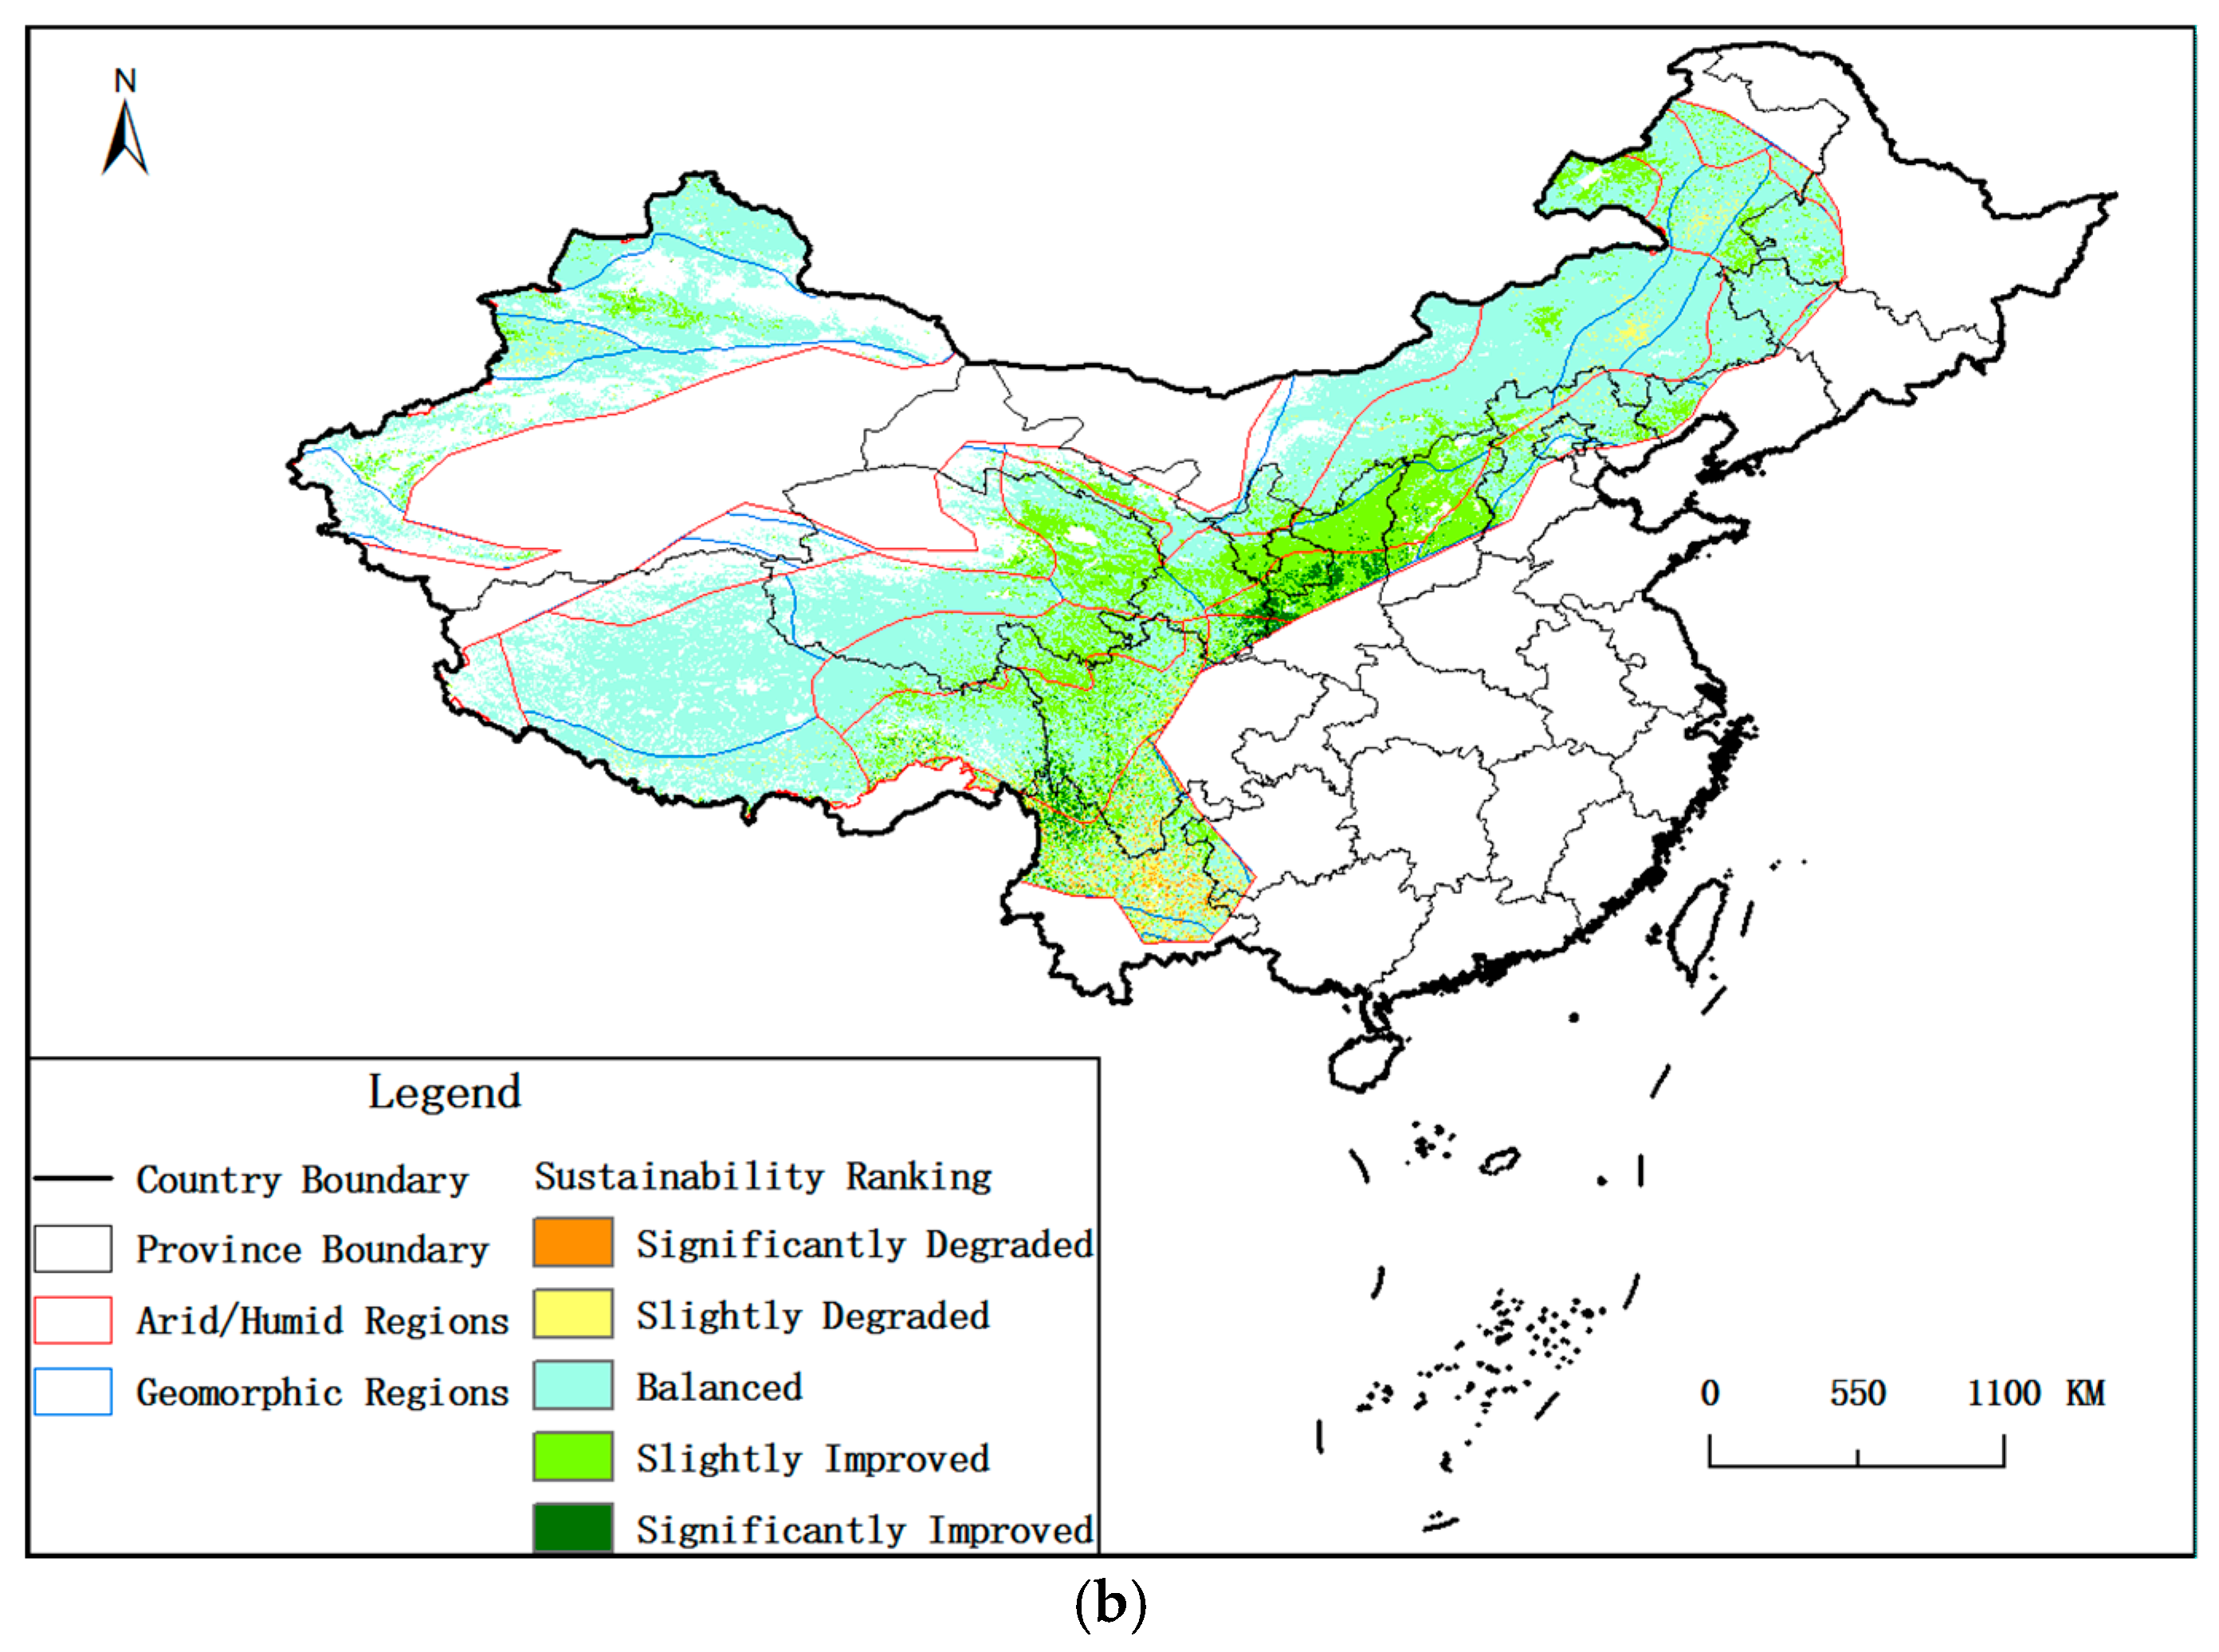
3.1. Dynamics of Steppe Sustainablitly in CHINA

The cumulative difference values of NDVI from 2001 to 2010 were calculated (Table 2), and the mean value of the cumulative difference values was 0.01455, which indicated that steppe had improved slightly in that decade. The difference values roughly obeyed a normal distribution, and the standard deviation was 0.03097 (σ = 0.03097 and 3σ = 0.09291), which indicated that the steppe was stable on the whole. In accordance with the Pauta criterion, the cumulative difference values were graded into 5 ranks with the following threshold values: −0.09291, −0.03097, 0.03097, and 0.09291. As seen in Table 2, the ranks reflected the degree of steppe dynamics. The degraded the areas accounted for 4.75% of the study area, while the improved areas accounted for 29.01%, so it could be concluded that the steppe showed a general trend of improvement over that decade. As shown in Figure 2a, the ranking map displayed the spatial distribution pattern of the dynamics. The degraded areas were scattered among all types of geomorphic regions, while the improved areas were concentrated as a band in the semi-arid and semi-humid regions in mainly the eastern and central parts of the study area.
The cumulative difference values of NPP from 2001 to 2010 were calculated (Table 2), and the mean value of NPP was 209.32, which indicated that steppe sustainability in steppe increased slightly during that decade. The difference values roughly obeyed a normal distribution, and the standard deviation was 501.98 (σ = 501.98 and 3σ = 1505.94), which indicated that the steppe sustainability was stable on the whole. In accordance with Pauta criterion, the steppe sustainability changes were graded into five ranks with the threshold values −1505.94, −501.98, 501.98, and 1505.94. In Table 2, the ranks reflect the degree of steppe sustainability dynamics. The degraded areas accounted for 4.32% of the study area, while the improved areas accounted for 19.97%, so it could be concluded that the steppe sustainability also showed a general trend of improvement over that decade. As Figure 2b shows, the ranking map displays the spatial distribution pattern of the dynamics. The degraded areas were concentrated at the semi-arid regions in the south and middle of Greater Khingan Range and the humid regions in Yunnan Plateau. The improved areas were continuously distributed as a band in the humid regions north of the Yunnan Plateau and the Hanzhong basin; the humid and semi-humid regions in the eastern Tibet-western Szechwan Plateau; the semi-humid regions in the Guanzhong basin and southwest of the North China hills; and the semi-arid regions in the Qilian Mountains and the Jin-Shan-Gan plateau.

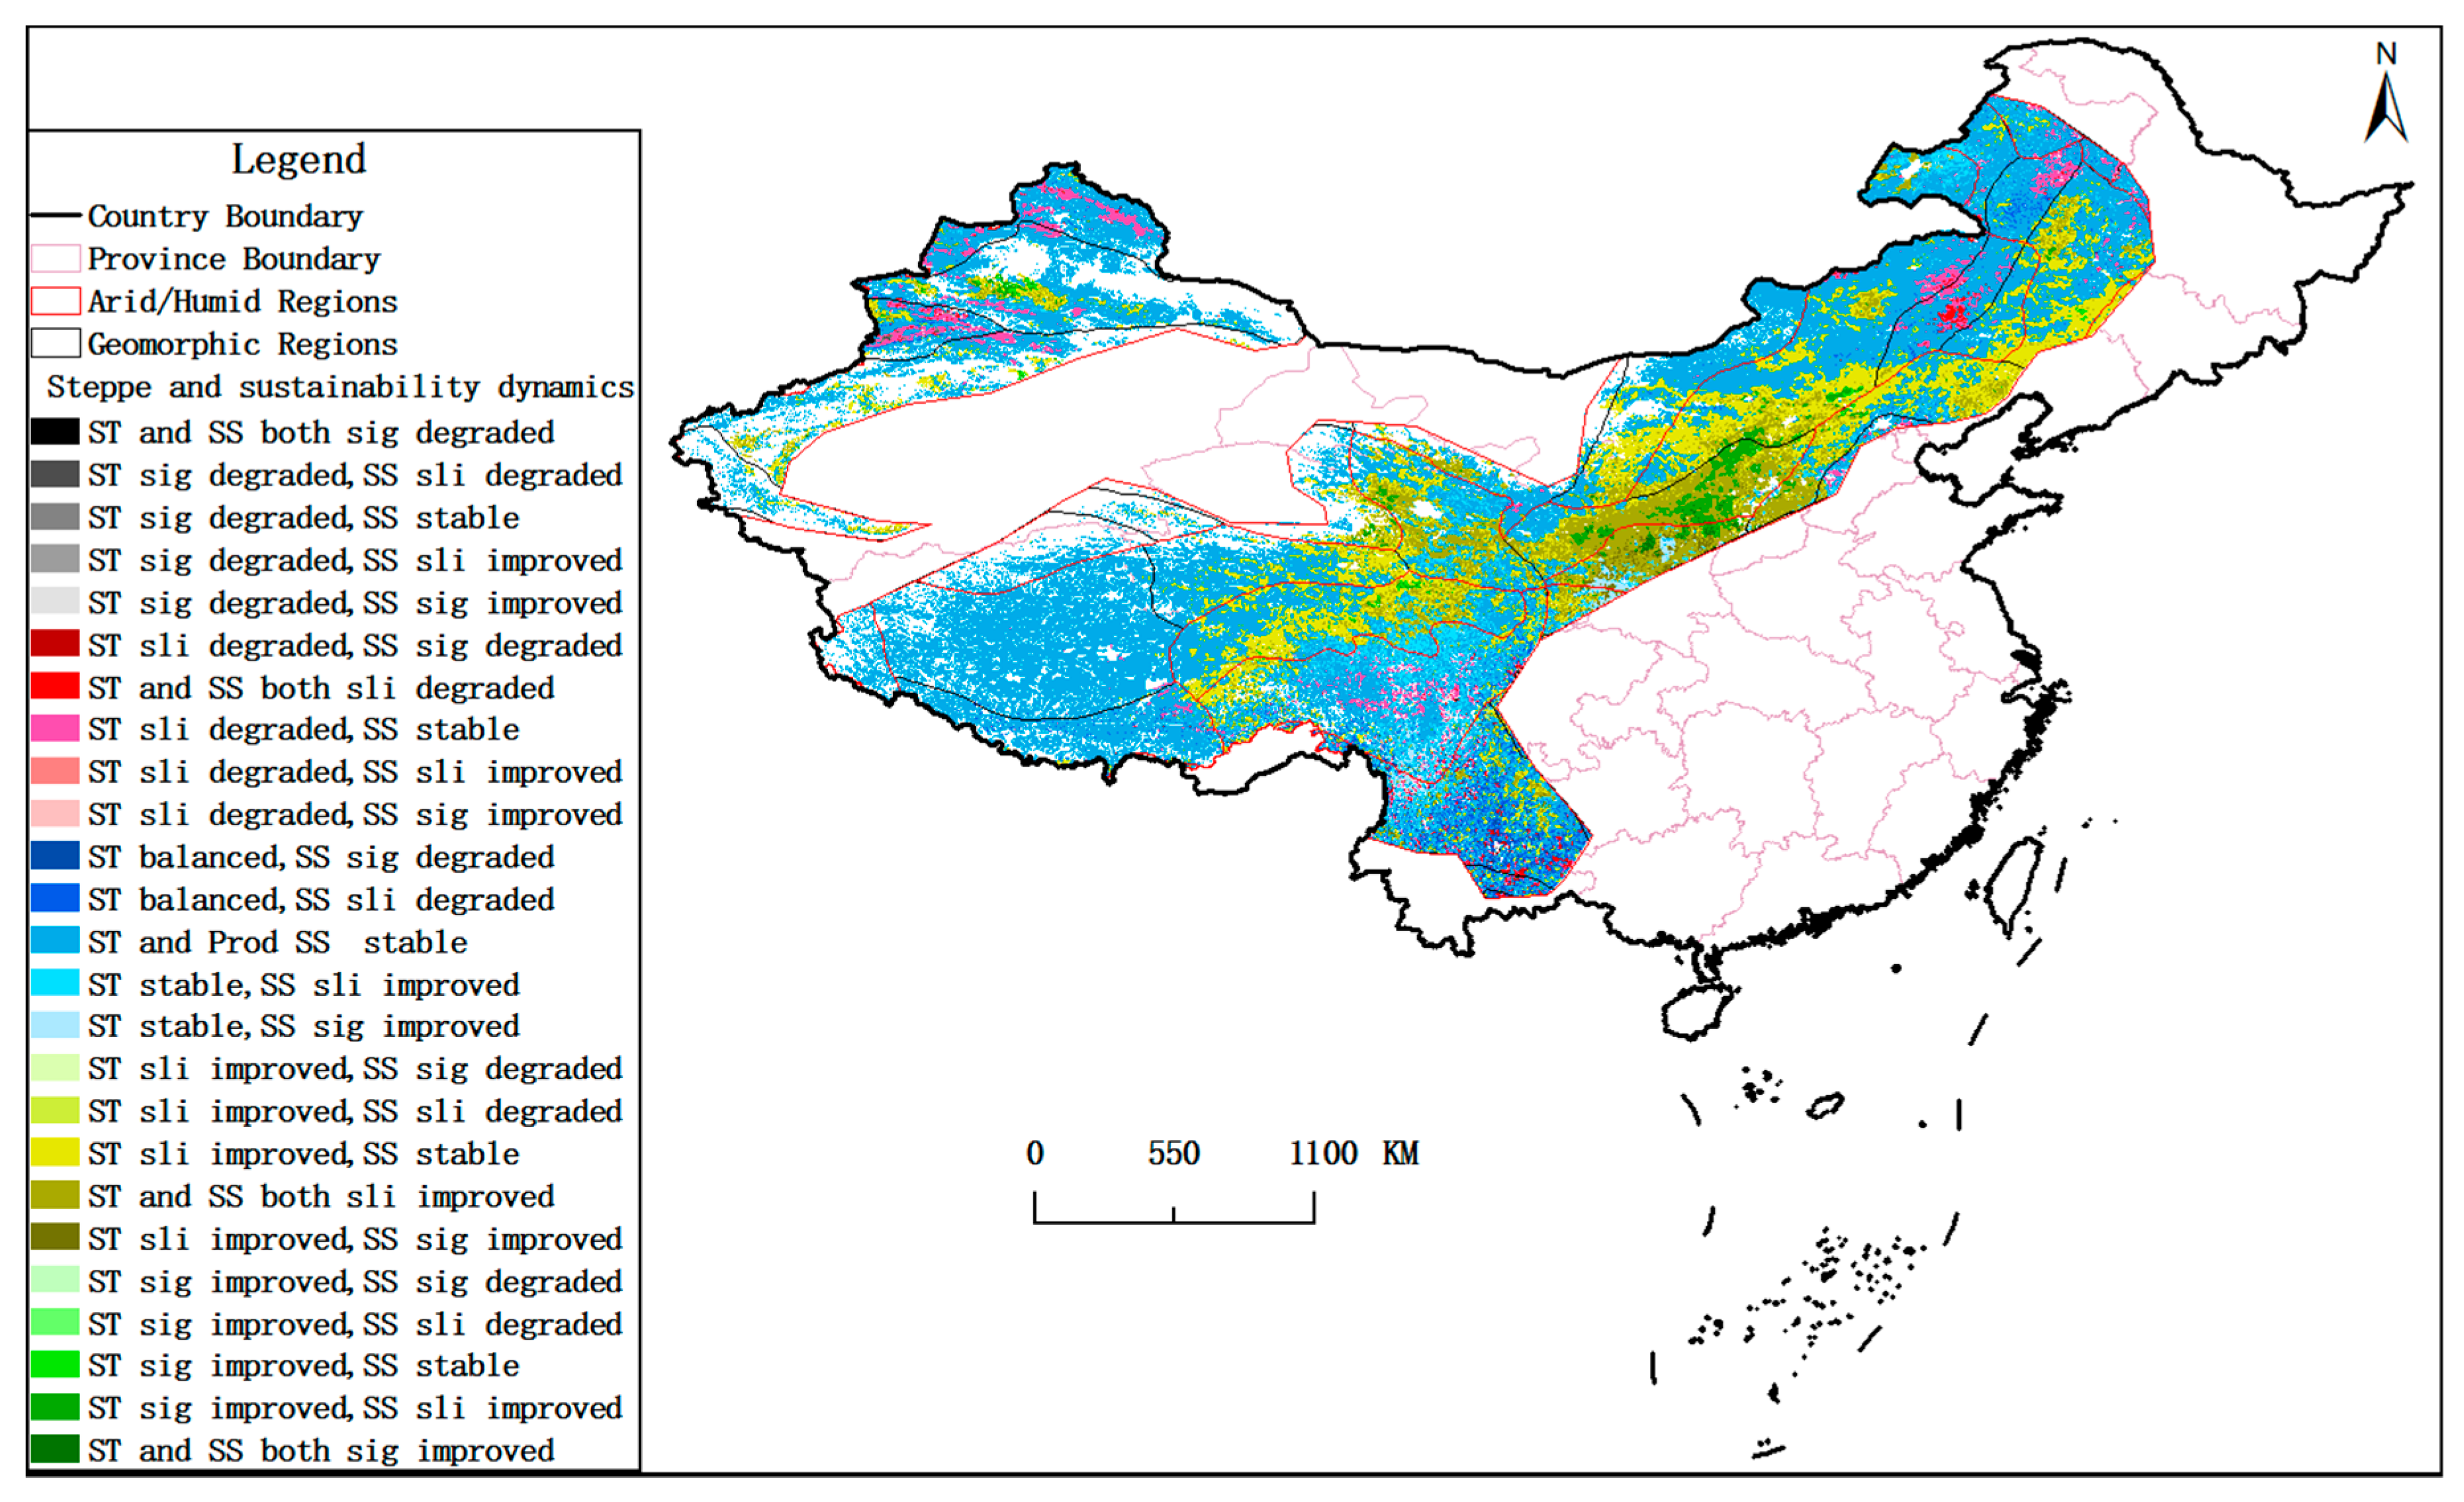
3.2. The Effect of Steppe Dynamics on Steppe Sustainability in China

We proposed a method for estimating the effect of steppe dynamics on steppe sustainability as mentioned in the previous section. We began by calculating areas of different grade zones of steppe dynamics and steppe sustainability dynamics (Table 2), and then we put the areas into Equation (1) and obtained the effect matrix.
EMat S T , S S = [ 0.01932   0.00522   0.00050   0.00012   0.00013 0.20624   0.17696   0.04464   0.02280   0.05574 0.69989   0.70957   0.74050   0.33912   0.54433 0.07445   0.10729   0.21114   0.55308   0.31760 0.00010   0.00096   0.00323   0.08488   0.08219 ]
Most of the diagonal values in the matrix were significantly larger than the off-diagonal values, indicating that the steppe sustainability had significant response to steppe dynamics in general. The equation E S T 3 , S S 3 = 0.74050 demonstrated that the stability of the steppe has played a key role in the stability and sustainable development of ecosystem productivity. The values in the first row of the matrix were decremental, and the first value was significantly larger than the other values, indicating that the significant degradation of the steppe resulted in a significant degradation of steppe sustainability. The values in the last row of the matrix were generally incremental, and the sum of the last two values was significantly larger than the sum of the other values, indicating that the significant improvement of the steppe resulted in the obvious improvement of steppe sustainability. The off-diagonal values in the matrix measured the fluctuation of the effect of steppe dynamics on steppe sustainability. The equations E S T 3 , S S 1 = 0.69989 and E S T 3 , S S 2 = 0.70957 indicated that significant degradation of steppe sustainability occurred in the balance zones of steppe; in addition, and the equations E S T 2 , S S 4 = 0.02280 and E S T 2 , S S 5 = 0.05574 indicated that the slight degradation of steppe could result in minor or significant improvement of steppe sustainability as well. The fluctuation can be explained by the Carnegie Ames Stanford Approach (CASA) model for calculating NPP, because the CASA model works with factors—including total solar radiation, vegetation type, temperature, and water stress—in addition to NDVI. The off-diagonal values also reflect the comprehensive role of factors other than single NDVI on steppe sustainability dynamics.
According to the effect matrix EMat S T , S S , the effect of NDVI dynamics on NPP dynamics was very great in the same directions, which indicated that the consistent effect of steppe dynamics on steppe sustainability was significant on the whole. However, there was also some effect of NDVI dynamics on NPP dynamics in different directions, which meant that the effects of steppe dynamics on steppe sustainability were diverse. The spatial distribution of the consistent effects and diverse effects are shown in Figure 5. The blocks in black, red, sky blue, olive, and dark green represent the consistent effect regions, while the blocks in light gray, light pink, dark blue, light cyan, light yellow-green, and light grass green represent the diverse effects of steppe dynamics on steppe sustainability.
As shown in Figure 3, the improved steppe land and steppe sustainability presented great spatial consistency and were concentrated in humid regions and semi-humid regions, while the degraded areas presented spatial diversity and were scattered throughout all types of geomorphic regions. The degraded areas should be the focus of future studies and protection. In the semi-arid regions west and south of the Greater Khingan Range, both the steppe and the steppe sustainability exhibited a certain degree of degradation. In the humid regions and semi-humid regions in the eastern Tibet-western Szechwan Plateau, there was large steppe land degradation, although there was a slight and significant trend of improvement there. There were concurrent patterns of degradation and improvement both of steppe and steppe sustainability in the humid regions of the Yunnan Plateau.

3.3. Natural Driving Forces of Steppe Sustainablitly in China

In this study, we applied a copula model to create a correlation analysis for NPP and precipitation, air temperature, and sunshine duration in semi-humid/humid area and semi-arid/arid area from 2001 to 2010. We made a distribution test of NPP and precipitation, air temperature, and sunshine duration data, and the results indicated that they disobeyed both the normal distribution and the t distribution. Consequently, we applied a nonparametric method to make the marginal cumulative distribution function appropriate for NPP, precipitation, air temperature, and sunshine duration data. At first, we applied the experience distribution function and the kernel smoothing method to fit the marginal cumulative distribution function for these data. Then we plotted the bivariate frequency histograms between NPP and meteorological factors according to the marginal cumulative distribution functions estimated (Figure 4a,b). From the bivariate frequency histograms, we found that the histograms between NPP and precipitation and air temperature were asymmetrical and that their upper tails were high and lower tails were low, so we used the Gumbel copula model to analyze the correlation between NPP and precipitation and air temperature. The upper tail and lower tail of the bivariate frequency histograms between NPP and sunshine duration were flat and symmetrical, so we used the normal copula model to analyze the correlation between NPP and sunshine duration.
We applied the kernel estimation method to estimate the related parameters in copula models based on the data. Then we applied copula models to calculate the Spearman’s rank correlation between NPP and the meteorological factors (Table 3) and drew the bivariate probability density function graphs (Figure 4c,d). From Table 3, it was shown that among the meteorological factors, precipitation and temperature average had the great positive correlation with NPP, and the correlation is significantly greater in semi-humid/humid area than semi-arid/arid area. While sunshine duration had great negative correlation with NPP, the correlation is basically consistent in both type of areas. So it can be deduced that precipitation and temperature average exerted strong positive driving forces on the dynamics of steppe sustainability, and the driving forces were significantly stronger in semi-humid/humid area than semi-arid/arid area; while sunshine duration exerted strong negative driving forces on the dynamics of steppe sustainability and the driving forces were basically same in both type of areas.

3.4. Anthropogenic Driving Forces of Steppe Sustainablitly in China

According to the difference analysis method of the land-cover class conversions addressed above, the cumulative conversion area between steppe and other classes was calculated based on MODIS land-cover data from 2002 to 2010. Because the algorithm and spatial accuracy of MODIS land-cover data in 2001 was different from those in later years, we used the MODIS land-cover data from 2002. On this basis, the differences in the conversion area between steppe and other classes were calculated (Table 4). As the results show, the area of steppe converted into forestland was significantly larger than the area of forestland converted into steppe. Conversely, the area of steppe converted into cropland and bare land was significantly smaller than the area of cropland and bare land converted into steppe. The area of conversion from steppe to urban and built-up land and vice versa was essentially balanced.
As shown in Figure 5, the steppe land converted into cropland were distributed mainly in the humid regions in Yunnan Plateau, the semi-humid regions in northeast and northern China, and the arid region north of Xinjiang. The steppe land converted into forestland were distributed mainly in the humid regions in Yunnan Plateau, the semi-humid regions in southeast of the Tibetan Plateau, and the arid regions of the Hotao plains. The steppe land converted into urban and built-up lands were small and scattered throughout the humid regions of the Yunnan Plateau, the semi-humid regions of the Songliao plains, the semi-arid regions between Qilian Mountains and the Hoxi Corridor, and the arid regions north of the Xinjiang province. The steppe land converted into bare land were concentrated in the Junggar basin, and scattered throughout the other arid regions.
The cropland converted into steppe were mainly distributed in the humid regions in the Yunnan Plateau, the semi-humid and semi-arid regions in northeastern and northern China, the Hanzhong basin and the Guanzhong basin, and the arid regions northwest of Xinjiang province. The forestland converted into steppe were concentrated at the humid regions in the Yunnan Plateau, the semi-arid regions southwest of the Tibetan Plateau, the humid and semi-humid regions southeast of the Tibetan Plateau, and the humid and semi-humid regions in Greater Khingan Range. The areas of urban and built-up lands converted into steppe were scattered throughout the humid regions in the Yunnan Plateau, the semi-arid regions southwest of the Tibetan Plateau, the Hoxi corridor, southeast of the Inner Mongolia plain, and west of Greater Khingan Range, and the arid regions north of Xinjiang. The areas of bare land converted into steppe were concentrated in all the arid regions, as well as the semi-arid regions west of the Tibetan Plateau.

4. Discussion

4.1. Methodology

There were no evaluation criteria for ranking steppe dynamics with remote-sensing monitoring, and steppe dynamics were subjectively ranked into four or five classes in previous studies [23,48,57,91]. The steppe dynamics can be objectively and quantificationally ranked with the ranking method based on Pauta criterion that was proposed in this study. This method is applicable to large-sample data that either actually or approximately obeys normal distribution.
Unlike the correlation analysis between NDVI and NPP based on linear regression models used in previous studies [77,78], the effect of steppe dynamics on steppe sustainability can be qualitatively analyzed with the effect matrix regardless of linear or nonlinear correlation. However, the accuracy of the method is affected by the spatial resolution of NDVI and NPP data. The previous studies focused on quantitative assessment of the meteorological and anthropogenic driving force by using the CASA and the Thornthwaite Memorial models [18,55,61,62,63,64,69,92]. However, it is hard to acquire some of the meteorological and anthropogenic data needed for these models, and the driving force of each meteorological and anthropogenic factors cannot be differentiated specifically with those models. In addition, some erroneous conclusions can be made in some scenarios [18,55]. The effect matrix contains information on meteorological and anthropogenic driving forces on the dynamic of steppe sustainability. These driving forces can be well analyzed with the effect matrix by combining with the copula model and the difference analysis method of the land-cover class conversions.
Compared to the linear regression and linear correlation analysis methods used for assessing the contributions of natural factors to steppe degradation [48,55,63,65,66], the copula model can capture abnormal information about NPP and meteorological factors and effectively analyze the nonlinear correlation between them, but it is not applicable to small samples [79,80,81,82].

4.2. Dynamics of Steppe Sustainability

The results in this study show that the steppe sustainability presented a trend of improvement between 2001 and 2010, and we inferred that the governmental steppe protection policies and programs played a great promoting role. There were previous studies demonstrating similar results and conclusions such as increasing trend of vegetation productivity and coverage in China’s major steppe from 2001 to 2013 [24] and the rise in the total amount of NPP in China’s terrestrial ecosystem from 1981 to 2008 [93]. However, there was opposite conclusion indicating that the overall change of vegetation NPP showed a degraded trend throughout northwest China in the same decade [69]. The main reason of the opposite conclusion was that the study area in this paper was larger than the one in northwest China and included some humid regions in the Yunnan Plateau and humid regions and semi-humid regions of the Greater Khingan Range and northeast China, and excluded the desert regions in Xinjiang. The other conflicting opinion expressed the general trend of farmland and grassland area in China having declined from 2001 to 2009 [94]. The different opinion resulted from the whole of China being used as the study area and farmland and grassland as the research objects, the study area was larger and research objects were fewer.
The previous studies mainly focused on steppe degradation in arid and semiarid regions [51,52,54,58,84,85,86,95]. However, we found the spatial diversity of steppe sustainability degradation distributed in all types of geomorphic regions as the Figure 2 and Figure 3 shown. In addition to the arid and semi-arid regions, in the humid regions and semi-humid regions in the eastern Tibet-western Szechwan Plateau, there were large areas of steppe land degradation, although there was a trend of improvement there. There were concurrent patterns of degradation and improvement both of steppe and steppe sustainability in the humid regions of the Yunnan Plateau. These regions should be paid more attention and well managed in the future.
In previous studies, linear regression models were applied to research the correlation between steppe sustainability and related factors [48,54,63,65,66] or between NDVI and NPP [77,78]. However, the CASA model did not indicate simple linear correlation between them [55,60,61,96], so we proposed the method base the effect matrix to analyze the effect of the steppe dynamics on steppe sustainability. Based on the effect matrix and distribution map, we found that the general consistent effect and scattered diverse effect of steppe dynamics on steppe sustainability.

4.3. Driving Forces of Dynamics of Steppe Sustainability

In this study, the meteorological driving forces on steppe sustainability dynamics were separately analyzed in semi-humid/humid area and semi-arid/arid area. We got two key points, one of which was that precipitation and air temperature had a great positive driving forces on steppe sustainability dynamics, while sunshine duration had great negative driving forces on it. The other was that the driving forces of precipitation and air temperature were significantly stronger in semi-humid/humid area than semi-arid/arid area, while the driving force of sunshine duration were basically same in both type of areas. There were similar conclusions with the first point at the global and national scales in previous studies [7,22,54,97,98], while the driving forces on ecosystem productivity dynamics at smaller scales presented obvious spatial heterogeneity in different regions [58,69,93,99,100,101,102]. The second point reveals that steppe sustainability is more susceptible to disturbances resulting from precipitation and temperature factors in semi-humid/humid area than semi-arid/arid area, but the effect of sunshine duration is stable in both type of areas. However, few results in previous studies are similar to the second one, and the difference in meteorological driving forces between semi-humid/humid area and semi-arid/arid area needs to be researched more deeply.
By comparing the results in this study to previous studies, we can find that anthropogenic driving factors on steppe sustainability dynamics have been changing during the past few decades [14]. Rapid urban expansion led to great loss of ecosystem service values and agricultural land before 2003 [11,12,13,14,15,103]. However, our results show that the area of conversion from steppe to urban and built-up land and vice versa was roughly balanced. This demonstrated that the land use by urban expansion was controlled effectively by the steppe protection programs and conservation policies in place in China between 2001–2010 [40,62,64]. However, there was still some steppe degradation caused by building activity [49,63], such as in the Liao River basin [63], as shown in Figure 3 and Figure 5, which indicates that the steppe protection programs and conservation policies should be continued. We found that the effect of deforestation and farming dropped off over the course of the decade, which revealed that the Grain for Green Project has performed well [16,64].

5. Conclusions

We explored a kind of systematic and effective analysis methods for assessing steppe sustainability and its driving forces using abundant remote sensing data and meteorological data. Steppe dynamics can be objectively and quantificationally ranked based on the Pauta criterion, and that also provides a basic objective ranking method for other similar issues. The characteristics of the effect of steppe dynamics on steppe sustainability can be intuitively revealed with the effect matrix. Copula model can be used to effectively catch the abnormal information about NPP and meteorological factors, and to analyze the nonlinear correlation between them. The effect of some anthropogenic factors, such as building, deforestation, and farming, can be clearly revealed based on the difference analysis method of the land-cover class conversions.
We found that the dynamics of steppe sustainability presented a trend of general improvement over the study period and the consistent effect of steppe dynamics on steppe sustainability was significant on the whole. However, there were still some degraded areas that were spatially diverse and scattered across all types of geomorphic regions. Moreover, the diversity effect can be revealed with the effect matrix and the difference analysis method of the land-cover class conversions (Figure 4 and Figure 5). Therefore, we can infer that the effect caused by anthropogenic factors was controlled effectively over the study period, and that the steppe land that evolved from urban and built-up land, cropland, and forestland was vulnerable and impacted steppe sustainability.
Another discovery in this study is that precipitation and temperature average exerted significantly stronger driving forces on the dynamics of steppe sustainability in semi-humid/humid area than semi-arid/arid area; while sunshine duration exerted basically the same driving force in both type of areas. According to this, we can make the conclusion that steppe sustainability is more susceptible to disturbances in precipitation and temperature factors in semi-humid/humid areas than in semi-arid/arid areas, but that the effect of sunshine duration is stable in both types of areas.
Some degraded steppe regions were scattered and their area was not large, we so suggest that these regions, especially the abandoned lands, are suitable to be accurately monitored and managed with modern equipment and facilities such as video, temperature and humidity sensors, unmanned aerial vehicles, and irrigation wells, so that these regions will gradually develop into improved steppe. There was still some large steppe degradation that can be improved continuously with the steppe protection programs and conservation policies, such as Grazing Withdrawal Program and Green for Grain Project.

Acknowledgments

This research was supported by the Open Research Funded by Key Laboratory of Satellite Mapping Technology and Application, National Administration of Surveying (No. KLMSTA-201605), the Open Research Funded by Key Laboratory of Digital Earth Science, Institute of Remote Sensing and Digital Earth, Chinese Academy of Sciences (No. 2014LDE006), Young Teachers’ Growth Plan in Shandong Province and the National Key Research and Development Program of China (No. 2016YFA0602402). We are grateful to the data providers (USGS, NASA, CMDC and RESDC) for data sources in the paper.

Author Contributions

Xiangwei Zhao and Yaojie Yue conceived and designed the research. Xiangwei Zhao, Qian Gao and Sun Pan performed the experiments; Xiangwei Zhao, Yaojie Yue, and Qian Gao analyzed the data; Yaojie Yue contributed materials and analysis tools; Xiangwei Zhao, Yaojie Yue and Lian Duan wrote the paper.

Conflicts of Interest

The authors declare no conflict of interest.

References

  1. Sims, P.; Risser, P. Grasslands. In North American Terrestrial Vegetation; Barbour, M., Billings, W., Eds.; Cambridge University Press: New York, NY, USA, 2000; pp. 323–356. [Google Scholar]
  2. Suttie, J.M.; Reynolds, S.G.; Batello, C. Grasslands of the World; Food & Agriculture Organization: Rome, Italy, 2005; Volume 34, pp. 1–356. [Google Scholar]
  3. Xu, D.D.; Guo, X.L. Evaluating the impacts of nearly 30 years of conservation on grassland ecosystem using Landsat TM images. Grassl. Sci. 2015, 61, 227–242. [Google Scholar] [CrossRef]
  4. Han, Y.; Gao, X.; Gao, J.; Xu, Y.M.; Liu, C. Typical ecosystem services and evaluation indicator system of significant eco-function areas. Ecol. Environ. Sci. 2010, 19, 2986–2992. [Google Scholar]
  5. Scurlock, J.M.O.; Johnson, K.; Olson, R.J. Estimating net primary productivity from grassland biomass dynamics measurements. Glob. Chang. Biol. 2002, 8, 736–753. [Google Scholar] [CrossRef]
  6. Nan, Z.B. The grassland farming system and sustainable agricultural development in China. Grassl. Sci. 2005, 51, 15–19. [Google Scholar] [CrossRef]
  7. Akiyama, T.; Kawamura, K. Grassland degradation in China: Methods of monitoring, management and restoration. Grassl. Sci. 2007, 53, 1–17. [Google Scholar] [CrossRef]
  8. Zhang, Z.M.; Yan, J.P.; Zhang, X.M. The theory basis, the principle and the corresponding policy suggestion to the mechanism of reparation for rangeland ecology balance in China. J. Arid Land Resour. Environ. 2007, 21, 142–146. (In Chinese) [Google Scholar]
  9. Kawada, K.; Wu, Y.; Nakamura, T. Land degradation of abandoned croplands in the Xilingol steppe region, Inner Mongolia, China. Grassl. Sci. 2011, 57, 58–64. [Google Scholar] [CrossRef]
  10. Wu, K.; Ye, X.; Qi, Z.; Zhang, H. Impacts of land use/land cover change and socioeconomic development on regional ecosystem services: The case of fast-growing Hangzhou metropolitan area, China. Cities 2013, 31, 276–284. [Google Scholar] [CrossRef]
  11. Wan, L.; Ye, X.; Lee, J.; Lu, X.; Zheng, L.; Wu, K. Effects of urbanization on ecosystem service values in a mineral resource-based city. Habitat Int. 2015, 46, 54–63. [Google Scholar] [CrossRef]
  12. Braimoh, A.K.; Onishi, T. Spatial determinants of urban land use change in Lagos, Nigeria. Land Use Policy 2007, 24, 502–515. [Google Scholar] [CrossRef]
  13. Dewan, A.M.; Yamaguchi, Y.; Ziaur, M. Dynamics of land use/cover changes and the analysis of landscape fragmentation in Dhaka Metropolitan, Banglade. GeoJournal 2012, 77, 315–330. [Google Scholar] [CrossRef]
  14. Li, X.M.; Zhou, W.Q.; Ouyang, Z.Y. Forty years of urban expansion in Beijing: What is the relative importance of physical, socioeconomic, and neighborhood factors? Appl. Geogr. 2013, 38, 1–10. [Google Scholar] [CrossRef]
  15. Dewan, A.M.; Yamaguchi, Y. Land use and land cover change in Greater Dhaka, Bangladesh: Using remote sensing to promote sustainable urbanization. Appl. Geogr. 2009, 29, 390–401. [Google Scholar] [CrossRef]
  16. Clement, F.; Amezaga, J.M. Linking reforestation policies with land use change in northern Vietnam: Why local factors matter. Geoforum 2008, 39, 265–277. [Google Scholar] [CrossRef]
  17. Ahl, D.E.; Gower, S.T.; Burrows, S.N.; Shabanov, N.V.; Ranga, B.; Knyazikhin, Y. Monitoring spring canopy phenology of a deciduous broadleaf forest using MODIS. Remote Sens. Environ. 2006, 104, 88–95. [Google Scholar] [CrossRef]
  18. Gang, C.C.; Zhou, W.; Chen, Y.Z.; Wang, Z.Q.; Sun, Z.G.; Li, J.L.; Qi, J.G.; Inakwu, O. Quantitative assessment of the contributions of climate change and human activities on global grassland degradation. Environ. Earth Sci. 2014, 72, 4273–4282. [Google Scholar] [CrossRef]
  19. Archibald, O.W. Ecology of World Vegetation; Springer Science & Business Media: Berlin, Germany, 2012. [Google Scholar]
  20. Jin, J.; Wang, Q. Assessing ecological vulnerability in western China based on Time–Integrated NDVI data. J. Arid Land. 2016, 8, 533–545. [Google Scholar] [CrossRef]
  21. Chun, M. Analysis of Ecological Vulnerability of Grassland in Yushu of China Based on Landscape Pattern. J. Landsc. Res. 2012, 2012, 53–54. [Google Scholar]
  22. Zhang, J.T.; Zhang, G.L. Ecological situation and management of Bothriochloa ischaemum grasslands in China. Grassl. Sci. 2006, 52, 85–93. [Google Scholar] [CrossRef]
  23. Zhou, H.K.; Zhao, X.Q.; Tang, Y.H.; Gu, S.; Zhou, L. Alpine grassland degradation and its control in the source region of the Yangtze and Yellow Rivers. China Grassl. Sci. 2005, 51, 191–203. [Google Scholar] [CrossRef]
  24. Qian, S.; Wu, M.X.; Cheng, L.; Cao, Y. Study on Assessment of Ecological Environment Quality of Main Grassland in China since 2001. Chin. Agric. Bull. Suppl. 2014, 30, 81–86. [Google Scholar]
  25. Brieckle, S.W. Walter’s Vegetation of the Earth, 4th ed.; Springer: Berlin, Germany, 2000; pp. 1–10. [Google Scholar]
  26. Liu, X.Y.; Long, R.J.; Shang, Z.H. Evaluation method of ecological services function and their value for grassland ecosystems. Acta Pratacult. Sin. 2011, 1, 167–174. [Google Scholar]
  27. Dulamsuren, C.; Hauck, M.; Muhlenberg, M. Ground vegetation in the Mongolian taiga forest–steppe ecotone does not offer evidence for the human origin of grasslands. Appl. Veg. Sci. 2005, 8, 149–154. [Google Scholar] [CrossRef]
  28. Yang, B.J.; Ma, Y.X.; Li, B. Protection and Construction of Grassland in China: Investigation in the Inner Mongolia. China Dev. 2010, 10, 1–5. (In Chinese) [Google Scholar]
  29. Bujak, A.; Sliwa, Z. Global aspects of security environment–the “One Belt, One Road” project. Econ. Prawo 2016, 15, 439–454. [Google Scholar] [CrossRef]
  30. Xiao, T.; Wang, J.; Chen, Z. Vulnerability of Grassland Ecosystems in the Sanjiangyuan Region Based on NPP. Resour. Sci. 2010, 32, 323–330. (In Chinese) [Google Scholar]
  31. Wessels, K.J.; Prince, S.D.; Reshef, I. Mapping land degradation by comparison of vegetation production to spatially derived estimates of potential production. J. Arid Environ. 2008, 72, 1940–1949. [Google Scholar] [CrossRef]
  32. Jacquin, A.; Sheeren, D.; Lacombe, J.P. Vegetation cover degradation assessment in Madagascar savanna based on trend analysis of MODIS NDVI time series. Int. J. Appl. Earth Obs. 2010, 12, S3–S10. [Google Scholar] [CrossRef]
  33. Potter, C.; Klooster, S.; Genovese, V. Net primary production of terrestrial ecosystems from 2000 to 2009. Clim. Chang. 2012, 115, 365–378. [Google Scholar] [CrossRef]
  34. Eckert, S.; Husler, F.; Liniger, H.; Hodel, E. Trend analysis of MODIS NDVI time series for detecting land degradation and regeneration in Mongolia. J. Arid Environ. 2015, 113, 16–28. [Google Scholar] [CrossRef]
  35. Khalid, M.; Onisimo, M.; Elhadi, A.; Elfatih, A.R.M. Multispectral remote sensing for mapping grassland degradation using the key indicators of grass species and edaphic factors. Geocarto Int. 2015, 31, 477–491. [Google Scholar]
  36. Liu, J.; Yang, X.; Liu, H.L.; Qiao, Z. Algorithms and Applications in Grass Growth Monitoring. Abstr. App. Anal. 2013, 2013, 900–914. [Google Scholar] [CrossRef]
  37. Hunt, J.; Raymond, E.; Everitt, J.H.; Ritchie, J.C.; Moran, M.S.; Booth, D.T. Applications and research using remote sensing for rangeland management. Photogramm. Eng. Remote Sens. 2003, 69, 675–693. [Google Scholar] [CrossRef]
  38. Kawamura, K.; Akiyama, T.; Yokota, H.; Tsutsumi, M.; Yasuda, T.; Watanabe, O.; Wang, S.P. Comparing MODIS vegetation indices with AVHRR NDVI for monitoring the forage quantity and quality in Inner Mongolia grassland, China. Grassl. Sci. 2005, 51, 33–40. [Google Scholar] [CrossRef]
  39. Wei, O.Y.; Hao, F.H.; Skidmore, A.K.; Groen, T.A.; Toxopeus, A.G.; Wang, T.J. Integration of multi–sensor data to assess grassland dynamics in a Yellow River sub–watershed. Ecol. Indic. 2012, 18, 163–170. [Google Scholar]
  40. Wang, B.Y.; Han, T.H.; Sun, B. Temporal and spatial dynamic of grassland based on MODIS NDVI during 2001–2015 in Gansu Province. China Herbiv. Sci. 2016, 36, 39–41. (In Chinese) [Google Scholar]
  41. Asrar, G.; Myneni, R.B.; Li, Y.; Kanemasu, E.T. Measuring and modeling spectral characteristics of a tallgrass prairie. Remote Sens. Environ. 1989, 27, 143–155. [Google Scholar] [CrossRef]
  42. Baret, F. Potentials and limits of vegetation indices for LAI and APAR assessment. Remote Sens. Environ. 1991, 35, 161–173. [Google Scholar] [CrossRef]
  43. Ikeda, H.; Fukuhara, M.; Okamoto, K. Estimation of aboveground grassland phytomass with a growth model using Landsat TM and climate data. Int. J. Remote Sens. 1999, 11, 2283–2294. [Google Scholar] [CrossRef]
  44. Zhang, X.Y.; Friedl, M.A.; Schaaf, C.B.; Strahler, A.H.; Hodges, J.C.F.; Gao, F.; Reed, B.C.; Huete, F. Monitoring vegetation phenology using MODIS. Remote Sens. Environ. 2003, 84, 471–475. [Google Scholar] [CrossRef]
  45. Eastman, J.R.; Sangermano, F.; Ghimire, B.; Zhu, H.L.; Chen, H.; Neeti, N.; Cai, Y.M.; Machado, E.A.; Crema, S.C. Seasonal trend analysis of image time series. Int. J. Remote Sens. 2009, 30, 2721–2726. [Google Scholar] [CrossRef]
  46. Verbesselt, J.; Hyndmanb, R.; Newnhama, G.; Gulvenor, D. Detecting trend and seasonal changes in satellite image time series. Remote Sens. Environ. 2010, 114, 106–115. [Google Scholar] [CrossRef]
  47. Li, Z.; Huffman, T.; Mcconkey, B.; Lawrence, T.S. Monitoring and modeling spatial and temporal patterns of grassland dynamics using time–series MODIS NDVI with climate and stocking data. Remote Sens. Environ. 2013, 138, 232–244. [Google Scholar] [CrossRef]
  48. Jin, Y.X.; Xu, B.; Yang, X.C.; Qin, Z.H.; Wu, Q.; Zhao, F.; Chen, S.; Li, J.Y.; Ma, H.L. MODIS–based vegetation growth of temperate grassland and its correlation with meteorological factors in northern China. Int. J. Remote Sens. 2015, 36, 5123–5136. [Google Scholar] [CrossRef]
  49. Li, S.S.; Yang, S.N.; Liu, X.F.; Liu, Y.X.; Shi, M.M. NDVI–Based Analysis on the Influence of Climate Change and Human Activities on Vegetation Restoration in the Shaanxi–Gansu–Ningxia Region. Cent. China Remote Sens. 2015, 7, 11163–11182. [Google Scholar] [CrossRef]
  50. Nemani, R.R.; Keeling, C.D.; Hashimoto, H.; Jolly, W.M.; Piper, S.C. Climate–driven increases in global terrestrial net primary production from 1982 to 1999. Science 2003, 300, 1560–1563. [Google Scholar] [CrossRef] [PubMed]
  51. Gao, Y.Z.; Chen, Q.; Lin, S.; Marcus, G.; Holger, B. Resource manipulation effects on net primary production, biomass allocation and rain–use efficiency of two semiarid grassland sites in Inner Mongolia, China. Oecologia 2011, 165, 855–864. [Google Scholar] [CrossRef] [PubMed]
  52. Wang, X.X.; Li, F.L.; Gao, R.Z.; Luo, Y.Y.; Liu, T.X. Predicted NPP spatiotemporal variations in a semiarid steppe watershed for historical and trending climates. J. Arid. Environ. 2014, 104, 67–79. [Google Scholar] [CrossRef]
  53. Reeves, M.C.; Moreno, A.L.; Bagne, K.E. Estimating climate change effects on net primary production of rangelands in the United States. Clim. Chang. 2014, 126, 429–442. [Google Scholar] [CrossRef]
  54. Whitney, M.; Dana, B.; Karie, C.; Anine, S.; Amy, S.; Lance, V.; Scott, C.; Melinda, S.; Alan, K. Climatic controls of aboveground net primary production in semi–arid grasslands along a latitudinal gradient portend low sensitivity to warming. Oecologia 2015, 177, 959–969. [Google Scholar]
  55. Zhou, W.; Gang, C.C.; Zhou, F.C.; Li, J.L.; Dong, X.G.; Zhao, C.Z. Quantitative assessment of the individual contribution of climate and human factors to desertification in northwest China using net primary productivity as an indicator. Ecol. Indic. 2015, 48, 560–569. [Google Scholar] [CrossRef]
  56. Liu, B.; You, G.Y.; Li, R.; Shen, W.S.; Yue, Y.M.; Lin, N.F. Spectral characteristics of alpine grassland and their changes responding to grassland degradation on the Tibetan Plateau. Environ. Earth Sci. 2015, 74, 2115–2123. [Google Scholar] [CrossRef]
  57. Xu, B.; Tao, W.G.; Yang, X.C.; Qin, Z.H.; Liu, H.Q.; Miao, J.M. MODIS–Based Remote Sensing Monitoring upon the Vegetation Growth of China’s Grassland. Acta Agrestia Sin. 2006, 14, 242–247. (In Chinese) [Google Scholar]
  58. Chen, J.; Masae, S.; Wu, Y.N.; Yoshimichi, H.; Yasuo, Y. Vegetation and its spatial pattern analysis on salinized grasslands in the semiarid Inner Mongolia steppe. Grassl. Sci. 2015, 61, 121–130. [Google Scholar] [CrossRef]
  59. Li, A.; Wu, J.; Huang, J. Distinguishing between human-induced and climate-driven vegetation changes: A critical application of RESTREND in inner Mongolia. Landsc. Ecol. 2012, 27, 969–982. [Google Scholar] [CrossRef]
  60. Xu, D.Y.; Kang, X.W.; Zhuang, D.F.; Pan, J.J. Multi–scale quantitative assessment of the relative roles of climate change and human activities in desertification: A case study of the Ordos Plateau, China. J. Arid. Environ. 2010, 74, 498–507. [Google Scholar] [CrossRef]
  61. Zhang, C.X.; Wang, X.M.; Li, J.C.; Hua, T. Roles of climate changes and human interventions in land degradation: A case study by net primary productivity analysis in China’s Shiyanghe Basin. Environ. Earth Sci. 2011, 64, 2183–2193. [Google Scholar] [CrossRef]
  62. Mao, D.H.; Wang, Z.M.; Han, J.X.; Ren, C.Y. Spatio–temporal pattern of net primary productivity and its driven factors in northeast China in 1982–2010. Sci. Geogr. Sin. 2012, 32, 1106–1111. (In Chinese) [Google Scholar]
  63. He, C.Y.; Tian, J.; Gao, B.; Zhao, Y.Y. Differentiating climate– and human–induced drivers of grassland degradation in the Liao River Basin, China. Environ. Monit. Assess. 2015, 187, 1–14. [Google Scholar] [CrossRef] [PubMed]
  64. Xu, H.J.; Wang, X.P.; Zhang, X.X. Alpine grasslands response to climatic factors and anthropogenic activities on the Tibetan Plateau from 2000 to 2012. Ecol. Eng. 2016, 92, 251–259. [Google Scholar] [CrossRef]
  65. Herrmann, S.M.; Anyamba, A.; Tucker, C.J. Recent trends in vegetation dynamics in the African Sahel and their relationship to climate. Glob. Environ. Chang. 2005, 15, 394–404. [Google Scholar] [CrossRef]
  66. Mu, S.J.; Yang, H.F.; Li, J.L.; Chen, Y.Z.; Gang, C.C.; Zhou, W.; Ju, W.M. Spatio–temporal dynamics of vegetation coverage and its relationship with climate factors in Inner Mongolia, China. J. Geogr. Sci. 2013, 23, 231–246. [Google Scholar] [CrossRef]
  67. Ge, Q.S.; Fang, X.Q.; Zhang, X.Q.; Wu, S.H. Remarkable environmental changes in China during the past 50 years: A case study on regional research of global environmental change. J. Geogr. Res. 2005, 3, 345–358. [Google Scholar]
  68. Wang, X.G.; Luo, J.Q. “Combination of heavy” attack to curb grassland degradation. Proc. China Grassl. Dev. Forum. 2006, 1, 328–330. [Google Scholar]
  69. Zhou, W.; Gang, C.C.; Zhou, L.; Chen, Y.Z.; Li, J.L.; Ju, W.M.; Inakwu, O. Dynamic of grassland vegetation degradation and its quantitative assessment in the northwest China. Acta Oecol. 2014, 55, 86–96. [Google Scholar] [CrossRef]
  70. Tukey, J.W. Exploratory Data Analysis; Reading Mass; Addison-Wesley: Boston, MA, USA, 1977. [Google Scholar]
  71. Holttinen, H.; Milligan, M.; Kirby, B.; Acker, T.; Neimane, V.; Molinski, T. Using Standard Deviation as a Measure of Increased Operational Reserve Requirement for Wind Power. Wind Eng. 2008, 32, 355–378. [Google Scholar] [CrossRef]
  72. Hopkins, W.G. Measures of Reliability in Sports Medicine and Science. Sports Med. 2000, 30, 1–15. [Google Scholar] [CrossRef] [PubMed]
  73. Bland, J.M.; Altman, D.G. Statistical methods for assessing agreement between two methods of clinical measurement. Int. J. Nurs. Stud. 2010, 47, 931–936. [Google Scholar] [CrossRef]
  74. Lowerre, J.M. On the Mean Square Error of Parameter Estimates for Some Biased Estimators. Technometrics 1974, 16, 461–464. [Google Scholar] [CrossRef]
  75. Wang, Y.; Chen, X.L.; Li, G.M.; Liu, X.Y. The Optimum Design of Ship Turbo Generator Reducer Based on Shock Characteristics. Appl. Mech. Mater. 2011, 39, 157–162. [Google Scholar] [CrossRef]
  76. Gu, J.Q.; Wang, Z.H.; Wu, H.R. Recognition Method of Abnormal Data Based on Interval Estimation. DEStech Trans. Eng. Technol. Res. 2016, 9, 212–218. [Google Scholar] [CrossRef]
  77. Jiang, R.Z. Spatial–temporal variation of NPP and NDVI correlation in wetland of Yellow River Delta base on MODIS data. Acta Ecol. Sin. 2011, 31, 6708–6716. (In Chinese) [Google Scholar]
  78. Lin, Z.D.; Wu, G.S. Spatial–temporal Changing characteristics of NPP and NDVI Correlation in Junxi Valley, Datian County: A Study Based on MODIS. J. Subtrop. Resour. Environ. 2015, 10, 27–33. (In Chinese) [Google Scholar]
  79. Forbes, G.A.; Nelsen, R.B. On the relationship between Spearman’s rho and Kendall’s tau for pairs of continuous random variables. J. Stat. Plan. Infer. 2007, 137, 2143–2150. [Google Scholar]
  80. Genest, C.; Rémillard, B.; Beaudoin, D. Goodness-of-fit tests for copulas: A review and a power study. Insur. Math. Econ. 2009, 44, 199–213. [Google Scholar] [CrossRef]
  81. Staudt, A. Tail risk, systemic risk and Copulas. Casualty Actuar. Soc. Forum. 2010, 2, 1–20. [Google Scholar]
  82. Pourkhanali, A.; Kim, J.M.; Tafakori, L.; Farzad, F.A. Measuring systemic risk using vine–copula. Econ. Model. 2016, 53, 63–74. [Google Scholar] [CrossRef]
  83. Salvadori, G.; Michele, C.D. On the Use of Copulas in Hydrology: Theory and Practice. J. Hydrol. Eng. 2007, 12, 369–380. [Google Scholar] [CrossRef]
  84. Osem, Y.; Perevolotyky, A.; Kigel, J. Grazing effecton diversity of annual plant communities in a semi–arid rangeland: Interactions with small–scale spatial and temporal variation in primary productivity. J. Ecol. 2002, 90, 936–946. [Google Scholar] [CrossRef]
  85. Bonet, A. Secondary succession of semi–arid Mediterranean old–fields in south–eastern Spain: Insights for conservation and restoration of degraded lands. J. Arid Environ. 2004, 56, 213–233. [Google Scholar] [CrossRef]
  86. Armas, C.; Pugnaire, F.I. Plant interactions govern population dynamics in a semi–arid plant community. J. Ecol. 2005, 93, 978–989. [Google Scholar] [CrossRef]
  87. Baldi, G.; Paruelo, J.M. Land–Use and Land-cover Dynamics in South American Temperate Grasslands. Ecol. Soc. 2008, 13, 582–592. [Google Scholar] [CrossRef]
  88. Li, Z.H.; Deng, X.Z.; Yin, F.; Yang, C.Y. Analysis of Climate and Land Use Changes Impacts on Land Degradation in the North China Plain. Adv. Meteorol. 2015, 2015, 1–11. [Google Scholar] [CrossRef]
  89. Friedl, M.A.; McIver, D.K.; Hodges, J.C.F.; Zhang, X.Y.; Muchoney, D. Global land-cover mapping from MODIS: Algorithms and early results. Remote Sens. Environ. 2002, 83, 287–302. [Google Scholar] [CrossRef]
  90. Ran, Y.; Li, X.; Lu, L. Evaluation of four remote sensing based land-cover products over China. Int. J. Remote Sens. 2010, 31, 391–401. [Google Scholar] [CrossRef]
  91. Yang, W.C.; Wu, X.H.; Zhang, D.G.; Shi, H.X.; Peng, L. Evaluation of alpine grassland degradation of Three–River source area in Chengduo country based MODIS–NDVI. Grassl. Turf 2011, 31, 50–54. (In Chinese) [Google Scholar]
  92. Zhou, W.; Sun, Z.G.; Li, J.L.; Gang, C.C.; Zhang, C.B. Desertification dynamic and the relative roles of climate change and human activities in desertification in the Heihe River Basin based on NPP. J. Arid Land. 2013, 5, 465–479. [Google Scholar] [CrossRef]
  93. Chen, F.J.; Shen, Y.J.; Li, Q.; Guo, Y.; Xu, L.M. Spatio–temporal variation analysis of ecological systems NPP in China in past 30 years. Sci. Geogr. Sin. 2011, 31, 1409–1414. (In Chinese) [Google Scholar]
  94. Xiu, L.N.; Feng, Q.S.; Liang, T.G.; Ren, J.Z. Spatial and temporal distribution of grassland and human occupancy condition in China from 2001 to 2009. Pratacult. Sci. 2014, 31, 66–74. (In Chinese) [Google Scholar]
  95. Ma, Y.H.; Fan, S.Y.; Zhou, L.H.; Dong, Z.Y.; Zhang, K.C.; Feng, J.M. The temporal change of driving factors during the course of land desertification in arid region of North China: The case of Minqin County. Environ. Geol. 2007, 51, 999–1008. [Google Scholar] [CrossRef]
  96. Potter, C.S.; Klooster, S.; Brooks, V. Interannual variability in terrestrial net primary production: Exploration of trends and controls on regional to global scales. Ecosystems 1999, 2, 36–48. [Google Scholar] [CrossRef]
  97. Zhang, M.L.; Jiang, W.L.; Chen, Q.G.; Liu, X.N. Estimation of grassland net primary production in China with improved CASA model based on the CSCS. J. Desert Res. 2014, 34, 1150–1160. (In Chinese) [Google Scholar]
  98. Huang, J.; Chen, H.S.; Yu, M. Sensitivity experiments on response of terrestrial net primary productivity in China to climate change during 1981–2008. Trans. Atmos. Sci. 2013, 36, 316–322. (In Chinese) [Google Scholar]
  99. Yiruhan; Ailikun; Ma, Z.G.; Shiyomi, M. Forty–eight–year climatology of air temperature and precipitation changes in Xilinhot, Xilingol steppe (Inner Mongolia), China. Grassl. Sci. 2011, 57, 168–172. [Google Scholar]
  100. Chen, Y.M.; Gao, J.X.; Feng, C.Y.; Jia, X.Y. Temporal and Spatial Distribution of Vegetation Net Primary Productivity (NPP) in the Years from 1982 to 2010 in Hulunbeier. J. Ecol. Rural. Environ. 2012, 28, 647–653. (In Chinese) [Google Scholar]
  101. Liang, Y.; Ganjurjav; Zhang, W.N.; Gao, Q.Z.; Luobu, D. A review on effect of climate change on grassland ecosystem in China. J. Agric. Sci. Technol. 2014, 16, 1–8. (In Chinese) [Google Scholar]
  102. Mu, S.J.; Zhou, K.X.; Chen, Y.Z.; Sun, C.M.; Li, J.L. Research Progress on the Carbon Cycle and Impact Factors of Grassland Ecosystem. Acta Agrestia Sin. 2014, 22, 439–447. (In Chinese) [Google Scholar]
  103. Ren, Z.Y.; Liu, Y.X. Contrast in vegetation net primary productivity estimation models and ecological effect value evaluation in Northwest China, Chinese. J. Eco-Agric. 2013, 21, 494–502. [Google Scholar]
Figure 1. Study area and arid/humid regions.
Sustainability 10 00233 g001
Figure 2. Ranking map of steppe dynamics and steppe sustainability dynamics. (a) Ranking map of steppe dynamics; (b) Ranking map of dynamics of steppe sustainability.
Sustainability 10 00233 g002aSustainability 10 00233 g002b
Figure 3. The spatial distribution of the effect of steppe dynamics on steppe sustainability. (Note: ST denotes steppe, SS denotes sustainability, sig denotes significantly, sli denotes slightly).
Sustainability 10 00233 g003
Figure 4. Histograms and probability density charts between NPP and precipitation and sunshine duration in semi-humid/humid area in 2001. (a) Histograms between NPP and precipitation; (b) Histograms between NPP and sunshine duration; (c) Probability density chart between NPP and precipitation; (d) Probability density chart between NPP and sunshine duration. (Note: U denotes marginal distribution of precipitation or sunshine duration; V denotes marginal distribution of NPP).
Sustainability 10 00233 g004
Figure 5. The distribution map of land-cover class conversions.
Sustainability 10 00233 g005
Table 1. Comparison between Reclassified classes and IGBP classes.
Reclassified Class CodesReclassified Class NamesIGBP Class CodesIGBP Class Names
0water area0, 11, 15Water area, permanent wetlands, snow and ice
1forestland1, 2, 3, 4, 5, 6, 7Evergreen needle-leaved forest, evergreen broad-leaved forest, deciduous needle-leaved forest, deciduous broad-leaved forest, mingled forest, closed shrub land, open shrub land.
2steppe8, 9,10Multiple-tree grassland, savanna and grassland
3crop land12, 14Crop land and the mosaic of crop and natural vegetation land
4urban and built-up land13Urban and built-up land
5bare land16Bare land or low-vegetation coverage area
6others255Unclassified area and charging value
Table 2. The areas of each rank of steppe dynamics and sustainability dynamics.
RankRanks of DynamicsSteppeSustainability
Area (km2)PercentageArea (km2)Percentage
1Significantly degraded2771.660.07%25,733.250.67%
2Slightly degraded179,166.594.68%139,729.443.65%
3Balanced2,538,072.1966.31%2,900,185.1675.71%
4Slightly improved1,036,173.8422.33%696,596.7018.19%
5Significantly improved74,230.116.68%68,169.851.78%
Table 3. Coefficient between NPP and precipitation, temperature average and sunshine duration.
YearSpearman Rank Correlation Coefficient
PrecipitationTemperature AverageSunshine Duration
SASHSASHSASH
20010.180.610.200.64−0.31−0.56
20020.210.550.270.67−0.40−0.47
20030.280.560.250.69−0.55−0.40
20040.290.560.310.690.56−0.48
20050.260.570.210.63−0.48−0.49
20060.410.630.210.64−0.59−0.52
20070.270.690.300.64−0.60−0.65
20080.200.500.290.68−0.49−0.53
20090.290.590.210.64−0.55−0.43
20100.380.600.230.61−0.60−0.54
Note: SA denotes semi-arid/arid area; SH denotes semi-humid/humid area.
Table 4. Differences of conversion area between steppe and other classes.
Class CodeClass NameArea Differences (km2)
0Water area−1063.14
1Forestland−26,946.57
2Steppe0
3Crop land19,931.50
4Urban and built-up land−354.41
5Bare land25,683.18
6Others−20.94

