Article

Research on the Renewable Energy Industry Financing Efficiency Assessment and Mode Selection

1
Business School, Hohai University, Focheng West Road 8, Nanjing 211100, China
2
Hohai University, Xikang Road 1, Nanjing 210098, China
*
Author to whom correspondence should be addressed.
Sustainability 2018, 10(1), 222; https://doi.org/10.3390/su10010222
Submission received: 27 December 2017 / Revised: 12 January 2018 / Accepted: 13 January 2018 / Published: 16 January 2018

Abstract

:
In recent years, environmental issues are attracting widespread attention by various countries around the world. In this context, the renewable energy industry has become a stimulus point for economic development and has great potential for development. Renewable energy industry financing is difficult due to its characteristics of high risk and long-term investment returns, and relying on existing financing channels make it present a glut of excess capacity. It is key to realize resource optimal allocation, solve overcapacity phenomenon and select the valid financing mode. This paper used Bloomberg New Energy Finance (BNEF) data and the data envelopment analysis (DEA) method to analyze the financing efficiency different parts of the global renewable energy industry and different ways of financing. It could be found that although the financing efficiency showed a trend of increasing year by year, the financing efficiency of each industry presented generally weak DEA efficiency, the comprehensive financing efficiency of wind power industry was higher. The article also found that the financing efficiency of project financing and Research and Development (R&D) were relatively high, and the equity market and venture capital and private equity were less efficient. The results of this paper play an important role in the overall financing status cognizance of the renewable energy industry and give suggestions about valid financing mode choice.

1. Introduction

At present, the energy industry is faced with major challenges. For example, that there exists overcapacity in traditional energy and that the clean alternative of terminal energy consumption has many obstacles. As the center of the energy system, power is the rising force in global energy eventual consumption and has a vital status. Under the influence of global warming, the renewable energy field has become the focus of most countries. According to the report of “World Energy Outlook 2017” [1], in the context of sustainable development, low carbon energy will increase to 40% in energy structure on the share by 2040. What’s more, generating this energy is almost carbon-free, and coal demand declines rapidly due to the contribution of renewable energy (over 60%) and nuclear energy (15%). According to the relevant output statistics of the “global new energy development report 2016” [2], in 2015, fossil energy accounted for 66% of the global electricity, continued the trend of decline, while the proportion of new energy power generation continued the trend of rapid growth, the annual output growth increased to 18.1% year-on-year, accounting for 7.3% of the world’s total electricity generation, and the growth speed is higher than overall output growth. In the statistics of installed capacity, the total new installed capacity of the non-fossil was 170.2 GW, accounting for 56.6% of the total installed capacity. Affected by the structural adjustment of China’s energy industry, the new installed capacity of nuclear power has reached 11.9 GW, with a cumulative total of 348 GW, and the capacity of wind power and photovoltaic installations has also continued to grow. In the statistics of financing, a new global energy financing also reached a record $328.88 billion, solar power ($161.04 billion) and wind ($109.64 billion) accounted for the vast proportion. New energy power generation project financing presented began rising year by year, while the fossil fuel power generation project finance was declining (Figure 1). Due to the influence of global environmental change, the traditional energy financing will continue falling, and the growth of renewable energy finance will continue rising.
The development of the renewable energy industry is the important support for the sustainable development of social economy. It is of great significant for economic security and national security and its strategic significance is immeasurable. The process of cultivating, developing and upgrading the renewable energy industry is a comprehensive system project that includes finance, resources, technology and management. As the core of modern economic development, finance plays an important role in the cultivation, development and upgradation of renewable energy industries. The renewable energy industry needs long-term, huge and uninterrupted funding, especially in the early stages of development when it has significant characteristics of high input, high risk and high returns. The optimization and upgrade of the renewable energy industry cannot be separated from financial support, and the establishment of a modern electricity market to promote the large-scale application of renewable energy requires financial support.
In short, the sustainable development of the renewable energy industry cannot be separated from the full source of funds and the well-functioning financial system. The related entities of the renewable energy industry also need a benign financial support system about market-oriented investment and financing environment. Financial support can effectively guide the rapid growth of the renewable energy industry development scale and level and make the financial support become the external catalyst of renewable energy industry. It is the key to the healthy development of the renewable energy industry that how to integrate the funds in a timely manner with low cost, low risk and efficient allocation of the funds to obtain high returns, namely, continuous improvement of financing efficiency. This paper used global energy industry data from 2008 to 2015, defined renewable energy industry as the photovoltaic industry, wind power industry, biomass energy, geothermal energy and marine energy industry, and used DEA model to calculate the financing efficiency of the different renewable energy industries and financing ways. Through the analysis of each industry and each financing way financing efficiency, the suitable financing mode for the development of renewable energy industry could be found. This paper can help the government make reasonable policies and promote the implementation of the policy, help investors avoid investment risks and guide correct and reasonable investment funds, so as to promote the healthy development of renewable energy industry.

2. Literature Review

Much research in recent years has focused on renewable energy industry. Summarizing the current researches results is vital for having a whole understanding on the research of renewable energy industry financing.
The most famous research on financing efficiency is by France Modigliani and Mertor Miller (1958), published in the American Economic Review on the Modigliani–Miller (MM) theorem [3]. The theorem says that without considering income tax, the company’s financing structure can affect the allocation of “cake”, but will not affect the size of the “cake”; the total value of the company to contact the company’s financing structure does not exist. This theory has become the pioneer of modern capital structure in the world. After that, the factor of income tax has been considered, and the theory has been revised. The revised MM theory creates a starting point for the study of capital structure theory and provides a useful analytical framework. More recently, researchers have employed the DEA to analyze investment efficiency in different industries/sectors. For instance, Li and Liu et al. (2017) have proposed a new framework based on the combination of the dynamic DEA [4], meta-frontier analysis theory, and truncated regression model, and then focus on the efficiency evaluation of regional high-tech industries in China. Lu and Yan Bai (2012) have made some conclusion based on the research on teaching quality evaluating theory and DEA method; by using the original data of class-teaching, where they evaluate many teachers’ comparative efficiency and analyze the final conclusion [5]. Wu and Li (2017) analyze the financial support efficiency from the aspect of capital raise based on a data envelopment analysis (DEA) model, and find that helpful financial support plays an essential role in the process of its development [6].
Recent researches have focused on the financing methods of renewable energy industries. For instance, Ng and Tao (2016) have explored the cause of the financing gap in Asia and proposes the use of bond financing to address the financing gap, find that three fixed income instruments, namely local currency denominated (LCY) corporate bonds, asset-backed project bonds and financial green bonds will be assessed and suggest that whilst the potential for these three instruments to mobilize large flows of private sector financing is great, key supportive policies aimed at reducing the capital market bias for conventional power generation technologies and supportive renewable energy (RE) policies are required, and another key aspect would be the necessary deepening of local and regional fixed income markets before such capital market instruments are able to play a big role [7]. Mazzucato and Semieniuk (2018) have analyzed the asset portfolios of different RE technologies financed by different financial actors according to their size, skew and level of risk and use entropy-based indices to measure skew, and construct a heuristic index of risk that varies with the technology, time, and country of investment to measure risk. And then they disaggregate further along 11 different financial actors (e.g., private banks, public banks, and utilities) and 11 types of renewable energy (RE) technologies (e.g., different kinds of power generation from solar radiation, wind or biomass) [8]. Krupa and Harvey (2017) have discussed a range of existing and emerging options for financing renewable electricity and uses the United States as a reference case study to contextualize the discussion [9]. Jiang and Duan (2016) put forward the corresponding mode of financing, which includes the government and financial institutions and establishes a financial support system to meet the financing needs of new energy enterprises [10]. Jiang et al. (2010) find that the higher listing requirements restrict the stock financing scale of new energy enterprises and the hesitant attitude of venture capitalists lead to the lack of venture capital. Finally, this article puts forward that project financing has not only expanded the financing channels of new energy projects, but also improved the economic efficiency of the new energy industry by introducing private capital [11].
Some research has focused on the financing efficiency of new energy industry. For instance, Kabir and Kumar et al. (2018) find that the development of novel solar power technologies is considered to be one of many key solutions toward fulfilling a worldwide increasing demand for energy. Rapid growth within the field of solar technologies is nonetheless facing economic hindrances (e.g., high upfront costs and a lack of financing mechanisms) [12]. Zeng and Jiang et al. (2017) evaluate the investment efficiency of the new energy industry in China and investigate factors that explain variations in investment efficiency across firms and over time by applying a four-stage semiparametric DEA analysis framework, and find that overall investment efficiency of the new energy industry is relatively low, and new energy firms’ investment efficiency is affected by both macroeconomic conditions and firm-specific characteristics [13]. Huijuan Deng (2015) figures out the macroscopic and microscopic influences of enterprise financing efficiency (FE) based on the foregoing study, calculates the financing efficiency value by using the basic DEA model according to the analysis of these influence factors and conducts the second-stage research on the relationship between the influences factors and the FE value with a multiple regression model [14]. Zhao (2016) finds that equity financing can exacerbate the insider control problem of the new energy listed company and the new energy enterprise internal low financing costs can improvement capital utilization efficiency [15]. Zheng (2015) analyzes new energy efficiency of financing of listed companies in China, and finds that the traditional financing channels are not sufficient, which exist less money, long time delay and low efficiency [16].
Most scholars have studied the financing efficiency of the new energy industry only with qualitative analysis or from the perspective of enterprises. Few studies have concerned on the financing efficiency of different approaches from the perspective of industry. The renewable energy industry has different financing methods and it cannot highlight the financing efficiency of different ways from the perspective of “unification” [17]. Therefore, the financing efficiency of different financing methods should be analyzed. This paper uses Bloomberg New Energy Finance (BNEF) data to study the financing efficiency of different renewable energy industries and financing channels, and will help the government make reasonable policies and promote the implementation of the policy.

3. Methodology and Materials

3.1. Methodology

3.1.1. BC2 Model (Variable Returns to Scale) and C2R Model (Constant Returns to Scale)

The DEA method was proposed by A. Charnes and W.W. Cooper in 1978 [18]. Because of the unique advantages of this method, most scholars use it to judge the relative effectiveness of the decision-making unit. First, assume that the system has n DMU, in which the input and output vectors of the j0th DMU are expressed respectively:
x j = ( x 1 j , x 2 j x m j ) T > 0 ; y j = ( y 1 j , y 2 j y m j ) T > 0 , ( j = 1 , 2 , n ) ;
The weight of the input vector x j is v j , u k is the weight of the output vector y k ( 1 j , k n ) , then the vector corresponding to the input vector is v = ( v 1 , v 2 . v m ) T , the weight vector of the output vector is u = ( u 1 , u 2 . u m ) T . For the j0th DMU, the efficiency evaluation index is:
h j = u T y j v T x j = k = 1 s u k y k j i = 1 m v i x i j , j = 1 , 2 , , n
From the above definition, it must exist v and u , make h j 1 ; The larger the value h j , means that the decision unit can get more output with less input. The corresponding C2R model is as follows:
( P 1 ) { max V P 1 = h 0 = k = 1 s u k y k j 0 i = 1 m v i x i j 0 s . t . k = 1 s u k y k j i = 1 m v i x i j 1 u k 0 , k = 1 , 2 , , s v i 0 , i = 1 , 2 , , m
The above model is relative to the total DMU, which is similar to the fractional planning, and can be equivalent to the linear programming problem according to the Charnes–Cooper transformation principle. That is, make t = 1 v T x 0 , ϖ = t v , μ = t u , the linear programming is as follows:
( P ) { max V P = μ T y 0 s . t . ω T X j μ T Y j 0 , j = 1 , 2 , , n ω T X 0 = 1 ω 0 , μ 0
Therefore, the j0th DMU is defined based on the principle of linear programming:
Definition 1. 
If linear programming (P) has the optimal solution ϖ * , μ * fit V p = μ * T , y 0 = 1 , it can be considered that the first decision unit j0th decision unit is weak and DEA effective.
Definition 2. 
If linear programming (P) has the optimal solution ϖ * , and μ * satisfies V p = μ * T , y 0 = 1 , at the same time ϖ * > 0 , μ * > 0 , it can be considered that the j0th decision unit is DEA effective.
In addition, from the dual angle of linear programming problem, the dual problem of linear programming (P) is:
( D ) { min θ s . t . j = 1 n X j λ j + s = θ X 0 j = 1 n Y j λ j s + = Y 0 λ j 0 , j = 1 , 2 , , n s + 0 , s _ 0
The j0th decision unit definition can be defined according to the linear programming dual problem:
Definition 3. 
The dual linear programming (D) exists the optimal solution, the solution is consistent θ * = 1 , then the j0th decision unit DEA is weak in effectiveness.
Definition 4. 
The dual linear programming (D) exists the optimal solution, the solution is consistent θ * = 1 , and s + = 0 , s = 0 then the j0th decision unit DEA is valid.
The C2R model is based on the assumption of fixed scale compensation, but the actual situation may be increasing or decreasing, so it is necessary to consider the change of scale compensation. The BC2 model is formed after excluding the fixed scale compensation hypothesis in the C2R model in order to measure the relative efficiency value of different scale compensation. The formula of the BC2 model is:
( P B C 2 I ) { max ( μ T Y 0 μ 0 ) ω T X j μ T Y j + μ 0 0 , j = 1 , 2 , , n ω T X 0 = 1 , ω 0 , μ 0 , μ 0 E 1 .
and
( D B C 2 I ) { min σ j = 1 n X j λ j + s + σ X 0 , j = 1 n Y j λ j s Y 0 , j = 1 n λ j = 1 , λ j 0 , s + 0 , s 0 , j = 1 , 2 , , n , σ E 1
The above model can be calculated with pure technical efficiency, and the optimal solution of the model is: λ * ,   σ * ,   s * + ,   s * , σ * = 1 , then: D M U J 0 is DEA weak effective (pure technology); σ * = 1, and s * + = 0, s * = 0, then the D M U J 0 is effective for DEA pure technology. Make K = 1 σ * j = 1 n λ j * , if K = 1, it represents the D M U J 0 scale gains are unchanged and largest; when K < 1, it represents the D M U J 0 scale gains are increasing, and the smaller the value of K, the larger the trend of increasing the increment; On the contrary, when K > 1, it represents the D M U J 0 scale return is decreasing, and the greater the value of K, the larger the trend of decreasing scale returns.

3.1.2. Malmquist Index Model

In 1953, the Swedish economist Sten Malquist put forward the Malmquist Index Model, the model of the total factor productivity (TFPch) is divided into three parts, including technological progress index (TPch), pure technical efficiency (PEch) and scale efficiency index (SEch). The Malmquist index can be regarded as the product of changes in technical efficiency and technological progress without considering the scale of compensation.
T F P c h = M ( x t + 1 , y t + 1 , x t , y t ) = D t ( x t + 1 , y t + 1 ) D t ( x t , y t ) * D t + 1 ( x t + 1 , y t + 1 ) D t + 1 ( x t , y t ) = D t + 1 ( x t + 1 , y t + 1 ) D t + 1 ( x t , y t ) * D i t ( x t + 1 , y t + 1 ) D i t + 1 ( x t + 1 , y t + 1 ) * D i t ( x t , y t ) D i t + 1 ( x t , y t ) = T E c h * T P c h
Considering the impact of the change of scale compensation, the change of technological efficiency can be considered as the product of pure technical efficiency and scale efficiency. Among them, the connotation of scale efficiency is the basis for judging whether the production meets the optimal scale, namely:
T E c h = P E c h * S E c h = [ D t + 1 ( x t + 1 , y t + 1 | V R S ) D t ( x t , y t | V R S ) * D i t ( x t + 1 , y t + 1 | C R S ) D i t + 1 ( x t + 1 , y t + 1 | V R S ) ] * D t ( x t , y t | V R S ) D t ( x t , y t | C R S )
Combining Formulas (7) and (8), it can be:
T F P c h = T P c h * P E c h * S E c h = D i t ( x t + 1 , y t + 1 ) D i t + 1 ( x t + 1 , y t + 1 ) * D i t ( x t , y t ) D i t + 1 ( x t , y t ) * [ D t + 1 ( x t + 1 , y t + 1 | V R S ) D t ( x t , y t | V R S ) * D i t ( x t + 1 , y t + 1 | C R S ) D i t + 1 ( x t + 1 , y t + 1 | V R S ) ] * D t ( x t , y t | V R S ) D t ( x t , y t | C R S )
In which, when the base period is t, the technical efficiency of t and t + 1 is expressed D i t ( x t , y t ) , D i t ( x t + 1 , y t + 1 ) ; when the base period is t + 1, the technical efficiency of t and t + 1 is expressed D i t + 1 ( x t , y t ) , D i t + 1 ( x t + 1 , y t + 1 ) . At this point, when Malmquist index is greater than 1, it means an increase in total factor productivity; instead, the total factor productivity of t + 1 is reduced. In addition when the various values of decomposition are greater than 1, it indicates that the index leads to the improvement of efficiency and vice versa.

3.2. Materials

3.2.1. Input Indicator

According to the new global energy development report, the sources of financing for the renewable energy industry are R&D investment, stock market, project financing, venture capital and private equity.
  • The R&D investment can represent the government’s support for the development of the new energy industry and the financing cost of financing is very low [19]. R&D overheating will lead to overcapacity and will not play well in guiding the healthy development of the industry. The reason may be that the policy finance combines with market weakly and doesn’t play a role of policy guiding in the market vision.
  • The development of the stock market can provide long-term financing for the development of renewable energy industry, thus promoting the long-term and healthy development. On a global scale, renewable energy industry has exposed the blind development, the problem of excess production capacity and low technical level. The problem makes investors evaluate the investment value and the tendency of raising funds through Initial Public Offerings (IPO) and then secondary is no longer overheating.
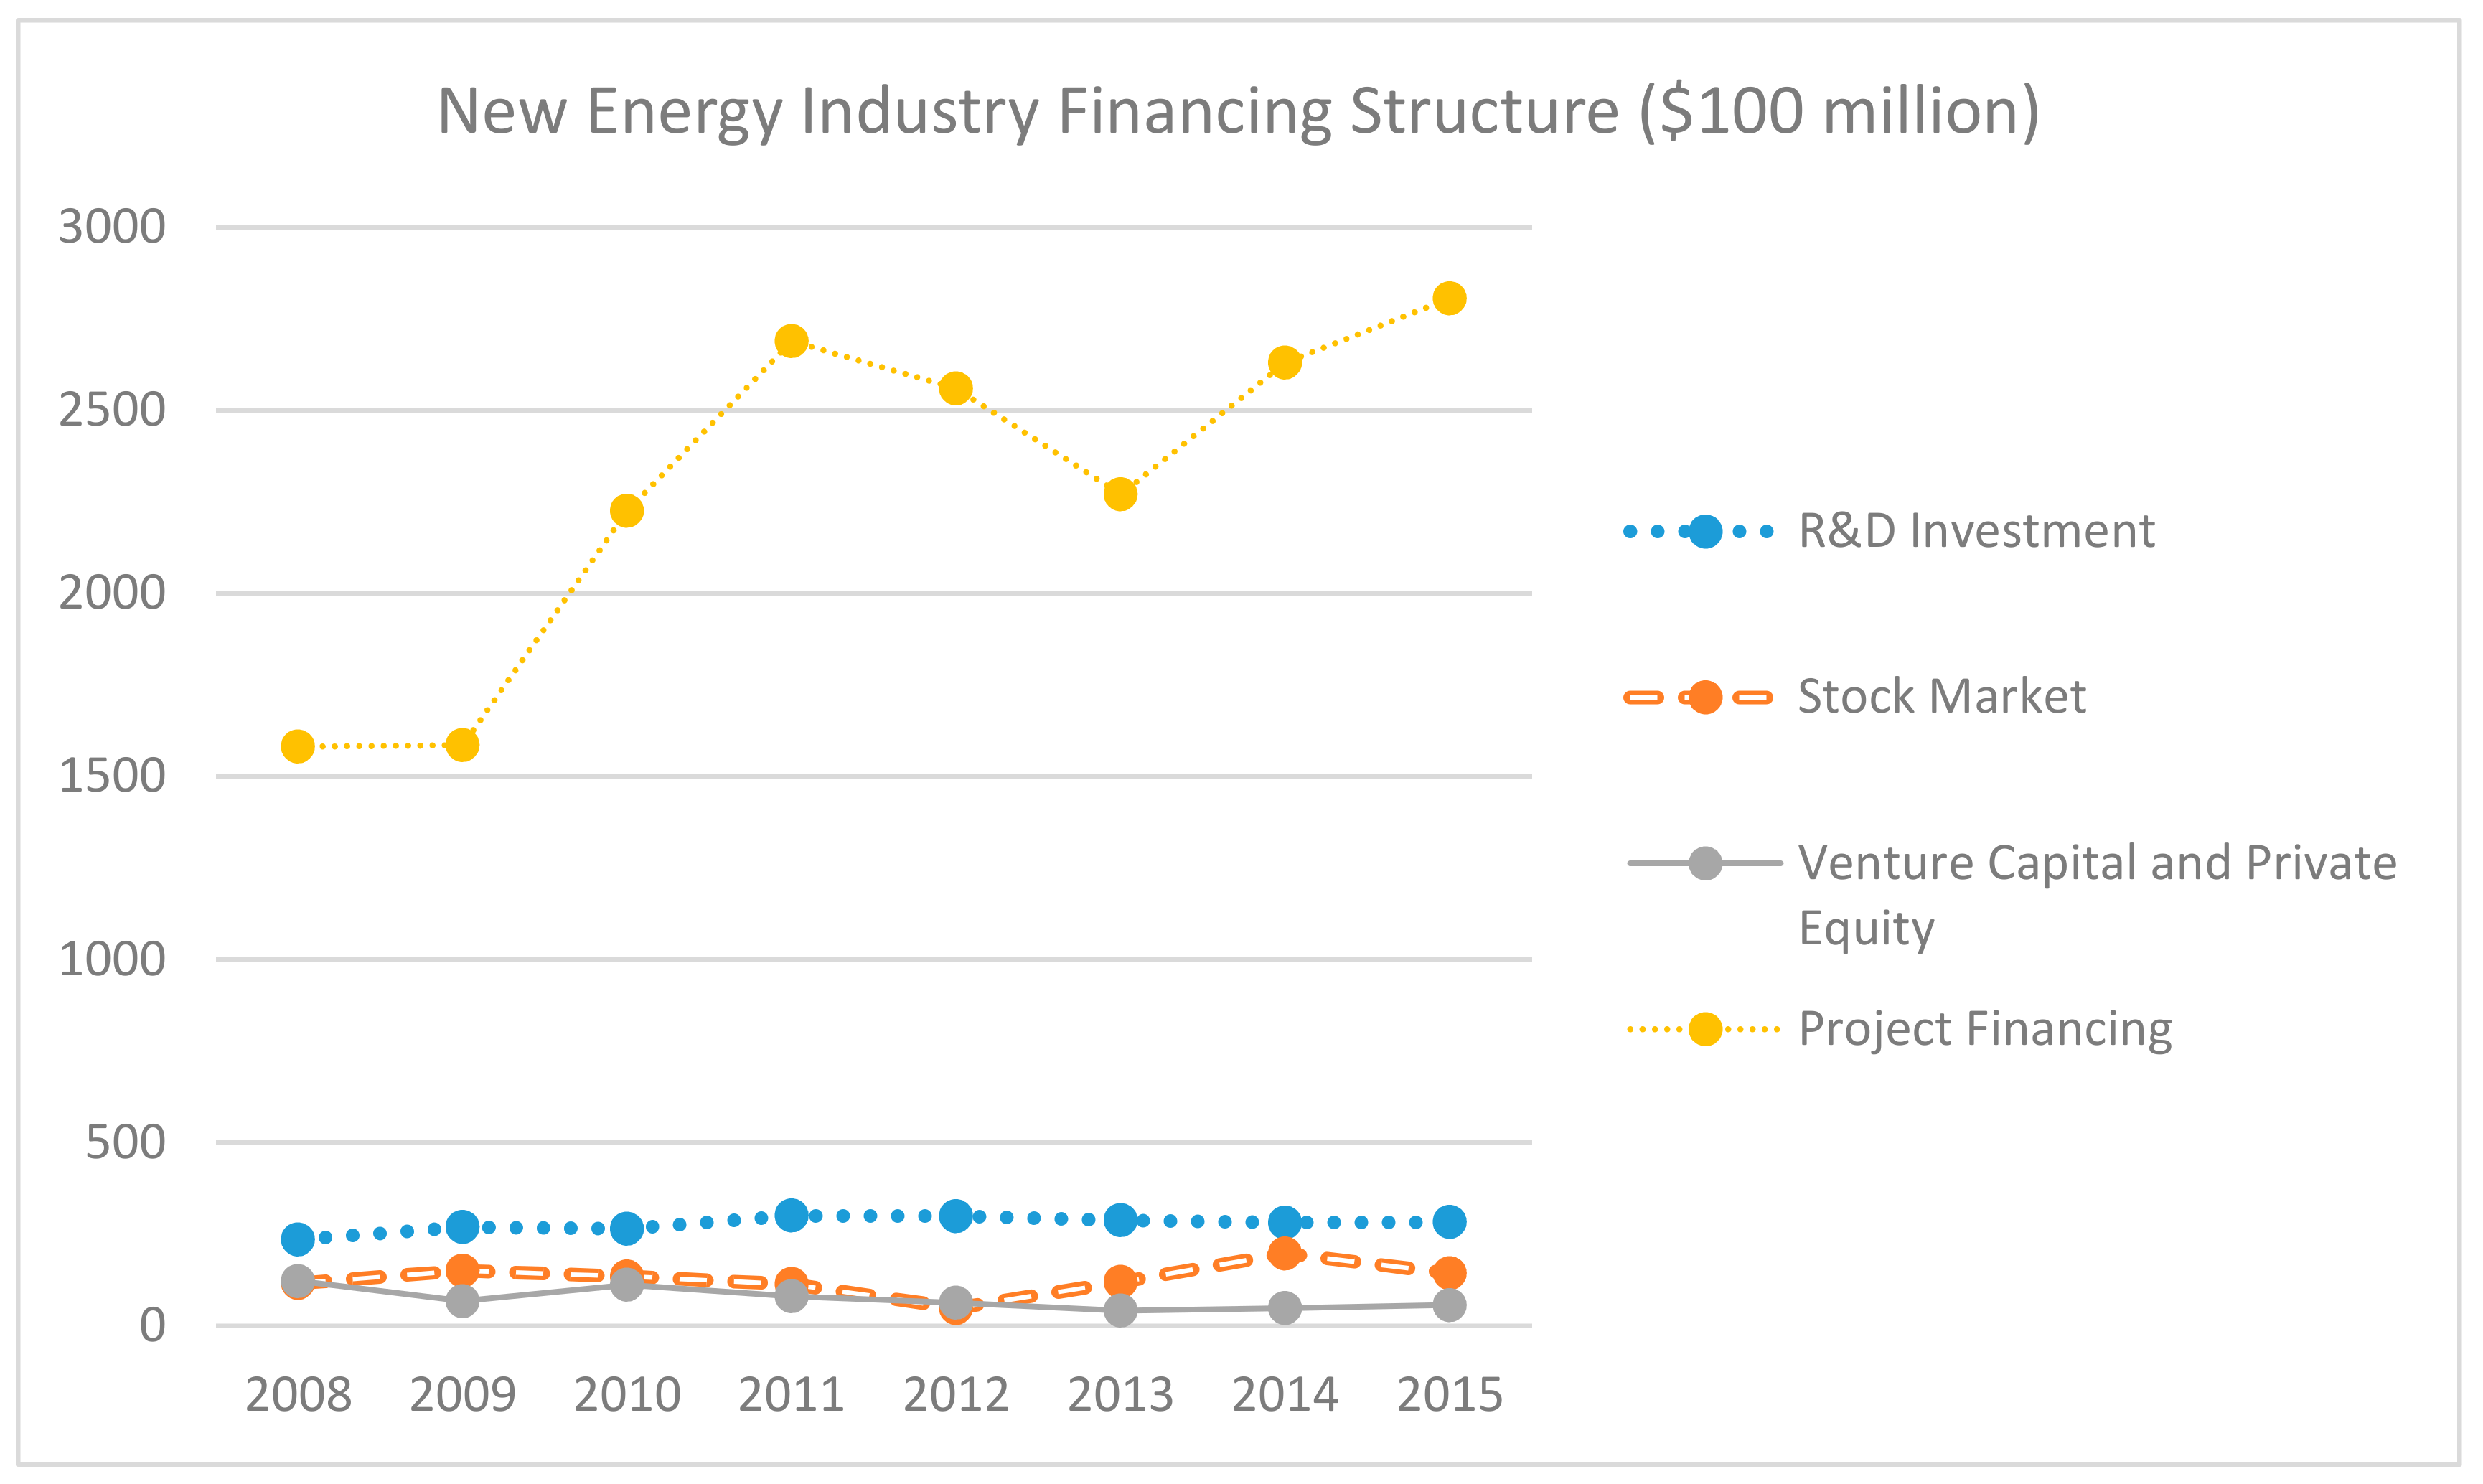
  • Project financing is a type of financing that the lender provides specific project financing, has repayment for the project cash flow, and takes the project assets as collateral. It is a financing way that repays the loan with the future earnings and assets of the project. As a new mode of financing, it has great operating space in the development and utilization of renewable energy. As can be seen from Figure 2, project financing accounts for a large proportion in the financing structure and is the main financing method of renewable energy industry.
  • Venture capital and private equity financing is a kind of investment that raises the capital investment for the highly uncertain high-tech enterprises or projects, expected by implementing the highest growth rate of the project, and gets ultimately higher revenues from the sale of equity through certain institutions and a certain way from various organizations and individuals.
Renewable energy industry financing channels basically include the above four types, so this paper mainly chooses R&D investment, stock markets, project financing, venture capital and private equity financing amount from 2008 to 2015 as input indicators (Figure 2).

3.2.2. Output Indicator

Given the availability of data on the output value of the renewable energy industry, this paper uses the total amount of generation by renewable energy sources as an indicator for the development of renewable energy industries. The total number of renewable energy sources includes solar, wind, biomass, geothermal energy and marine energy. When the renewable energy industry accelerates, the amount of renewable energy generated will grow rapidly.
As shown in Table 1, renewable energy financing efficiency evaluation index system is as follows:

4. Results

This research uses data envelopment analysis program (DEAP) 2.1 software, makes a calculation of 2008–2015 global renewable energy industry financing efficiency index. The following results are obtained:

4.1. Time Series Analysis

The Malmquist index reflects that the pure technical efficiency and scale efficiency of the dual influence the change of technical efficiency, technical efficiency and technical progress affect the change of total factor productivity. In the table, the value is greater than 1, which means that the efficiency of this category project in t + 1 year is higher than that in the year of t. If it is less than 1, otherwise;
From Table 2 it could be found that:
  • The average value of technical efficiency between 2008 and 2015 was 1.202, the maximum value was 2.019 and the minimum value was 0.815. There existed larger fluctuation range and the total efficiency was general. From the trend of the overall financing efficiency we could find that technical efficiency and pure technical efficiency was parallel. In the decomposition of the energy industry of renewable financing efficiency, pure technical efficiency on the efficiency of the overall financing force was stronger.
  • The renewable energy industry financing efficiency in 2010–2011 and 2013–2014 period was in decline, it showed a trend of different proportion of growth in the rest of the years, renewable energy industry’s overall financing efficiency was well, financing effect of four ways was remarkable.
  • The technical efficiency during 2011–2011 and 2013–2015 presented the downward trend, all the rest of the year presented a rising trend. The reason may be the countries all over the world have attached great importance to the field of renewable energy power generation as industrial support, financial support, but the narrow financing channel lead to poor performance financing efficiency in individual years.

4.2. Analysis of Different Industries

Based on the DEA’s C2R model and BC2 model, the comprehensive financing efficiency, capital using efficiency and capital scale efficiency of different renewable energy industries are analyzed and the results are as follows:
From Table 3 it could be found that:
  • On the whole, the average value of comprehensive financing efficiency of each industry was low. The comprehensive financing efficiency of wind power industry was highest, at 0.72, but it belonged to the weak efficient state and 28% of the investment did not get valid use. Most of the year has big ameliorative space. The financing efficiency of the remaining industries was generally low, it might account for that the blind investment in the renewable energy industry led to generally input redundancy and lower output efficiency. Although renewable energy industry developed rapidly, the stronger policy driving force and poor market initiative made the overall financing efficiency lower and earnings volatility larger in the face of big policy volatility and the condition of insufficient market demand. At the same time, the average capital using efficiency and the scale efficiency had equal effect the overall financing efficiency.
  • The capital using efficiency represented the maximum output at the given input when the scale was fixed. According to Table 3, it could be found that the fund using efficiency of photovoltaic industry, wind power industry, geothermal energy and ocean energy industry were generally higher, at 0.846, 0.968, 0.842, 0.968 respectively. It meant that after stripping out scale inefficiency, 15.4%, 3.2%, 15.8%, 19.8% of the fund was wasted because of mismanagement. In most years, the capital using efficiency was greater than 0.8; it indicated that the efficiency was higher, but there still existed a big room for improvement.
  • The scale efficiency of the geothermal energy industry and the marine energy industry were higher, which showed that some of the inputs were not fully utilized in these years and the resource allocation were not well. Among them, there were four years of valid scale efficiency of the marine energy industry and in the position of the constant state of scale compensation. It meant that the marine energy generation had reached the largest point in this investment.

4.3. Analysis of Different Financing Ways

Based on the DEA’s C2R model and BC2 model, the comprehensive financing efficiency, capital using efficiency and capital scale efficiency of different financing ways are analyzed and the results are as follows:
From Table 4 it could be found that:
  • On the whole, the average financing efficiency of the various financing was higher. The comprehensive efficiency of R&D investment and project financing was bigger, at 0.920 and 0.920 respectively, and efficiency in most years stayed above 0.9. Stock market and venture capital and private equity financing efficiency was low and had larger fluctuation. The reason may be that the equity financing cannot match the current and future demand for project funding scale, then relying on equity financing could not fully meet the demand of funds.
  • The capital using efficiency of R&D and project financing was higher, at 0.949 and 0.990 respectively; in most years, the capital using efficiency value is greater than 0.9. But there still existed room to improve. This also showed that the comprehensive financing efficiency was greatly influenced by the capital using efficiency.
  • The capital scale efficiency of R&D investment, venture capital and private equity was higher. The capital scale efficiency in most years was greater than 0.9. The stock market and the scale of the project financing efficiency was low and volatile; it mainly related to renewable energy industry characteristics itself. Because the renewable energy industry management products and services had a larger initial investment and the cycle was long, it needed continue occupying the market through the expansion of the scale.

5. Discussion and Conclusions

Prior work has measured the financing efficiency of the renewable energy industry from the perspective of enterprises the region. In this study, we analyzed the time series, different industries and methods financing efficiency of renewable energy industry in the world. The conclusions are drawn as follows: First, the financing efficiency is increasing year by year approximately, the technical efficiency average was 1.202, the technical progress average was 1.009, the pure technical efficiency average was 1.066, the scale efficiency was 1.128, and the total factor productivity was 1.213. The reason could be that the renewable energy industry has created a blind investment in the past few years, which has caused the renewable energy industry to overheat, leading to redundancy. In recent years, policy guidance and support have made the renewable energy industry financing effectively. Second, the comprehensive financing efficiency of various industries was generally low, among which the comprehensive financing efficiency of wind power industry was the highest, which is 0.72, but it was at weak effective state. The wind power industry presents a trend of rapid growth and the technology has been mature in all parts of the world. It is the main force of the renewable energy industry, and its low cost can attract more valid financing [20]. In addition, the capital scale efficiency of marine energy and geothermal energy industry was relatively high, indicating that appropriate expansion of industrial scale can make financing efficiency more effective. Third, project financing comprehensive efficiency was the highest, with an average of 0.830, among which the capital using efficiency was 0.990 and the capital scale efficiency was 0.839. As a new way of financing, project financing was complex, it could help solve the problem of renewable energy enterprise initial poor credit rating and the renewable energy enterprise diversification risk at this stage. This conclusion was consistent with Jiang (2016). The risk prevention was the main reasons of the lack of venture capital for renewable energy industry, thus restricted the rapid development of renewable energy industry.
Our results have important implications for policy makers. Although the financing efficiency of the whole renewable energy industry was increasing gradually, the efficiency of industry financing was generally low. The development of the renewable energy industry requires a benign, market-based environment and financial support system. Therefore, policy makers must determine the source of the low efficiency and formulate appropriate policies and strategies in order to improve the financing efficiency. First of all, each country should choose priority development of renewable energy industries according to the local conditions, for instance, development of wind power production in Asian countries was better, so these countries can increase the R&D input or other financing way to the wind power industry in order to improve the financing efficiency. Secondly, we should accelerate the development of venture capital related to the technology development of renewable energy industries and establish a renewable energy venture capital investment mechanism to cope with the high risk and the long-term investment returns. We should make full use of the new financing means to increase support for the renewable energy industry exhibition. For example, as a new mode of financing, project financing has great operational space in the development and utilization of renewable energy. We can consider the financing of the infrastructure BOT (build-inch-transfer) to raise funds for renewable energy projects [21]. Finally, in addition to the traditional financial way of giving support, it is important to channel financial institutions into the renewable energy industry and innovative businesses to support the development of the renewable energy industry. Beyond that, we ought to accelerate financial innovation in terms of systems, products and models, and flexibly design corresponding solutions and services to enhance the means and strength of support. Therefore, the government should raise the threshold of the new energy industry and reduce the financing risk. Combining the traditional financing loans with the capital market, venture capital, private equity and other green financing channels is significant. In addition, the perfect combination of financial product innovation and increasing industrial investment fund, project financing, private capital and foreign exchange can broaden the financing channels and improve the financing efficiency of the renewable energy industry entities. In conclusion, renewable energy finance system should be based on the renewable energy industry chain with the aid of financial instruments, from the initial financing to integrating resources in the middle, then finally realizing its value of appreciation.

Acknowledgments

All Our research is supported by China Scholarship Council (201506710041).

Author Contributions

Xiaohuan Lyu and Anna Shi conceived and designed the experiments; Xiaohuan Lyu performed the experiments; Xiaohuan Lyu analyzed the data; Anna Shi contributed reagents/materials/analysis tools; Xiaohuan Lyu and Anna Shi wrote the paper.

Conflicts of Interest

The authors declare no conflicts of interest.

References

  1. International Energy Agency. Available online: http://www.iea.org/ (accessed on 26 November 2017).
  2. Bloomberg New Energy Finance. Available online: https://about.newenergyfinance.com/about/ (accessed on 2 December 2017).
  3. Modiliani, F.; Miller, M.H. The Cost of Capital, Corporation Finance, and the Theory of Investment. Am. Econ. Rev. 1958, 48, 125–143. [Google Scholar]
  4. Li, L.B.; Liu, B.L.; Liu, W.L.; Chiu, Y.H. Efficiency evaluation of the regional high-tech industry in China: A new framework based on meta-frontier dynamic DEA analysis. Soc. Econ. Plan. Sci. 2017, 60, 24–33. [Google Scholar] [CrossRef]
  5. Lu, T.; Yan, B.W. The Study of the DEA Method Model for University Teaching Quality Assessment and Benefit Analysis. Phys. Proc. 2012, 5, 1187–1191. [Google Scholar] [CrossRef]
  6. Wu, L.; Li, H. Analysis of the development of the wind power industry in China—From the perspective of the financial support. Energy Sustain. Soc. 2017, 7, 37. [Google Scholar] [CrossRef]
  7. Ng, T.H.; Tao, J.Y. Bond financing for renewable energy in Asia. Energy Policy 2016, 95, 509–517. [Google Scholar] [CrossRef]
  8. Mazzucato, M.; Semieniuk, G. Financing renewable energy: Who is financing what and why it matters. Technol. Forecast. Soc. Chang. 2018, 127, 8–22. [Google Scholar] [CrossRef]
  9. Krupa, J.; Harvey, L.D.D. Renewable electricity finance in the United States: A state-of-the-art review. Energy 2017, 135, 913–929. [Google Scholar] [CrossRef]
  10. Jiang, X.L.; Duan, Y.C. Research on financial support system for new energy enterprises based on life cycle theory. Mod. Manag. Sci. 2016, 10, 24–26. [Google Scholar]
  11. Jiang, X.L.; Wang, Y.; Lyu, D.K. Financial support path analysis in the development of new energy industry. Econ. Asp. 2010, 8, 50–53. [Google Scholar]
  12. Kabir, E.; Kumar, P.; Adelodun, A.A.; Kim, K.H. Solar energy: Potential and future prospects. Renew. Sustain. Energy Rev. 2018, 82, 894–900. [Google Scholar] [CrossRef]
  13. Zeng, S.; Jiang, C.; Ma, C.; Su, B. Investment efficiency of the new energy industry in China. Energy Econ. 2017. [CrossRef]
  14. Deng, H. Research on Financing Efficiency of New Energy Industry in China. Master’s Thesis, South China University of Technology, Guangzhou, China, 2015. [Google Scholar]
  15. Zhao, B. The impact of financing method and enterprise nature on financing efficiency—Based on empirical research on China’s new energy industry. J. Commer. Econ. 2016, 17, 180–182. [Google Scholar]
  16. Zheng, D. Research on Financing Efficiency of Listed Companies in China’s New Energy Industry. Master’s Thesis, South China University of Technology, Guangzhou, China, 2015. [Google Scholar]
  17. Zhu, Y.; Zhou, S.; Feng, Y.; Hu, Z.; Yuan, L. Influences of solar energy on the energy efficiency design index for new building ships. Int. J. Hydrogen Energy 2017, 42, 19389–19394. [Google Scholar] [CrossRef]
  18. Despotis, D.K.; Koronakos, G. Efficiency Assessment in Two-stage Processes: A Novel Network DEA Approach. Proc. Comput. Sci. 2014, 31, 299–307. [Google Scholar] [CrossRef]
  19. Serras, F.R.; Marques, A.C.; Fuinhas, J.A. Evaluating the Impact of New Renewable Energy on the Peak Load—An ARDL Approach for Portugal. Energy Proc. 2016, 106, 24–34. [Google Scholar] [CrossRef]
  20. Gavrila, H.; Manescu, V.; Paltanea, G.; Scutaru, G.; Peter, I. New Trends in Energy Efficient Electrical Machines. Proc. Eng. 2017, 181, 568–574. [Google Scholar] [CrossRef]
  21. Li, J.; Liang, X.; Reiner, D.; Gibbins, J.; Lucquiaud, M.; Chalmers, H. Financing new power plants ‘CCS Ready’ in China—A case study of Shenzhen city. Energy Proc. 2011, 4, 2572–2579. [Google Scholar] [CrossRef]
Figure 1. Renewable energy and fossil energy project financing. Note: data is from https://about.new energy finance.com/about/.
Sustainability 10 00222 g001
Figure 2. Renewable energy industry financing structure.
Sustainability 10 00222 g002
Table 1. Renewable energy financing efficiency evaluation index system.
Indicator HierarchyBasic IndicatorUnit
InputR&D Investment$100 million
Stock Market$100 million
Venture Capital and Private Equity$100 million
Project Financing$100 million
OutputRenewable Energy GenerationTWh
Table 2. Time series analysis of financing efficiency of renewable energy industry.
YearEffchTechchPechSechTfpch
2008–20092.0190.5851.411.4321.181
2009–20101.3051.0621.0641.2261.386
2010–20111.2660.7711.0871.1640.976
2011–20120.991.5790.9721.0191.564
2012–20131.490.7911.1051.3481.178
2013–20140.9031.0191.0020.9010.92
2014–20150.8151.7460.8880.9191.423
Min0.8150.5850.8880.9010.92
Max2.0191.7461.411.4321.564
Average1.2021.0091.0661.1281.213
Note: “Effch” represents technical efficiency; “Techch” represents technical progress efficiency; “Pech” represents pure technical efficiency; “Sech” represents scale efficiency, “Tfpch” represents productivity efficiency.
Table 3. Time series analysis of financing efficiency of different renewable energy industries.
IndustryPhotovoltaicWind PowerBiomassGeothermalMarine Energy
YearCrsteVrsteScaleCrsteVrsteScaleCrsteVrsteScaleCrsteVrsteScaleCrsteVrsteScale
20080.1740.8390.2070.4211.0000.4210.0800.2550.3151.0001.0001.0000.3921.0000.392
20090.3011.0000.3010.5070.9750.5200.1190.3630.3290.5850.5920.9880.2220.5670.392
20100.4060.8480.4790.5090.8110.6280.1720.3530.4860.6211.0000.6210.5430.7540.720
20110.3370.5200.6480.7190.9870.7290.1660.3220.5170.4791.0000.4790.5470.7600.720
20120.4830.6800.7100.7921.0000.7920.4140.4390.9420.7560.9290.8140.7930.7931.000
20130.8210.9580.8570.8951.0000.8950.5160.5610.9190.5980.7100.8430.9680.9681.000
20140.8570.9180.9340.9160.9690.9460.5370.6010.8930.6090.6550.9300.5780.5781.000
20151.0001.0001.0001.0001.0001.0001.0001.0001.0000.8300.8510.9751.0001.0001.000
Average0.5480.8460.6420.7200.9680.7410.3760.4870.6750.6850.8420.8310.6300.8020.778
Note: “crste” represents comprehensive efficiency (regardless of scale return); “vrste” represents pure technical efficiency (consider scale return); “scale” represents scale efficiency (consider the scale return), pure technical efficiency and scale efficiency are the segmentation of comprehensive efficiency.
Table 4. Efficiency of different financing ways.
R&D InvestmentStock MarketVenture Capital and Private EquityProject Financing
YearCrsteVrsteScaleCrsteVrsteScaleCrsteVrsteScaleCrsteVrsteScale
20080.9221.0000.9220.3390.4160.8160.2880.3360.8590.9981.0000.998
20090.8100.8770.9230.2640.3220.8190.5270.6110.8621.0001.0001.000
20100.9570.9880.9680.3420.3590.9530.3680.3690.9970.8290.9990.830
20110.9230.9280.9940.4450.9810.4540.5590.6150.9080.7510.9890.759
20120.8900.9060.9821.0001.0001.0000.6870.7170.9570.7560.9570.791
20130.8780.9070.9670.2850.4060.9501.0001.0001.0000.8100.9730.832
20140.9810.9880.9930.2540.5300.4800.9291.0000.9290.7641.0000.764
20151.0001.0001.0000.3591.0000.3590.8191.0000.8190.7351.0000.735
Average0.9200.9490.9690.4240.6270.7290.6470.7060.9160.8300.9900.839

