Article

Policy Influence on Consumers’ Evolution into Prosumers—Empirical Findings from an Exploratory Survey in Europe

by
Kirsi Kotilainen
1,2,3,* and
Ulla A. Saari
1
1
Faculty of Business and Built Environment, Tampere University of Technology, 33720 Tampere, Finland
2
Faculty of Management, University of Tampere, 33100 Tampere, Finland
3
Faculty of Business and Economics, University of Lausanne, 1015 Lausanne, Switzerland
*
Author to whom correspondence should be addressed.
Sustainability 2018, 10(1), 186; https://doi.org/10.3390/su10010186
Submission received: 5 December 2017 / Revised: 4 January 2018 / Accepted: 9 January 2018 / Published: 13 January 2018

Abstract

:
The energy sector is in transition to a flexible and sustainable energy system based on renewable energy sources. This complex transition is affecting multiple levels in the sociotechnical system. One driver of the transition is climate change that enforces the policy push from the macro level to change the way energy is produced, delivered, and used. As part of the energy system evolution, the role of the end user in the energy sector is undergoing profound changes, and consumers are increasingly being empowered to participate actively in the production and use of energy. This article investigates how policies might affect consumers’ interests in becoming prosumers of energy. We explore consumers’ attitudes toward using renewable energy technologies (RET) by means of an empirical consumer survey that was conducted in five European countries. The partial least squares structural equation modeling (PLS-SEM) method was utilized to analyze the survey results. Our findings suggest that both economic and non-economic policies affect consumer attitudes toward using renewable energy technologies. We conclude that policies have different effects on consumers and prosumers, who have already made the decision to adopt renewable energy solutions. Based on the findings, we propose a set of policy and managerial implications.

1. Introduction

The main drivers of the transformation in the energy system are the requirement for better energy efficiency due to the ever-increasing demand for energy and the need to increase the use of renewable energy sources because of climate change and the shortage of traditional energy resources [1]. For example, the demand for electricity is expected to increase globally by 80% between 2012 and 2040 [2], which demonstrates the importance of putting energy efficiency on the agendas of governments and policy makers. To meet the growing demand for energy and comply with ecological and economic demands, the structure of the energy market is slowly moving centralized system to a more interactive and decentralized model in which consumers may also play a role as prosumers, that is, as producers and consumers of energy. Furthermore, the roles of the incumbent actors in the energy regime are changing, and new actors are entering the energy market from other industries.
In conjunction with the gradual change in energy production and consumption is the emergence of new technological solutions and business models. Widespread digitalization and industry convergence have created an open network of actors, information, and technology. The integration of the Internet of Things (IoT) into the power grid has led to completely new possibilities for managing the energy system. As a result, the Internet of Energy (IoE) allows real-time data to be collected, transferred, stored, analyzed, and monitored on multiple levels of the energy system, which has opened a range of opportunities to utilize energy production and consumption information.
The transition in the energy industry is complex, and it affects many levels of society. The focus of energy generation is moving from centralized fossil fuel-based power plants toward renewable energy source (RES)-based distributed energy resources (DER). To fulfill its efficiency and sustainability goals, the energy ecosystem will need a dynamic prosumer base to participate in the implementation of the DER as well as to provide flexibility in the grid through demand response (DR). In the energy market, prosumers are seen as niche actors that are potential catalysts of the changing energy system. A frequently used example of an energy prosumer is a household that produces all or part of its energy by using solar panels (solar photovoltaic (PV)) or other renewable energy technology (RET). Although there are many opportunities for consumers to participate actively in the energy markets, many have not yet done so. Moreover, although there is a consensus among policy makers and industry experts that renewable energy solutions should be self-reliant and independent of subsidies in the long run, it is also widely accepted that the diffusion of pro-environmental technologies requires policy support in the early phase of the market. Hence, policy makers around the world are designing policies to remove some of the barriers that are assumed to slow down the consumers’ adoption of renewable energy technologies.
The main objective of this research is to evaluate how policies affect consumers’ willingness to adopt renewable energy technology-based products and services. Our goal is to evaluate the effects of economic and non-economic policies on consumers’ attitudes toward adopting renewable energy technology solutions. The remainder of this paper is structured as follows: Section 2 provides a review of the literature on the theoretical background of the study; Section 3 introduces the conceptual model and the core constructs used in the analysis; Section 4 outlines the data collection and the analysis; Section 5 summarizes the results; Section 6 discusses the findings and their implications for policy and management; and Section 7 concludes the paper.

2. Theoretical Background

2.1. Energy Prosumers, Renewable Energy Technology and the Barriers to Adopting

The concept of a prosumer was first developed by Alvin Toffler, author of The Third Wave [3]. Since then, the concept has been defined further by others (e.g., [4]), especially in the context of mass-customization, marketing and media. In the energy field, the definition of a prosumer simply refers to prosumers as consumers who also produce, sell, trade, or store energy [5]. When a more specific definition is required, the use of smart appliances, communication technologies, electric vehicles (EVs) and battery storage capacities for flexible services are included in the definition [6]. In effect, the act of prosuming changes the consumer from merely a reactive end customer to being an active participant in the energy system. At best, prosumers have the potential to create added value not only for themselves but also for the various parties in the energy sector, such as their neighbors, utilities, other energy industry actors, and even society at large.
Some definitions of energy prosumers emphasize different aspects of the prosumer’s involvement in the energy field [7]. A technical approach links prosumers to plug-in electric vehicles (EV), energy technologies, automation, and smart buildings. Furthermore, in the social approach to prosuming, the following aspects are often highlighted: prosumers can form energy communities or virtual power plants (VPPs), in which they share or trade energy and thus increase the importance of DER. Prosumers can also be seen as co-creators of innovation through giving feedback, lead-testing products, and participating in co-development [8,9]. Utilities are focusing on extending the DR from industrial customers to households. In this scenario, prosumers could be EV owners with a vehicle-to-grid (V2G) connection [10] that allows them to offer their batteries for balancing loads during peak hours [11].
The concept of RET is broad, and the term is used freely according to the context. Energy prosumers are associated mainly with electricity, but in some cases they are also associated with heating and transport [12]. For example, energy prosumers could use the following technologies: solar photovoltaics (PV), micro wind energy, geothermal energy, small scale combined heat and power (CHP; e.g., biogas), and hydropower. In this research, we refer to RET as a technology, product, or service that enables or supports the use of renewable energy sources (RES) at the household level. The RET technologies that are relevant in our research include: electricity and heating systems based on solar PV, wind turbines and geothermal heat pumps, smart meters, energy monitoring devices and applications, and EVs with battery storage. RET technologies enable consumers to self-produce energy, store energy, sell or share energy as well as monitor and adapt their energy production and consumption. Most RET solutions require the availability of a smart grid technology that enables two-way information and energy flows between production and consumption.
Although there would be multiple rational benefits for consumers to use RET, its diffusion is still in the early market phase. Potential barriers to adopting solar PV are sociotechnical, economic, management related, and policy related [13]. The sociotechnical issues related to adoption are related to concerns about quality and the lack of knowledge of benefits. The perceived complexity of the RET system may have a large impact on adoption [14]. Similarly, concerns about technological maturity, efficiency, and safety can reduce the interest in adopting RET. Risks related to data privacy and security are relevant in smart grids that generate and transfer large amounts of user data. In general, because of the lack of awareness of its benefits, the adoption of RET has been given low priority. Moreover, the optimal RET system requires several components: a smart meter, a solar PV or other energy production system, an energy monitor, an Internet connection, a business agreement with a utility company, and so on. However, to date, turnkey solutions for RET have developed slowly, which adds to the complexity of acquiring RET. Economic barriers to the adoption of RET are often related to the relatively high investment that is required. For example, in some countries, as many as 15–20 years are required to pay back the investment. In addition, the operational costs of RET are not understood or are difficult to calculate by consumers. Because RET systems are generally not profitable without policy support in the early phase, supporting policies are vital tools for the diffusion of RET (e.g., [15]).

2.2. Sustainability Transition of the Energy Markets and the Need for Policy Support

Recent developments in the energy sector, especially in developed countries, indicate that the energy system is evolving into an open, flexible, and sustainable system in which new actors and new business models could flourish. This sociotechnical transition, however, is complex and requires the right windows of opportunity for novel operating modes to emerge and sustain. The multi-level perspective (MLP) [16] suggests that in sustainability, transitions pressure is needed on both the macro-level and the micro-level (i.e., the niche markets), to facilitate changes in the energy regime, which currently aims to remain stable and unchanged. Indeed, energy prosumers can be seen as emerging niche actors whose role is evolving in synchronicity with the rest of the energy industry.
Can and will the prosumer base grow and become a meaningful entity in the future energy system? The role of consumers has been widely acknowledged to be significant in mitigating climate change. Moreover, policy support is a critical accelerator of sustainability transformations. Governments have introduced policy measures to support the adoption of environmentally sustainable solutions that are based on RES and can help in reducing carbon emissions. However, in some cases, the policy incentives are not sufficient. Furthermore, many governments still use subvention to support fossil fuel-based energy use, which can make investments in RES a less attractive option. Policy makers and industry experts agree that macro-level policies in the form of incentives, taxation schemes, and legislative enablers are needed to boost consumers’ adoption in the early phases of the diffusion of environmental innovations. Environmental policy instruments (EPI) have been introduced to complement traditional regulations to achieve environmental goals. Basic public policy instruments can be divided into regulatory instruments, financial instruments, and information transfer (e.g., [17]). Their level of coerciveness is often used to categorize the policies (e.g., [18]). Coerciveness is determined by the ways in which the instrument is designed, implemented, and enforced [19]. EPIs can be categorized in several ways. For example, the OECD [20] has used the following categorization: command-and-control, economic instruments, liability and damage compensation, education and information, voluntary approaches, and management and planning. A simpler classification of EPIs refers to them as “market based” and “command-and-control”, or “economic” and “non-economic”. In this article, we use the latter categorization.
Economic instruments can be effective in promoting desired activities. For example, they have been useful in strengthening market-based drivers to reduce carbon emissions [17]. Economic instruments can be also used to discourage unwanted activities, such as polluting. Examples of economic policies are emission trading schemes, public investments, tax credits, public funding, and subsidies. Economic policy instruments have been found to create lock-ins and path dependencies for technologies. For instance, fossil fuel-based power generation is still widely subsidized because of its importance in economic growth that is often dependent on low-cost energy [21,22].
Non-economic instruments include the command-and-control and soft instruments. Command-and-control instruments are used to support the emergence of the right market conditions for innovative products and services. They include regulations such as carbon emission restrictions, technology and performance standards, feed-in tariffs, and tradable certifications [23]. They also typically impose sanctions in cases where the policies are not followed. Regulation can be efficient in steering toward the desired outcomes, but it has also proven to be resource intensive [24]. Furthermore, although regulations are aimed at all actors, in practice, smaller players with fewer resources and less ability to fight bureaucracy may not be able to benefit from them, which can apply especially to consumers’ possibilities to expand their role in the energy sector. Soft instruments include information campaigns, environmental labeling, and voluntary actions. In particular, information tools can be effective in shaping public opinion and in boosting the acceptance of new environmentally friendly solutions [17]. Information tools and building awareness in general play an important role in technology diffusion [25,26].
The policies are also relevant from a sociotechnical viewpoint: most of the command-and-control policies are driven from the macro-level. EU directives, for instance, are meant to influence the system from the top down, whereas innovative voluntary approaches and self-regulation can emerge from the bottom up at the micro-level. Several macro-level policy instruments regulate the possibilities of DR and microgeneration [22,24].

2.3. Diffusion of Innovations

To fully harness the potential of the emerging energy system to be sustainable, there is an urgent need to accelerate the adoption of RES among consumers. The diffusion of innovation (DOI), or innovation diffusion theory (IDT), was first introduced by Rogers [27], who explained the process of innovation adoption over time. A new technology or an innovation is adopted by categories of adopters in a temporal sequence. These adopter categories are as follows: Innovators, Early Adopters, Early Majority, Late Majority, and Laggards [27]. The early market, including innovators and early adopters, adopts the innovation first and the subsequent adopter groups follow. Most innovations fail to cross “the chasm” [28] between the early and the late markets. Special characteristics are related to the diffusion of pro-environmental innovations: consumers may be willing to pay more for environmental innovations; there is a need for policy support in the early phases; and a behavioral change is often required.
According to the IDT, the consumers’ acceptance of a new technology takes place in different stages: knowledge, persuasion, decision, implementation, and confirmation. We are especially interested in the persuasion and the decision stages, that is, whether the consumer will adopt or reject RET. The five factors [29] related to the persuasion characteristic in adopting a new technology are relative advantage, compatibility, complexity, trialability, and observability. The factor of relative advantage refers to the net benefits of a new technology or innovation. The perceived costs of adopting an innovative product may decrease the relative advantage. These costs include financial costs and risks, concerns about complexity, and the lack of expected functionality. Concerns about data privacy and energy security may be relevant to energy prosumers and might affect the perceived relative advantage of RET [30]. Benefits related to RET can include savings in energy costs, trophy value, increased awareness of energy consumption, and so on. The economic benefits of RET often materialize over time, which has been found to decrease consumers’ interests in adopting PV, for example [31]. The environmental benefits of RET have been studied extensively in the context of technology acceptance and adoption; for example, environmental reasons have been the basis of the main arguments to the usage of smart metering [32,33]. The factor of compatibility refers to how well the new technology fits with the consumer’s existing way of living. In cases where the adoption of RET requires changing behavior, the interest may decrease especially if the individual is a late market adopter [29]. A well-known motivation for consumers to change their behavior is a price incentive, which is often induced by policy instruments [34]. Complexity can affect the willingness to adopt; products that are perceived as complex commonly have longer diffusion times than those that appear to be easy to use [29]. Early adopters, who often are technology enthusiasts, are usually not concerned about complexity, whereas mass-market users expect ease of use [29]. The factor of trialability relates to the ability to test the innovation in a risk-free setting at minimal cost. For example, the availability of an option to lease may lower the threshold for adopting a new technology. Trialability is particularly important for early market users who are interested in trying new technologies and giving feedback [29]. Observability is an important factor for late market adopters, who often rely on the recommendations of the peers in their social circles [29].

2.4. Technology Adoption Models

Energy prosumers often need to make considerable financial investments in RET. These initial investment costs and the expected long period before return on investment is realized in the current energy sector undeniably influences consumers’ decision-making, such as in relation to solar PV equipment. However, some RET products do not have a significant cost attached. Several other aspects in addition to financial considerations affect consumers’ willingness to become active in adopting new energy solutions. The research on active consumers and consumer decision-making is thus multi-disciplinary, and research approaches encompass as least rational economic models (i.e., the consumer or prosumer as a “Homo economicus”), behavioral economics, sociology, psychology, and technology adoption and diffusion models. The IDT is one approach to understanding consumers’ adoption of energy technologies. Traditional economics considers that consumers rationally optimize their benefits with the resources available. However, the rational approach has been proven to be a great oversimplification of a complex topic [35]. Environmentally sustainable behavior may require additional efforts (e.g., recycling and using public transportation) and behavioral adaptation (energy conservation, energy production, and using EVs). Thus, the complexity of behavioral change related to the consumer decision-making process is widely acknowledged in the literature. The motivation to invest in the self-production of energy is a popular research theme. For example, Balcombe et al. [36] conducted a study on microgeneration adoption and categorized the motivation factors as finance, the environment, security of supply, uncertainty and trust, inconvenience, and impact on residence. Intrinsic and extrinsic motivations [37] have been linked to the adoption of new technologies. The psychological research on consumers’ decision-making related to energy and environmental innovations has focused on the value-belief-norm (VBN) theory [38]. Fishbein and Ajzen’s theory of reasoned action (TRA) [39] and Ajzen’s theory of planned behavior (TPB) [40] have been used in the sociological approach. The TRA and TPB models are central in understanding pro-environmental behavior. Both theories link beliefs, attitudes, perceptions, and subjective norms to intentions that predict actual behavior. The technology acceptance model (TAM) [14,41] and its extensions are based on the same logic; the perceived usefulness and perceived ease of use lead to an attitude toward using something that can predict intentions to use a new technology and an entirely new system.
The original TAM, which was developed by Davis [14], is depicted in Figure 1. The model has six key elements: external factors, perceived ease of use, perceived usefulness, attitude toward using, behavioral intention to use and actual use of the system. Perceived ease of use affects both the perceived usefulness and the attitude toward use. Perceived usefulness also affects the behavioral intention to use, which ultimately influences the actual use of the system. The TAM model shares several similarities with the IDT, and it has been used widely in modeling technology acceptance in various types of information systems (IS) (e.g., [42,43,44,45]) and in other fields, such as health technologies [46]. Recently, the TAM and its modifications have been increasingly used in energy and sustainability related studies (e.g., [31,47,48,49]). The TAM was further developed by Venkatesh et al. [50] into a broader model, which includes social influence and other factors that were not included in the original TAM. Although widely used in research, the technology adoption models have also been criticized as there is evidence that the consumers’ pro-environmental attitudes may not be a strong determinant of their actual intentions; several studies have identified gaps between attitudes, intentions and behavior [51,52,53,54].

3. Conceptual Model

Our research aims to understand how policy influences the evolution of consumers into prosumers. We approach this aim by seeking to answer the following research questions (RQ):
  • RQ1: Does policy influence consumer attitudes toward using renewable energy technologies?
  • RQ2: How do economic or non-economic policies affect consumers’ attitude to adopt?
We use the TAM and the IDT and to some extent the TRA as the theoretical basis of this research. These theories have been rigorously tested and proven to work in the context of high technology, in which RET fits perfectly even through to our knowledge, the TAM has not been used to model the influence of policy on technology acceptance. An increasing number of studies have suggested that the TAM, the TRA, or their adaptations can be a suitable tools for modeling RET [55,56]. In addition to TAM, we also utilize the theoretical premises related to environmental policy instrument design in our research design.
To answer the research questions, we constructed a conceptual model as the basis of the empirical research. The model was built in three phases. First, a set of significant barriers to adopting RET were used to connect policies and policy instruments with technology adoption models in order to establish a logical association between the two (see Table 1). The barriers can be linked with the perceived usefulness and the perceived ease of use (in the TAM). To ensure that elements not fully present in the TAM are all taken into consideration, we further linked the barriers to the IDT elements. For example, the lengthy investment payback time is related to the perceived usefulness (in the TAM) as it weighs the value of RET as perceived by the potential adopter [14]. Similarly, the payback time is related to the relative advantage as it measures the overall all cost-benefit ratio of RET [29,57]. We categorized the policies as either economic or non-economic. For example, economic policies normally include policy instruments such as subsidies, governmental loans and grants, and tax exemptions and non-economic policies include regulation, changes in legislation and bureaucracy, information and education [17,19,23]. These can be associated with the perceived usefulness (in the TAM model) and the relative advantage (in the IDT) of the technology. In the case of the lengthy investment payback time, using economic policies have been found to be effective [17]. The rest of the adoption barriers were linked to theory (TAM and IDT) and further to the policy types and policy instruments in the corresponding manner.
Second, we defined the measurement items and the core constructs that are used in the empirical research. The economic policy instruments include financial incentives such as subsidies, loans and grants, tax reliefs and penalties, tariffs, ways of reducing monthly electricity bills. and ensuring the safety of consumption data [17,19,23]. Correspondingly, the non-economic policy instruments encompass both command-and-control instruments and soft instruments. They include information campaigns, regulations, laws, permits, and standardizing [17,19,23]. The constructs for economic policy (EP) and non-economic policy (NEP) were created based on adaptation from these commonly used environmental policy instruments; for example, a subsidy or grant is an economic policy instrument. Subsequently, the measurement items related to the policy instruments were designed for the EP and NEP constructs adapting them from earlier research (as indicated in the Table 2). For example, the importance of subsidy or grant when considering RET investment was adapted from Faiers [57] and was operationalized as measurement item for EP1: “I can get a grant from the government for the investment”. Similarly, policies related to the security and accuracy of data were operationalized as: “My consumption data is being managed securely by my energy utility” (EP5, see e.g., [67]). Table 2 summaries the policy related constructs EP and NEP.
Third, after defining the policy-related core constructs and the survey items, we then used the original version of the TAM [14] as the foundation for the rest of the conceptual model. First, we created constructs for perceived ease of use and perceived usefulness first. Because the TAM has only one element for “perceived usefulness” (PU), we wanted to understand how economic policy and non-economic policy affect perceived usefulness and whether it was then necessary to divide PU into two parts: economic and non-economic. In earlier research, PU was not split; therefore, our approach is explorative because it deviates from the TAM in this regard. Constructs presented in Table 3 were created to test perceived economic (PUE) and perceived functional usefulness, which we termed as perceived usefulness, functional (PUF). For example, possibility to generate revenue using RET can affect how relative advantage (as in the IDT) or PU (as in the TAM) are perceived. This can be operationalized as in PUE1: “I can sell excess energy to utility company”. The rest of the PUE and PUF constructs were created in the similar manner, adapting or modifying them from earlier research (see Table 3). The Table 3 also introduces the constructs related to perceived ease of use (PEOU). For example, complexity (as in the IDT) and perceived ease of use (as in the TAM) can affect the willingness to adopt [14,29]: In case there are signs that the new technology is considered too complex, the threshold for adoption can be lowered by reducing complexity or enhancing the perceived ease of use by for example introducing ready to use solutions (e.g., [64]). This was operationalized using measurement item for PEOU1: “Ready to use solution (equipment, installation, maintenance, business model) is available”. The rest of the PEOU constructs were created analogously based on earlier research (see Table 3).
Attitudes toward adopting technology have been studied widely from the behavioral, environmental, social, and psychological perspectives. Subjective norm is used in both TRA [39] and TPB [40] as it has been found to affect attitudes and intentions toward adopting environmental innovations through feeling obligated to adjust one’s behavior to act in a more sustainable manner. In our research, the corresponding construct ATU1 is operationalized as: “It is important for me to increase my green energy usage”. According to the TPB, normative beliefs have influence on subjective norm as they reflect one’s beliefs of how other’s think she or he should or should not act [40]. To reflect this notion, ATU2 was adapted from earlier research [69]. Attitude toward a specific behavior (as in the TRA) is also relevant in the case of RET and examples from earlier research are available (e.g., [70,73]). We hence used measurement items related to attitudes toward willingness to paying more (ATU3) and toward washing dishes and laundry during non-peak hours (ATU4). The ATU constructs are summarized in the Table 4.
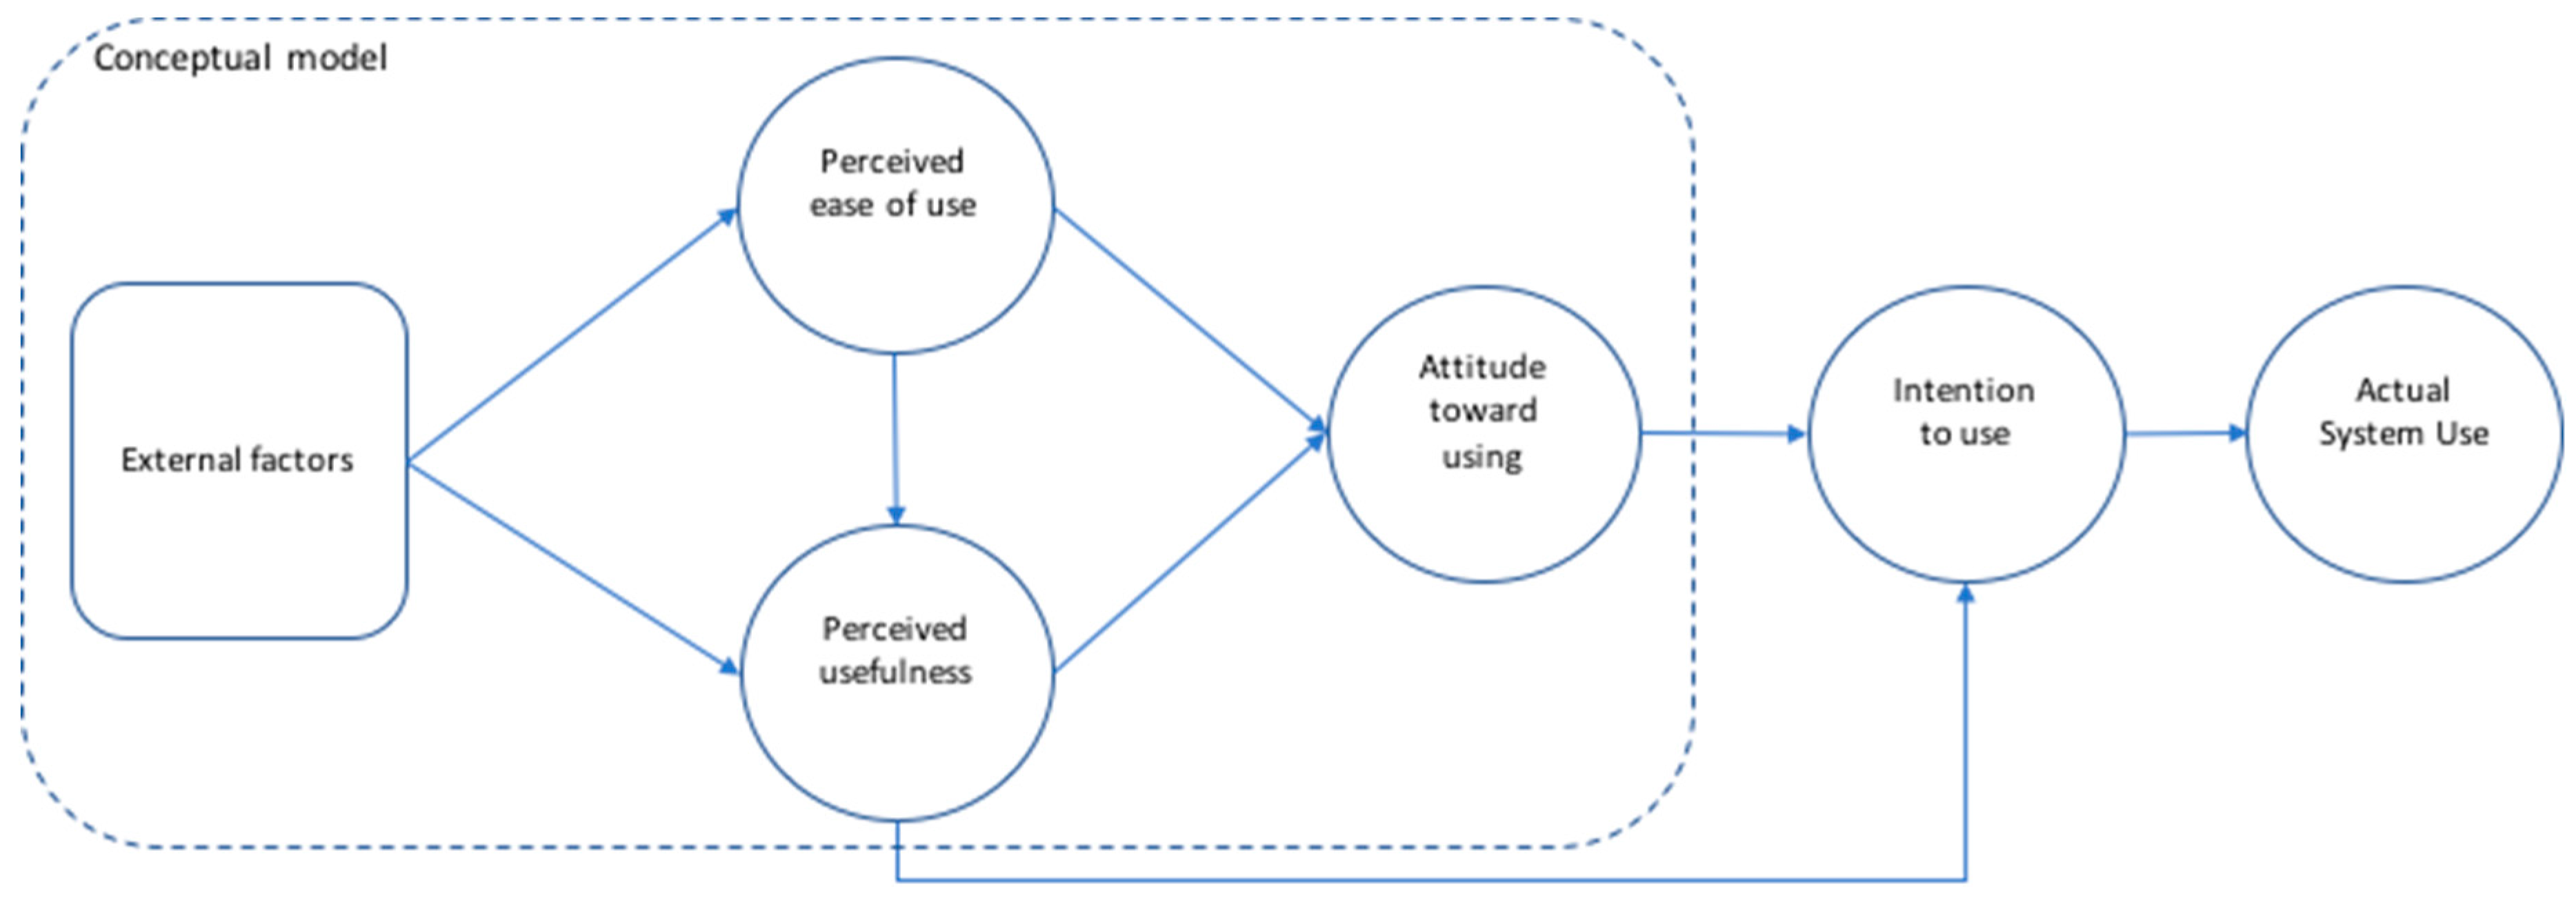
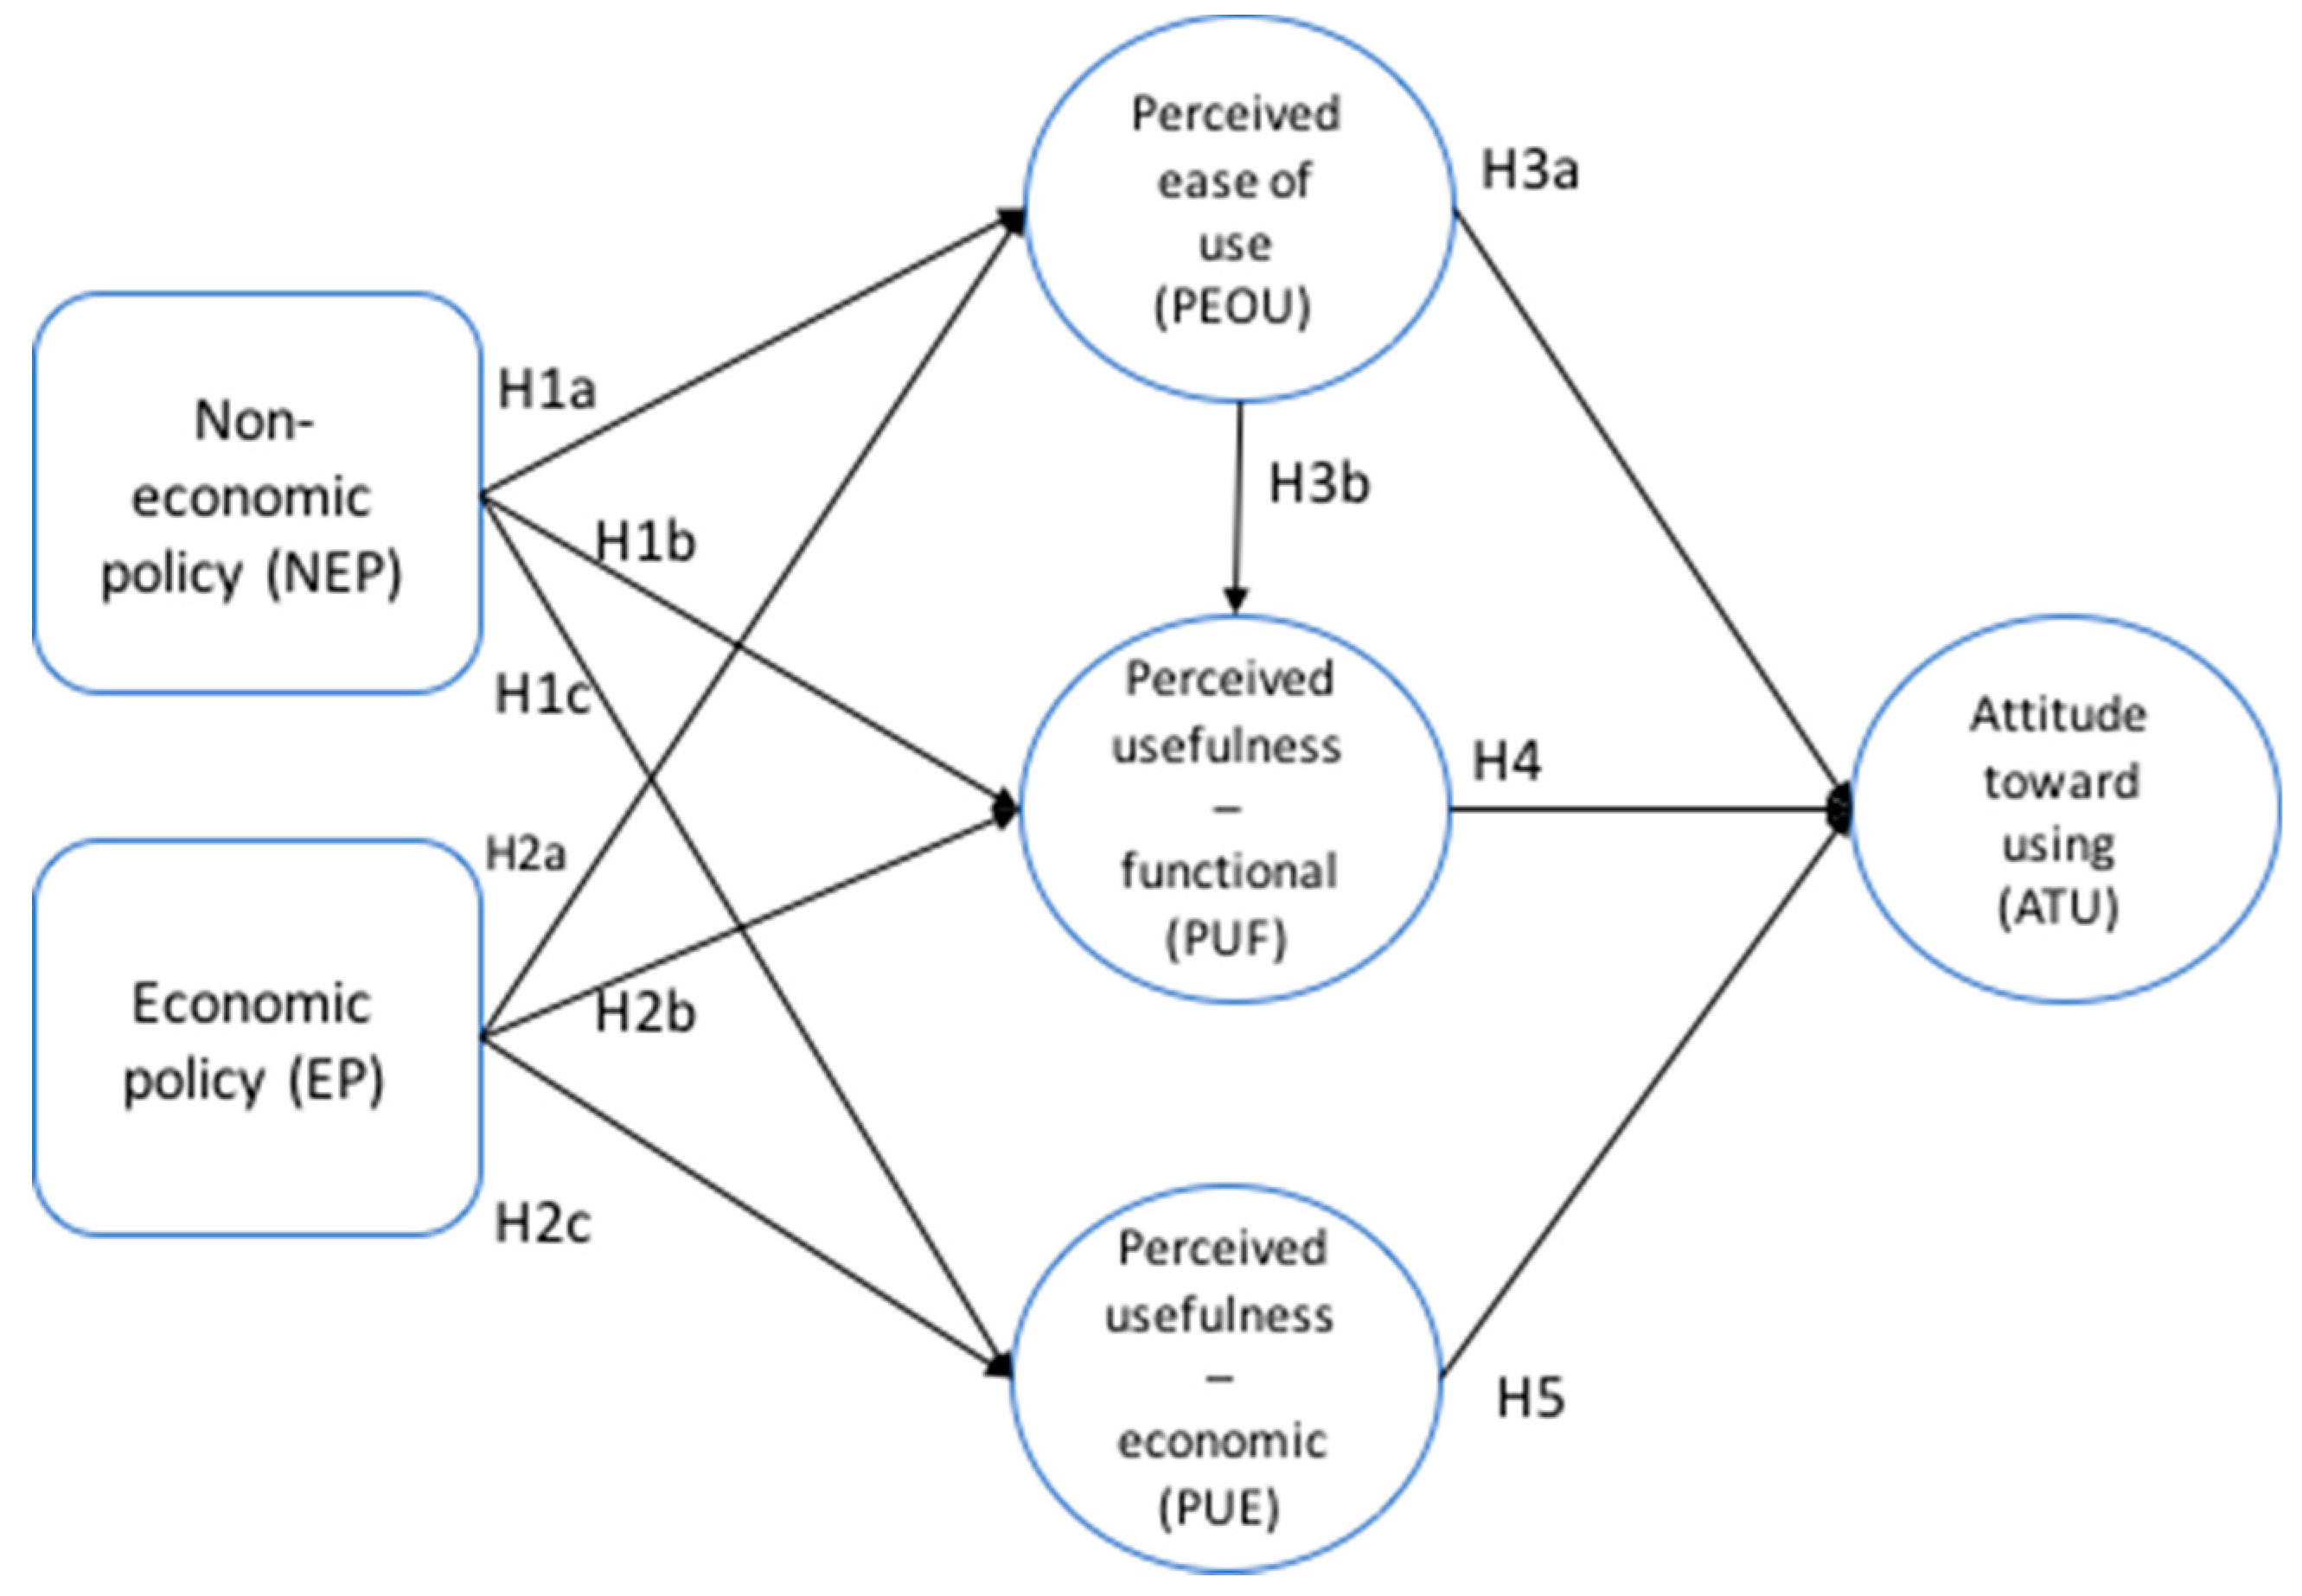
Finally, all the constructs used in this research were defined, and the conceptual model was created. To build the conceptual model, we used three logical steps to link policies and attitudes toward adopting RET: intervention, induction, and immersion. We hypothesize that policy interventions are likely to affect how ease of use and usefulness are perceived, which then affect attitudes toward adopting RET. The TAM was used as the basic framework of the conceptual model, and it was adapted to fit the scope of this research.
The EP and NEP interventions were positioned as factors external to the TAM model. External factors are the antecedents of PEOU and PU, such as individual differences, system characteristics, social influence, and facilitating conditions [74,75]. To our knowledge, policy intervention has not been studied as a factor external to the TAM. In our model, both EP and NEP connect to PEOU, PUF and PUE, which then are linked to ATU. Additionally, as in the original TAM model, PEOU is linked to PUF. Conversely, PEOU is not linked to PUE; there is no earlier evidence or reason to assume that ease of use would enhance how economic benefits are perceived. Because dividing PU into two separate constructs is an explorative approach with the TAM, we considered excluding the relationship between PEOU and PUF. However, because the TAM normally exhibits a strong connection between PEOU and PU [76], it was included in the model. However, our model excludes TAM’s elements of “intention to use” and “actual use” of the system. Even though energy policy has not been extensively examined in relation to the TAM, previous research using the model found that various external factors influenced PEOU and PU and thus could affect attitudes toward using a technology solution [14,76,77]. Hence, our model uses policy as an external factor, and we explore the effects of economic policies and non-economic policies on consumers’ attitude to using RET. The conceptual model is depicted in Figure 2.
After designing the conceptual model, we developed several hypotheses based on the research questions. We focused on consumers that did not yet have access to RET system, that is, “non-adopters” and “non-prosumers”. We included in the study a control group of prosumers who already were users of RET, that is, “adopters”. Because we are interested in how policy affects consumers’ willingness to evolve into prosumers, our main focus is on consumers’ attitudes toward the adoption of RET.
To analyze in influence of both economic and non-economic policies, perceived usefulness (in the TAM) was divided into two parts: economic usefulness (PUE) and non-economic (functional) usefulness (PUF). In addition, we connected NEP and EP to PEOU, as at this stage we wanted to determine whether both EP and NEP affected perceptions of ease of use. We hypothesized that both NEP and EP influence consumers’ perceptions of the usefulness of RET. Thus, NEP and EP were connected to PUF and PUE. Consequently, the following hypotheses are stated:
Hypothesis 1a.
H1a: Non-economic policy (NEP) instruments influence how non-adopters perceive the ease of use of RET.
Hypothesis 1b.
H1b: NEP instruments influence how non-adopters perceive the functional usefulness of RET.
Hypothesis 1c.
H1c: NEP instruments influence how non-adopters perceive the economic usefulness of RET.
Hypothesis 2a.
H2a: Economic policy (EP) instruments influence how non-adopters perceive the ease of use of RET.
Hypothesis 2b.
H2b: EP instruments influence how non-adopters perceive the functional usefulness of RET.
Hypothesis 2c.
H2c: EP instruments influence how non-adopters perceive the economic usefulness of RET.
Previous research found that perceived ease of use could affect consumers’ attitudes toward using a system through increasing the perceived usefulness [32,78]. There is little evidence that economic factors affect perceptions of the ease of use. Hence, the influence of PEOU is tested only against perceived functional usefulness. Because PU is divided into two parts in our research, the connection between PEOU and PUF is inferred. We also assume that PEOU affects the AU of RET as in the original TAM. Therefore, the following hypotheses are stated:
Hypothesis 3a.
H3a: Perceived ease of use (PEOU) influences non-adopters’ attitude toward using RET.
Hypothesis 3b.
H3b: PEOU influences how non-adopters perceive the functional usefulness of RET.
In the TAM, perceived usefulness usually has a strong connection to attitude toward using a technology [76]. Because we use the novel approach of dividing PU into two parts, it can only be presumed that both PUF and PUE influence AU. Hence, the following hypotheses are stated:
Hypothesis 4.
H4: Perceived functional usefulness (PUF) influences non-adopters’ attitude toward using RET.
Hypothesis 5.
H5: Perceived economic usefulness (PEU) influences non-adopters’ attitude toward using RET.
All hypotheses were tested empirically using a consumer survey as the research method.

4. Research Methodology and Data

The data were collected in a survey conducted in Europe (i.e., France, Germany, Switzerland, Belgium, Italy, and Finland) (N = 197). The respondents included both consumers (N = 122) and prosumers (N = 75). The survey was conducted in July 2016 and January 2017. To ensure content validity, the items chosen for the constructs were adapted from previous research as far as it was possible and the rest of the constructs were designed by the authors to fit the research scope. The constructs were tested with native speakers from all countries (N = 8) and minor changes to the wordings were made accordingly to ensure validity of the questionnaire.
A printed questionnaire was distributed by hand by research assistants and in an online web survey. The questionnaire was completed by the majority of the respondents while the interviewer was present so that the respondents could check the meanings of questions if they did not fully understand them. The respondents could choose to complete the questionnaire online, and some respondents used this option.
The aim of the data collection was to obtain a data set that included approximately the same number of consumers and prosumers in each country. Because of the exploratory approach used in this study, the size of the full data set (N = 197) was sufficient for analyzing the differences between the consumers and prosumers. The questions included in the survey were translated from English by native speakers to the languages of the respondents (i.e., French, German, Italian, and Finnish). The translators also piloted the questionnaire and provided feedback on it. The questions in the survey were formulated as statements so that they could be answered using a 7-point Likert scale from 1 = strongly disagree to 7 = strongly agree.
The respondents first were approached in public spaces, such as parks, airports, and railway stations. However, because very few prosumers were found in these spaces, the research assistants subsequently approached houses that had solar panels on the roof. Satellite images in Google Maps were used to find these houses. In both approaches to the data collection, the response rate was approximately 30%. The use of Google Maps to select houses with solar panels may have resulted in some bias in the sample because the income levels or political views of the inhabitants may be similar in specific living areas. In addition, it should be noted that the demographics were slightly biased by this approach: in Germany and Switzerland, the number of young adults (25–40 years) was higher than the number of middle-aged adults (41–55 years). However, in France and Italy, the overall age distribution was representative of the overall population even though the number of older adults (55 and older) was slightly higher. The demographic profiles of all respondents in the sample is presented in Table 5.
We explored the model fit of the novel conceptual model by first conducting an analysis of variance (ANOVA) and a principal component analysis (PCA) in SPSS. We then utilized partial least squares structural equation modeling (PLS-SEM) according to the guidelines in Hair et al. [78]. PLS-SEM allows the exploration of theories and novel conceptual models using small sample sizes when the theory has not yet been fully developed and the model is complex [79,80]. We used the IBM SPSS version 24 for the PCA analysis and SmartPLS tool (version 3.2.6.) for the PLS-SEM. In the analysis, missing data were handled using the missing-at-random (MAR) approach [80], so the responses were calculated and reweighted with unbiased estimates in cases where the response rates differed [81].

5. Results

First, we conducted the ANOVA, which indicated items that differentiated the ways that the consumers and prosumers perceived, assessed, and accepted renewable energy technologies. Then, we conducted the PCA with all of the items in the model construct to determine how the items loaded on various factors. PLS-SEM was used to analyze how EP and NEP influenced the PEOU, PUF, and PUE constructs that might influence the respondents’ ATU.
The ANOVA was conducted using the items that measured differences in the attitudes and perceptions of the prosumers and consumers. The comparison of the results showed that the items that differed significantly between the two respondent groups, were in the constructs reflecting economic aspects of policy support (EP), perceived ease of use (PEOU), perceived usefulness, functional (PUF), perceived usefulness, economic (PUE), as well as the actual attitude toward use (ATU) (see Table 6).
Because there were clear differences in the means of several items used to measure the consumers and the prosumers, and they were statistically significant, we also carried out permutation tests to compare the statistical differences in the path coefficients between the two respondent groups. The results of the permutation test indicated that the total effects of NEP on ATU (p < 0.05) and PUE on ATU (p < 0.10) differed significantly between the consumers and the prosumers (Table 7).
The results of the permutation test support the approach used to analyze the two groups of respondents separately to verify the influence of policy support on consumers’ attitudes toward RET. The detailed findings regarding the individual hypotheses are discussed in Section 5.
Next, we continued to assess the conceptual model with PCA. The Kaiser–Meyer–Olkin (KMO) measure for sampling adequacy was 0.781 in the sample, which allowed us to proceed with the factor analysis using PCA [82]. The first PCA indicated that the items loaded on seven different components. However, in the analysis for construct validity, one component did not fit the model, as the Cronbach’s alpha for it was clearly below 0.7 which is the recommended threshold [82]. We then dropped this item (ATU4), and proceeded with another PCA on the model. The KMO for the reduced set of measures was 0.777, which permitted to proceed with PCA [82]. The second PCA resulted in six components, which are shown in Table 8.
Based on the six components, the conceptual model showed how the influence of EP and NEP affected PEOU, PUF, and PUE and how they all influenced the ATU. PLS-SEM was used to analyze the influence of the constructs in the model on the attitudes of the respondents. The constructs and their match with the properties of the other constructs in the conceptual model were verified by applying Cronbach’s alpha, composite reliability (CR), average variance extracted (AVE), and the factor loadings. The model was analyzed in two phases: First, we analyzed the construct reliability and validity of the measures [78]. Second, we checked the structural model by assessing the factor loadings. The inner weighting scheme used for the PLS-SEM was the path mode.
CR was utilized to evaluate the reliability of the constructs [83]. The CR and the validity of the model for the data on the consumers (N = 122) was excellent in all constructs. For the full data set (N = 197), the construct validity was also acceptable, with the exception of one construct where Cronbach’s alpha and AVE were slightly below the recommended values.
We continued to analyze the model using the consumer data because the CR was higher than for the prosumer data. All the CR values were well above the recommended threshold of 0.7 [84], which is an indication of convergent validity. The AVE for all components was higher than the recommended threshold of 0.5. The factor loadings for most of the components were higher than 0.7, which indicated that the variance in the variables could be described by the construct [78]. In only two items, the factor loadings were slightly below 0.6, which was acceptable according to the SEM literature [82] (see Table 9).
The structural model with the non-prosumer data was further assessed by standard model estimation, bootstrapping, and blindfolding procedures in SmartPLS. To check the collinearity of the structural model, the quality criteria, or collinearity statistics (VIF) values were verified. All the inner VIF values were below the required threshold of 5, which indicated that in the predicting constructs, collinearity was not critical [78].
Then, we ran in SmartPLS 500 subsample estimates for all of the variables in order to verify the accuracy of the PLS estimates. The R2 measure helps to assess the predictive accuracy of a model [78]. R2 values can range between zero and 1; when the value is close to 1, the predictive accuracy is high. However, in the consumer behavior literature, when the R2 values are 0.20 or above, they are considered high. For this reason, the R2 values should not be the only criterion for accepting a model [78]. For the ATU construct, in the case of the non-prosumer data, the R2 value was 0.213. The R2 values in the remaining constructs were as follows: PEOU (0.399), PUE (0.449), and PUF (0.475).
In addition to the R2 values, the change in the R2 values when a specified construct was eliminated from the model was assessed by the f2 effect size. The thresholds of f2 are the following: 0.02 = small effect size; 0.15 = medium effect size; and 0.35 = large effect size. Effect sizes below 0.02 indicate no effect [78]. Only the effect sizes of the PEU-construct on PUF and the PUE-construct on AU showed no effect; otherwise, the effect sizes were greater than the small and medium thresholds. The following constructs had large effect sizes: the effect of EP on PUE (0.36) and the effect of NEP on PEOU (0.35).
Q2 indicates the predictive relevance of the endogenous constructs (i.e., PEOU, PUF, PUE, and ATU). In SmartPLS, the predictive relevance was analyzed using the blindfolding procedure. The results of the construct of cross-validated redundancy showed the final Q2 values: ATU (0.129), PEOU (0.259), PUE (0.360), and PUF (0.211). Because all Q2 values were above 0, the model had predictive relevance in the case of these constructs.
The Fornell–Larcker criterion is used to assess discriminant validity. However, the heterotrait–monotrait ratio (HTMT) is also used for this purpose, and it is regarded as a more reliable criterion [78]. The HTMT of the correlations was used to assess the discriminant validity of the components [78]. The HTMT distribution was shown in the results of bootstrapping in SmartPLS. If the HTMT ratio of the path models of the construct is below 0.85, the concepts are distinct [85]. For the constructs in our model, all HTMT values were below 0.85 (see Table 10).
The evaluation of the total effects showed how the formative constructs EP and NEP influenced the target variable ATU through the mediating constructs PEOU, PUF, and PUE (see Table 11). The analysis of the total effects of the exogenous constructs (EP and NEP) on the ATU construct showed that NEP (0.243) had a stronger total effect on ATU than EP did (0.136).
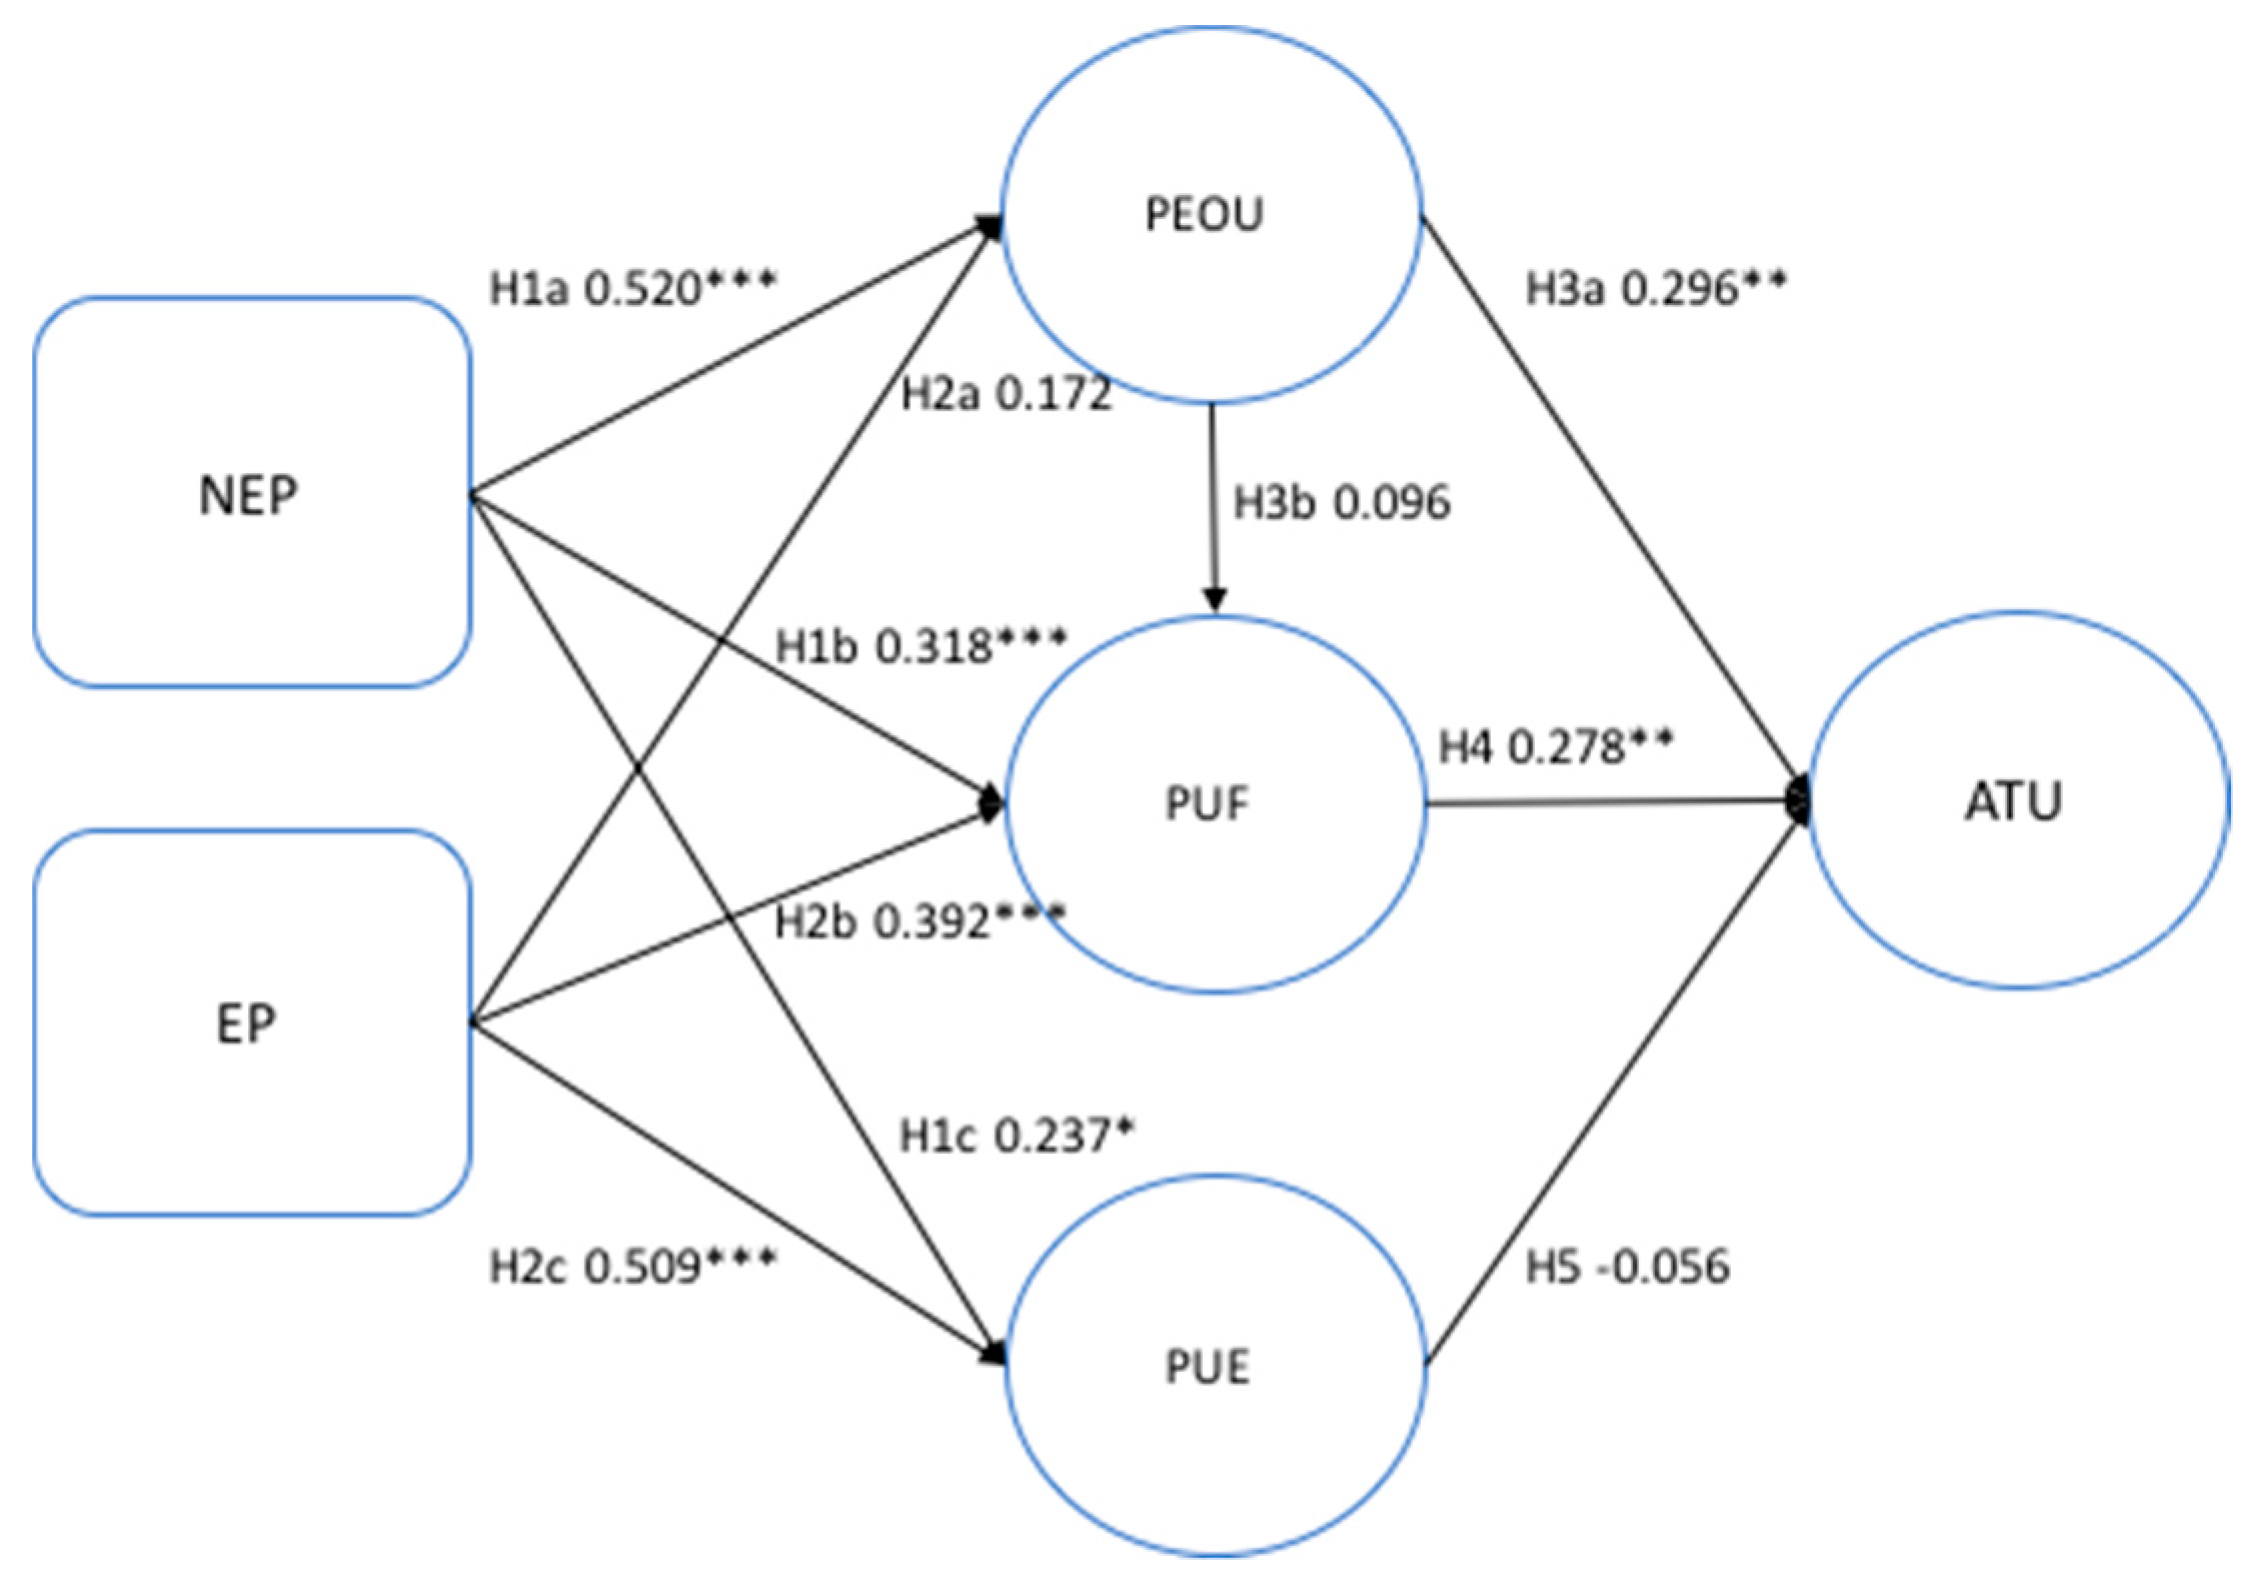
The path coefficients of the model were estimated using the bootstrapping method in SmartPLS. We used a significance level of 0.05 for the path coefficients because this study is exploratory [78]. The value and significance of the path coefficients for the constructs in the case of the data collected from non-prosumers are shown in Figure 3.

6. Discussion

The findings of our research show that there are clear differences in how economic and non-economic policies influence the attitudes of consumers and prosumers. Seven of the ten hypotheses related to consumers (non-adopters) were supported as shown in Table 12.
Hypotheses 1a, 1b, and 1c were supported because the model exhibited a positive relationship with NEP instruments and PEOU, PUF and PUE. The support for PUE (H1c) was weaker than for PUF (H1b), which is logical. However, the results suggest that non-economic policy instruments would add to the perceived economic usefulness of RET. Hypotheses 2b and 2c were also supported by the model, suggesting that economic policy instruments also could be associated with perceived usefulness, whether functional or economic. However, Hypothesis 2a was rejected (95% significance level), indicating that economic policies do not affect how the ease of use is perceived. This finding was interesting because the original PU was divided into two parts. The rejection of the hypothesis indicates that PU could be split without disturbing the TAM’s consistency because the rejection seems commonsensically sound.
Hypothesis 3a was supported, which implies that, as shown in earlier research, perceived ease of use affects attitude toward using RET. However, in contrast to previous research results, Hypotheses 3b, regarding the relationship between perceived ease of use and perceived usefulness, was rejected. We speculate that this outcome was due to the division of perceived functional and economic usefulness into two constructs, which resulted in the incomplete construct of perceived usefulness. Therefore, this finding should be investigated further in future research.
Hypothesis 4 stated that PUF influenced ATU, which was supported by the results. However, somewhat surprisingly, PUE did not influence ATU, so Hypothesis 5 was rejected. This result is difficult to explain based on our research data. In previous research (e.g., [17]), economic instruments were found effective in supporting the diffusion of RET. However, in our study, this result may be due to the division of the perceived usefulness into two parts. Therefore, further research is required to determine whether the result is repeatable. Furthermore, the results of total effects analysis supported the research questions by showing that the constructs of policy influence (EP and NEP) influenced the target variable ATU through the mediating constructs of PEOU, PUF, and PUE. The total effect on attitudes was stronger in the case of the non-economic policies than in the case of the economic policies, which indicates the importance of a broad policy mix in supporting the diffusion of RET.
The results of the control group of prosumers (adopters) were very different from those of the consumers (non-adopters). The majority of the hypotheses regarding the prosumers were rejected. The TAM was designed to model technology acceptance by non-adopters. Thus, the results are in line with the theory, and they imply that prosumers expect that different types of policies support their actual use of RET.
Regarding the results of our analysis, the effect size (f2) was large in the constructs EP on PUE (0.36) and NEP on PEOU (0.35), which indicates that both EP and NEP influence the perceptions of consumers. However, the total effect of NEP was clearly stronger than that of EP in the case of non-adopters, which indicates that it would be worthwhile for policy measures to focus on NEP rather than EP. At this stage, consumers seem to be interested in the non-economic issues associated with the adoption of RES. Thus, the motivators could be based on pro-environmental values rather than economic drivers [86]. However, consumers also seem to consider the economic policy factor in association with the economic usefulness of the RES solutions. This link could perhaps be strengthened if economic policies reflected the pricing of energy, thus making prices dependent on the energy source. In addition, economic policies could favor renewable energy and the energy stored by the prosumers. This change in economic policy to support the pricing of renewable and stored energy could attract more consumers to adopt RET because saving energy has been shown to be motivated by financial benefits more than pro-environmental values [87].

6.1. Policy Implications

Our findings suggest that the total effects of non-economic policies could shape consumers’ attitudes toward using RET, even more than economic policies would. The NEP had a strong influence on PEOU and PUF. It also showed a moderate influence on PUE. However, EP also influenced PUF.
The observed non-economic policy items that were related to the regulative process of connecting RET to the grid were the awareness of tariffs and subsidies and the availability of information about energy production and usage. Based on our results, we suggest that policy makers should focus on removing regulatory barriers to allow consumers to participate actively in the energy market. Consumers have different levels of freedom to act in the energy market depending on their native country. However, in most markets, some barriers remain, hindering consumers from participating in new activities, such as energy trading and sharing in energy communities. Another observation based on the results of the study is that secured data and access to information are important to consumers. Smart grids and ICT-based solutions enable large amounts of data regarding energy consumption and production. If they are utilized well, it could help to foster consumers’ acceptance as the benefits of using RET become more concrete. Consumers seem to appreciate the ability to monitor their energy use. Another observation is that energy market actors should focus on communicating information about the tariffs and the support mechanisms that are available for adopting RET.
The comparison of the results for the non-adopters and the adopters showed that the adopters were not affected by policies in the same way as the non-adopters were. Other studies, although not directly comparable with the present research, have also found indications of differences between adopter versus non-adopter attitudes (see, e.g., [88,89,90]). One reason for the difference in the results can be due to the different characteristics between early adopters (which majority of the RET adopters today are) and the late market adopters (see, e.g., [29]). Another explanation can be that initial policies designed to boost diffusion no longer motivate the adopters. Therefore, different policies are needed to motivate consumers’ initial acceptance of RET and to support prosumers in actively continuing the use of their RETs. The finding supports the relevance of phasing out at least certain policy incentives when the diffusion has started.

6.2. Managerial Implications

We used variables related to ease of use and perceived usefulness to test the influence of policy on consumers’ attitudes. Research items related to the perceived ease of use were associated with the availability of ready-to-use solutions, the availability of the solution from a one-stop-shop, and the easiness of installation. Our findings showed that these items affected the attitude toward using RET, which suggests that it is important to design turnkey solutions for RET and focus on making availability and delivery as accessible as possible for consumers.
Previous studies found that perceived usefulness was a powerful predictor of system use. In our study, perceived usefulness included functional items that were related to the availability of services that allowed monitoring and using the system, the ability to adjust the system independently, energy autonomy, information about electricity peak prices, and as a separate construct, financial benefits, such as the ability to sell excess energy for guaranteed prices. Our findings revealed that non-economic usefulness particularly affected consumers’ attitudes. It is thus essential to emphasize developing and communicating the functionality benefits of RET solutions that increase the consumer’s awareness of these benefits.

6.3. Limitations and Future Research

The present study has the following limitations. One limitation is related to the relatively small sample size, which was gathered across Europe, a non-homogenous area from policy, culture and economic perspectives. However, the sample size was large enough to conduct a PLS-SEM analysis on the cross-country level. Future research could however focus on conducting country level analysis of the policy implications. On the other hand, as the policies in different countries and continents can vary extensively, it would be also relevant to compare the outcome of future research in other regions to the conclusions we have made. The use of a cross-sectional design in the questionnaire is another limitation of this study. In future research, a longitudinal research approach would allow following consumer and prosumer behavior over time. Another limitation is that we utilized part of the TAM in an explorative manner: PU was divided into two parts that represented economic and functional usefulness, respectively. Furthermore, although the TAM has been proven to be a solid model for testing technology acceptance, policy interventions were not tested previously using the TAM. Hence, future research should further validate the use of the TAM when policies are considered external factors.
Our research analyzed policy instruments broadly, but there is still more room for studies on specific types of policy instruments, for example, on how policies related to information and education affect the attitudes of consumers. In future research, a more generalized conceptual framework could be developed based on our initial findings. It would also be worthwhile to study in more detail the prosumers and how to further promote and motivate RET usage among them after they have adopted RET. The identification of the possible challenges and obstacles to the usage of RET after adoption could also help to further promote RET solutions to non-adopters of RET.

7. Conclusions

Convincing consumers to contribute to international and national targets for reducing carbon emissions, improving energy efficiency, and increasing the use of RES is vital in mitigating climate change. Governments and policy makers are in the process of designing a variety of policy instruments to support the increasing consumer engagement in the energy sector. Our research focused on understanding the influence of policy on consumers’ attitudes toward adopting renewable energy technologies. We approached the research problem by conducting a consumer survey. We then built the conceptual model and analyzed the data using the PLS-SEM methodology. The findings of the present study confirmed the importance of policy instruments in supporting consumers’ evolution into prosumers. Our analysis of both economic and non-economic policies revealed that both could be relevant tools for the non-adopters of RET. Furthermore, our findings indicate that non-economic policies could be even more influential than economic policies are in changing consumers’ attitudes toward using RET. This finding should be considered by policy makers in planning a diverse set of policies that cover a wide range of instruments.

Acknowledgments

This work was supported by the Strategic Research Council at the Academy of Finland as part of the project, Transition to a Resource Efficient and Climate Neutral Electricity System (EL-TRAN), grant number 314319. The work was partially supported by the Academy of Finland (grant number 279087). The authors would also like to thank Jussi Valta, M. Sc. and M. Sc. candidate Elisa Lukin at the Tampere University of Technology for their valuable contributions in gathering the research data.

Author Contributions

Kirsi Kotilainen conceived and designed the empirical survey; Kirsi Kotilainen and Ulla A. Saari analyzed the data; and Kirsi Kotilainen and Ulla A. Saari wrote the paper.

Conflicts of Interest

The authors declare no conflicts of interest.

References

  1. Bui, N.; Castellani, A.P.; Casari, P.; Zorzi, M. The internet of energy: A web-enabled smart grid system. IEEE Netw. 2012, 26, 39–45. [Google Scholar] [CrossRef]
  2. International Energy Agency. Residential Prosumers—Drivers and Policy Options (Re Prosumers); Renewable Energy Technology Deployment; International Energy Agency: Paris, France, 2014. [Google Scholar]
  3. Toffler, A. The Third Wave; Williams, B., Tapscott, T., Eds.; Bantam Books: New York, NY, USA, 1981. [Google Scholar]
  4. Kotler, P. Prosumers: A New Type of Consumer. Futurist 1986, 20, 24–28. [Google Scholar]
  5. Ford, R.; Whitaker, J.; Stephenson, J. Prosumer Collectives: A Review a Report for the Smart Grid Forum; Centre for Sustainability, University of Otago: Dunedin, New Zealand, 2016. [Google Scholar]
  6. Parag, Y.; Sovacool, B.K. Electricity market design for the prosumer era. Nat. Energy 2016, 16032. [Google Scholar] [CrossRef]
  7. Olkkonen, L.; Korjonen-Kuusipuro, K.; Grönberg, I. Redefining a stakeholder relation: Finnish energy “prosumers” as co-producers. Environ. Innov. Soc. Transit. 2016. [Google Scholar] [CrossRef]
  8. Bleicher, A.; Gross, M. User motivation, energy prosumers, and regional diversity: Sociological notes on using shallow geothermal energy. Geotherm. Energy 2015, 3, 12. [Google Scholar] [CrossRef]
  9. Kotilainen, K.; Sommarberg, M.; Järventausta, P.; Aalto, P. Prosumer centric digital energy ecosystem framework. In Proceedings of the 8th International Conference on Management of Digital EcoSystems, Biarritz, France, 1–4 November 2016; pp. 47–51. [Google Scholar]
  10. Lund, H.; Kempton, W. Integration of renewable energy into the transport and electricity sectors through V2G. Energy Policy 2008, 36, 3578–3587. [Google Scholar] [CrossRef]
  11. Loisel, R.; Pasaoglu, G.; Thiel, C. Large-scale deployment of electric vehicles in Germany by 2030: An analysis of grid-to-vehicle and vehicle-to-grid concepts. Energy Policy 2014, 65, 432–443. [Google Scholar] [CrossRef]
  12. Ellsworth-Krebs, K.; Reid, L. Conceptualising energy prosumption: Exploring energy production, consumption and microgeneration in Scotland, UK. Environ. Plan. A 2016, 48, 1988–2005. [Google Scholar] [CrossRef]
  13. Karakaya, E.; Sriwannawit, P. Barriers to the adoption of photovoltaic systems: The state of the art. Renew. Sustain. Energy Rev. 2015, 49, 60–66. [Google Scholar] [CrossRef] [Green Version]
  14. Davis, F.D. Perceived usefulness, perceived ease of use, and user acceptance of information technology. MIS Q. 1989, 13, 319–334. [Google Scholar] [CrossRef]
  15. Kivimaa, P.; Virkamäki, V. Policy mixes, policy interplay and low carbon transitions: The case of passenger transport in Finland. Environ. Policy Gov. 2014, 24, 28–41. [Google Scholar] [CrossRef]
  16. Geels, F.W. The multi-level perspective on sustainability transitions: Responses to seven criticisms. Environ. Innov. Soc. Transit. 2011, 1, 24–40. [Google Scholar] [CrossRef]
  17. Vedung, E.; Bemelmans-Videc, M.L.; Rist, R.C. Policy instruments: Typologies and theories. In Carrots, Sticks, and Sermons: Policy Instruments and Their Evaluation; Transaction Publishers: New Brunswick, NJ, USA, 1998; pp. 21–58. ISBN 0765805464. [Google Scholar]
  18. Macdonald, D. Coerciveness and the selection of environmental policy instruments. Can. Public Adm. 2001, 44, 161–187. [Google Scholar] [CrossRef]
  19. Persson, Å.M. Choosing Environmental Policy Instruments: Case Studies of Municipal Waste Policy in Sweden and England. Ph.D. Dissertation, The London School of Economics and Political Science (LSE), Londen, UK, 2007. [Google Scholar]
  20. Organization for Economic Co-operation and Development (OECD). Sustainable Development—Critical Issues; Organization for Economic Co-Operation and Development (OECD): Paris, France, 2001. [Google Scholar]
  21. Coady, D.; Parry, I.; Sears, L.; Shang, B. How Large Are Global Energy Subsidies? International Monetary Fund: Washington DC, USA, 2015. [Google Scholar]
  22. Unruh, G.C.; Carrillo-Hermosilla, J. Globalizing carbon lock-in. Energy Policy 2006, 34, 1185–1197. [Google Scholar] [CrossRef]
  23. Gunningham, N. Regulation, Economic Instruments, and Sustainable Energy. In The Handbook of Global Energy Policy; John Wiley & Sons: New York, NY, USA, 2013; pp. 305–321. ISBN 9781118326275. [Google Scholar]
  24. Rademaekers, K.; Williams, R.; Ellis, R.; Smith, M.; Svatikova, K.; Bilsen, V. Study on Incentives Driving Improvement of Environmental Performance of Companies; Ecorys: Rotterdam, The Netherlands, 2012. [Google Scholar]
  25. Jaffe, A.B.; Stavins, R.N. Dynamic Incentives of Environmental Regulations: The Effects of Alternative Policy Instruments on Technology Diffusion. J. Environ. Econ. Manag. 1995, 29, S43–S63. [Google Scholar] [CrossRef]
  26. Jaffe, A.B.; Newell, R.G.; Stavins, R.N. A tale of two market failures: Technology and environmental policy. Ecol. Econ. 2005, 54, 164–174. [Google Scholar] [CrossRef]
  27. Rogers, E.M. Diffusion of Innovations, 1st ed.; Free Press of Glencoe: New York, NY, USA, 1962. [Google Scholar]
  28. Moore, G.A. Crossing the Chasm; Harper Business Essentials: New York, NY, USA, 1991. [Google Scholar]
  29. Rogers, E.E.M. Diffusion of Innovations, 5th ed.; Simon&Schuster: New York, NY, USA, 2003. [Google Scholar]
  30. McDaniel, P.; McLaughlin, S. Security and privacy challenges in the Smart Grid. IEEE Secur. Priv. 2009, 3, 75–77. [Google Scholar] [CrossRef]
  31. Alam, S.S.; Nik Hashim, N.H.; Rashid, M.; Omar, N.A.; Ahsan, N.; Ismail, M.D. Small-scale households renewable energy usage intention: Theoretical development and empirical settings. Renew. Energy 2014, 68, 255–263. [Google Scholar] [CrossRef]
  32. Burgess, J.; Nye, M. Re-materialising energy use through transparent monitoring systems. Energy Policy 2008, 36, 4454–4459. [Google Scholar] [CrossRef]
  33. Darby, S. The Effectiveness of Feedback on Energy Consumption. A Review for DEFRA of the Literature on Metering, Billing and Direct Displays; Environmental Change Institute: Oxford, UK, 2006; Volume 22, pp. 1–21. [Google Scholar]
  34. Benders, R.M.J.; Kok, R.; Moll, H.; Wiersma, G.; Noorman, K.J. New approaches for household energy conservation—In search of personal household energy budgets and energy reduction options. Energy Policy 2006, 34, 3612–3622. [Google Scholar] [CrossRef]
  35. Simon, H.A. A Behavioral Model of Rational Choice. Q. J. Econ. 2011, 69, 99–118. [Google Scholar] [CrossRef]
  36. Balcombe, P.; Rigby, D.; Azapagic, A. Motivations and barriers associated with adopting microgeneration energy technologies in the UK. Renew. Sustain. Energy Rev. 2013, 22, 655–666. [Google Scholar] [CrossRef]
  37. Ryan, R.; Deci, E. Self-determination theory and the facilitation of intrinsic motivation. Am. Psychol. 2000, 55, 68–78. [Google Scholar] [CrossRef] [PubMed]
  38. Stern, P.C.; Abel, T.D.; Stern, P.C.; Dietz, T.; Abel, T.; Guagnano, G.A.; Kalof, L. A Value-Belief-Norm Theory of Support for Social Movements: The Case of Environmentalism. Hum. Ecol. Rev. 1999, 6, 81–97. [Google Scholar] [CrossRef]
  39. Fishbein, M.; Ajzen, I. Belief, Attitude, Intention, and Behaviour: An Introduction to Theory and Research; Addision-Wesley: Reading, MA, USA, 1975. [Google Scholar]
  40. Ajzen, I. From intentions to actions: A theory of planned behavior. In Action-Control: From Cognition to Behavior; Beckman, J., Kuhl, J., Eds.; Springer: Heidelberg, Germany, 1985; pp. 11–39. [Google Scholar]
  41. Davis, F.D.; Baggozzi, R.P.; Warshaw, P.R. Extrinsic and intrinsic motivation to use computers in the workplace. J. Appl. Soc. Psychol. 1992, 22, 1111–1132. [Google Scholar] [CrossRef]
  42. Davis, F.D. A Technology Acceptance Model for Empirically Testing New End-User Information Systems: Theory and Results. Ph.D. Dissertation, Massachusetts Institute of Technology, Cambridge, MA, USA, 1986. [Google Scholar]
  43. Chau, P.Y.K.; Hu, P.J. Examining a model of information technology acceptance by individual professionals: An exploratory study. J. Manag. Inf. Syst. 2002, 18, 191–229. [Google Scholar] [CrossRef]
  44. Ha, S.; Stoel, L. Consumer e-shopping acceptance: Antecedents in a technology acceptance model. J. Bus. Res. 2009, 62, 565–571. [Google Scholar] [CrossRef]
  45. Lu, J.; Yu, C.; Liu, C.; Yao, J.E. Technology acceptance model for wireless Internet. Internet Res. 2003, 13, 206–222. [Google Scholar] [CrossRef]
  46. Ketikidis, P.; Dimitrovski, T.; Lazuras, L.; Bath, P.A. Acceptance of health information technology in health professionals: An application of the revised technology acceptance model. Health Inform. J. 2012, 18, 124–134. [Google Scholar] [CrossRef] [PubMed]
  47. Naspetti, S.; Mandolesi, S.; Buysse, J.; Latvala, T.; Nicholas, P.; Padel, S.; Van Loo, E.J.; Zanoli, R. Determinants of the acceptance of sustainable production strategies among dairy farmers: Development and testing of a modified technology acceptance model. Sustainability 2017, 9, 1805. [Google Scholar] [CrossRef]
  48. Chin, J.; Lin, S.C. A behavioral model of managerial perspectives regarding technology acceptance in building energy management systems. Sustainability 2016, 8, 641. [Google Scholar] [CrossRef]
  49. Broman Toft, M.; Schuitema, G.; Thøgersen, J. Responsible technology acceptance: Model development and application to consumer acceptance of Smart Grid technology. Appl. Energy 2014, 134, 392–400. [Google Scholar] [CrossRef]
  50. Venkatesh, V.; Morris, M.G.; Davis, G.B.; Davis, F.D. User acceptance of information technology: Toward a unified view. MIS Q. 2017, 27, 425–478. [Google Scholar] [CrossRef]
  51. Kollmuss, A.; Agyeman, J. Mind the Gap: Why do people act environmentally and what are the barriers to pro-environmental behavior? Environ. Educ. Res. 2002, 8, 239–260. [Google Scholar] [CrossRef]
  52. Courtenay-Hall, P.; Rogers, L. Gaps in Mind: Problems in environmental knowledge-behaviour modelling research: Environmental Education Research. Environ. Educ. Res. 2002, 8. [Google Scholar] [CrossRef]
  53. Kennedy, E.H.; Beckley, T.M.; McFarlane, B.L.; Nadeau, S. Why we don’t “walk the talk”: Understanding the environmental values/behaviour gap in Canada. Hum. Ecol. Rev. 2009, 16, 151–160. [Google Scholar]
  54. Sheeran, P.; Abraham, C. Mediator of moderators: Temporal stability of intention and the intention-behavior relation. Personal. Soc. Psychol. Bull. 2003, 29, 205–215. [Google Scholar] [CrossRef] [PubMed]
  55. Frederiks, E.R.; Stenner, K.; Hobman, E.V. Household energy use: Applying behavioural economics to understand consumer decision-making and behaviour. Renew. Sustain. Energy Rev. 2015, 41, 1385–1394. [Google Scholar] [CrossRef]
  56. Tsoutsos, T.D.; Stamboulis, Y.A. The sustainable diffusion of renewable energy technologies as an example of an innovation-focused policy. Technovation 2005, 25, 753–761. [Google Scholar] [CrossRef]
  57. Faiers, A.; Neame, C. Consumer attitudes towards domestic solar power systems. Energy Policy 2006, 34, 1797–1806. [Google Scholar] [CrossRef] [Green Version]
  58. Guardiola, S.; Gabay, G.; Moskowitz, H.R. Renewable energy; tapping and typing the citizen’s mind. Humanomics 2009, 25, 254–267. [Google Scholar] [CrossRef]
  59. Caird, S.; Roy, R. User-Centered Improvements to Energy Efficiency Products and Renewable Energy Systems: Research on Household Adoption and Use. Int. J. Innov. Manag. 2008, 12, 327–355. [Google Scholar] [CrossRef]
  60. Sovacool, B.K. Renewable Energy: Economically Sound, Politically Difficult. Electr. J. 2008, 21, 18–29. [Google Scholar] [CrossRef]
  61. Reddy, S.; Painuly, J.P. Diffusion of renewable energy technologies-barriers and stakeholders’ perspectives. Renew. Energy 2004, 29, 1431–1447. [Google Scholar] [CrossRef]
  62. Guy, S.; Shove, E. A Sociology of Energy, Buildings and the Environment; Routledge: London, UK, 2000; p. 164. [Google Scholar]
  63. McKenna, E.; Richardson, I.; Thomson, M. Smart meter data: Balancing consumer privacy concerns with legitimate applications. Energy Policy 2012, 41, 807–814. [Google Scholar] [CrossRef] [Green Version]
  64. Schleicher-Tappeser, R. How renewables will change electricity markets in the next five years. Energy Policy 2012, 48, 64–75. [Google Scholar] [CrossRef]
  65. Sovacool, B.K. Rejecting renewables: The socio-technical impediments to renewable electricity in the United States. Energy Policy 2009, 37, 4500–4513. [Google Scholar] [CrossRef]
  66. Palm, J.; Tengvard, M. Motives for and barriers to household adoption of small-scale production of electricity: Examples from Sweden. Sustain. Sci. Pract. Policy 2011, 7, 6–15. [Google Scholar] [CrossRef]
  67. Döbelt, S.; Jung, M.; Busch, M.; Tscheligi, M. Consumers’ privacy concerns and implications for a privacy preserving Smart Grid architecture—Results of an Austrian study. Energy Res. Soc. Sci. 2015, 9, 137–145. [Google Scholar] [CrossRef]
  68. Schroeder, S.T.; Costa, A.; Obe, E. Support schemes and ownership structures—The policy context for fuel cell based micro-combined heat and power. J. Power Sources 2011, 196, 9051–9057. [Google Scholar] [CrossRef]
  69. Caird, S.; Roy, R. Adoption and Use of Household Microgeneration Heat Technologies. Low Carbon Econ. 2010, 1, 61–70. [Google Scholar] [CrossRef]
  70. Michaels, L.; Parag, Y. Motivations and barriers to integrating “prosuming” services into the future decentralized electricity grid: Findings from Israel. Energy Res. Soc. Sci. 2016, 21, 70–83. [Google Scholar] [CrossRef]
  71. Islam, T.; Meade, N. The impact of attribute preferences on adoption timing: The case of photo-voltaic (PV) solar cells for household electricity generation. Energy Policy 2013, 55, 521–530. [Google Scholar] [CrossRef]
  72. Leenheer, J.; de Nooij, M.; Sheikh, O. Own power: Motives of having electricity without the energy company. Energy Policy 2011, 39, 5621–5629. [Google Scholar] [CrossRef]
  73. Hansla, A.; Gamble, A.; Juliusson, A.; Gärling, T. Psychological determinants of attitude towards and willingness to pay for green electricity. Energy Policy 2008, 36, 768–774. [Google Scholar] [CrossRef]
  74. Venkatesh, V.; Bala, H. Technology acceptance model 3 and a research agenda on interventions. Decis. Sci. 2008, 39, 273–315. [Google Scholar] [CrossRef]
  75. Sternad, S.; Bobek, S. Impacts of TAM-based External Factors on ERP Acceptance. Procedia Technol. 2013, 9, 33–42. [Google Scholar] [CrossRef]
  76. Surendran, P. Technology Acceptance Model: A Survey of Literature. Int. J. Bus. Soc. Res. 2012, 2, 175–178. [Google Scholar] [CrossRef]
  77. Huijts, N.M.A.; Molin, E.J.E.; Steg, L. Psychological factors influencing sustainable energy technology acceptance: A review-based comprehensive framework. Renew. Sustain. Energy Rev. 2012, 16, 525–531. [Google Scholar] [CrossRef]
  78. Hair, J.F., Jr.; Hult, G.T.M.; Ringle, C.; Sarstedt, M. A Primer on Partial Least Squares Structural Equation Modeling (PLS-SEM); Sage Publications: London, UK, 2016. [Google Scholar]
  79. Joe, F., Jr.; Sarstedt, M.; Hopkins, L.; Kuppelwieser, V.G. Partial least squares structural equation modeling (PLS-SEM): An emerging tool in business research. Eur. Bus. Rev. 2014, 26, 106–121. [Google Scholar] [CrossRef]
  80. Bentler, P.M. SEM with simplicity and accuracy. J. Consum. Psychol. 2010, 20, 215–220. [Google Scholar] [CrossRef] [PubMed]
  81. Nishimura, R.; Wagner, J.; Elliott, M. Alternative Indicators for the Risk of Non-response Bias: A Simulation Study. Int. Stat. Rev. 2016, 84, 43–62. [Google Scholar] [CrossRef] [PubMed]
  82. Janssens, W.; Wijnen, K.; De Pelsmacker, P.; van Kenhove, P. Marketing Research with SPSS; Pearson Education Limited: Essex, UK, 2008. [Google Scholar]
  83. Fornell, C.; Larcker, D.F. Evaluating structural equation models with unobservable variables and measurements error. J. Mark. Res. 1981, 18, 39–50. [Google Scholar] [CrossRef]
  84. Hair, J.F.; Black, W.C.; Babin, B.J.; Anderson, R.E. Multivariate Data Analysis: A Global Perspective; Prentice Hall: Upper Saddle River, NJ, USA, 2010; ISBN 9780135153093. [Google Scholar]
  85. Henseler, J.; Ringle, C.M.; Sarstedt, M. A new criterion for assessing discriminant validity in variance-based structural equation modeling. J. Acad. Mark. Sci. 2014, 43, 115–135. [Google Scholar] [CrossRef]
  86. Stern, P.C. Toward a Coherent Theory of Environmentally Significant Behavior. J. Soc. Issues 2000, 56, 407–424. [Google Scholar] [CrossRef]
  87. Whitmarsh, L.; O’Neill, S. Green identity, green living? The role of pro-environmental self-identity in determining consistency across diverse pro-environmental behaviours. J. Environ. Psychol. 2010, 30, 305–314. [Google Scholar] [CrossRef]
  88. Zhai, P.; Williams, E.D. Analyzing consumer acceptance of photovoltaics (PV) using fuzzy logic model. Renew. Energy 2012, 41, 350–357. [Google Scholar] [CrossRef]
  89. Ozdemir, S.; Trott, P. Exploring the adoption of a service innovation: A study of Internet banking adopters and non-adopters. J. Financ. Serv. Mark. 2009, 13, 284–299. [Google Scholar] [CrossRef]
  90. Sopha, B.M.; Klöckner, C.A.; Hertwich, E.G. Adopters and non-adopters of wood pellet heating in Norwegian households. Biomass Bioenergy 2011, 35, 652–662. [Google Scholar] [CrossRef]
Figure 1. Conceptual model of this research adapted from Davis’s [12] technology acceptance model (TAM).
Sustainability 10 00186 g001
Figure 2. Conceptual model and hypotheses.
Sustainability 10 00186 g002
Figure 3. PLS-SEM results for the data on non-prosumers (N = 122). The figure shows the path coefficients. *** p < 0.001; ** p < 0.01; * p < 0.05.
Sustainability 10 00186 g003
Table 1. Policy intervention instruments for removing the barriers to adopting RET and their relationship with technology adoption theories (TAM and IDT).
Barrier to Adopting RETTAM [14]IDT [29]Policy TypePolicy Instrument
Lengthy investment payback time (e.g., [57,58])Perceived usefulnessRelative advantageEconomicSubsidies, grants, low interest loans, tax exemptions
Operational costs are unknown (e.g., [59])Perceived usefulnessRelative advantageEconomicTax exemptions, feed-in-tariffs, incentive schemes
Perceived usefulnessRelative advantageNon-economicInformation campaigns
Ease of use is of concern (e.g., [60])Perceived ease of useComplexityNon-economicInformation campaigns, straightforward permissions
RET benefits are not understood (e.g., [61,62])Perceived usefulnessRelative advantageNon-economicInformation campaigns
No interest (e.g., [61])Perceived usefulnessCompatibilityNon-economicInformation campaigns
Security and privacy concerns (e.g., [30,63])Perceived usefulnessRelative advantageNon-economic/economicInformation campaigns, data privacy laws, secure mgmt. of cost related data
Availability of turnkey solutions (e.g., [64])Perceived ease of useComplexityNon-economicCommercialization support, Information campaigns
Regulatory barriers exist (e.g., [65,66])Perceive usefulnessComplexityNon-economicChanges in legislation, regulation, bureaucracy
Table 2. Economic policy (EP) instruments and non-economic policy (NEP) instruments.
Policy InstrumentMeasurement ItemConstruct
Subsidy or grantI can get a grant from the government for the investment.EP1 [57]
Tax benefit I will have tax benefits the investment.EP2 [68]
Tax penaltyI will not get tax penalties for my energy production.EP3 [69]
Tariff structureI can reduce my monthly electricity bill.EP4 [57]
Security and accuracy of consumption dataMy consumption data is being managed securely by my energy utility.EP5 [67]
Regulation, legislationThe bureaucratic process is easy when connecting. Renewable Energy system to the grid.NEP1 [36]
Information campaignsI have a clear understanding on how the tariffs and other subsidies work.NEP2 [68]
Renewable Energy system provides real time information of my energy production and use.NEP3 [70]
Constructs were adapted from the sources indicated in the table.
Table 3. TAM- and IDT-related constructs: perceived usefulness, economic (PUE), perceived usefulness, functional (PUF), and perceived ease of use (PEOU).
TAM, IDT with RET ExamplesMeasurement ItemConstruct
Relative advantage/PU: Potential revenueI can sell my excess energy to utility company.PUE1 [71]
Relative advantage/PU: predictable revenue streamsI will get a guaranteed fixed price for the excess energy I sell (e.g., fixed feed-in tariffs).PUE2 [36]
Relative advantage/PU: Availability of useful informationI can get information of electricity price peaks.PUF1 [70]
Relative advantage/PU: Availability of useful servicesAvailability of services that allow easy access to monitor both production and use of the system.PUF2 [69]
Compatibility/PU: ability to manage the systemI can adjust the energy system configurations myself.PUF3 [70]
Relative advantage/PU: free from utilityEnergy autonomy (energy production independently from utility).PUF4 [72]
Complexity/PEOU: low threshold to purchaseReady- to use solution (equipment, installation, maintenance, business model) is available.PEOU1 [64]
Complexity/PEOU: technical installationThe easiness of installation.PEOU2 [36]
Complexity/PEOU: Availability of turnkey solutionAll the equipment and installation are available from a single, one-stop shop.PEOU3 [64]
Constructs were adapted from the sources indicated in the table.
Table 4. Constructs related to attitude toward using (ATU).
TRA, TPB Measurement ItemConstruct
TPB/TRA: Subjective normIt is important for me to increase my green energy usage.ATU1
TPB: Normative beliefIt is important to use Renewable Energy to reduce polluting.ATU2
TRA: Attitude to the specific behaviorI am interested in paying more for environmentally friendly products and services.ATU3
TRA: Attitude to the specific behaviorI would be interested in e.g., washing dishes and laundry during non-peak hours to save energy.ATU4
Table 5. Demographic profile of the respondents (N = 197) representing the households.
CharacteristicDescriptionShare of Respondents (%)
Age group18–2418.4
25–4040.3
40–5515.3
>5526.0
Educational levelPrimary school4.7
Secondary school28.1
Bachelor’s degree19.3
Master’s degree47.9
Household income/month<3000 €38.5
3000–6000 €37.0
>6000 €24.5
Table 6. Analysis of variance between the attitudes of the prosumers and the consumers.
Measurement ItemConstructSig.
My consumption data being managed securely by my energy utility (EP 4)0.096 *
All the equipment and installation are available from a single, one-stop shop.(PEOU 3)0.047 **
Ready to use solution (equipment, installation, maintenance, business model) is available.(PEOU 1)0.080 *
I can get information of electricity price peaks.(PUF 1)0.058 *
It is important for me to increase my green energy usage.(ATU 1)0.048 **
I can sell my excess energy to utility company. (PUE 1)0.046 **
Note: ** p < 0.05, * p < 0.10.
Table 7. Permutation test results for the total effects on prosumers and consumers.
ProsumersConsumerPermutation p-Values
PEOU ➔ ATU0.0700.3230.118
PEOU ➔ PUF0.3090.0960.330
EP ➔ ATU0.1160.1360.893
EP ➔ PEOU0.2180.1720.743
EP ➔ PUE0.3390.5090.284
EP ➔ PUF0.3980.4090.909
NEP ➔ ATU0.0620.2430.014
NEP ➔ PEOU0.1750.5200.058
NEP ➔ PUE0.1930.2370.877
NEP ➔ PUF0.1380.3680.162
PUE ➔ ATU0.221−0.0560.074
PUF ➔ ATU0.0800.2780.274
Table 8. The six components included in the conceptual model.
Measurement ItemEPATUPEOUNEPPUEPUF
EP 10.8070.1330.106 0.168
EP 20.7740.103 0.332
EP 30.6190.1800.1320.324−0.258
EP 40.510 0.1620.2520.180
EP 50.4810.1810.132 0.3340.189
ATU 10.1870.826 0.234
ATU 2 0.783
ATU 30.1690.7780.2570.1890.118
PEOU 1 0.8490.123 0.110
PEOU 20.177 0.7720.139 0.105
PEOU 30.1560.1470.6800.1380.2270.106
NEP 1 0.103 0.8640.182
NEP 20.1620.2740.2170.6580.168
NEP 30.3440.1070.2600.617 0.138
PUE 10.215 0.1690.1390.8120.121
PUE 20.311 0.1800.811
PUF 10.230−0.156 −0.103 0.727
PUF 2 0.1780.244 0.645
PUF 30.308−0.2020.104 0.2090.591
PUF 4−0.1230.1550.1540.2300.1590.567
Rotation method: Varimax with Kaiser normalization.
Table 9. Analysis of the model with consumer data: descriptive statistics and construct properties.
ConstructItemMVSDStandard LoadingCACRAVE
Policy (non-economic)NEP 16.091.3110.8220.7380.8510.656
NEP 25.601.5790.824
NEP 35.561.4770.784
Policy (economic) EP 15.201.7990.8290.8010.8620.560
EP 25.551.7650.834
EP 36.101.5230.671
EP 45.201.7930.598
EP 56.131.2630.780
Perceived ease of use PEOU 15.731.3140.8670.8240.8950.739
PEOU 25.781.2890.876
PEOU 35.431.5800.837
Perceived usefulness, functionalPUF 15.201.5690.7910.7040.8170.533
PUF 25.641.2900.559
PUF 35.521.6140.679
PUF 45.531.5980.856
Perceived usefulness, economicPUE 15.661.4640.9340.8620.9350.879
PUE 25.461.6120.941
Attitude toward useATU 15.701.4430.9060.8150.8880.727
ATU 26.231.2860.917
ATU 35.121.4410.721
Mean value (MV); Std. dev. (SD); Cronbach’s alpha (CA); Composite reliability (CR); Avg. variance extracted (AVE).
Table 10. Fornell–Larcker criterion and the HTMT values of the consumer data.
ATUPEOUEPNEPPUEPUF
ATU0.853
PEOU0.403 (0.468)0.860
EP0.373 (0.447)0.461 (0.560)0.748
NEP0.415 (0.521)0.616 (0.782)0.556 (0.740)0.810
PUE0.230 (0.258)0.426 (0.503)0.640 (0.733)0.520 (0.654)0.937
PUF0.385 (0.463)0.473 (0.614)0.613 (0.771)0.595 (0.815)0.577 (0.724)0.730
Note: The HTMT values of the correlations are in parentheses.
Table 11. All effects of the constructs on the target variable.
ATUPEOUEPNEPPUEPUF
ATU
PEOU0.323 0.096
EP0.1360.172 0.5090.409
NEP0.2430.520 0.2370.368
PUE−0.056
PUF0.278
Table 12. Structural relationships of constructs and testing of hypotheses with consumer data.
HypothesisPathModel for ConsumersCoefficientt-Valuep-Values
H1aNEP ➔ PEOUSupported0.5205.2140.000
H1bNEP ➔ PUFSupported0.3183.2080.001
H1cNEP ➔ PUESupported0.2372.2150.027
H2aEP ➔ PEOURejected0.1721.7010.090
H2bEP ➔ PUFSupported0.3923.9760.000
H2cEP ➔ PUESupported0.5094.8740.000
H3aPEOU ➔ ATUSupported0.2963.1590.002
H3bPEOU ➔ PUFRejected0.0961.0200.308
H4PUF ➔ ATUSupported0.2782.5130.012
H5PUE ➔ ATURejected−0.0560.5130.608

