Article

Improving Eco-Efficiency through Waste Reduction beyond the Boundaries of a Firm: Evidence from a Multiplant Case in the Ceramic Industry

Department of Management, Economics and Industrial Engineering, Politecnico di Milano, 20156 Milano, Italy
*
Author to whom correspondence should be addressed.
Sustainability 2018, 10(1), 167; https://doi.org/10.3390/su10010167
Submission received: 1 December 2017 / Revised: 29 December 2017 / Accepted: 8 January 2018 / Published: 11 January 2018

Abstract

:
To pursue eco-efficiency, one of the most important principles is the sustainable use of resources. The challenge in resource use improvement lies in a clear assessment of resource utilization. However, this evaluation is currently performed within the scope of a company and such an approach is not sustainable anymore in a world with increasingly complex production systems. This paper provides a decision support system (DSS) to disclose where wastes absorb resource capacity of a whole production system beyond the boundaries of a firm. In this way, an intervention priority plan can be established to effectively improve the eco-efficiency of production systems by considering interactions among players of a multiplant or supply chain context. An implementation of the DSS is proposed for the ceramic industry to test it and explore the potential benefits. Results confirm that the DSS can effectively enable different actors to understand how significant inter-firm saving opportunities can be identified.

1. Introduction

The search for sustainability is currently a highly relevant research topic, as well as a priority for industries across the globe. Eco-efficiency is well recognized as a key management philosophy to generate sustainable improvements by encouraging companies to pursue for environmental improvements that yield simultaneously economic benefits.
One of the most important principles is represented by the sustainable use of resources. In fact, trends such as growth of world population, global energy demand, and economic activity have led to a substantial increase in the global demand for resources since the start of the 20th century. As resource supplies are limited and cannot meet the requirements of steady growth, the problem of scarcity will tend to grow to more acute extent in the future. Europe has begun to become aware of the urgent need for a change of direction, and the “Roadmap to a Resource Efficient Europe” has been initiated towards a greener economy heading for lower environmental impacts, while keeping a high standard of living as well as economic competitiveness [1]. In order to meet the needs of the present without compromising the abilities of future generations, the manufacturing industry, as one of the main resource consumers (European Parliament 2012), plays a key role [2,3].
In such a context, increasing resource efficiency, that is, improving productivity and reducing production costs while simultaneously negative impacts on the environment [4,5], appears to be coming of age [6]. As material and energy costs represent at least 50% of the overall costs of manufacturing companies, European industries have anticipated potential savings of around $630 billion US per year through improved use of resources [7].
Even though resource efficiencies can be achieved through purchasing [8], it is in reducing waste at all stages in the production of a product that the large savings can be made [9,10]. Resource losses in production mean a non-productive and huge amount of input in the upstream chain and a considerable increase in the total cost. This comes about because businesses pay multiple times for their resources. Not only do they pay to purchase resources and pay to dispose materials that end up as waste, they also pay for labour, energy, and material costs associated with generating, storing, and handling the wastes.
Despite the strong need for waste reduction in industry, enhancing operational resources usage is a complex task when considering production systems, namely, multiplant systems, networks, districts or supply chains. In such an environment, flows merge together and single system parts influence each other. Companies may often experience synergies or contrasting impacts from the same intervention [11,12]. Moreover, also the increasing complexity of supply network is making resource efficiency more and more challenging [13,14]. However, collaboration and visibility among players is a well-known approach to shift the focus from the individual company to the entire production system and improve overall sustainability both in production systems [15], as well as in other contexts such as the logistics service industry [16].
When it comes to improving existing production systems by reducing waste, the evaluation of production systems is an activity of high relevance [4,17]: evaluations enable companies to determine values or results of an operating system or a change of system, and therefore represent the base for relevant decisions in production environments. Several papers have proposed methods to evaluate industrial resource efficiency (e.g., [18,19]). However, not all the approaches take an eco-efficiency perspective and there is a lack of decision support systems based on a system-wide evaluation procedure for operational resources improvement in production systems [20]. Currently, the evaluation and assessment of materials and energy utilization are performed within the scope of a company in the most cases [2,21]: companies often do not have direct control over the activities performed and resources consumed by their partners. In most cases, they are involved in activities that generate a large amount of waste, without knowing how much it costs to perform those activities, even though they directly affect the competitive posture of the firm and the entire production system.
In increasingly complex supply networks, boosting resource efficiency via synergies between companies is the most complicated route to resource efficiency, but it can allow companies to tap the large saving that is “locked” in the interfaces between companies. More importantly, the action on the interface processes is often more effective (in terms of impact on key performance) than that on internal processes [10,22]. Competitiveness of companies, therefore, can be strongly improved by focusing on the interface processes with other supply chain members. This would offer the greatest rewards in both long-term environmental and economic savings [23].
Despite the extensive literature coverage on eco-efficiency in industry, waste reduction in production systems seems to be understudied. The objective of the paper is to propose a decision support system (DSS) for assessing the overall eco-efficiency performance and supporting waste reduction of a process system, intended as a multiplant system, a network, a districts or a supply chain, considering interactions among players and with an eco-efficiency perspective. The potential benefit from the adoption of such decision support system is shown with reference to a multiplant case study in the ceramic industry.
The next section summarizes the most relevant contributions provided by the literature on existing approaches to evaluate industrial resource efficiency. Section 3 described the DSS, whereas Section 4 illustrates the case study. The result discussion can be found in Section 5 and conclusions are reported in Section 6.

2. Research Background

During the last decades, academic literature has put effort on building in-depth analysis for resource performance assessment. In order to understand the main gaps in existing approaches, a broad search was conducted. We searched databases of scientific journals for relevant methodological peer-reviewed articles on both Google Scholar and Scopus online search engines, with no exclusion/inclusion criterion related to timespan. We used different keyword combinations based on the following set: resource; waste; decision making; assessment; method; supply chain; environment; energy efficiency; resource efficiency. We also performed regular web searches, looking for examples of resource assessment methods used in the industry or developed at universities, but not necessarily published in the scientific journals we have surveyed. Finally, we cross referenced our findings with the lists of methods and tools used by SPIRE (sustainable process industry through resources and energy efficiency)-funded projects STYLE [24] and MEASURE [25] in their survey.
The search yielded over one hundred potential contributions including different methodologies. In line with objective of the paper, that is, to provide a DSS for waste reduction, we selected among them those with the highest potential to give inside information on operational resource usage to the high-level decision makers in production systems. Through such a logic, 17 methods were retained. For instance, quantitative methods such as data envelopment analysis that has been widely proposed to perform efficiency analysis in a variety of contexts (e.g., [26,27]), were excluded as their scope is to provide summarising indicators. Note that traditional cost accounting methods are not included in the analysis, as they have a strong departmental orientation and most of the material costs are direct costs (and therefore, assigned directly to products). Table 1 summarises the comparison of the selected approaches according to the following six dimensions:
  • Material efficiency, that is, whether the assessment of water, raw, indirect and other materials is included;
  • Energy efficiency, that is, whether the assessment of direct and indirect energy efficiency is included;
  • Eco-efficiency perspective, that is, whether the resource usage and the related economic implications are assessed jointly;
  • Cost allocation, that is, whether the cost allocation is considered and if it is accurately performed;
  • System perspective, that is, whether the assessment is performed at a plant, company, multiplant or supply chain level;
  • Results as absolute values, that is, whether the application provides absolute values useful for internal analysis, instead of relative values, useful only for comparative analysis.
In the table, each approach is scored with reference to each dimension on the following scale: fully satisfied, partially satisfied or not satisfied.
Interesting considerations can be drawn from Table 1:
  • Eight approaches out of 17 do not take an eco-efficiency perspective. They can be called “Resource use-driven methods”, whereas the others approaches are “Resource cost-driven methods” as they intended to assess resource usage (in terms of physical units) and its economic implications.
  • Among contributions that take an eco-efficiency perspective, almost all the approaches provide a limited accuracy of cost allocation.
  • Most approaches do not consider a holistic perspective. In the most of cases, the resource usage and therefore the identification of the sources of inefficiencies of a production system is at single plant or company level.
Among contributions that take an eco-efficiency perspective, the last three approaches reported in the table are the most completed. Material Flow Cost Accounting (MFCA) aims at improving resource and cost efficiency by proposing a material flow oriented analysis that improves the visibility on the material flows in both physical and monetary terms. Thanks to the focus on materials, such approach can be applied at different levels, from individual process steps to supply chain. However, MFCA is restricted to an arbitrary cost allocation rule, namely, the mass ratio that is not appropriate neither from an environmental and life cycle perspective nor from accounting purposes. ABC&EM integrates Activity Based Costing (ABC) and Environmental Management (EM), thus providing a suitable approach for the allocation of environmental costs. The main contribution of this integration is to help managers in understanding how to allocate environmental cost to each product more accurately through cost drivers. However, this integration does not take into account wastes as output of a process by allocating costs only to good finished products.
Compared to MFCA and ABC&EM, Extended Activity-Based Environmental Costing (ExtABEC) is more effective in cost allocation even if it is applied at company level. The logic behind ExtABEC is based on Activity Based Costing but, unlike traditional ABC, it considers as cost objectives of a production system also the by-products and waste. The concept of ‘non-product output’ or ‘waste and by-product’ enables a better understanding of the use of available resources. In addition to the actual costs of disposal, the ‘non-product output’ costs also include the resources value lost in waste and by-products generation, considering also the stage at which waste is produced [6,8,42]. As shown in Figure 1, ExtABEC considers resources, activities (split in ‘support’ and ‘core’ activities) and cost objectives (i.e., products, by-products and waste). In this way, this approach considers both those costs of resources that are accounted by means of activities and those that are directly accounted to the objects, thus overcoming the traditional control system for waste management that is mainly based on physical unit information and not on monetary values.
In order to contribute to previous literature by addressing the emerged research gap, this paper extends the ExtABEC at a company level as this is the only existing approach that takes an eco-efficient perspective and, at the same time, enable to find out where and how major industrial waste absorb resource capacity. The proposed extension is towards to a DSS for waste reduction in multiplant contexts, where significant improvement in eco-efficiency of a production system can be reached. And ExtABEC (at the company level) can be effectively innovated to across factory boundaries, as it is based on the ABC approach that is widely recognised as suitable, for instance, for application across company functions (e.g., [13,14]).

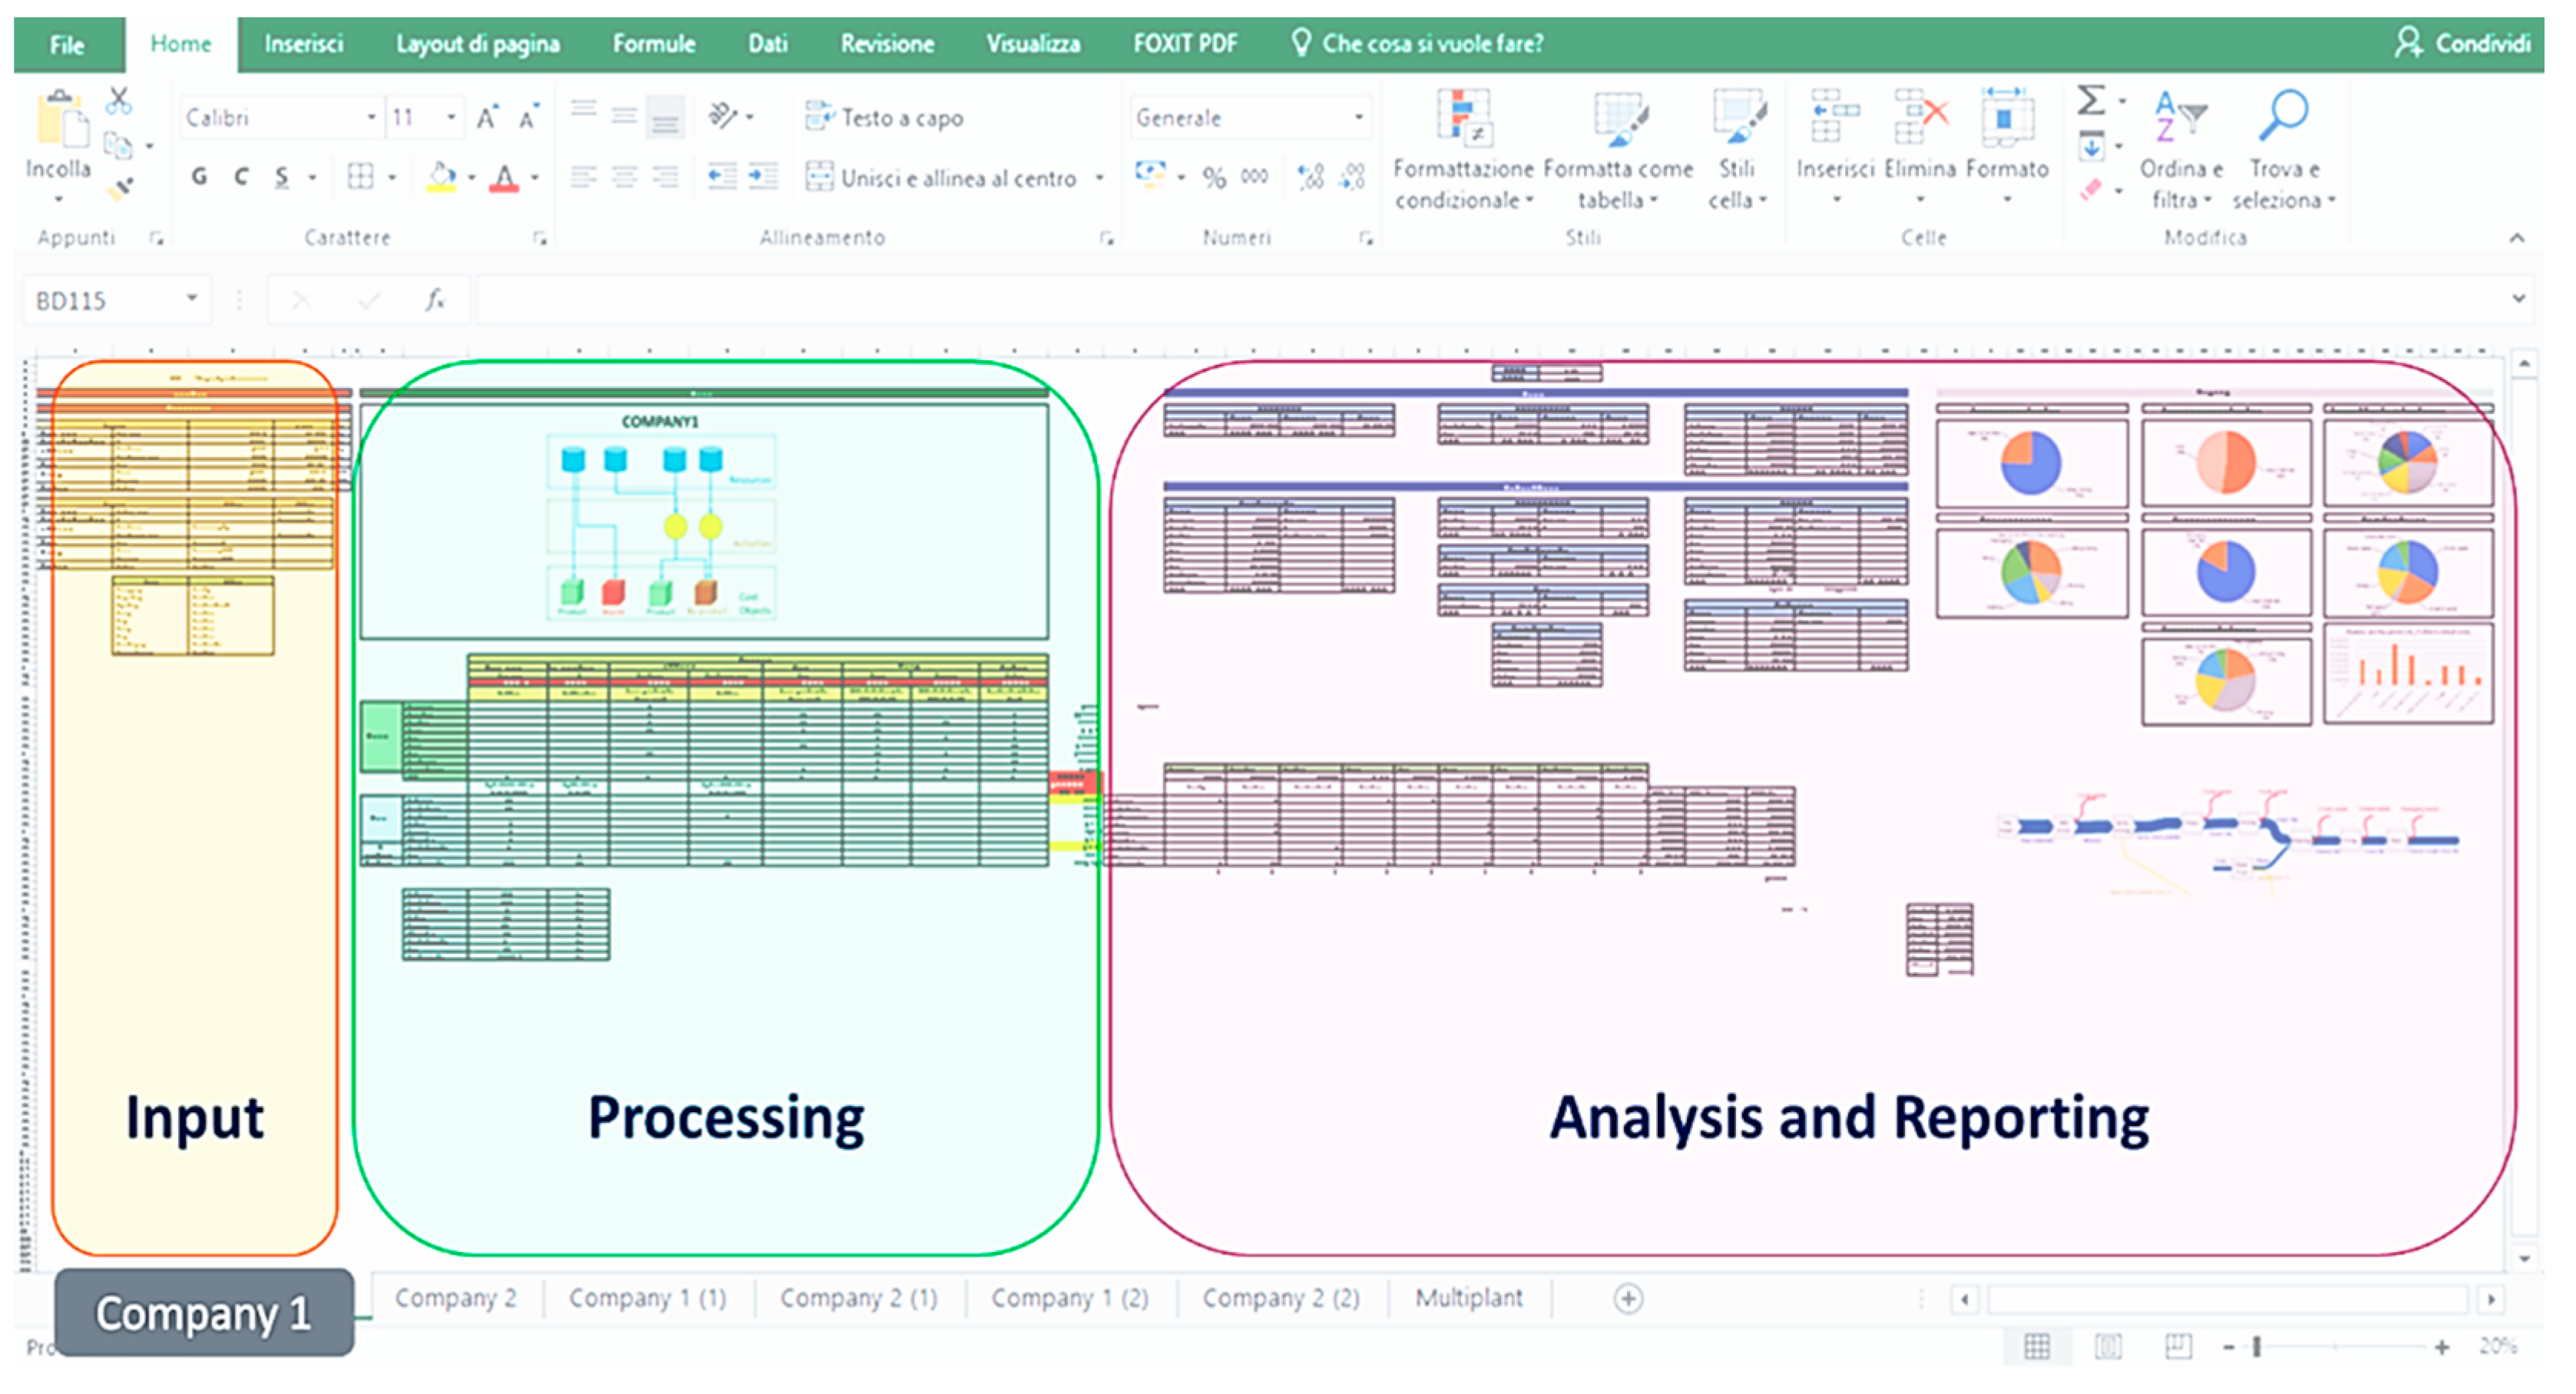
3. A DSS for Waste Reduction in Multiplant Production Systems
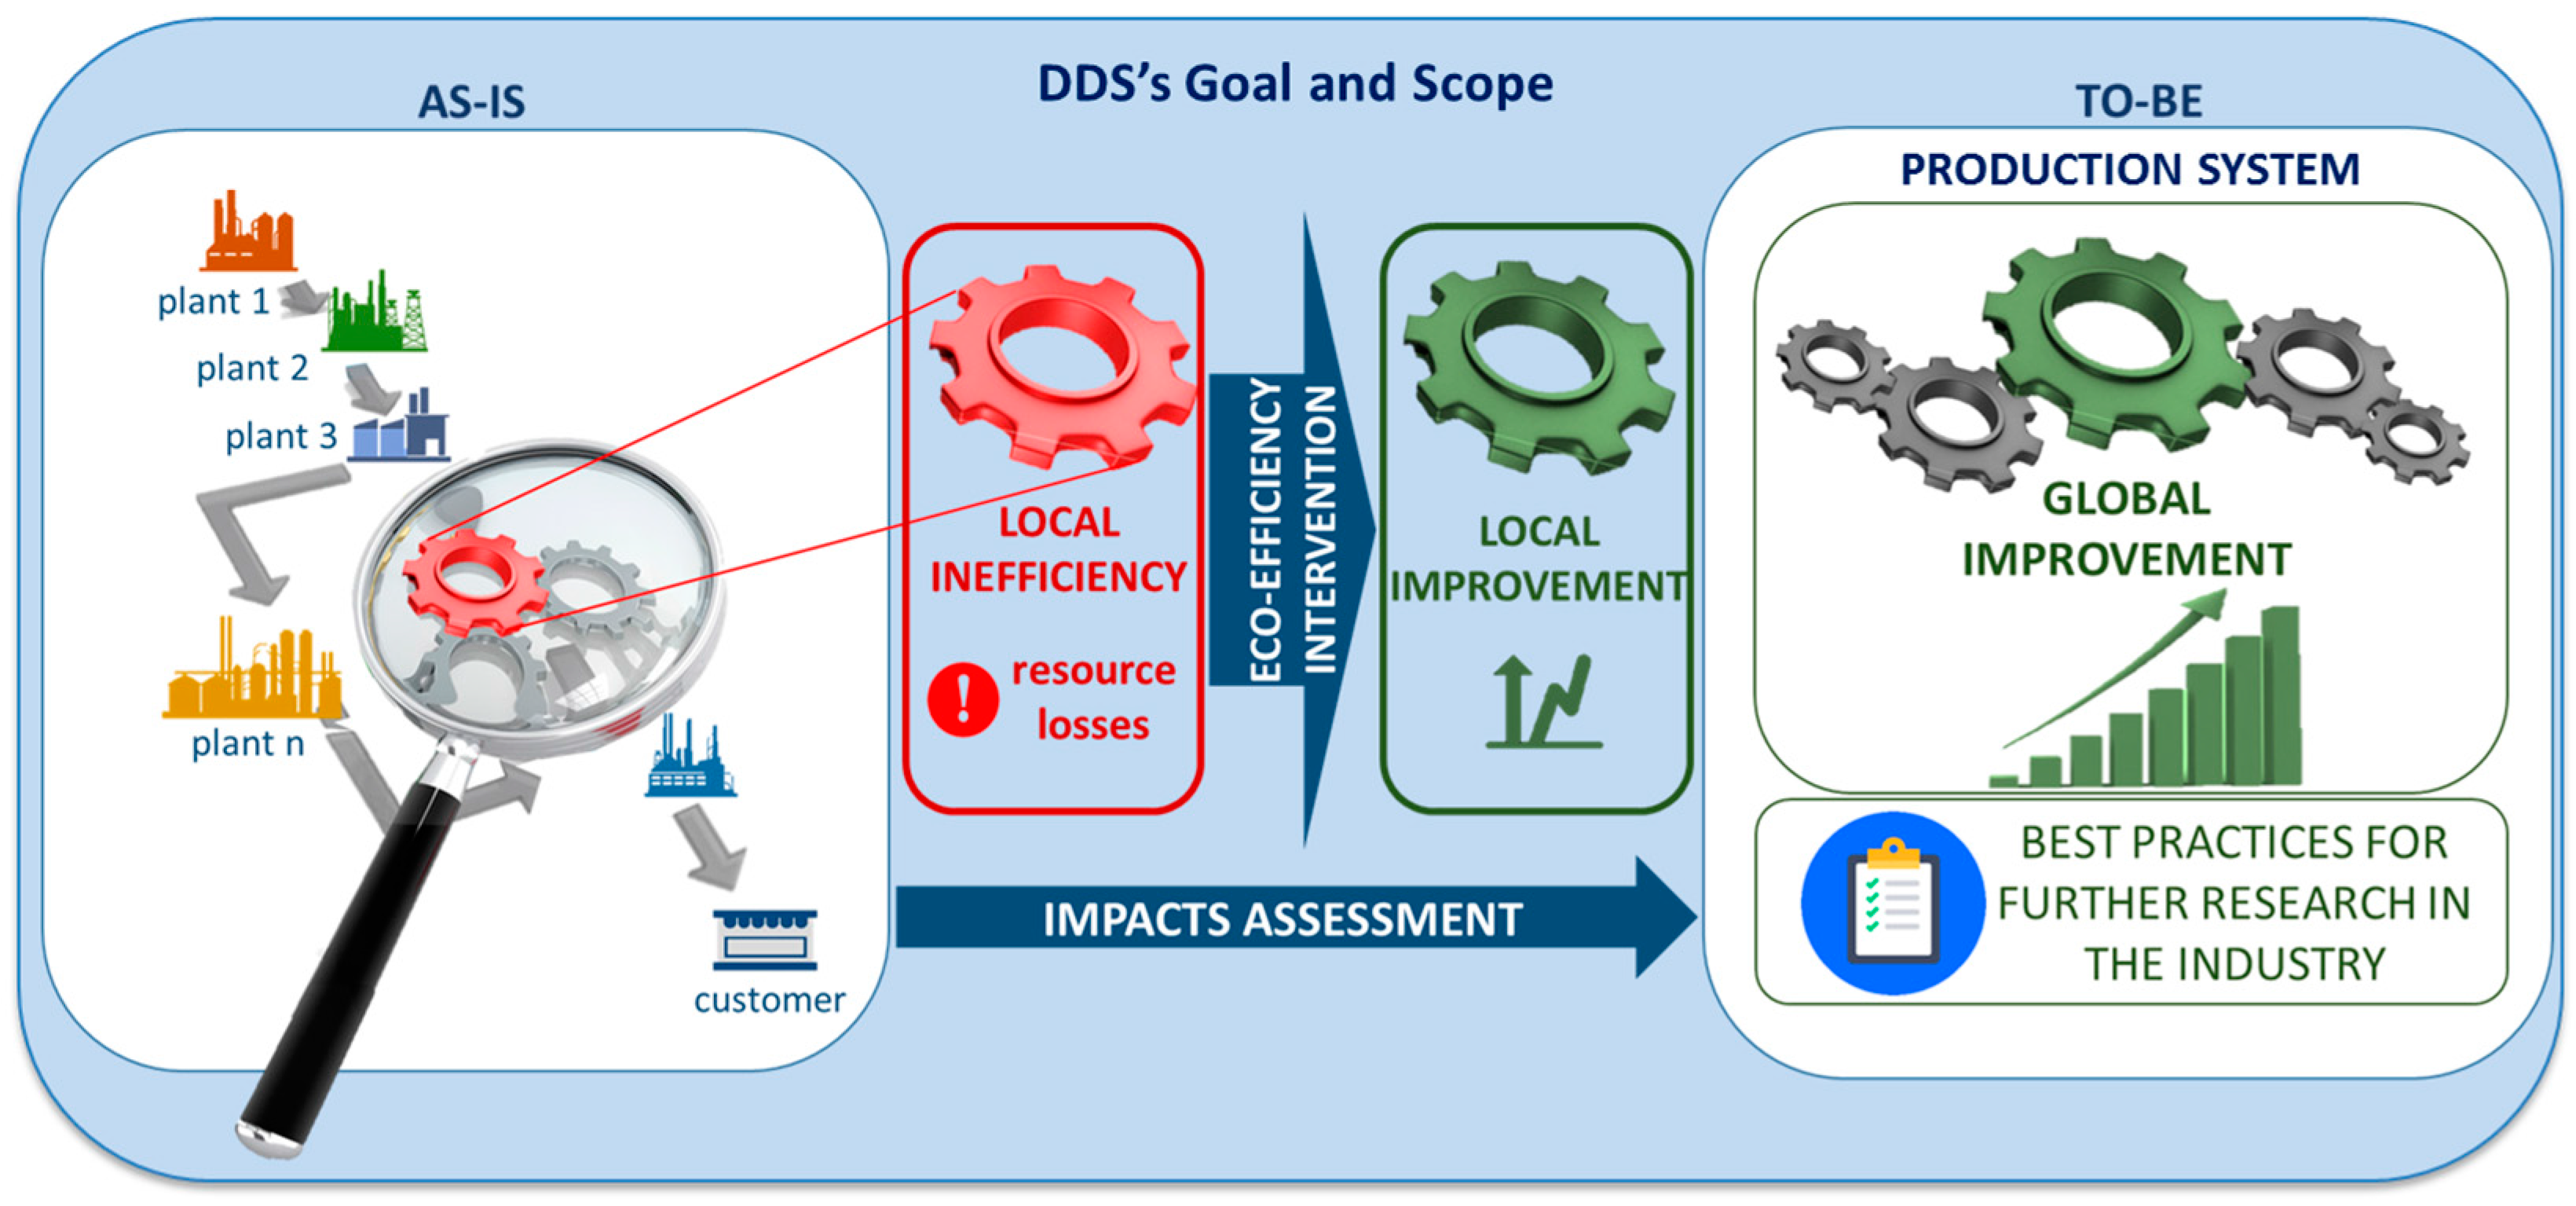
3.1. Goal and Scope

The proposed DSS aims to assess the overall eco-efficiency performance of a production system, while evaluating the efficiency of resource utilization, as well as the costs related to inefficiencies, not only at single plant or company level but also at a production system level (Figure 2). Specifically, differently from ExtABEC, it can be effectively used in multiplant and supply chain contexts to understand where the largest resource losses occur or where major industrial wastes absorb resources capacity all along a production route by assessing the impacts of interventions not only at single company level, but also at the system-wide level. The framework foster informed and sustainable decision-making processes by mapping interconnected resource flows dealing with different actors in the same production system. This would ensure a real progress in the use of resources by avoiding implementing interventions with contrasting impacts on the player involved. In this way, top management can hold useful inside information about resource intensive operations, and how much is spent on materials and energy inputs and waste. Such information are precious in order to (i) identify where the greatest opportunities for efficiencies and costs savings lie at the system-wide level; (ii) establish a correct intervention priority plan to improve those areas that demonstrate the greatest improvements to eco-efficiency performance; (iii) enhance the sharing of knowledge and best practices transfer between actors involved in the same process.
The presented DSS can be implemented on Microsoft Office-based applications or embedded in systems that are more sophisticated. It can be applied to any production system for which all the inputs and outputs of each production unit can be quantified. The DSS applicability is especially for, but not limited to, process industries because they have a high dependence on resources (energy, raw materials, and water) in their production and they share the potentially high impact they may have on the environment through their daily operations.

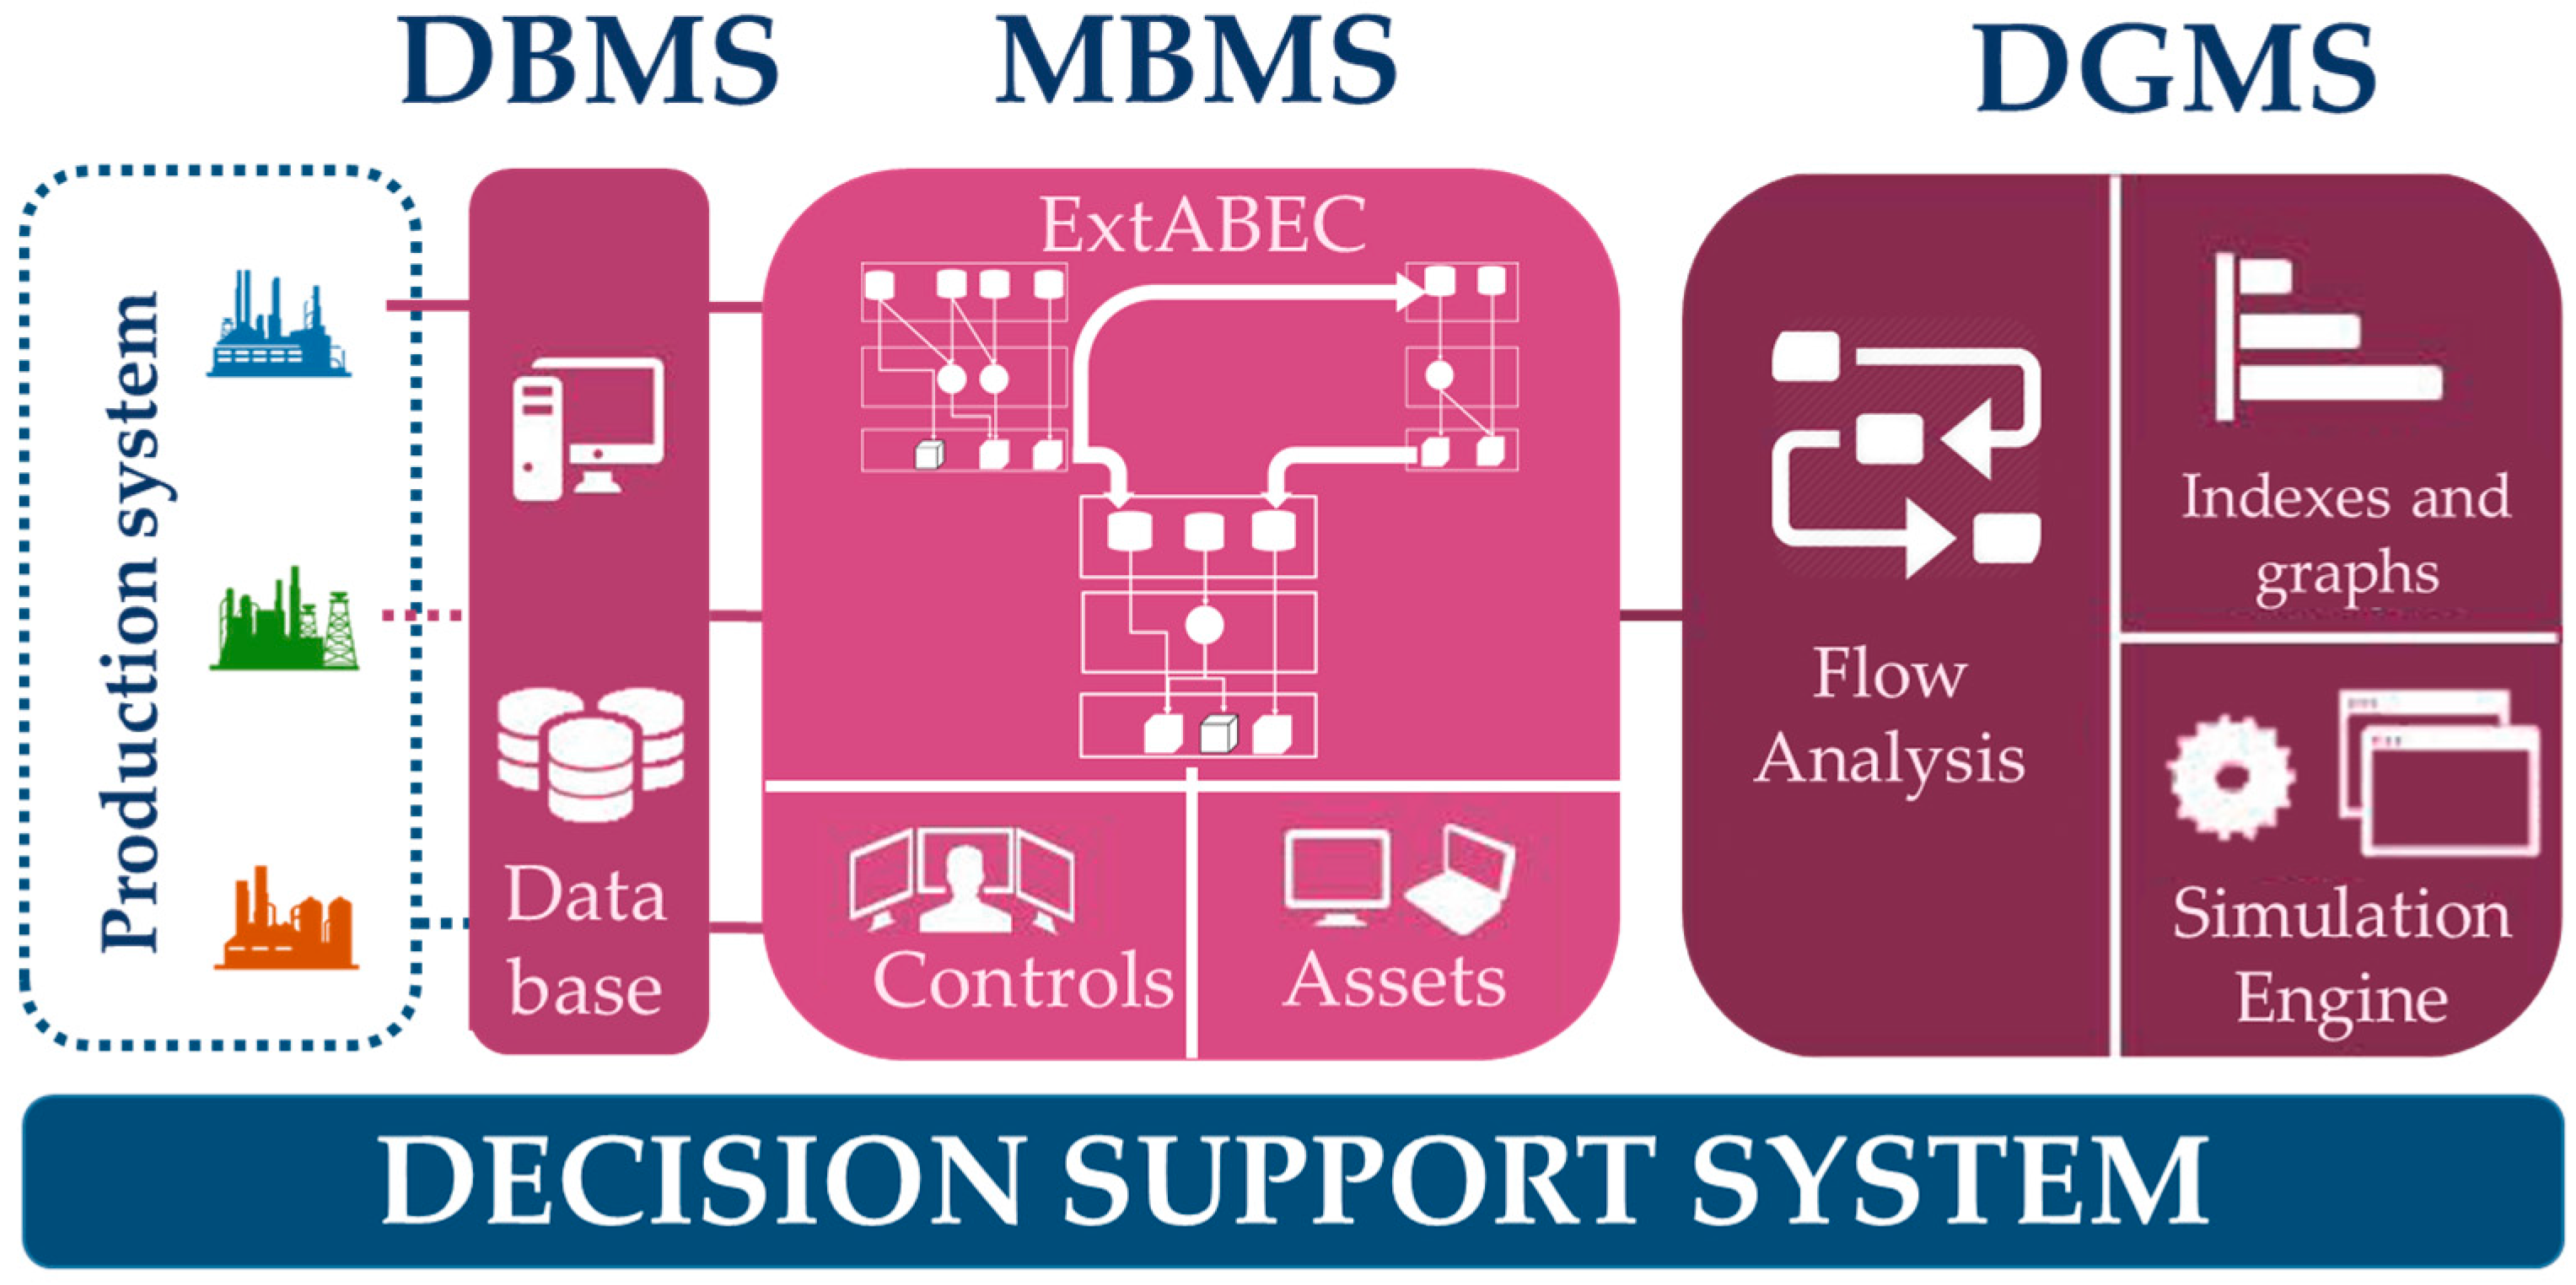
3.2. DSS’s Description

There are three fundamental components of the DSS proposed, as Figure 3 shows.
The first component is a database management system (DBMS), which serves as a data bank. It stores data that are relevant to the class of problems for which the DSS is used. As the DSS proposed is presented as a customizable tool (due to the complexity of the decision-making process involved), the available information depends strongly on the specific context (e.g., in terms of the industrial sector and type of production systems), according to kind of business relationship, length of the chain, decisional symmetry degree, and quality of available information.
A model-base management system (MBMS) represents the second component. It transforms data from the DBMS into information that is useful in decision making, by using a new version of the Extended Activity-Based Environmental Costing model. This component is neither inflexible nor rigid: as the model is complex, this part is built in such a way that makes the model transparent to users. In this way, decision makers are aware of how the system variables are interrelated, and they can also modify variables of the model, according to the specific problem and context of application. The model takes its origin from the Extended Activity-Based Environmental Costing (at company level); however, unlike this method, it considers not only resource, activity and cost objects flows of the single unit (plant or company) [6], but also flow synergies of the whole production system to which the single units belong (Figure 4).
The third component, a dialog generation and management system (DGMS) is the vehicle for investigating the results. It provides a set of graphs and indexes reporting eco-efficiency performances at single units and at a system-wide level. Considering that the DSS is based on technical input-output data and coefficients (i.e., the cost drivers), it has the advantage of including causal information and aiding predictions of the effects of interventions: the DSS requires alternative schemes as input and delivers information on the possible system behaviour. In this way, it allows users to create and compare alternative scenarios to simulate/assess impacts of interventions in a what/if approach not only at local level (plant or company) but also at system-wide level of a multiplant or supply chain context.
Hence, the proposed DSS enrich previous contribution as:
  • It considers both material and energy efficiency;
  • It takes into account not only the operational and environmental perspective, but also the economic one;
  • The cost allocation is based on Activity-Based Costing and therefore it is accurately performed;
  • It assesses both the local and global impact of alternative interventions to improve eco-efficiency, in order to implement the more suitable interventions for a whole eco-efficient improvement of a production system, without worsening the performance of the single units;
  • It provides the absolute physical and monetary values of the products, wastes and by-products of a production system.

3.3. Steps

The DSS proposed can be effectively used to support decision making with respect to the enhancement of the overall production system performance in both environmental and economic terms. In terms of outcome, in fact, it delivers a list of likely eco-efficiency enhancement interventions to be implemented that fit within the budget, time, and cost constraints of companies. The proposed approach can then be considered a solid basis to a continuous improvement process (Figure 5).
The DSS employs four steps: (i) boundaries and process modelling, (ii) ExtABEC implementation, (iii) resource efficiency analysis, and (iv) interventions evaluation.
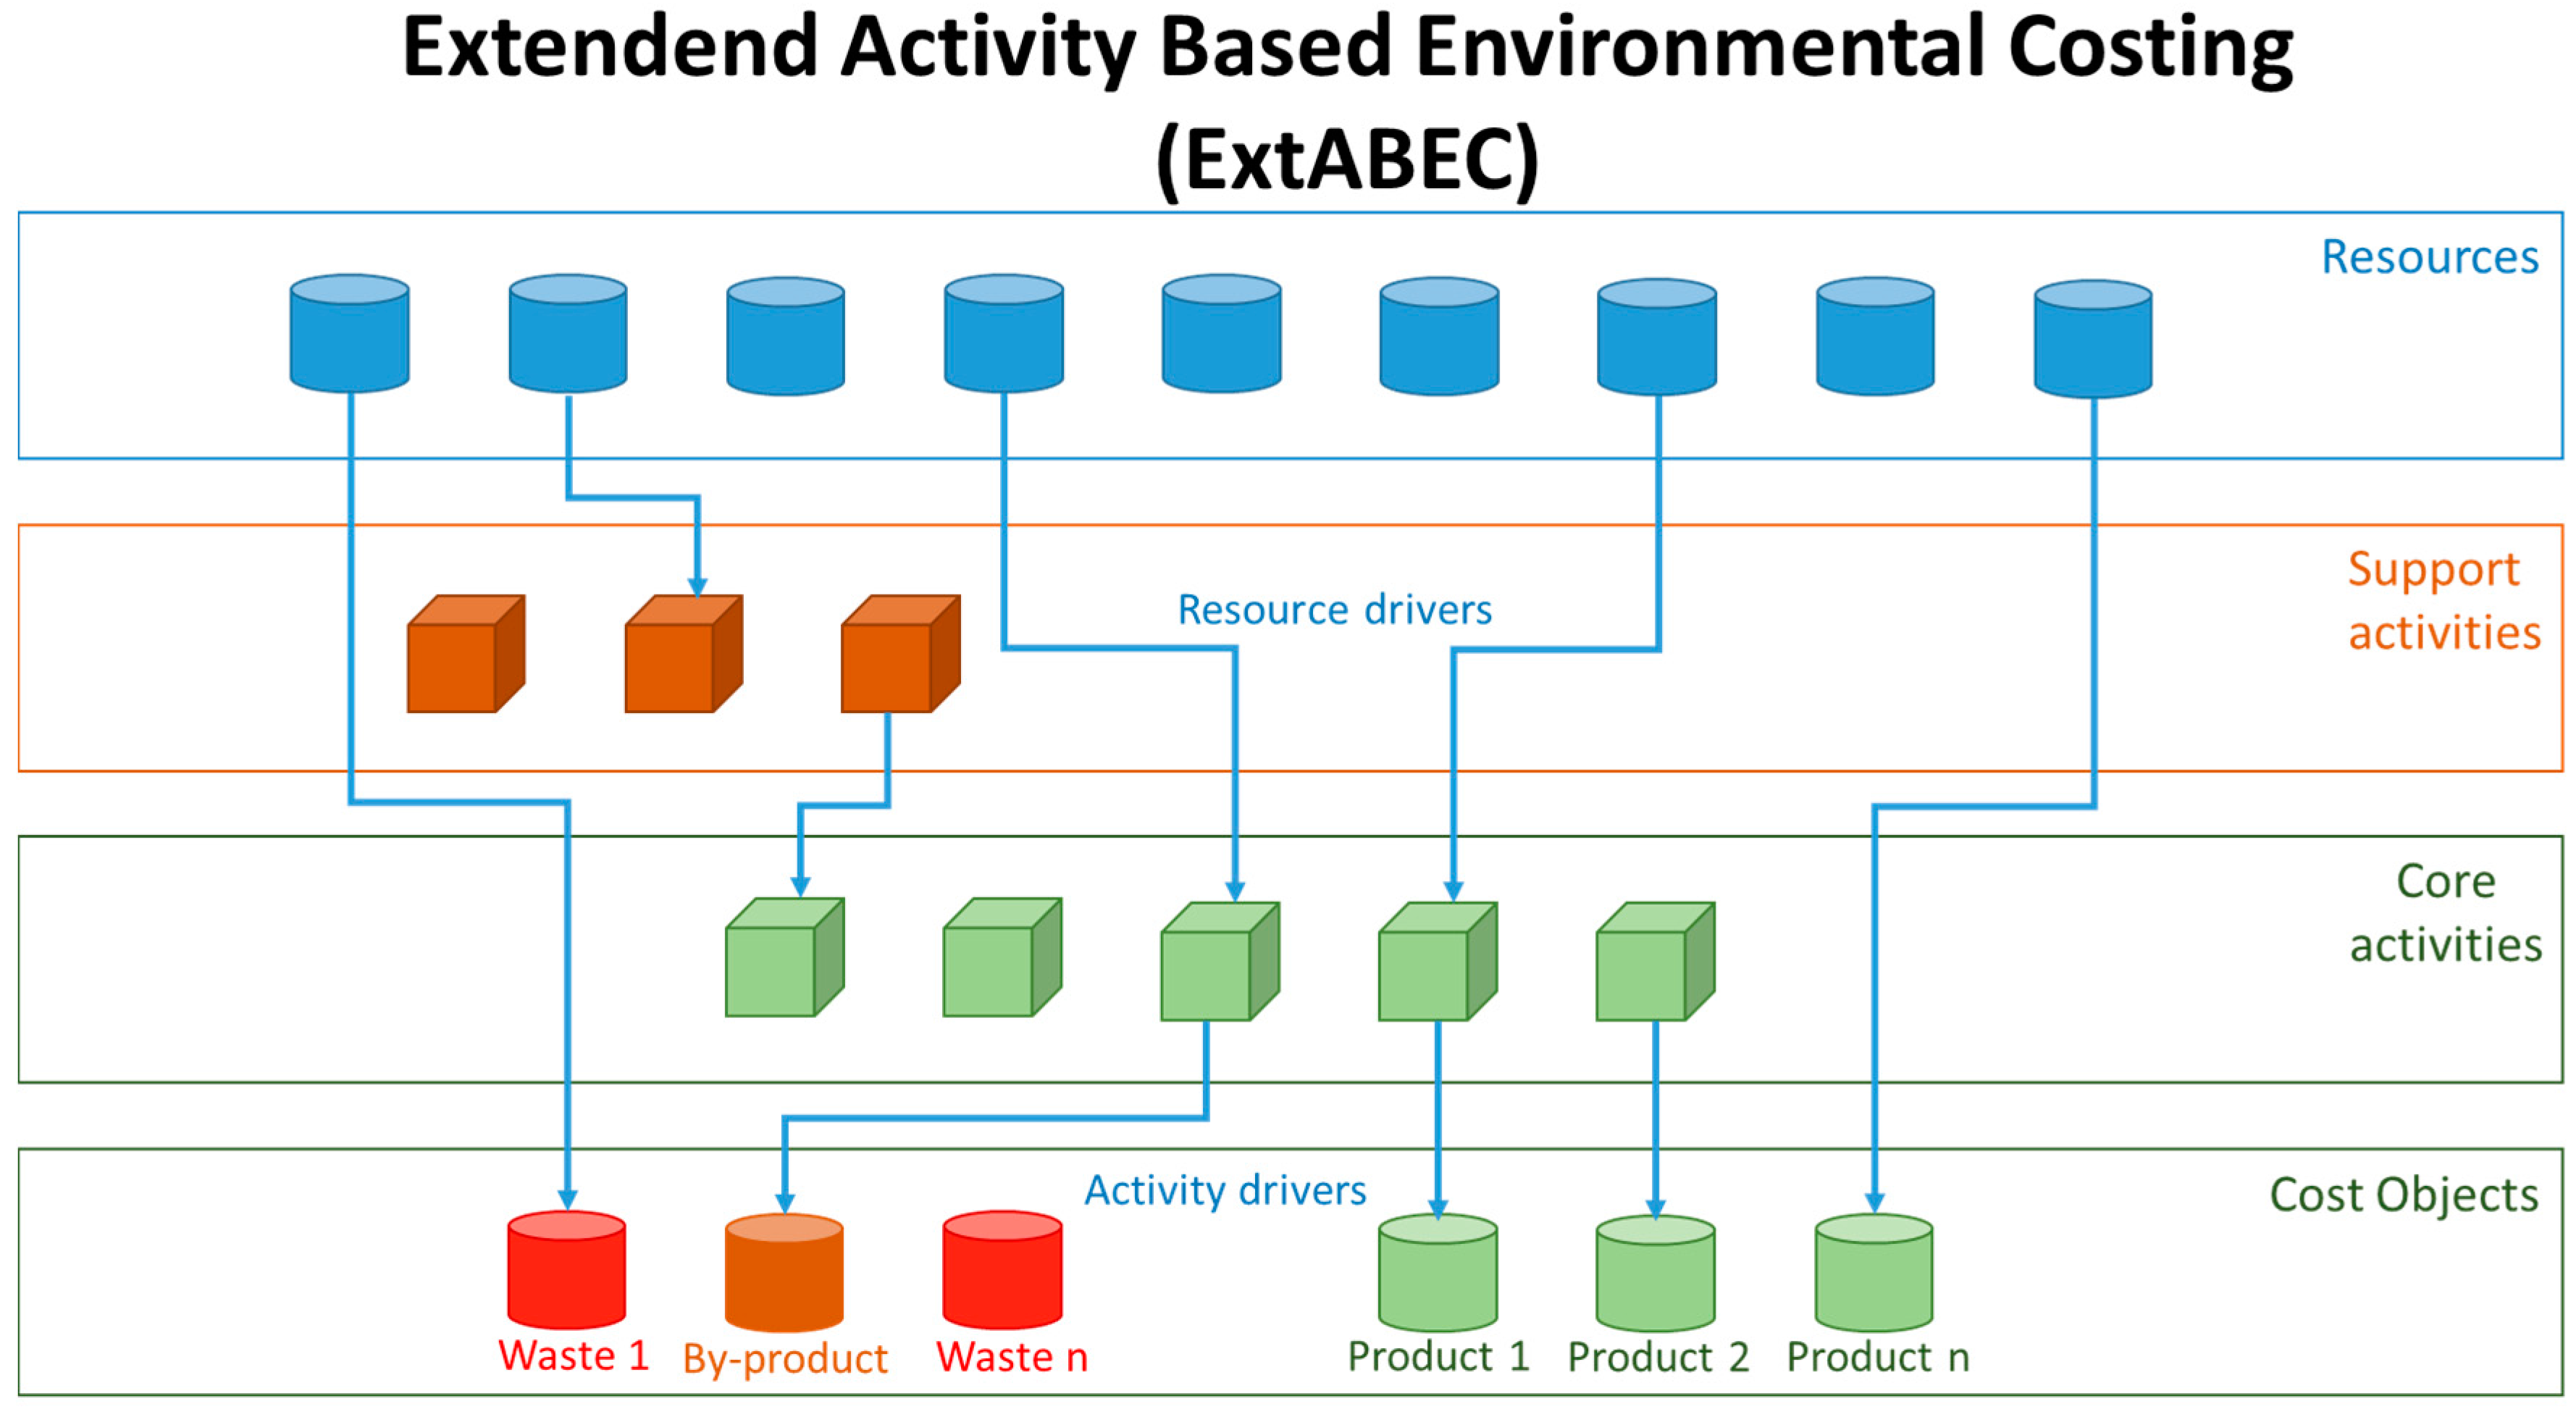
  • Boundaries and process modelling. The boundaries of the production system to be analysed are identified. Then, among all the possible set of processes of the production system under examination, users identify the most critical to be assessed and improved. The analysis then identifies the major functions performed by each member involved in the process.
  • ExtABEC implementation. This step implies the following activities:
    2.1
    Identification of the cost objects: products, by-products and wastes are selected.
    2.2
    Identification and quantification of the resources: all the resources used all along the process under analysis are identified and quantified. Resources include, for example, energy, raw materials, water, labour, and indirect materials.
    2.3
    Identification of the core activities: the way that activities consume resources is identified. The process must be broken down into the specific activities performed by each component of the production system. The analysis involves determining what activities are done within the production system, how many people, resources and time are required to perform each activity, and what operational data best reflect the performance of the activities.
    2.4
    Identification of the support activities: the activities that do not have a direct influence on products but are necessary for the process, because they support other primary activities, are identified.
    2.5
    Identification and quantification of the drivers describing the correlation between activities and support activities.
    2.6
    Identification of the resource drivers and quantification of their intensities: the way that activities adsorb resources is identified.
    2.7
    Assignment of the resources to cost objects: when possible, resources can be accounted directly to the cost objects.
    2.8
    Assignment of the resources to activities: otherwise, resources can be accounted, by means of the resource drivers, to the activities they are used by. The activity cost represents the total cost of resources used to perform a specific unit of work.
    2.9
    Identification of the activity drivers and quantification of their intensities: the way that cost objects absorb resources by means of activities is identified.
    2.10
    Assignment of the activities: by means of the activity drivers, the value of the activities is accounted to the cost objects.
    2.11
    Calculation of the cost of the products/wastes/by-products: for every cost object, the share of resources directly accounted and the share indirectly accounted through the activities is summed up.
  • Resource efficiency analysis. Thanks to flow and cost allocation carried out through ExtABEC implementation, it is possible to identify inefficiencies all along the production route (inefficiencies that are related to resources and activities value lost in the production of wastes instead of saleable products). In this way, players involved in the production route can effectively analyse resource consumption and waste generation of the system, by assessing not only single company performance but also the overall eco-efficiency of the production system analysed.
  • Interventions evaluation. To support decision-making, the potential impacts of the individual actions on the examined process are evaluated at different levels (single unit and system-wide), in order to choose improvement interventions that do not worsen the overall eco-efficiency of the production system examined. Considering that the DSS is based on technical input-output format and on coefficients (the cost drivers of ExtABEC), it effectively allows to develop and compare alternative scenarios. With this regard, the adoption of different technologies, the use of different materials, the selection of different suppliers can be evaluated to adopt the best local decision leading to a whole improvement of the eco-efficiency of the production system. The resulting changes in resource and activity costs can be traced to specific product to determine the effect on different players and therefore quantify the eco-efficiency improvement at both local and global level. Therefore, DSS effectively allows the user to develop and compare alternative scenarios to adopt the best local decision leading to a whole improvement of the eco-efficiency of the production system analysed.

4. Description of the Multiplant Case Study

The DSS was implemented in Microsoft Excel in an input-output format (Figure 6), with the twofold objective of testing and applying it using a real case. The case study is represented by an Italian ceramic company (Modena, Italy), which consists of two plants producing floor and wall tiles [43]. These two companies are autonomous and local managed, thus allowing referring to them as two distinct companies, named ‘Company 1’ and ‘Company 2’ in the rest of the paper. However, Company 1 is the focal company in relationship with Company 2.
Ceramic manufacturing is characterized by (almost) the nonexistence of material losses [44,45,46]. Indeed, any company recycles and re-uses almost all parts of the accumulated process loss within the plant due to product specifications or process requirements. Materials that cannot be recycled internally leave the plant and are supplied to other plants. Due to this, the costs associated with product losses traditionally refer only to disposal costs. The ExtABEC method, instead, highlights resource costs that are irrecoverably lost in the production. It is not possible, for various reasons, to completely prevent the production of waste or by-products; however, it is useful to try to reduce waste as much as possible while preserving the high level and quality of good output.
The general process of manufacturing glazed single-fired ceramic tiles, the object under analysis, is rather uniform and it consists of two different stages. The first stage relates to the body manufacturing which includes raw materials acquisition, mix preparation, forming, and drying, and the glaze preparation, which includes glaze raw materials acquisition, frit preparation, and grinding. The second stage involves laying the glaze on the body, which is called decoration, and the subsequent firing of the glaze body.
Regarding the waste, a European project led by the research center Instituto de Tecnología Cerámica (ITC) has shown that the following waste products are generating during the process:
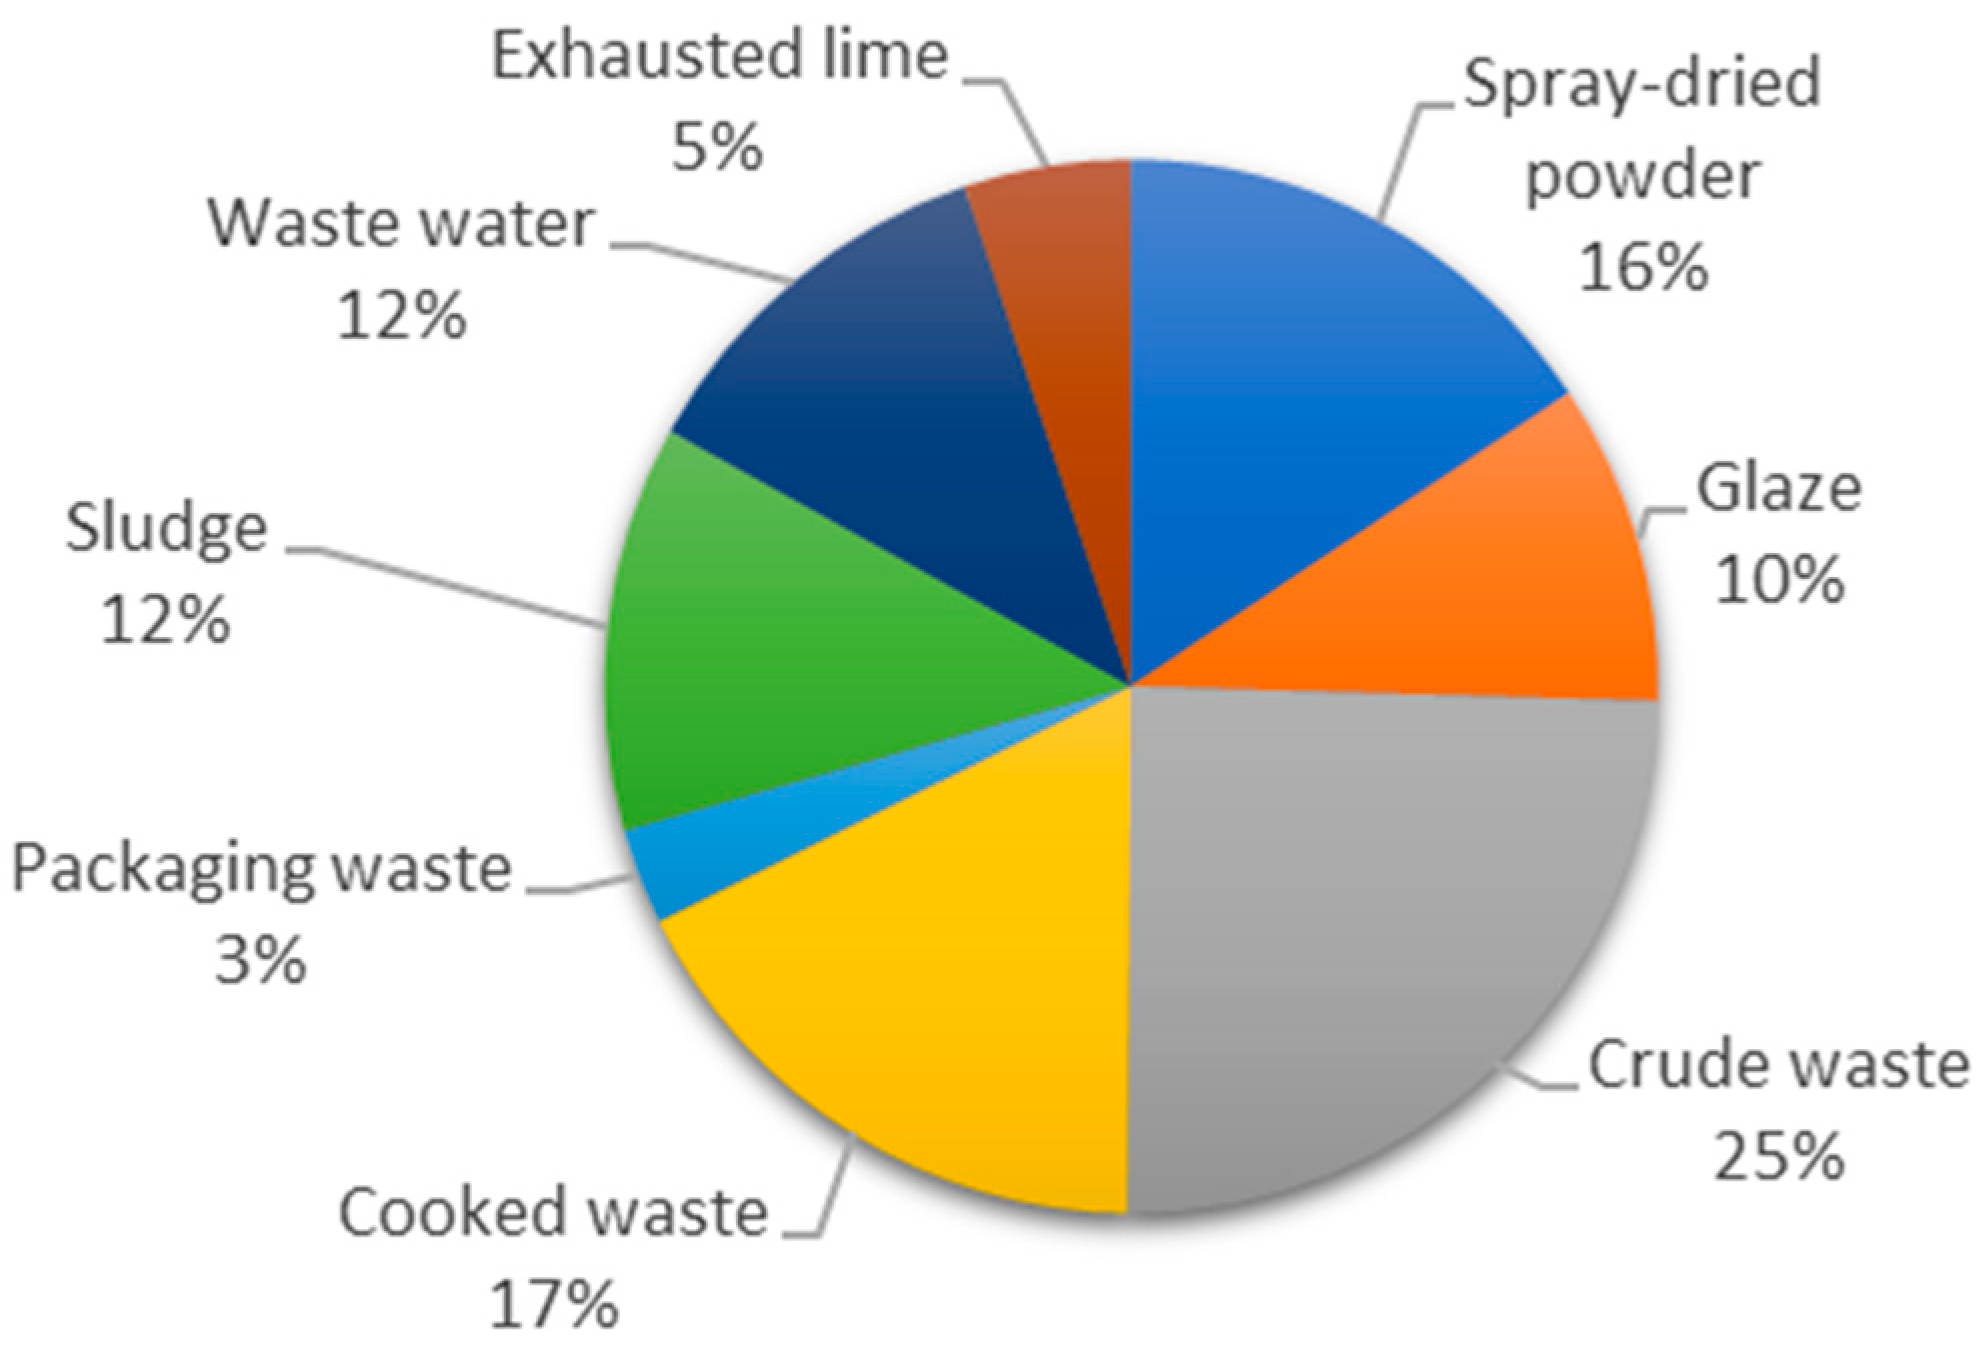
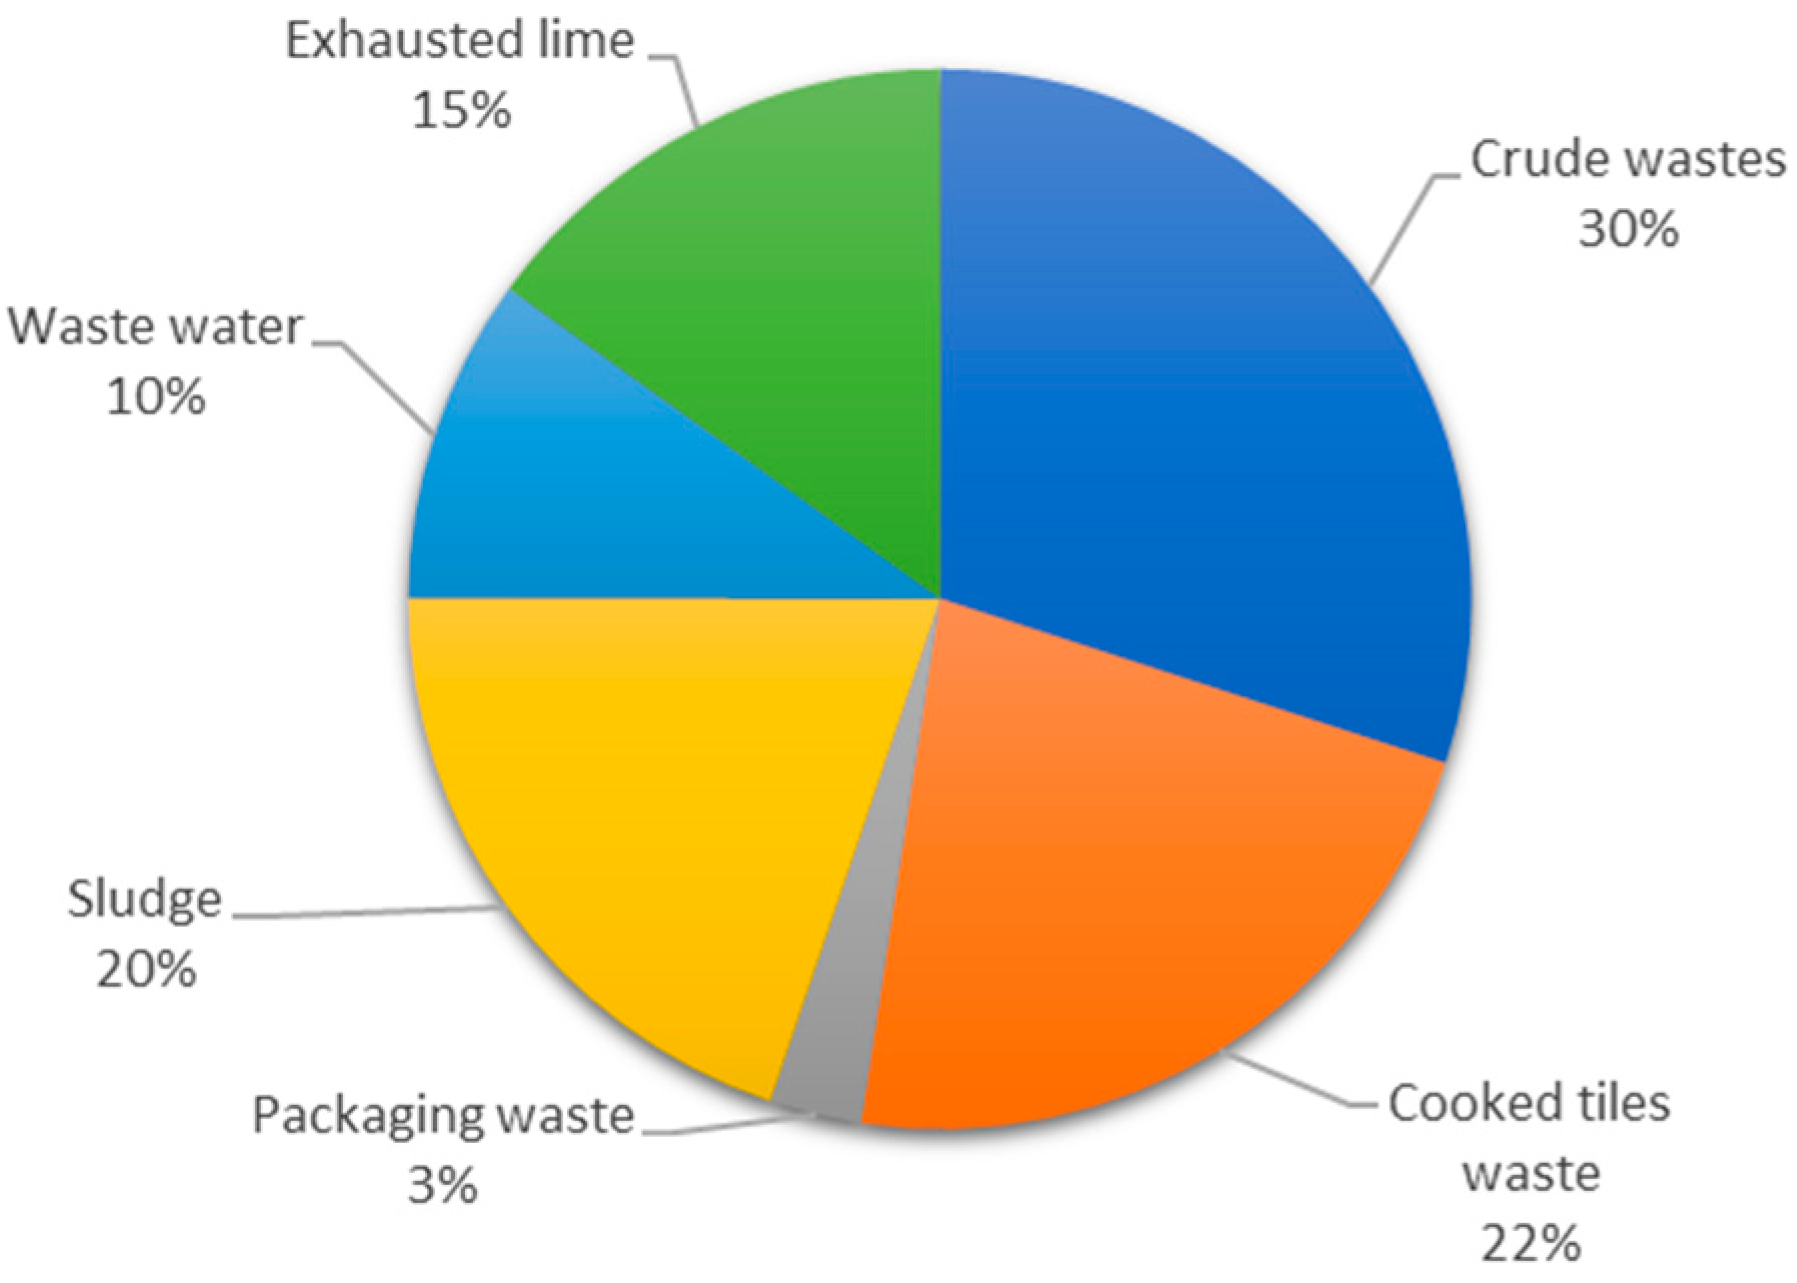
  • Crude waste. This is formed by unfired materials.
  • Cooked waste. This is the fired materials generated in the firing.
  • Sludge. This consists of the sludge obtained in the cleaning of the glaze mills.
  • Waste water. It is mainly generated from cleaning water in preparation and casting units, and in various processing activities.
  • Exhausted lime. It is generated in the glaze production stage and during the firing process.
Typical by-products are excessive spray-dried powder produced in the spray-drying stage and excessive ceramic glaze produced in the glaze production process.
Firstly, an analysis of the current scenario is carried out (AS-IS case). Then, impacts of due scenarios are assessed at plant and system levels. Scenario 1 deals with a potential improvement intervention planned by Company 1, without having a system-wide perspective that means without looking at the potential impacts on Company 2. Scenario 2, instead, considers an alternative improvement intervention Company 1 could carry out if it considers the potential impacts this intervention could have not only on its own plant, but also on Company 2 and on the whole production system. In both scenarios, input data of Company 1 are assumed to be equal to the input data of AS-IS case, both in physical and monetary units. This means that any reduction in waste and or by-products amount produced by Company 1 and/or any reduction in resources and activities value lost in ‘non-output’ generation are translated into an increase of the resources and activities value allocated to saleable products and an increase of good output quantities. This is a reasonable assumption coming from [47], who showed that firms can attain the maximum level of good output allowed by their endowment of inputs, while simultaneously reducing waste.

5. Results and Discussion

In the case study, Company 1, in AS-IS scenario, founds that crude waste represents the one waste with the higher full industrial cost (as Table 2 and Figure 7 show).
For this reason, in Scenario 1, in which the DSS is used at single plant level without considering information about Company 2, it is reasonable to invest in better presses to decrease the resource and activities value lost in waste generation, as pressing has been identified as that activity most involved in crude waste generation (in terms of value lost). In Scenario 2, in which the DSS is used at a multiplant level, instead, Company 1 finds that the spray-dried powder from Company X (i.e., a company outside the multiplant contexts) represents the main resource causing the generation of crude waste in Company 2, as well as big resource and activity value loss. Note that crude waste has the highest impact on full industrial cost for Company 2 (Figure 8).
For this reason, Company 1 takes into account the possibility of investing in facilities to convert crude waste into spray-dried powder to satisfy Company 2’s need for higher quality powder. Scenario 2 was recognized as the one leading to the biggest eco-efficiency improvement of both single plant and whole production system context (Figure 9).
Results confirm that the DSS proposed allows assessing the resource usage and therefore identifying the sources of inefficiencies of a production system at a multiplant level, in order to evaluate improvement interventions without contrasting impacts for the actors involved.
Moreover, the DSS proposed allows eco-efficiency evaluations independently of the user: low, middle, or top management for single plant (Scenario 1), or for a system-wide context (Scenario 2). Indeed, it is implemented in Microsoft Excel in an input-output format that is quite easy to use (almost everybody can use it), and it is available quite readily. The DSS works independently from the industry, as the system is developed in a modular way in order to be independent of the characteristics of the low control levels that will feed it with process data, according to the level and quality of available information (real, estimated, or supposed). In the case study, the data are quite accurate, as the two companies belong to the same multiplant context, which is characterized by a collaborative environment. Moreover, considering that the DSS is based on technical input-output data and coefficients (i.e., the cost drivers), it allows users to develop and compare alternative scenarios.
Lastly, it has been shown how the DSS aims at assisting decision-making in a manner that will support the identification of the sources of inefficiencies in terms of resources and activities value lost in waste generation. This reduction in losses not only means a considerable decrease in the total cost breakdown, but also ensures a decrease of the environmental footprint and therefore contributes to a more sustainable industry. Moreover, the DSS allows users to map resources (material, water, energy, labour) and also by-products and waste flows and to quantify the utilization of resources both in terms of physical and monetary units. In the case study, only the material waste flow (in terms of quantity) was mapped at single plant and the production system level in all alternatives, as crude waste was identified as the main waste of the two companies. The monetary aspect was instead taken into account by calculating the full industrial cost of wastes and by-products and the inefficiency of the use of the resources in the production process for both Companies 1 and 2 in AS-IS case, Scenarios 1 and 2, in order to assess the resources and activities value lost in ‘non-products’ generation.

6. Conclusions

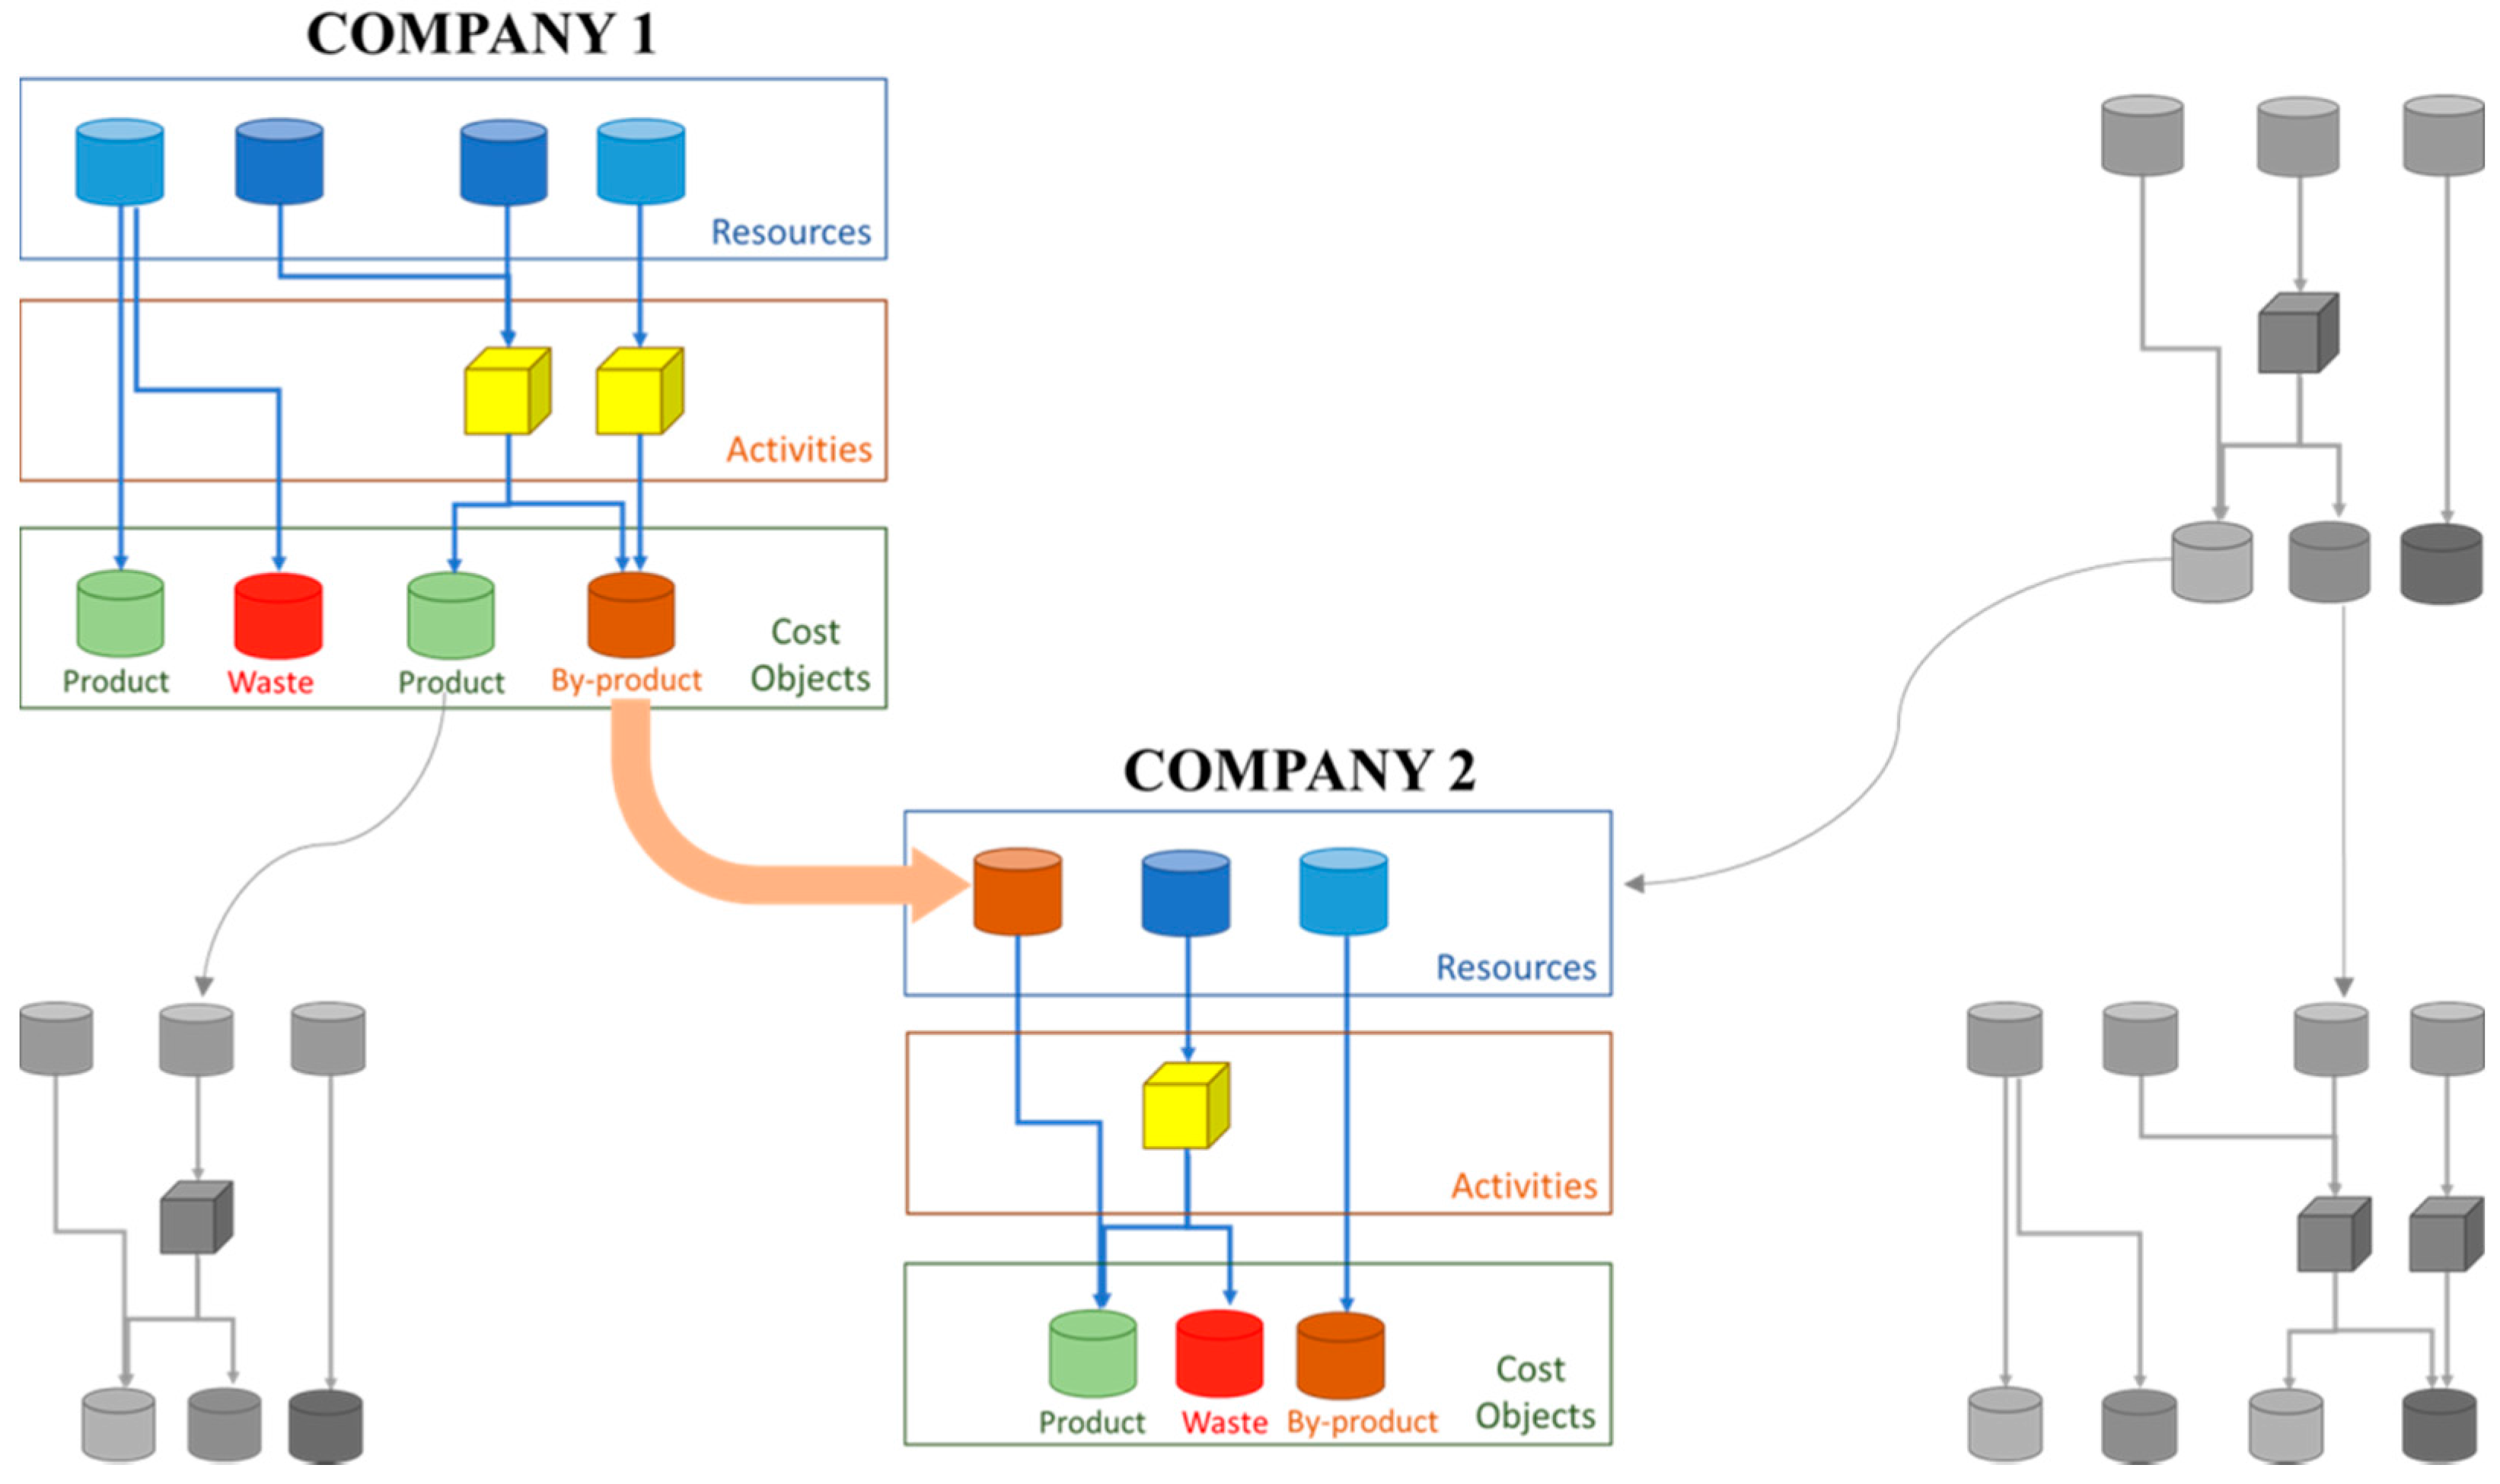
6.1. Theoretical Application of the DSS in Supply Chain Contexts

No reliable references were found with satisfactory data relative to environmental aspects of production, that is, the amount of waste generated at each stage of the production route, and therefore it was not possible to carry out a supply chain analysis.
Currently, promoting an integrated overall resource and energy management system to facilitate information flow among the participating companies of a supply chain/network is becoming increasingly similar to the mechanisms typical of multiplant contexts, where companies have collaborative long-term relationships and are more focused on large opportunities in order to gain and maintain competitive advantage [48].
Applying the proposed DSS in a supply chain context requires a common set of cost accounting standards for the total supply chain being calculated based on a shared definition of activities and their cost drivers among all the players leading to the aggregation of supply chain activity-based costs [49]. The key enabler is the visibility on the whole process and all flows. In the case, at least one company in the production system can have such visibility, then the DSS can be applied involving other companies. The DSS can effectively solve problems related to crossing the boundaries of organizations while maintaining the interests of each organization as it allows waste reduction with positive benefits on overall eco-efficiency.

6.2. Scientific Contribution and Industrial Relevance

The major scientific contribution consists in extending the application of ExtABEC from a single plant level to a production system level (i.e., multiplant systems, networks, districts or supply chains). To do that, a DSS for process industry optimization based on a system-wide evaluation procedure for operational resource efficiency was developed. The proposed DSS can be implemented on Microsoft Office-based applications or embedded in systems that are more sophisticated, and it can be especially applied but not limited to process industries. It was implemented in Microsoft Excel in order to tested it in a real case. The application to the real case show that the application of ExtABEC at a production system level can enable different actors involved in production systems to understand how their decisions impact the whole production system, and how significant inter-firm saving opportunities can be identified to improve eco-efficiency performances. Even though the DSS focuses on reducing the resources and activities value lost in waste production, it has also positive environmental impacts: materials and energies are better used, natural resource demand is being reduced, as are waste flows burdening the environment. Consequently, the DSS represents a very important tool for environment-oriented management and for improvements of eco-efficiency.

Acknowledgments

The authors acknowledge the relevant contribution of Federica Russo to the research.

Author Contributions

All authors were involved in choosing the research methodology, in data analysis, as well as in the result analysis and discussion. All authors wrote a part of the manuscript and have approved the submitted manuscript.

Conflicts of Interest

The authors declare no conflict of interest.

References

  1. CEC, A. Resource-Efficient Europe—Flagship Initiative under the Europe 2020 Strategy; European Commission: Brussels, Belgium, 2011. [Google Scholar]
  2. Despeisse, M.; Ball, P.; Evans, S.; Levers, A. Industrial Ecology at Factory Level: A Conceptual Model. J. Clean. Prod. 2012, 31, 30–39. [Google Scholar] [CrossRef] [Green Version]
  3. Kunz, N.C.; Moran, C.J.; Kastelle, T. Conceptualising ‘Coupling’ for Sustainability Implementation in the Industrial Sector: A Review of the Field and Projection of Future Research Opportunities. J. Clean. Prod. 2013, 53, 69–80. [Google Scholar] [CrossRef]
  4. Baptista, A.J.; Lourenço, E.J.; Cunha, F.; Marques, B.; Silva, E.J.; Peças, P. Eco-efficiency Framework as a Decision Support Tool to Enhance Economic and Environmental Performance of Production Systems. In Proceedings of the 3rd International Colloquium of the Cluster of Excellence “eniPROD” (Energy-Efficient Product and Process Innovations in Production Engineering), Chemnitz, Germany, 8–9 April 2014. [Google Scholar]
  5. Lehni, M.; Schmidheiny, S.; Stigson, B. Eco-Efficiency: Creating More Value with Less Impact; World Business Council for Sustainable Development (WBCSD): Geneva, Switzerland, 2000. [Google Scholar]
  6. Cagno, E.; Micheli, G.J.L.; Trucco, P. Eco-efficiency for sustainable manufacturing: An extended environmental costing method. Prod. Plan. Control 2012, 23, 34–144. [Google Scholar] [CrossRef]
  7. Europe Innova Eco-Innovation REMake. Guide to Resource Efficiency in Manufacturing. 2012. Available online: http://www.greenovate-europe.eu/ (accessed on 30 November 2017).
  8. Ribeiro, I.; Peças, P.; Silva, A.; Henriques, E. Life Cycle Engineering Methodology Applied to Material Selection, A Fender Case Study. J. Clean. Prod. 2008, 16, 1887–1899. [Google Scholar] [CrossRef]
  9. Kabongo, J.; Boiral, O. Creating Value with Wastes: A Model and Typology of Sustainability within Firms. Bus. Strateg. Environ. 2011, 20, 441–455. [Google Scholar] [CrossRef]
  10. Kuhlang, P.; Edtmayr, T.; Sihn, W. Methodical Approach to Increase Productivity and Reduce Lead Time in Assembly and Production-Logistic Processes. CIRP J. Manuf. Sci. Technol. 2011, 4, 24–32. [Google Scholar] [CrossRef]
  11. Benoy, A.M.; Owen, L. Link to Link: Driving Resource Efficiency across Supply Chains; Policy Connect CAN Mezzanine: London, UK, 2016. [Google Scholar]
  12. An, Q.; Yan, H.; Wu, J.; Liang, L. Internal resource waste and centralization degree in two-stage systems: An efficiency analysis. Omega 2015, 61, 89–99. [Google Scholar] [CrossRef]
  13. Askarany, D.; Yazdifar, H.; Askary, S. Supply chain management, activity-based costing and organisational factors. Int. J. Prod. Econ. 2009, 127, 238–248. [Google Scholar] [CrossRef]
  14. Schulze, M.; Seuring, S.; Ewering, C. Applying Activity-Based Costing in a Supply Chain Environment. Int. J. Prod. Econ. 2011, 135, 716–725. [Google Scholar] [CrossRef]
  15. Jørgensen, T.H. Towards more sustainable management systems: Through life cycle management and integration. J. Clean. Prod. 2008, 16, 1071–1080. [Google Scholar] [CrossRef]
  16. Perotti, S.; Zorzini, M.; Cagno, E.; Micheli, G.J. Green supply chain practices and company performance: The case of 3PLs in Italy. Int. J. Phys. Distrib. Logist. Manag. 2012, 42, 640–672. [Google Scholar] [CrossRef]
  17. Hur, T.; Yamamoto, R. Measurement of Green Productivity and its Improvement. J. Clean. Prod. 2004, 12, 673–683. [Google Scholar] [CrossRef]
  18. Suh, S. Theory of Materials and Energy Flow Analysis in Ecology and Economics. Ecol. Model. 2005, 189, 251–269. [Google Scholar] [CrossRef]
  19. Schmidt, M.; Nakajima, M. Material Flow Cost Accounting as an Approach to Improve Resource Efficiency in Manufacturing Companies. Resources 2013, 2, 358–369. [Google Scholar] [CrossRef]
  20. Matopoulos, A.; Barros, A.C.; van der Vorst, J.G.A.J. Resource-Efficient Supply Chains: A Research Framework, Literature Review and Research Agenda. Supply Chain Manag. 2015, 20, 218–236. [Google Scholar] [CrossRef]
  21. Baptista, A.J.; Lourenço, E.J.; Pereira, J.P.; Cunha, F.; Silva, E.J.; Peças, P. EcoPROSYS: An eco-efficiency framework applied to a medium density fibreboard finishing line. In Proceedings of the 23rd CIRP Conference on Life Cycle Engineering, Berlin, Germany, 22–24 May 2016. [Google Scholar]
  22. Schliephake, K.; Stevens, G.; Clay, S. Making Resources Work More Efficiently—The Importance of Supply Chain Partnerships. J. Clean. Prod. 2009, 17, 1257–1263. [Google Scholar] [CrossRef]
  23. De Soete, W. Towards a Multidisciplinary Approach on Creating Value: Sustainability through the Supply Chain and ERP Systems. Systems 2016, 1, 16. [Google Scholar] [CrossRef]
  24. Style. Available online: https://www.spire2030.eu/style (accessed on 30 November 2017).
  25. Measure. Available online: www.spire2030.eu/measure (accessed on 30 November 2017).
  26. Marchet, G.; Melacini, M.; Sassi, C.; Tappia, E. Assessing efficiency and innovation in the 3PL industry: An empirical analysis. Int. J. Logist. Res. Appl. 2017, 20, 53–72. [Google Scholar] [CrossRef]
  27. Zhang, B.; Bi, J.; Fan, Z.; Yuan, Z.; Ge, J. Eco-efficiency analysis of industrial system in China: A data envelopment analysis approach. Ecol. Econ. 2008, 68, 306–316. [Google Scholar] [CrossRef]
  28. Bribiàn, I.Z.; Capilla, A.V.; Usòn, A.A. Life Cycle Assessment of Building Materials: Comparative Analysis of Energy and Environmental Impacts and Evaluation of the Eco-Efficiency Improvement Potential. Build. Environ. 2010, 46, 1133–1140. [Google Scholar] [CrossRef]
  29. Saurat, M.; Ritthoff, M. Calculating MIPS 2.0. Resources 2013, 2, 581–607. [Google Scholar] [CrossRef]
  30. Puig, R.; Fullana-i-Palmer, P.; Baquero, G.; Riba, J.R.; Bala, A. A Cumulative Energy Demand Indicator (CED), Life Cycle Based, for Industrial Waste Management Decision Making. Waste Manag. 2013, 33, 2789–2797. [Google Scholar] [CrossRef] [PubMed]
  31. De Meester, B.; Dewulf, J.; Verbeke, S.; Janseens, A.; Van Langenhove, H. Exergetic Life-Cycle Assessment (ELCA) for Resource Consumption Evaluation in the Built Environment. Build. Environ. 2009, 44, 11–17. [Google Scholar] [CrossRef]
  32. Brunner, P.H.; Rechberger, H. Practical Handbook of Material Flow Analysis: Advanced Methods in Resource and Waste Management. Int. J. Life Cycle Assess. 2004, 9, 337–338. [Google Scholar] [CrossRef]
  33. Ayres, R.U.; Ayres, L.W.; Martinás, K. Exergy, Waste Accounting, and Life-Cycle Analysis. Energy 1998, 23, 355–363. [Google Scholar] [CrossRef]
  34. Liedtke, C.; Lettenmeier, M.; Baedeker, C. Resource Intensity in Global Food Chains: The Hot Spot Analysis. Br. Food J. 2010, 112, 1138–1159. [Google Scholar] [CrossRef]
  35. Feire, F.; Thore, S.; Ferrao, P. Life Cycle Activity Analysis: Logistics and Environmental Policies for Bottled Water in Portugal. OR Spektr. 2001, 23, 159–182. [Google Scholar] [CrossRef]
  36. Gluch, P.; Baumann, H. The life Cycle Costing (LCC) Approach: A Conceptual Discussion of its Usefulness for Environmental Decision-Making. Build. Environ. 2003, 39, 571–580. [Google Scholar] [CrossRef]
  37. Kumaran, D.S.; Ong, S.K.; Tan, R.B.H.; Nee, A.Y.C. Environmental Life Cycle Cost Analysis of Products. Environ. Manag. Health 2001, 12, 260–276. [Google Scholar] [CrossRef]
  38. Herbohn, K.A. Full Cost Environmental Accounting Experiment. Account. Org. Soc. 2005, 30, 519–536. [Google Scholar] [CrossRef]
  39. Shonnard, D.R.; Kicherer, A.; Saling, P. Industrial Applications Using BASF Eco-Efficiency Analysis: Perspectives on Green Engineering Principles. Environ. Sci. Technol. 2003, 37, 5340–5348. [Google Scholar] [CrossRef] [PubMed]
  40. Bach, V.; Berger, M.; Henßler, M.; Kirchner, M.; Leiser, S.; Mohr, L.; Rother, E.; Ruhland, K.; Schneider, L.; Tikana, L.; et al. Integrated Method to Assess Resource Efficiency—ESSENZ. J. Clean. Prod. 2016, 137, 118–130. [Google Scholar] [CrossRef]
  41. Emblemsvag, J.; Bras, B. Activity-Based Cost and Environmental Management: A Different Approach to the ISO 14000 Compliance, 1st ed.; Springer Science & Business Media: Berlin, Germany, 2012; ISBN 0-7923-7247-6. [Google Scholar]
  42. Finnveden, G.; Bjorklund, A.; Ekvall, T.; Moberg, A. Environmental and Economic Assessment Methods for Waste Management Decision-Support: Possibilities and Limitations. Waste Manag. Res. 2007, 25, 263–269. [Google Scholar] [CrossRef] [PubMed]
  43. Nicoletti, G.M.; Notarnicola, B.; Tassielli, G. Comparative Life Cycle Assessment of Flooring Materials: Ceramic versus Marble Tiles. J. Clean. Prod. 2010, 10, 283–296. [Google Scholar] [CrossRef]
  44. Bovea, M.D.; Dìaz-Albo, E.; Gallardo, A.; Colomer, F.J.; Serrano, J. Environmental performance of ceramic tiles: Improvement proposals. Mater. Des. 2009, 31, 35–41. [Google Scholar] [CrossRef]
  45. Barros, M.C.; Bello, P.; Roca, E.; Casares, J.J. Integrated pollution prevention and control for heavy ceramic industry in Galicia (NW Spain). J. Hazard. Mater. 2006, 141, 680–692. [Google Scholar] [CrossRef] [PubMed]
  46. Juan, A.; Medina, C.; Guerra, M.I.; Moràn, J.M.; Aguado, P.J.; Sánchez de Rojas, M.I.; Frías, M.; Rodríguez, O. Re-Use of Ceramic Wastes in Construction. In Ceramic Materials; Wilfried Wunderlich; InTech Europe: Rijeka, Croatia, 2010; pp. 197–214. ISBN 978-953-307-145-9. Available online: https://cdn.intechopen.com/pdfs-wm/11637.pdf (accessed on 30 November 2017).
  47. Picazo-Tadeo, A.J.; Prior, D. Environmental externalities and efficiency measurement. J. Environ. Manag. 2009, 90, 3332–3339. [Google Scholar] [CrossRef] [PubMed]
  48. Gibbs, D.; Deutz, P. Trust and networking in inter-firm relations: The case of eco-industrial development. Local Econ. 2003, 18, 222–236. [Google Scholar] [CrossRef]
  49. LaLonde, B.J.; Pohlen, T.L. Issues in Supply Chain Costing. Int. J. Logist. Manag. 1996, 7, 1–12. [Google Scholar] [CrossRef]
Figure 1. Resource flows to cost objects in ExtABEC (at company level) [6].
Sustainability 10 00167 g001
Figure 2. Goal and scope of decision support system (DSS).
Sustainability 10 00167 g002
Figure 3. Components of DSS.
Sustainability 10 00167 g003
Figure 4. Resource flows to cost objects in ExtABEC (at the company level and system-wide level).
Sustainability 10 00167 g004
Figure 5. The four steps of DSS.
Sustainability 10 00167 g005
Figure 6. DSS interface for Company 1.
Sustainability 10 00167 g006
Figure 7. Relative importance of wastes and by-products of Company 1 on the overall full industrial cost in AS-IS case.
Sustainability 10 00167 g007
Figure 8. Relative importance of wastes and by-products of Company 2 on the overall full industrial cost in AS-IS case.
Sustainability 10 00167 g008
Figure 9. Comparison AS-IS case vs Scenario 2 of main material flows in a multiplant perspective.
Sustainability 10 00167 g009
Table 1. Approaches to evaluate industrial resource efficiency (legend: F = Fully satisfied; P = Partially satisfied; “/” = Not satisfied).
ApproachMaterial EfficiencyEnergy EfficiencyEco-Efficiency PerspectiveCost AllocationSystem PerspectiveResults as Absolute Values
Life Cycle Assessment (LCA) [28]FF//PF
Material Input Per Service (MIPS) [29]P///PF
Cumulative Energy Demand (CED) [30]/F//PF
Exergetic Life Cycle Assessment (ELCA) [31]FF//FF
Material Flow Analysis (MFA) [32]F///FF
Material and Energy Flow Analysis (MEFA) [18]FF//FF
Exergy Analysis [33]FF//FF
Hot-Spot Analysis [34]FF//F/
Life Cycle Activity Analysis (LCAA) [35]PPFFPF
Life Cycle Costing (LCC) [36]PPFPPF
Environmental Life Cycle Costing (E-LCC) [37]FFFPPP
Environmental Full Cost Accounting (EFCA) [38]PPFPPF
BASF’s Eco-Efficiency Analysis [39]FPP/F/
ESSENZ [40]PPP/PF
Material Flow Cost Accounting (MFCA) [19]FFFPFF
Activity-Based Costing & Environmental Management (ABC&EM) [41]FFFPFF
Extended Activity-Based Environmental Costing (ExtABEC at company level) [6]FFFFPF
Table 2. Full industrial cost of wastes and by-products of Company 1 in AS-IS case.
Waste and by-ProductFrom Resources (€)From Activities (€)Full Industrial Cost (€)
Crude waste545227,31832,770
Cooked waste535217,81223,164
Spray-dried powder10,904982720,731
Sludge109015,49116,581
Waste water21815,59115,809
Glaze9860320913,069
Exhausted lime109056996789
Packaging waste278411283912
TOTAL36,75096,075132,825

