
Using UAS-Aided Photogrammetry to Monitor and Quantify the Geomorphic Effects of Extreme Weather Events in Tectonically Active Mass Waste-Prone Areas: The Case of Medicane Ianos


 ,
,  , , ,
, , ,
Abstract
:1. Introduction
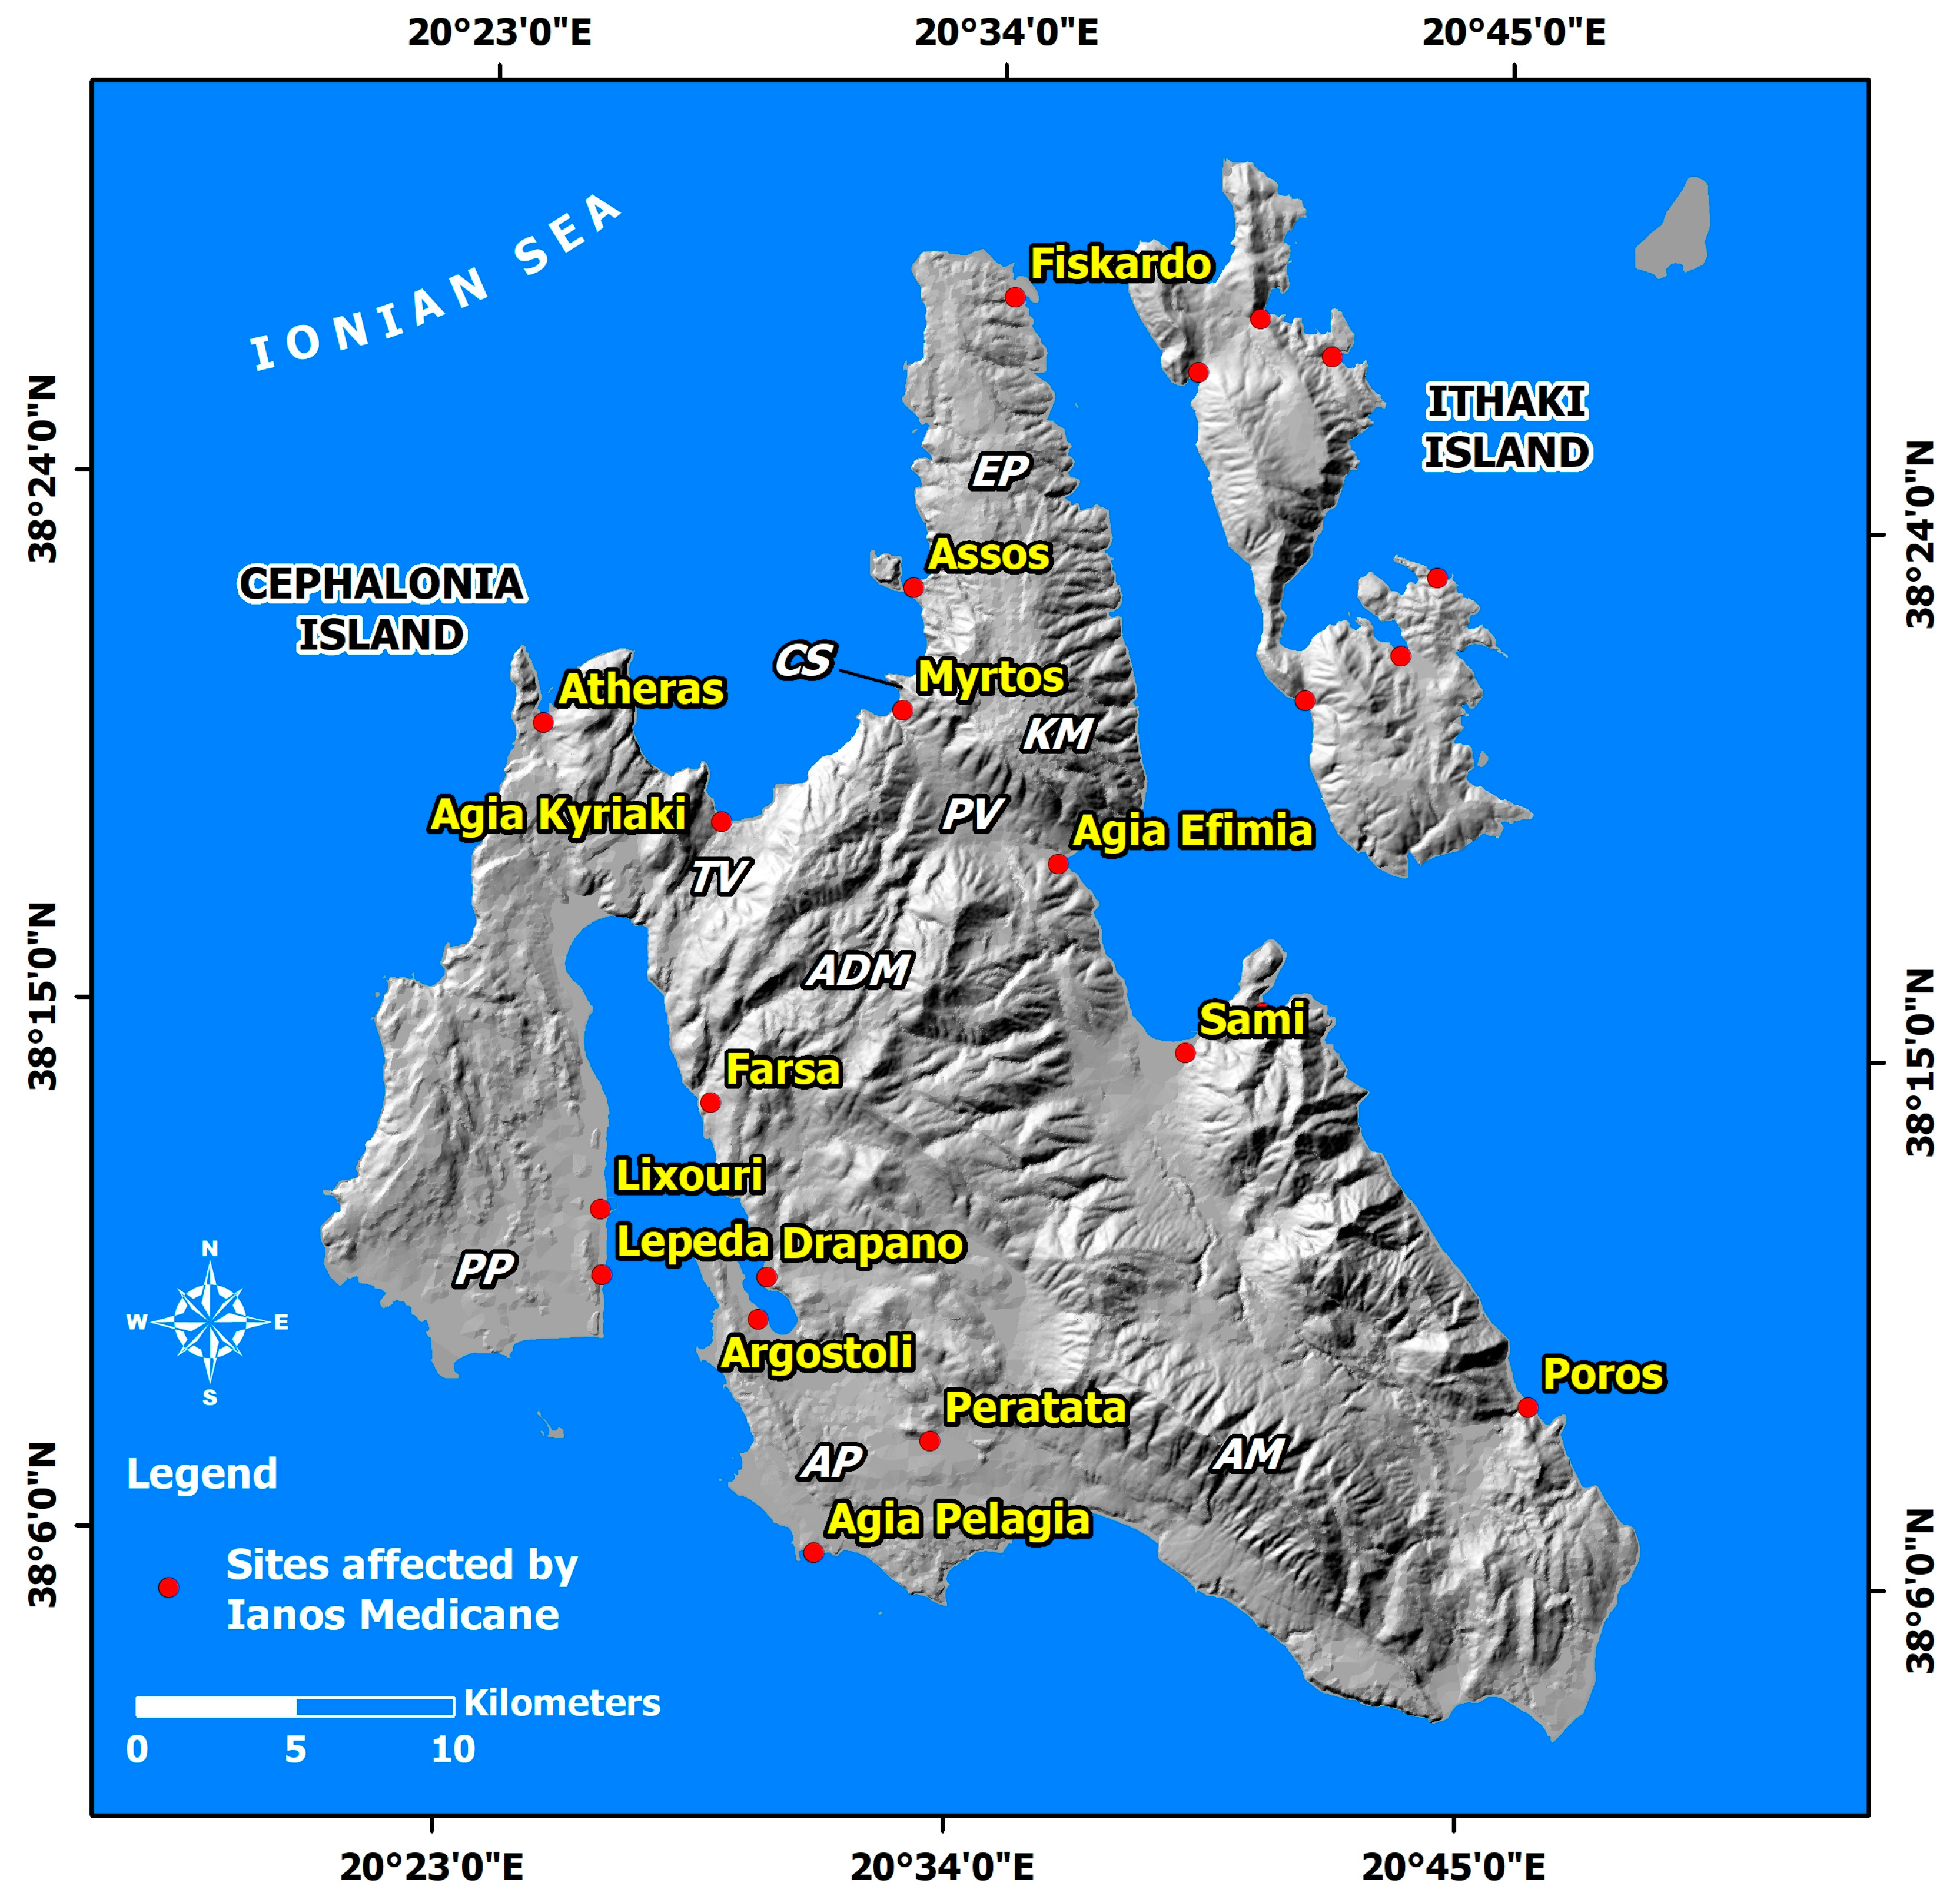
2. Study Area
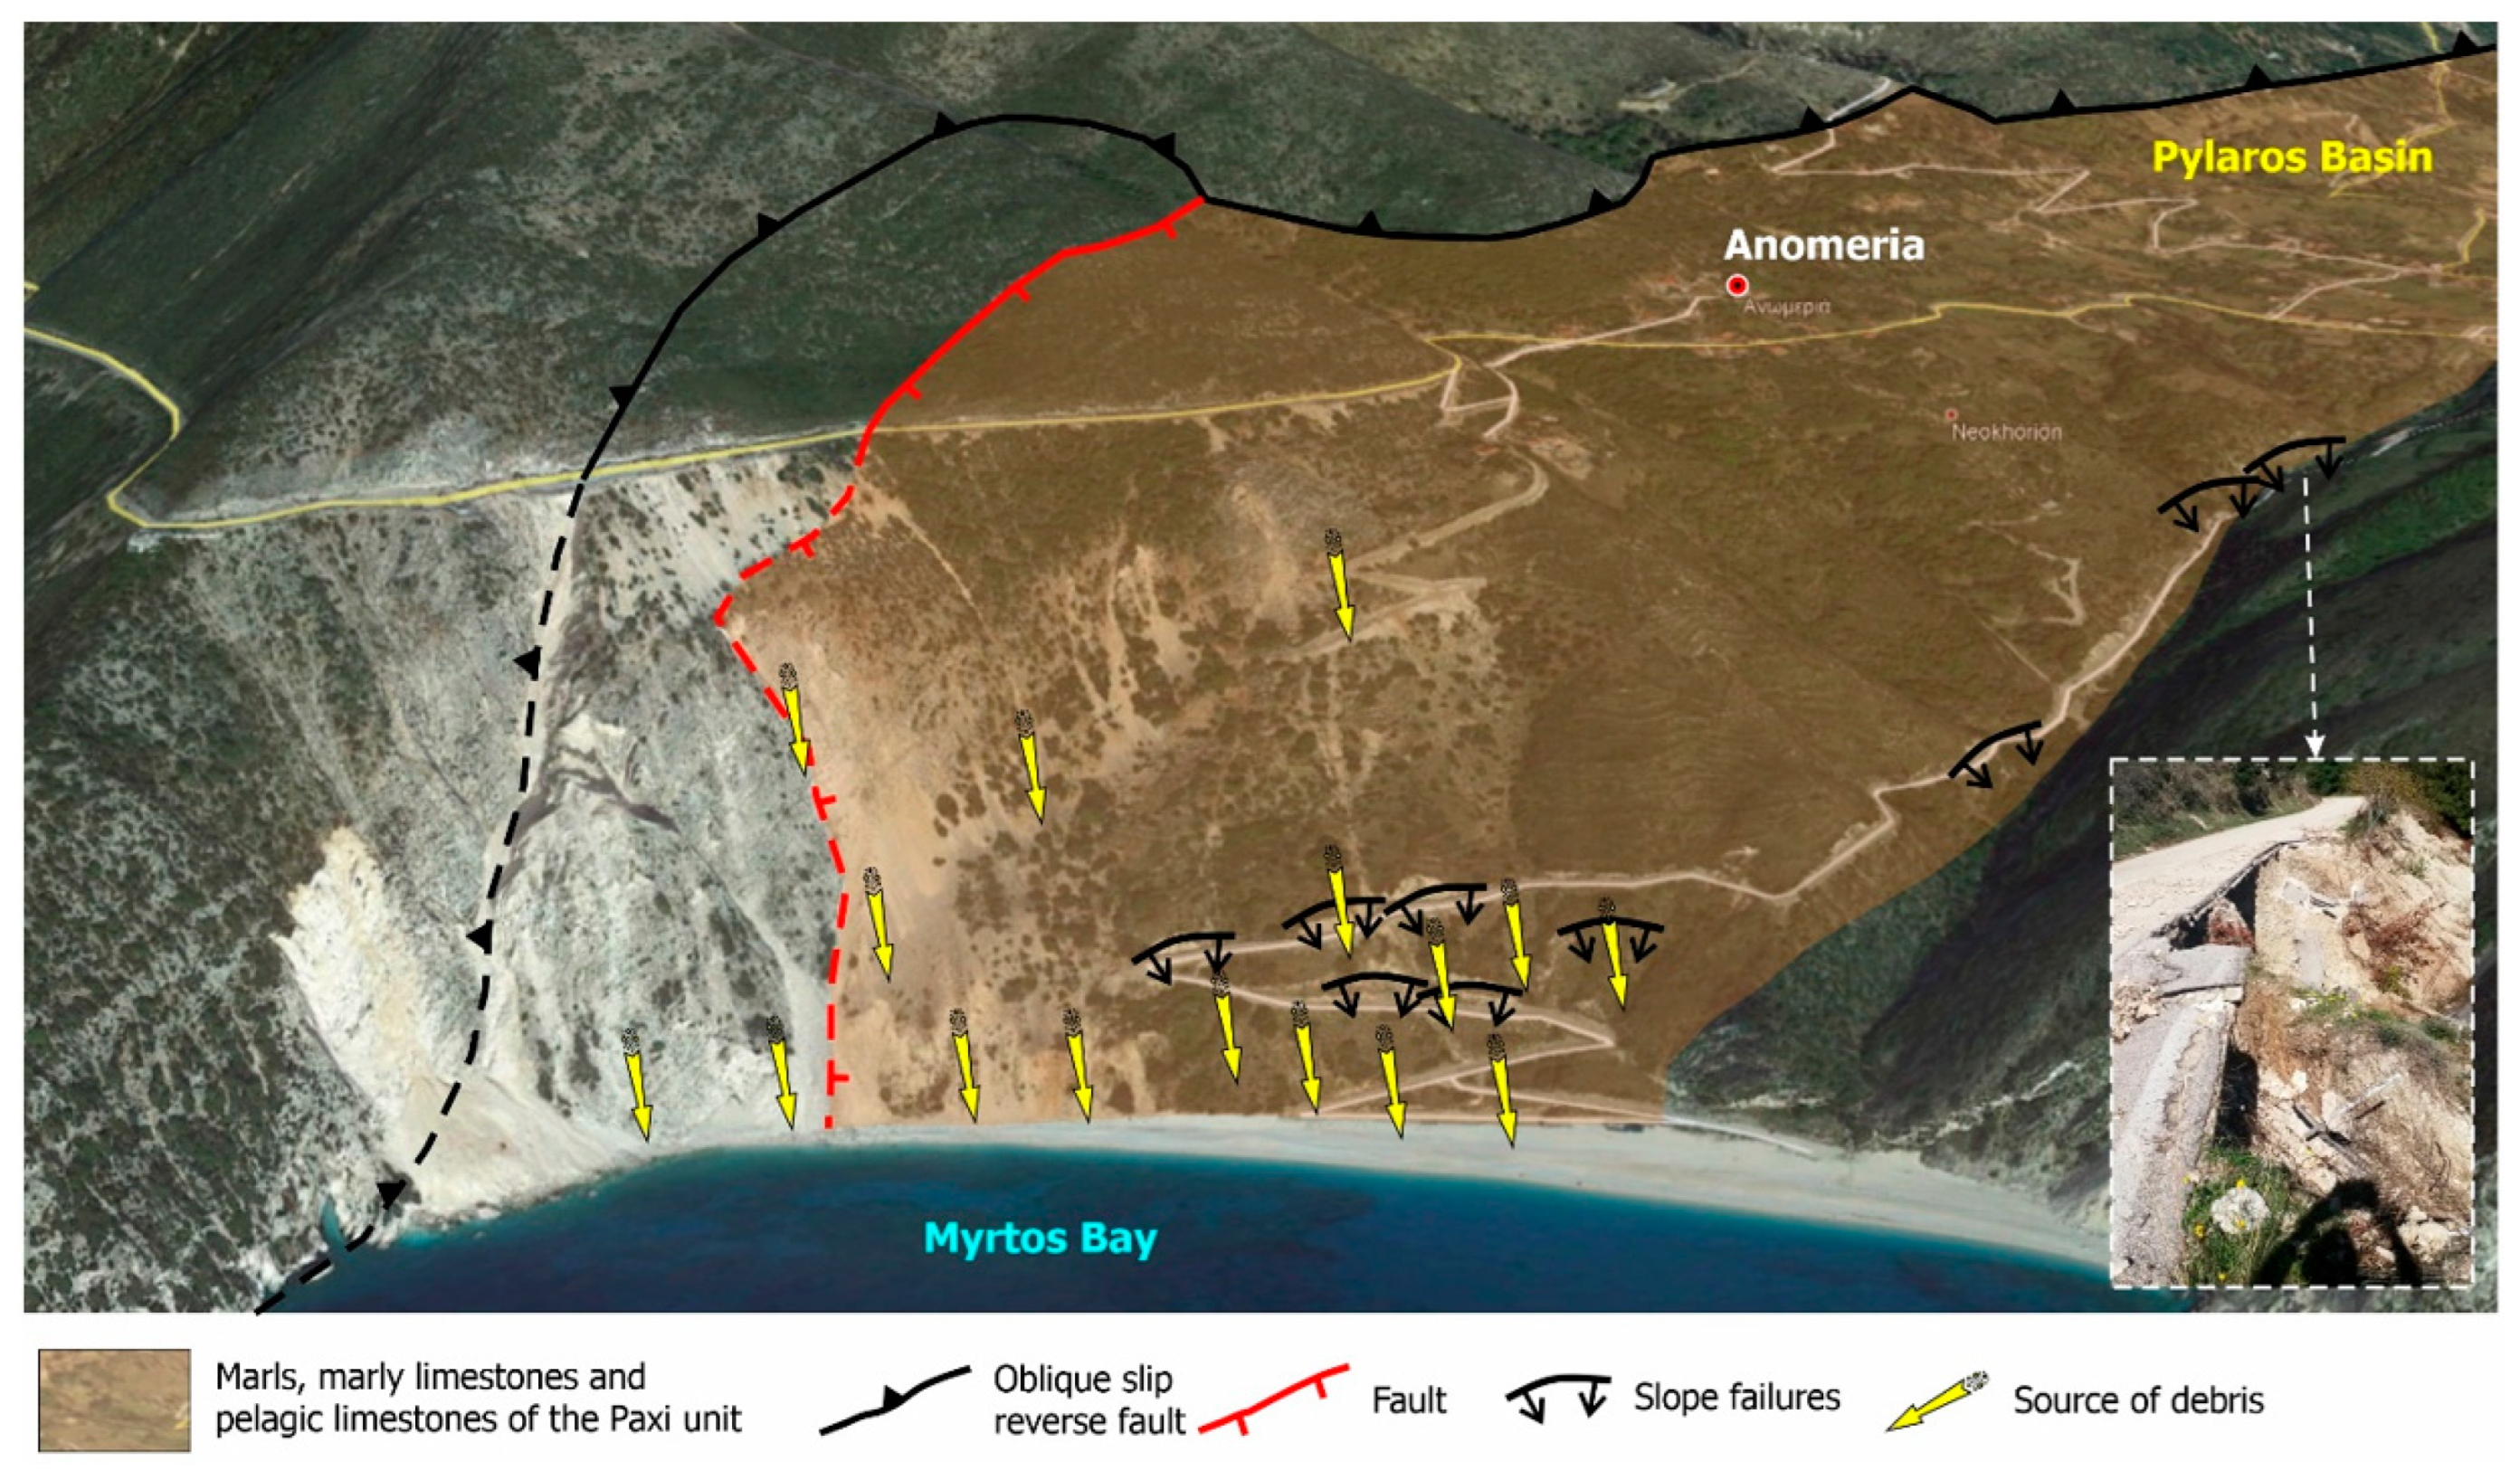
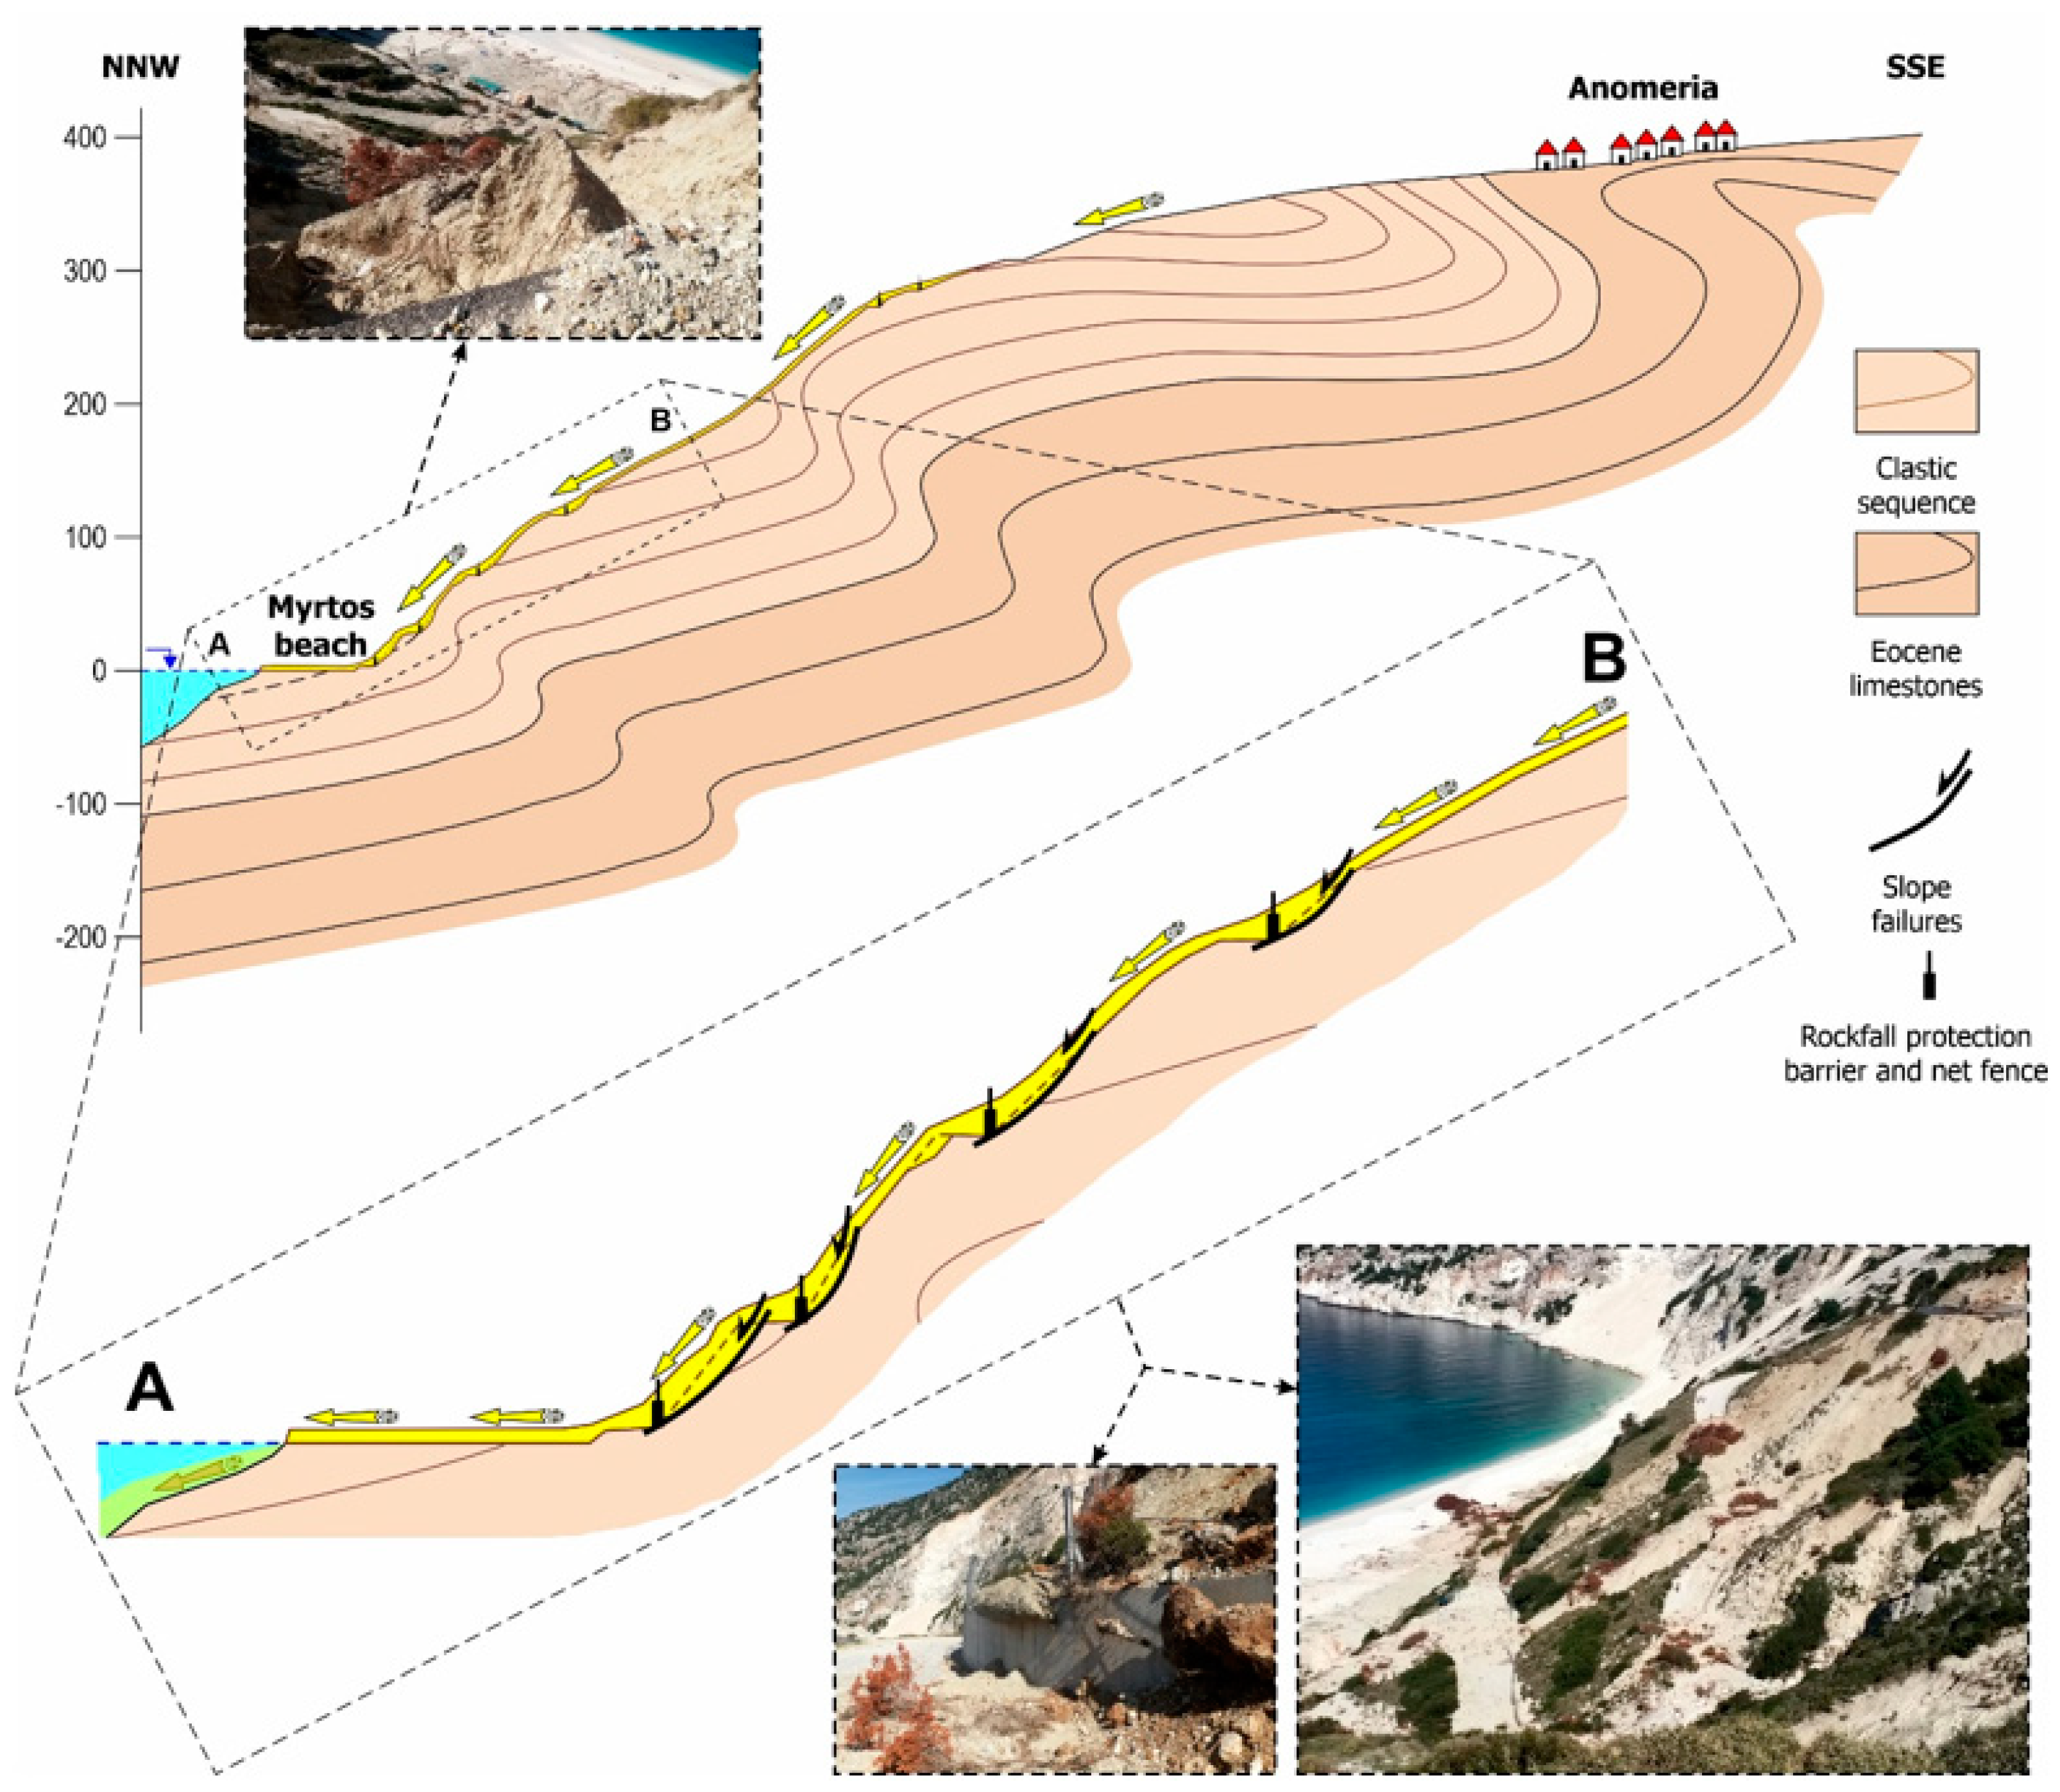
2.1. Geological Setting
2.2. Study Site
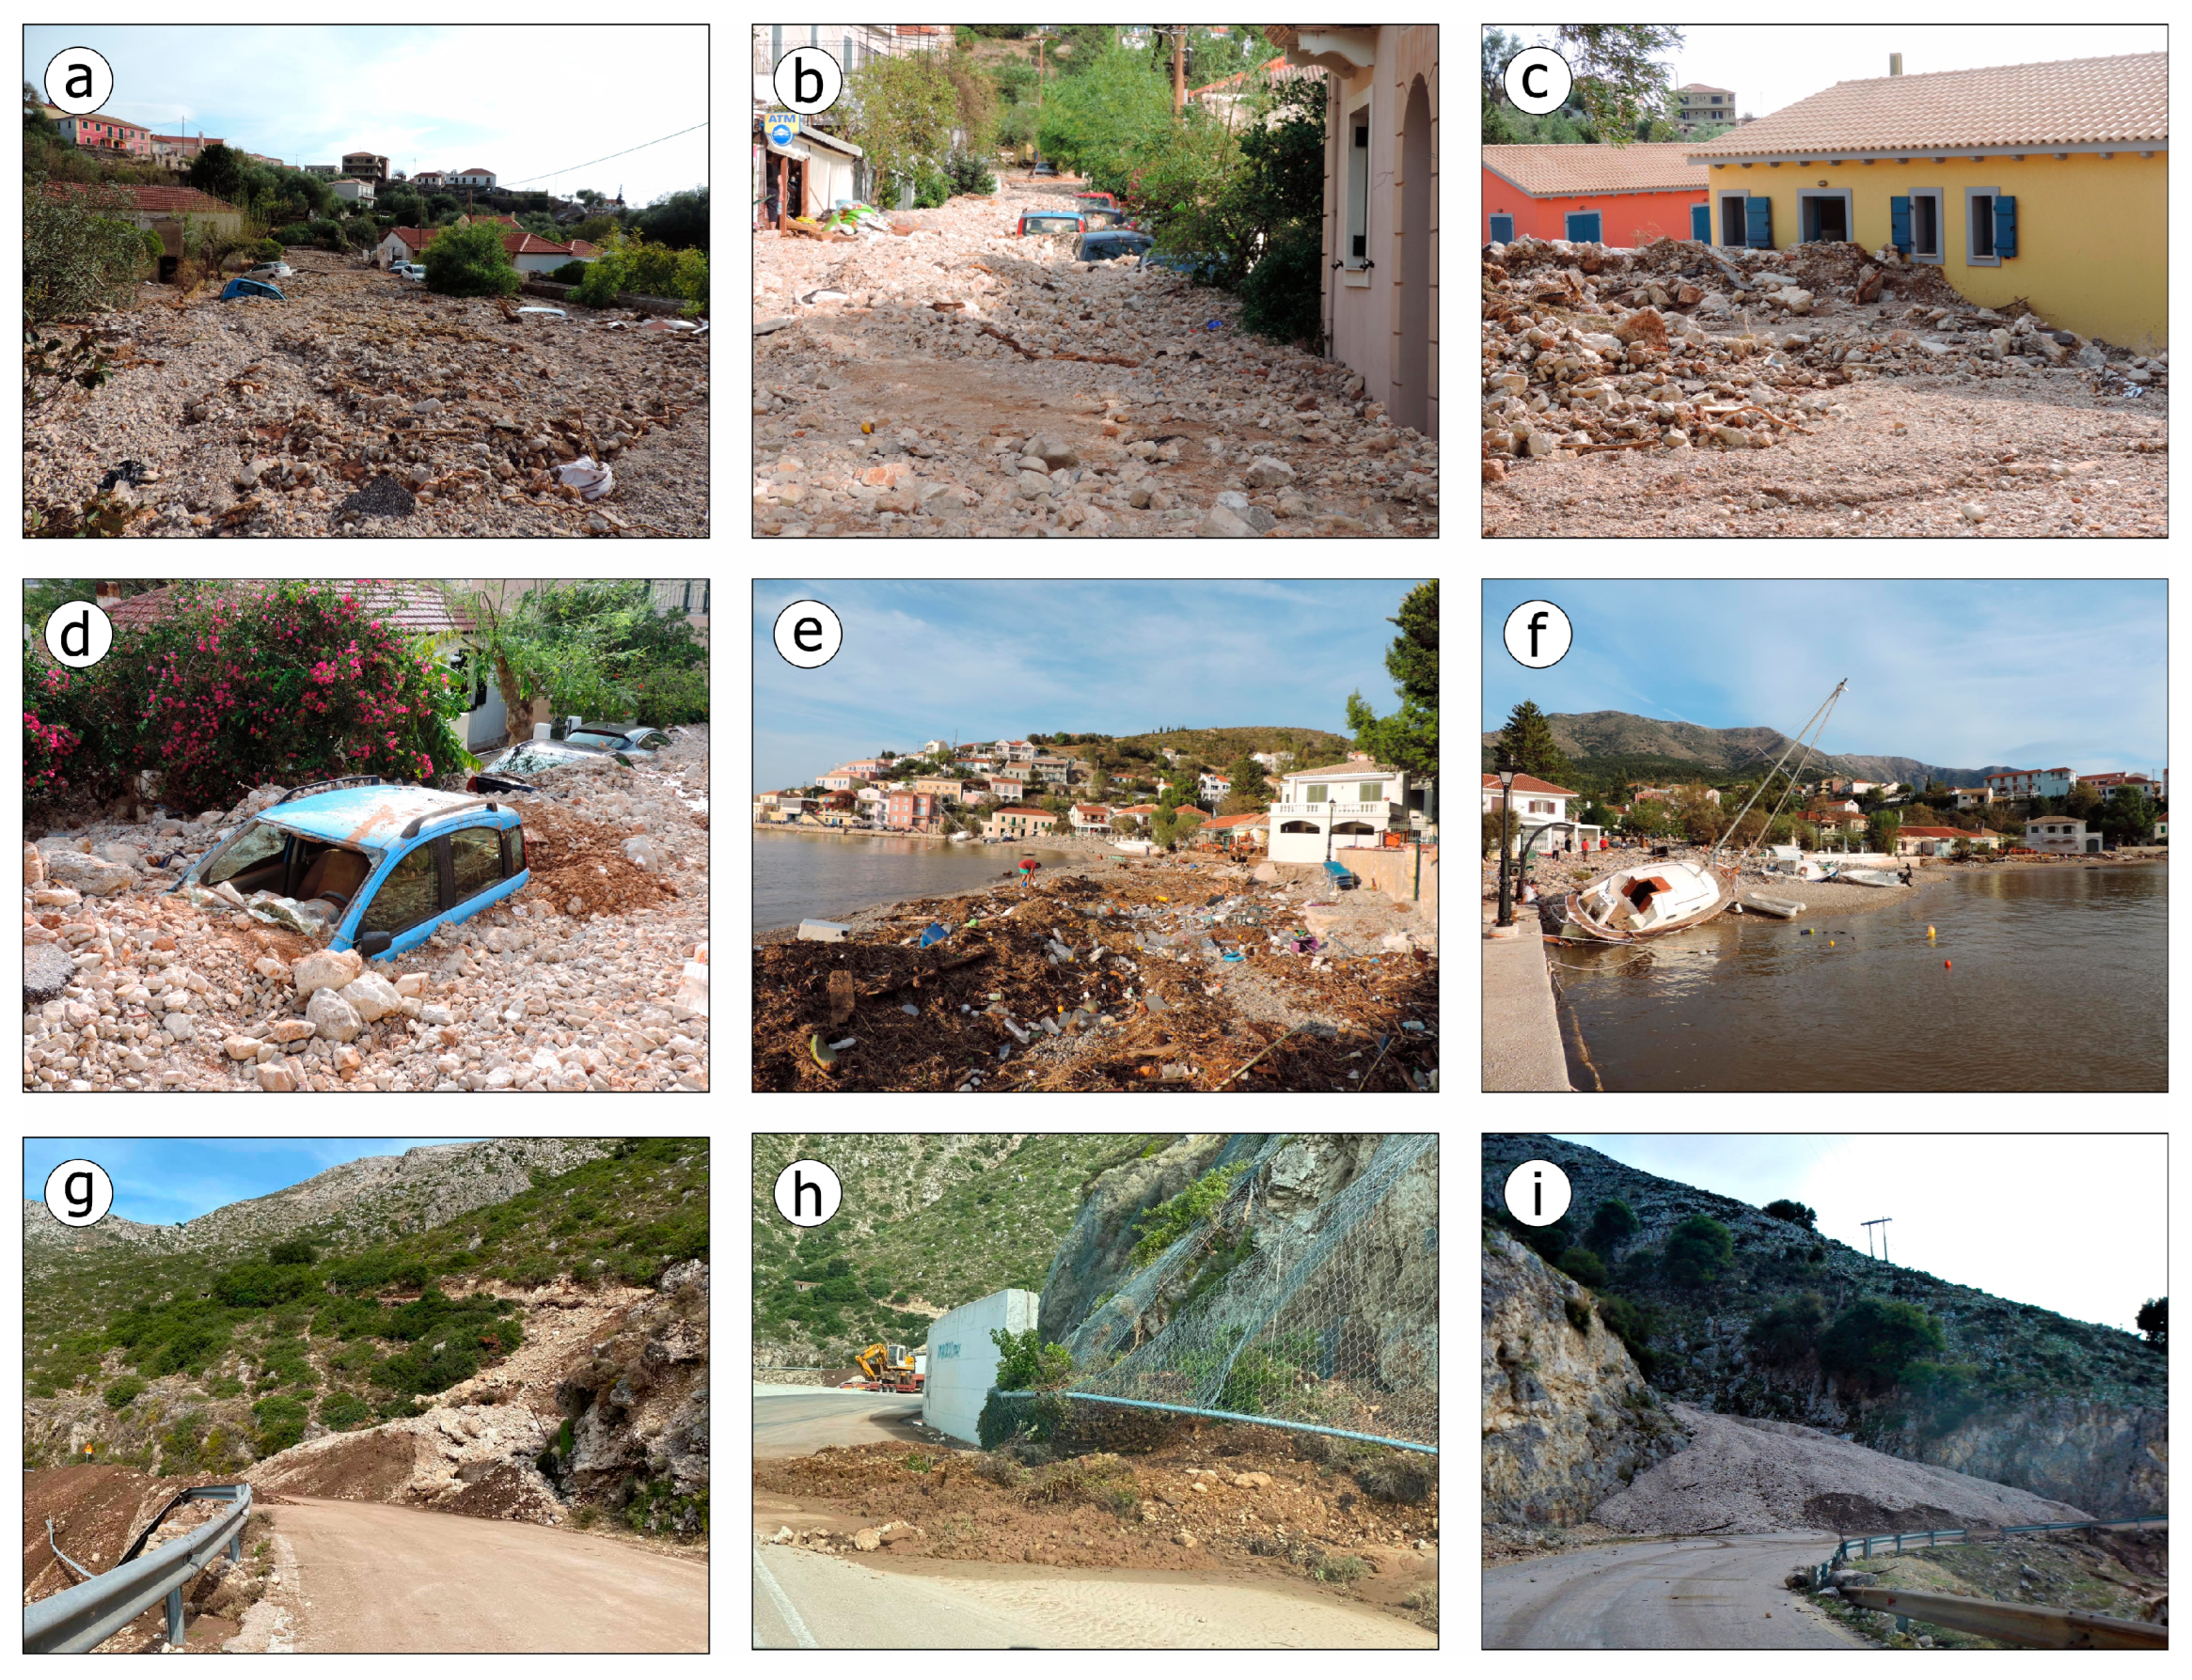
2.3. Medicane Ianos Event
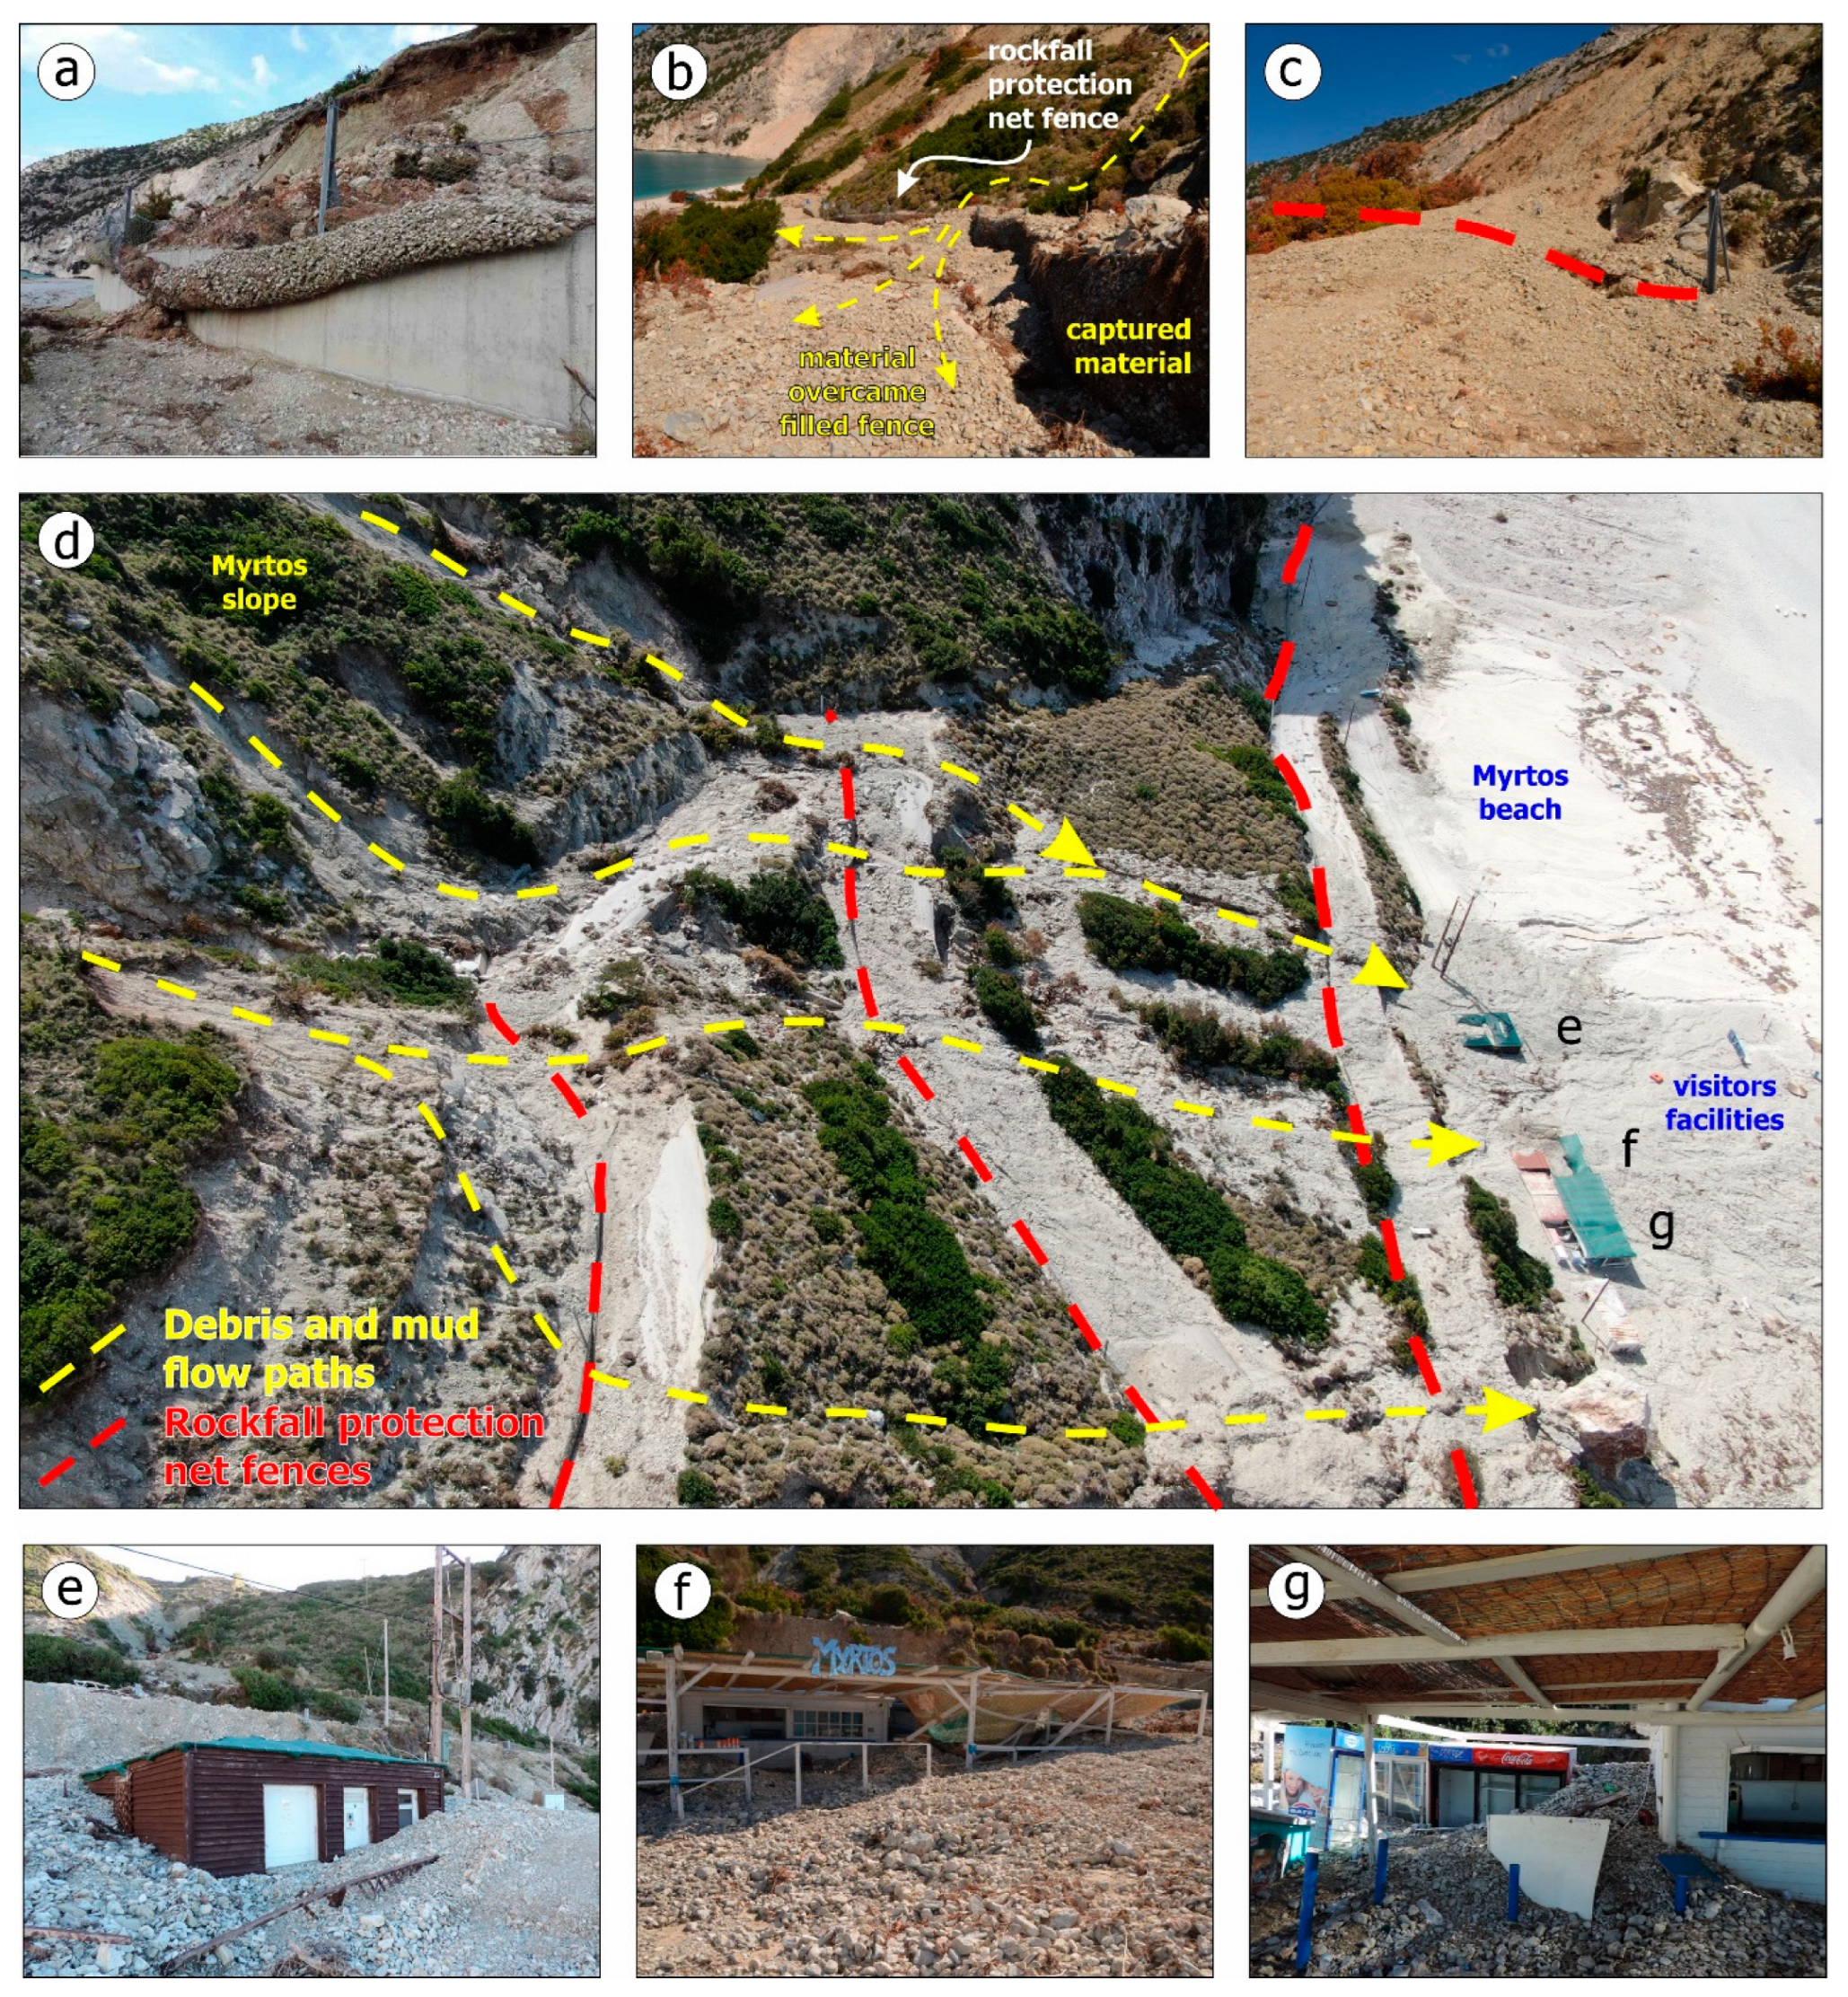
2.4. Slope Failures in Myrtos Due to the Medicane Ianos
3. Data and Methods
4. Results
5. Discussion
6. Conclusions
Author Contributions
Funding
Institutional Review Board Statement
Informed Consent Statement
Data Availability Statement
Acknowledgments
Conflicts of Interest
References
- Petley, D. Global patterns of loss of life from landslides. Geology 2012, 40, 927–930. [Google Scholar] [CrossRef]
- Glade, T. Landslide occurrence as a response to land use change: A review of evidence from New Zealand. Catena 2003, 51, 297–314. [Google Scholar] [CrossRef] [Green Version]
- Tapas, M.R.; Priyom, R.; Ritwik, M.; Govindharaj, K.B.; Kumar, K.V. Spatial characteristics of landslides triggered by the 2015 Mw 7.8 (Gorkha) and Mw 7.3 (Dolakha) earthquakes in Nepal. Landslides 2017, 14, 697–704. [Google Scholar] [CrossRef]
- Meunier, P.; Uchida, T.; Hovius, N. Landslide patterns reveal the sources of large earthquakes. Earth Planet. Sci. Lett. 2013, 363, 27–33. [Google Scholar] [CrossRef]
- ur Rahman, A.; Khan, A.N.; Collins, A.E. Analysis of landslide causes and associated damages in the Kashmir Himalayas of Pakistan. Nat. Hazards 2014, 71, 803–821. [Google Scholar] [CrossRef]
- Widiyanto, W.; Santoso, P.; Hsiao, S.-C.; Imananta, R. Post-event Field Survey of 28 September 2018 Sulawesi Earthquake and Tsunami. Nat. Hazards Earth Syst. Sci. 2019, 1, 1–23. [Google Scholar] [CrossRef] [Green Version]
- Budimir, M.E.A.; Atkinson, P.M.; Lewis, H.G. Earthquake-and-landslide events are associated with more fatalities than earthquakes alone. Nat. Hazards 2014, 72, 895–914. [Google Scholar] [CrossRef] [Green Version]
- Bird, J.F.; Bommer, J.J. Earthquake losses due to ground failure. Eng. Geol. 2004, 75, 147–179. [Google Scholar] [CrossRef]
- Haque, U.; da Silva, P.F.; Devoli, G.; Pilz, J.; Zhao, B.; Khaloua, A.; Wilopo, W.; Andersen, P.; Lu, P.; Lee, J.; et al. The human cost of global warming: Deadly landslides and their triggers (1995–2014). Sci. Total Environ. 2019, 682, 673–684. [Google Scholar] [CrossRef]
- Haque, U.; Blum, P.; da Silva, P.F.; Andersen, P.; Pilz, J.; Chalov, S.R.; Malet, J.P.; Auflič, M.J.; Andres, N.; Poyiadji, E.; et al. Fatal landslides in Europe. Landslides 2016, 13, 1545–1554. [Google Scholar] [CrossRef]
- Gariano, S.L.; Guzzetti, F. Landslides in a changing climate. Earth-Sci. Rev. 2016, 162, 227–252. [Google Scholar] [CrossRef] [Green Version]
- Borga, M.; Stoffel, M.; Marchi, L.; Marra, F.; Jakob, M. Hydrogeomorphic response to extreme rainfall in headwater systems: Flash floods and debris flows. J. Hydrol. 2014, 518, 194–205. [Google Scholar] [CrossRef]
- Jones, J.N.; Boulton, S.J.; Bennett, G.L.; Stokes, M.; Whitworth, M.R.Z. Temporal Variations in Landslide Distributions Following Extreme Events: Implications for Landslide Susceptibility Modeling. J. Geophys. Res. Earth Surf. 2021, 126, 1–26. [Google Scholar] [CrossRef]
- Korup, O.; Clague, J.J. Natural hazards, extreme events, and mountain topography. Quat. Sci. Rev. 2009, 28, 977–990. [Google Scholar] [CrossRef]
- Scorpio, V.; Crema, S.; Marra, F.; Righini, M.; Ciccarese, G.; Borga, M.; Cavalli, M.; Corsini, A.; Marchi, L.; Surian, N.; et al. Basin-scale analysis of the geomorphic effectiveness of flash floods: A study in the northern Apennines (Italy). Sci. Total Environ. 2018, 640, 337–351. [Google Scholar] [CrossRef] [PubMed]
- Guzzetti, F.; Peruccacci, S.; Rossi, M.; Stark, C.P. The rainfall intensity-duration control of shallow landslides and debris flows: An update. Landslides 2008, 5, 3–17. [Google Scholar] [CrossRef]
- Salvati, P.; Bianchi, C.; Rossi, M.; Guzzetti, F. Societal landslide and flood risk in Italy. Nat. Hazards Earth Syst. Sci. 2010, 10, 465–483. [Google Scholar] [CrossRef]
- Nastos, P.T.; Dalezios, N.R. Preface: Advances in meteorological hazards and extreme events. Nat. Hazards Earth Syst. Sci. 2016, 16, 1259–1268. [Google Scholar] [CrossRef] [Green Version]
- Nastos, P.T.; Dalezios, N.R.; Faraslis, I.N.; Mitrakopoulos, K.; Blanta, A.; Spiliotopoulos, M.; Sakellariou, S.; Sidiropoulos, P.; Tarquis, A.M. Risk management framework of environmental hazards and extremes in Mediterranean ecosystems. Nat. Hazards Earth Syst. Sci. 2021, 21, 1935–1954. [Google Scholar] [CrossRef]
- Martha, T.R.; Roy, P.; Govindharaj, K.B.; Kumar, K.V.; Diwakar, P.G.; Dadhwal, V.K. Landslides triggered by the June 2013 extreme rainfall event in parts of Uttarakhand state, India. Landslides 2015, 12, 135–146. [Google Scholar] [CrossRef]
- Lionello, P. The Climate of the Mediteerranean Region. From the Past to the Future; Lionello, P., Ed.; Elsevier: Amsterdam, The Netherlands, 2012; ISBN 9780124160422. [Google Scholar]
- Zittis, G.; Almazroui, M.; Alpert, P.; Ciais, P.; Cramer, W.; Dahdal, Y.; Fnais, M.; Francis, D.; Hadjinicolaou, P.; Howari, F.; et al. Climate Change and Weather Extremes in the Eastern Mediterranean and Middle East. Rev. Geophys. 2022, 60, 762. [Google Scholar] [CrossRef]
- IPCC Climate Change 2013: The Physical Science Basis. Contribution of Working Group I to the Fifth Assessment Report of the Intergovernmental Panel on Climate Change; Cambridge University Press: Cambridge, UK, 2013. [Google Scholar]
- Romero, R.; Emanuel, K. Climate change and hurricane-like extratropical cyclones: Projections for North Atlantic polar lows and medicanes based on CMIP5 models. J. Clim. 2017, 30, 279–299. [Google Scholar] [CrossRef] [Green Version]
- González-Alemán, J.J.; Pascale, S.; Gutierrez-Fernandez, J.; Murakami, H.; Gaertner, M.A.; Vecchi, G.A. Potential Increase in Hazard From Mediterranean Hurricane Activity With Global Warming. Geophys. Res. Lett. 2019, 46, 1754–1764. [Google Scholar] [CrossRef]
- Cavicchia, L.; Von Storch, H.; Gualdi, S. Mediterranean tropical-like cyclones in present and future climate. J. Clim. 2014, 27, 7493–7501. [Google Scholar] [CrossRef] [Green Version]
- Gaertner, M.A.; Jacob, D.; Gil, V.; Domínguez, M.; Padorno, E.; Sánchez, E.; Castro, M. Tropical cyclones over the Mediterranean Sea in climate change simulations. Geophys. Res. Lett. 2007, 34, 1–5. [Google Scholar] [CrossRef] [Green Version]
- Taussik, J. Development Plans and the Coastal Zone Author(s). Town Plan. Rev. 1996, 67, 397–420. [Google Scholar] [CrossRef]
- Gormsen, E. The impact of tourism on coastal areas. GeoJournal 1997, 42, 39–54. [Google Scholar] [CrossRef]
- Mavromatidi, A.; Briche, E.; Claeys, C. Mapping and analyzing socio-environmental vulnerability to coastal hazards induced by climate change: An application to coastal Mediterranean cities in France. Cities 2018, 72, 189–200. [Google Scholar] [CrossRef]
- Bosom, E.; Jiménez, J.A. Probabilistic coastal vulnerability assessment to storms at regional scale—Application to Catalan beaches (NW Mediterranean). Nat. Hazards Earth Syst. Sci. 2011, 11, 475–484. [Google Scholar] [CrossRef] [Green Version]
- Vassilakis, E.; Papadopoulou-Vrynioti, K. Quantification of deltaic coastal zone change based on multi-Temporal high resolution earth observation techniques. ISPRS Int. J. Geo-Information 2014, 3, 18–28. [Google Scholar] [CrossRef]
- Westoby, M.J.; Brasington, J.; Glasser, N.F.; Hambrey, M.J.; Reynolds, J.M. “Structure-from-Motion” photogrammetry: A low-cost, effective tool for geoscience applications. Geomorphology 2012, 179, 300–314. [Google Scholar] [CrossRef] [Green Version]
- Domazetović, F.; Šiljeg, A.; Marić, I.; Faričić, J.; Vassilakis, E.; Panđa, L. Automated coastline extraction using the very high resolution worldview (WV) satellite imagery and developed coastline extraction tool (CET). Appl. Sci. 2021, 11, 9482. [Google Scholar] [CrossRef]
- Dietrich, J.T. Riverscape mapping with helicopter-based Structure-from-Motion photogrammetry. Geomorphology 2016, 252, 144–157. [Google Scholar] [CrossRef]
- Marteau, B.; Vericat, D.; Gibbins, C.; Batalla, R.J.; Green, D.R. Application of Structure-from-Motion photogrammetry to river restoration. Earth Surf. Process. Landforms 2017, 42, 503–515. [Google Scholar] [CrossRef] [Green Version]
- Westoby, M.J.; Lim, M.; Hogg, M.; Pound, M.J.; Dunlop, L.; Woodward, J. Cost-effective erosion monitoring of coastal cliffs. Coast. Eng. 2018, 138, 152–164. [Google Scholar] [CrossRef]
- Langhammer, J.; Vacková, T. Detection and Mapping of the Geomorphic Effects of Flooding Using UAV Photogrammetry. Pure Appl. Geophys. 2018, 175, 3223–3245. [Google Scholar] [CrossRef]
- Smith, M.J.; Pain, C.F. Applications of remote sensing in geomorphology. Prog. Phys. Geogr. 2009, 33, 568–582. [Google Scholar] [CrossRef]
- Smith, M.W.; Carrivick, J.L.; Hooke, J.; Kirkby, M.J. Reconstructing flash flood magnitudes using “Structure-from-Motion”: A rapid assessment tool. J. Hydrol. 2014, 519, 1914–1927. [Google Scholar] [CrossRef]
- Andreadakis, E.; Diakakis, M.; Vassilakis, E.; Deligiannakis, G.; Antoniadis, A.; Andriopoulos, P.; Spyrou, N.I.; Nikolopoulos, E.I. Unmanned aerial systems-aided post-flood peak discharge estimation in ephemeral streams. Remote Sens. 2020, 12, 4183. [Google Scholar] [CrossRef]
- Wilson, J.P.; Gallant, J.C. Digital Terrain Analysis in Terrain Analysis: Principles and Applications. In Terrain Analysis: Principles and Applications; John Wiley & Sons: New York, NY, USA, 2000; pp. 1–27. [Google Scholar]
- Niethammer, U.; Rothmund, S.; James, M.R.; Travelletti, J.; Joswig, M. Uav-Based Remote Sensing of Landslides. In Proceedings of the International Archives of Photogrammetry, Remote Sensing and Spatial Information Sciences, Newcastle upon Tyne, UK, 21–24 June 2010; Volume 38, pp. 496–501. [Google Scholar]
- Devoto, S.; Macovaz, V.; Mantovani, M.; Soldati, M.; Furlani, S. Advantages of using uav digital photogrammetry in the study of slow-moving coastal landslides. Remote Sens. 2020, 12, 3566. [Google Scholar] [CrossRef]
- Mishra, O.P. Seismic Microzonation Study of South Asian Cities and Its Implications to Urban Risk Resiliency under Climate Change Scenario. Int. J. Geosci. 2020, 11, 197–237. [Google Scholar] [CrossRef] [Green Version]
- Lewis, J. Housing construction in earthquake-prone places: Perspectives, priorities and projections for development. Aust. J. Emerg. Manag. 2003, 18, 35–44. [Google Scholar]
- Lekkas, E.L.; Mavroulis, S.D. Earthquake environmental effects and ESI 2007 seismic intensities of the early 2014 Cephalonia (Ionian Sea, western Greece) earthquakes (January 26 and February 3, Mw 6.0). Nat. Hazards 2015, 78, 1517–1544. [Google Scholar] [CrossRef]
- Lekkas, E.L.; Mavroulis, S.D. Fault zones ruptured during the early 2014 Cephalonia Island (Ionian Sea, Western Greece) earthquakes (January 26 and February 3, Mw 6.0) based on the associated co-seismic surface ruptures. J. Seismol. 2016, 20, 63–78. [Google Scholar] [CrossRef]
- Mavroulis, S.; Lekkas, E. Revisiting the most destructive earthquake sequence in the recent history of greece: Environmental effects induced by the 9, 11 and 12 august 1953 ionian sea earthquakes. Appl. Sci. 2021, 11, 8429. [Google Scholar] [CrossRef]
- Mavroulis, S.; Diakakis, M.; Kranis, H.; Vassilakis, E.; Kapetanidis, V.; Spingos, I.; Kaviris, G.; Skourtsos, E.; Voulgaris, N.; Lekkas, E. Inventory of Historical and Recent Earthquake-Triggered Landslides and Assessment of Related Susceptibility by GIS-Based Analytic Hierarchy Process: The Case of Cephalonia (Ionian Islands, Western Greece). Appl. Sci. 2022, 12, 2895. [Google Scholar] [CrossRef]
- Scordilis, E.M.; Karakaisis, G.F.; Karacostas, B.G.; Panagiotopoulos, D.G.; Comninakis, P.E.; Papazachos, B.C. Evidence for transform faulting in the Ionian sea: The Cephalonia island earthquake sequence of 1983. Pure Appl. Geophys. PAGEOPH 1985, 123, 388–397. [Google Scholar] [CrossRef]
- Louvari, E.; Kiratzi, A.A.; Papazachos, B.C. The Cephalonia Transform Fault and its extension to western Lefkada Island (Greece). Tectonophysics 1999, 308, 223–236. [Google Scholar] [CrossRef]
- Sachpazi, M.; Hirn, A.; Clément, C.; Haslinger, F.; Laigle, M.; Kissling, E.; Charvis, P.; Hello, Y.; Lépine, J.C.; Sapin, M.; et al. Western Hellenic subduction and Cephalonia Transform: Local earthquakes and plate transport and strain. Tectonophysics 2000, 319, 301–319. [Google Scholar] [CrossRef]
- Sakkas, V.; Kapetanidis, V.; Kaviris, G.; Spingos, I.; Mavroulis, S.; Diakakis, M.; Alexopoulos, J.D.; Kazantzidou-firtinidou, D.; Kassaras, I.; Dilalos, S.; et al. Seismological and Ground Deformation Study of the Ionian Islands (W. Greece) during 2014–2018, a Period of Intense Seismic Activity. Appl. Sci. 2022, 12, 2331. [Google Scholar] [CrossRef]
- Lekkas, E.; Danamos, G.; Mavrikas, G. Geological structure and evolution of Kefallonia and Ithaki Islands. Bull. Geol. Soc. Greece 2001, 34, 11–17. [Google Scholar] [CrossRef]
- Lekkas, E.L. Neotectonic Map—Cephalonia—Ithaki Sheet Scale 1:100,000; National and Kapodistrian University of Athens: Athens, Greece, 1996. [Google Scholar]
- Renz, C. Die Vorneogene Stratigraphie der normal-sedimentaren Formationen Griechenlands; Institute for Geology and Subsurface Research: Athens, Greece, 1955. [Google Scholar]
- Aubouin, J. Contribution a l’ étude géologique de la Grèce septentrionale, les confins de l’ Epire et de la Thessalie. Ann. Géol. Pays Hellén 1959, 11, 483. [Google Scholar]
- Aubouin, J.; Dercourt, J. Zone preapulienne, zone ionienne et zone du Gavrovo en Peloponncse occidentale. Bull. Soc. Géol. Fr. 1962, 4, 785–794. [Google Scholar] [CrossRef]
- Underhill, J.R. Triassic evaporites and Plio-Quaternary diapirism in western Greece. J. Geol. Soc. 1988, 145, 269–282. [Google Scholar] [CrossRef]
- BP Co.; University of Munich; Migiros, G. Geological Map of Greece, “Cephalonia Island (Northern and Southern Part)”, 1:50000 Scale; BP: London, UK, 1985. [Google Scholar]
- Poscolieri, M.; Lagios, E.; Gregori, G.P.; Paparo, G.; Sakkas, V.A.; Parcharidis, I.; Marson, I.; Soukis, K.; Vassilakis, E.; Angelucci, F.; et al. Crustal stress and seismic activity in the Ionian archipelago as inferred by satellite- and ground-based observations, Kefallinìa, Greece. Geol. Soc. Spec. Publ. 2006, 261, 63–78. [Google Scholar] [CrossRef] [Green Version]
- Bartholy, J.; Pongrácz, R.; Pattantyús-Ábrahám, M. Analyzing the genesis, intensity, and tracks of western Mediterranean cyclones. Theor. Appl. Climatol. 2009, 96, 133–144. [Google Scholar] [CrossRef]
- Prezerakos, N.G. The northwest african depressions affecting the south balkans. J. Climatol. 1985, 5, 643–654. [Google Scholar] [CrossRef]
- Nastos, P.T.; Karavana Papadimou, K.; Matsangouras, I.T. Mediterranean tropical-like cyclones: Impacts and composite daily means and anomalies of synoptic patterns. Atmos. Res. 2018, 208, 156–166. [Google Scholar] [CrossRef]
- Kalimeris, A.; Founda, D.; Giannakopoulos, C.; Pierros, F. Long-term precipitation variability in the Ionian Islands, Greece (Central Mediterranean): Climatic signal analysis and future projections. Theor. Appl. Climatol. 2012, 109, 51–72. [Google Scholar] [CrossRef]
- Nastos, P.T.; Matsangouras, I.T. Composite Mean and Anomaly of Synoptic Conditions for Tornadic Days over North Ionian Sea (NW Greece). In Advances in Meteorology, Climatology and Atmospheric Physics; Helmis, C.G., Nastos, P.T., Eds.; Springer: Berlin/Heidelberg, Germany, 2012; pp. 639–645. ISBN 9783642291715. [Google Scholar]
- Lagouvardos, K.; Karagiannidis, A.; Dafis, S.; Kalimeris, A.; Kotroni, V. Ianos-A Hurricane in the Mediterranean. Bull. Am. Meteorol. Soc. 2022, 103, E1621–E1636. [Google Scholar] [CrossRef]
- Stiros, S.C.; Pirazzoli, P.A.; Laborel, J.; Laborel-Deguen, F. The 1953 earthquake in Cephalonia (Western Hellenic Arc): Coastal uplift and halotectonic faulting. Geophys. J. Int. 1994, 117, 834–849. [Google Scholar] [CrossRef] [Green Version]
- Lekkas, E.; Nastos, P.; Cartalis, C.; Diakakis, M.; Gogou, M.; Mavroulis, S.; Spyrou, N.-I.; Kotsi, E.; Vassilakis, E.; Katsetsiadou, K.-N.; et al. Impact of Medicane “IANOS” (September 2020). Newsl. Environ. Disaster Cris. Manag. Strateg. 2020, 20, 1–140. [Google Scholar]
- Eleftheriou, A.; Mouyiaris, N. Macroseismic reconnaissance in the area of Cephalonia-Zakynthos (Earthquakes 17 & 19-1-83); Monograph; Institute of Geological and Mineral Research: Athens, Greece, 1983. [Google Scholar]
- Androulidakis, Y.; Makris, C.; Mallios, Z.; Pytharoulis, I.; Baltikas, V.; Krestenitis, Y. Storm surges during a Medicane in the Ionian Sea. In Proceedings of the Marine and Inland Waters Research Symposium, Porto Heli, Greece, 16–19 September 2022; Volume 2, pp. 9–14. [Google Scholar]
- Mavroulis, S.; Mavrouli, M.; Lekkas, E. Geological and hydrometeorological hazards and related disasters amid COVID-19 pandemic in Greece: Post-disaster trends and factors affecting the COVID-19 evolution in affected areas. Saf. Sci. 2021, 138, 105236. [Google Scholar] [CrossRef]
- Granshaw, S.I. Structure from motion: Origins and originality. Photogramm. Rec. 2018, 33, 6–10. [Google Scholar] [CrossRef]
- Klingbeil, L.; Eling, C.; Heinz, E.; Wieland, M.; Kuhlmann, H. Direct Georeferencing for Portable Mapping Systems: In the Air and on the Ground. J. Surv. Eng. 2017, 143, 1–20. [Google Scholar] [CrossRef]
- Grayson, B.; Penna, N.T.; Mills, J.P.; Grant, D.S. GPS precise point positioning for UAV photogrammetry. Photogramm. Rec. 2018, 33, 427–447. [Google Scholar] [CrossRef] [Green Version]
- AgiSoft. AgiSoft Metashape Professional 2017. Available online: https://www.agisoft.com/ (accessed on 24 November 2022).
- Rossi, G.; Tanteri, L.; Tofani, V.; Vannocci, P.; Moretti, S.; Casagli, N. Multitemporal UAV surveys for landslide mapping and characterization. Landslides 2018, 15, 1045–1052. [Google Scholar] [CrossRef] [Green Version]
- Vassilakis, E.; Foumelis, M.; Erkeki, A.; Kotsi, E.; Lekkas, E. Post-event surface deformation of Amyntaio slide (Greece) by complementary analysis of Remotely Piloted Airborne System imagery and SAR interferometry. Appl. Geomat. 2020, 13, 65–75. [Google Scholar] [CrossRef]
- Panagiotopoulou, S.; Erkeki, A.; Antonakakis, A.; Grigorakakis, P.; Protopapa, V.; Tsiostas, G.; Vlachou, K.; Vassilakis, E. Evaluation of Network Real Time Kinematics contribution to the accuracy/productivity ratio for UAS-SfM Photogrammetry. In Proceedings of the European Navigation Conference (ENC), Dresden, Germany, 23–24 November 2020; Volume 1, pp. 1–11. [Google Scholar]
- Mancini, F.; Dubbini, M.; Gattelli, M.; Stecchi, F.; Fabbri, S.; Gabbianelli, G. Using unmanned aerial vehicles (UAV) for high-resolution reconstruction of topography: The structure from motion approach on coastal environments. Remote Sens. 2013, 5, 6880–6898. [Google Scholar] [CrossRef] [Green Version]
- Peppa, M.V.; Mills, J.P.; Moore, P.; Miller, P.E.; Chambers, J.E. Automated co-registration and calibration in SfM photogrammetry for landslide change detection. Earth Surf. Process. Landforms 2018, 44, 287–303. [Google Scholar] [CrossRef] [Green Version]
- Williams, R.D. Section 2.3.2: DEMs of Difference. In Geomorphological Techniques; British Society for Geomorphology: London, UK, 2012; pp. 1–17. ISBN 2047-0371. [Google Scholar]
- Neverman, A.J.; Fuller, I.C.; Procter, J.N. Application of Geomorphic Change Detection (GCD) to quantify morphological budgeting error in a New Zealand gravel-bed river: A case study from the Makaroro River, Hawke’s Bay. J. Hydrol. 2016, 55, 45–63. [Google Scholar]
- Heckmann, T.; Vericat, D. Computing spatially distributed sediment delivery ratios: Inferring functional sediment connectivity from repeat high-resolution digital elevation models. Earth Surf. Process. Landforms 2018, 43, 1547–1554. [Google Scholar] [CrossRef]
- Fiorucci, F.; Giordan, D.; Santangelo, M.; Dutto, F.; Rossi, M.; Guzzetti, F. Criteria for the optimal selection of remote sensing optical images to map event landslides. Nat. Hazards Earth Syst. Sci. 2018, 18, 405–417. [Google Scholar] [CrossRef] [Green Version]
- Karantanellis, E.; Marinos, V.; Vassilakis, E. 3D hazard analysis and object-based characterization of landslide motion mechanism using uav imagery. Int. Aarch. Photogramm. Remote Sens. Spat. Inf. Sci. ISPRS Arch. 2019, 42, 425–430. [Google Scholar] [CrossRef]
- Karantanellis, E.; Marinos, V.; Vassilakis, E.; Christaras, B. Object-based analysis using unmanned aerial vehicles (UAVs) for site-specific landslide assessment. Remote Sens. 2020, 12, 1711. [Google Scholar] [CrossRef]
- Borga, M.; Gaume, E.; Creutin, J.-D.; Marchi, L. Surveying flash floods: Gauging the ungauged extremes. Hydrol. Process. 2008, 22, 3883. [Google Scholar] [CrossRef]
- Antova, G. Application of Areal Change Detection Methods Using Point Clouds Data. IOP Conf. Ser. Earth Environ. Sci. 2019, 221, 12082. [Google Scholar] [CrossRef]
- Ahmad Fuad, N.; Yusoff, A.R.; Ismail, Z.; Majid, Z. Comparing the performance of point cloud registration methods for landslide monitoring using mobile laser scanning data. Int. Arch. Photogramm. Remote Sens. Spat. Inf. Sci. ISPRS Arch. 2018, 42, 11–21. [Google Scholar] [CrossRef] [Green Version]
- Alexiou, S.; Deligiannakis, G.; Pallikarakis, A.; Papanikolaou, I.; Psomiadis, E.; Reicherter, K. Comparing high accuracy t-lidar and uav-sfm derived point clouds for geomorphological change detection. ISPRS Int. J. Geo-Information 2021, 10, 367. [Google Scholar] [CrossRef]
- Woodget, A.S.; Carbonneau, P.E.; Visser, F.; Maddock, I.P. Quantifying submerged fluvial topography using hyperspatial resolution UAS imagery and structure from motion photogrammetry. Earth Surf. Process. Landforms 2015, 40, 47–64. [Google Scholar] [CrossRef] [Green Version]
- Niethammer, U.; James, M.R.; Rothmund, S.; Travelletti, J.; Joswig, M. UAV-based remote sensing of the Super-Sauze landslide: Evaluation and results. Eng. Geol. 2012, 128, 2–11. [Google Scholar] [CrossRef]
- Liu, C.-C.; Chen, P.-L.; Matsuo, T.; Chen, C.-Y. Rapidly responding to landslides and debris flow events using a low-cost unmanned aerial vehicle. J. Appl. Remote Sens. 2015, 9, 096016. [Google Scholar] [CrossRef]


| July 2020 Survey | October 2020 Survey | |||||
|---|---|---|---|---|---|---|
| Flying altitude | 375m | 383m | ||||
| Number of images | 595 | 451 | ||||
| Overlap | 80% | 80% | ||||
| Dense point cloud | ~77 million points | ~54 million points | ||||
| Camera location RMS error | X(m) | Y(m) | Z(m) | X(m) | Y(m) | Z(m) |
| 1.19 | 1.98 | 1.57 | 0.003 | 0.004 | 0.007 | |
| GCPs RMS error | X(m) | Y(m) | Z(m) | X(m) | Y(m) | Z(m) |
| 0.03 | 0.07 | 0.07 | 0.03 | 0.07 | 0.07 | |
Disclaimer/Publisher’s Note: The statements, opinions and data contained in all publications are solely those of the individual author(s) and contributor(s) and not of MDPI and/or the editor(s). MDPI and/or the editor(s) disclaim responsibility for any injury to people or property resulting from any ideas, methods, instructions or products referred to in the content. |
© 2023 by the authors. Licensee MDPI, Basel, Switzerland. This article is an open access article distributed under the terms and conditions of the Creative Commons Attribution (CC BY) license (https://creativecommons.org/licenses/by/4.0/).
Share and Cite
Kotsi, E.; Vassilakis, E.; Diakakis, M.; Mavroulis, S.; Konsolaki, A.; Filis, C.; Lozios, S.; Lekkas, E. Using UAS-Aided Photogrammetry to Monitor and Quantify the Geomorphic Effects of Extreme Weather Events in Tectonically Active Mass Waste-Prone Areas: The Case of Medicane Ianos. Appl. Sci. 2023, 13, 812. https://doi.org/10.3390/app13020812
Kotsi E, Vassilakis E, Diakakis M, Mavroulis S, Konsolaki A, Filis C, Lozios S, Lekkas E. Using UAS-Aided Photogrammetry to Monitor and Quantify the Geomorphic Effects of Extreme Weather Events in Tectonically Active Mass Waste-Prone Areas: The Case of Medicane Ianos. Applied Sciences. 2023; 13(2):812. https://doi.org/10.3390/app13020812
Chicago/Turabian StyleKotsi, Evelina, Emmanuel Vassilakis, Michalis Diakakis, Spyridon Mavroulis, Aliki Konsolaki, Christos Filis, Stylianos Lozios, and Efthymis Lekkas. 2023. "Using UAS-Aided Photogrammetry to Monitor and Quantify the Geomorphic Effects of Extreme Weather Events in Tectonically Active Mass Waste-Prone Areas: The Case of Medicane Ianos" Applied Sciences 13, no. 2: 812. https://doi.org/10.3390/app13020812
APA StyleKotsi, E., Vassilakis, E., Diakakis, M., Mavroulis, S., Konsolaki, A., Filis, C., Lozios, S., & Lekkas, E. (2023). Using UAS-Aided Photogrammetry to Monitor and Quantify the Geomorphic Effects of Extreme Weather Events in Tectonically Active Mass Waste-Prone Areas: The Case of Medicane Ianos. Applied Sciences, 13(2), 812. https://doi.org/10.3390/app13020812