1. Introduction
Among other sectors, queueing theory has a wide spectrum of use in air transport as well. In this paper, we use it to simulate the processes of handling aircrafts that are being prepared for flight, evaluating the efficiency of individual systems in aviation, and passenger handling before departure or after arrival [
1]. In these cases, queueing theory is used to optimize the flow of requests that enter the systems. The best example of the use of queueing theory in the aviation sector is the check-in process of passengers before boarding the plane. When applying queueing theory, we will need information that will enter the simulation. This information is, for example, the number of entry requests, the number of service desks, the time intervals in which requests arrive, the duration of handling one passenger, the time that is intended for handling, but also other information according to what we want to obtain from the simulation. It is possible to calculate the costs and revenues of individual systems, where information about the costs, revenues, or profits of individual parts will be needed. In handling processes, there may be an increase or decrease in the flow volume of requests, which may cause a shortage or surplus of manpower. In the case of a shortage or surplus of work, problems arise, which are connected either with unnecessary downtime of workers, which costs a lot of money, or, in the case of a low amount of personnel, with long waiting times for passengers [
2].
In current managerial practice, there is constant pressure to optimize processes to increase work efficiency and reduce operating costs. Air transport is one of the areas facing capacity problems due to increasing demand for it [
3]. On the other hand, it is one of the sectors of the economy most affected in the event of an economic recession, or other unpredictable influences, as was the case with the COVID-19 pandemic [
4]. The search for optimal solutions for the efficient operation of airline companies is the subject of many discussions and studies, such as the investigation of the possibilities of saving resources associated with passenger check-in processes and, for example, the created simulation model of a generic medium-sized commercial airport [
5]. Analyzing the behavior patterns in queues at check-in desks and security checks, which are two of the most important processes related to passenger handling services, it is possible to simulate the flow of passengers to obtain the length of airport queues. The simulation is designed as a system based on the storage and dispatch of cells, whose parameters have been tuned and verified with real data from observations and empirical studies of capacity and demand within the airport [
6].
Another key to improving the performance of the handling system for the efficient allocation of resources is a common self-service check-in system, which can in the future alleviate the airport stress caused by limited resources by ensuring the creation of an associative integer programming decision-making model [
7]. Strategic planning of gate allocation with a focus on passenger waiting time is essential for airport operators to accommodate airline departures. It is also made possible by the proposal of a new formulation of exact integer linear programming to implement the discipline “first in, first out” in the queue of waiting passengers to control the waiting time [
8]. The model possibilities in terms of airport check-in hall capacities mainly take into account the capacity efficiency of the airport and the productivity of the employees. This type of modeling is fully applicable to the practice and specific needs of any regional airport [
9]. A queueing theory model to calculate the time spent on each process, for example, at an airport security checkpoint, defines the effectiveness of the security system and analyzes the flow of passengers through the security checkpoint on the corresponding model [
10].
One of the limiting factors for the smooth check-in of passengers is boarding the plane itself. Solving the impact of each passenger’s movement, seat conflict, check-in time, baggage handling time, as well as boarding time is offered by a proposed model to investigate the aforementioned impact [
11]. To increase the efficiency of ground handling of aircraft at the airport, research was focused on improving individual processes to speed up operations and increase the overall throughput of airport stands [
8]. The handling process of passengers is often limited by the airport’s transport connections. Possibilities to eliminate delays are provided by the vehicle and passenger dispatching model itself [
12].
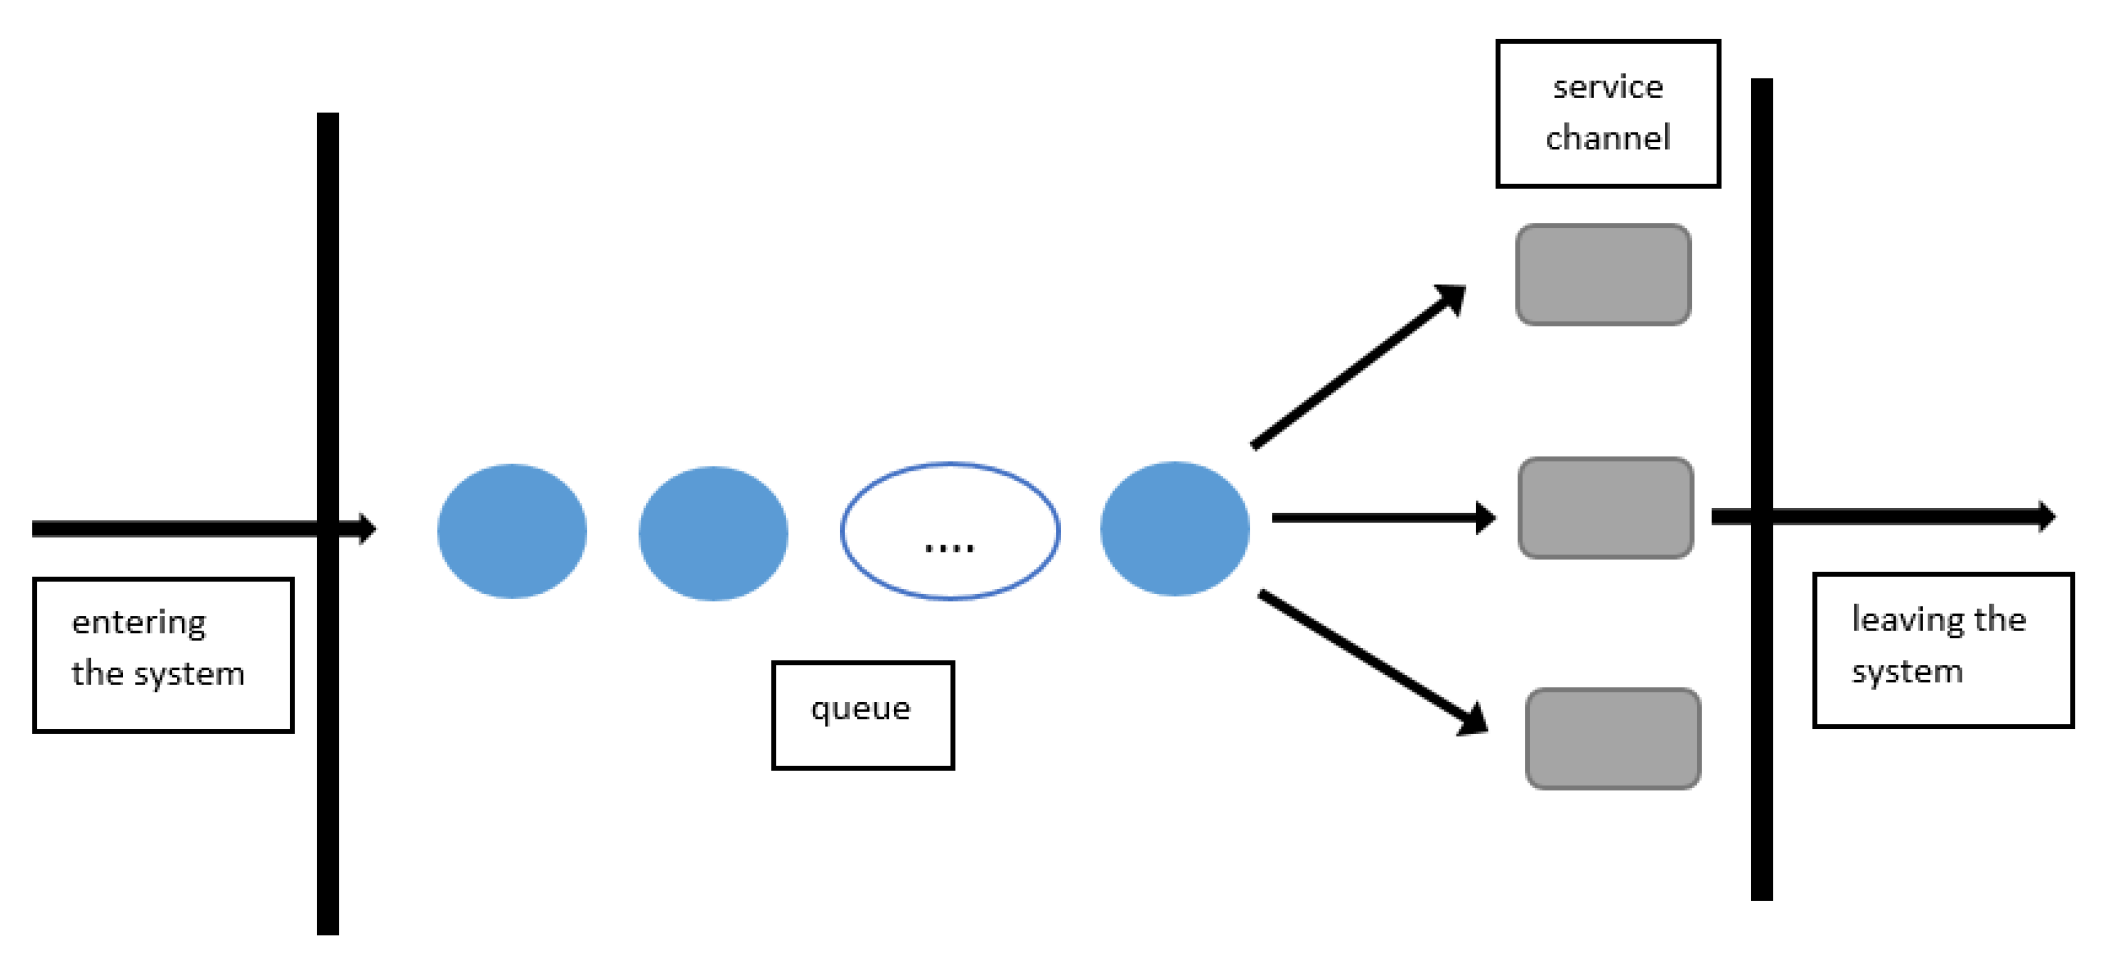
In air transport, it is possible to use the optimization of activities and processes to obtain the expected number of necessary personnel to handle passengers before departure and to estimate the number of necessary service lines (
Figure 1). We obtain this predicted number from calculations of the data obtained from previous similar activities where there were similar data as we assume for the selected flight that we want to optimize. In the same way, it allows us to work with optimization in aircraft handling, when we mainly deal with the necessary number of employees and the time required to ensure all the activities that the aircraft must complete before departure [
13].
All these activities need to be optimized so that they are performed in a certain predetermined time. Failure to meet the times may cause flight delays or financial costs for airports or airlines. Contracts are concluded between air carriers and airports, where the times during which the aircraft must be checked in and ready for flight are determined in advance. In case of non-observance of these times, fines must be paid, either by the airlines, in the case that they provide the aircraft handling process, or, in the case that these processes are ensured by airports through different companies, they pay the fines [
15].
The mentioned factors, which are the subject of research in queueing theory, have an impact not only on the optimization of the workforce but also on economic factors. Then, in queueing systems, the efficiency criteria, on which the evaluation is based, can also be divided. Among the efficiency criteria of queueing systems, probabilistic and economic characteristics can be included.
Probabilistic characteristics monitor phenomena that can occur in a queueing system and how likely they are to occur. In the case of service lines at check-in, we can take into account, for example, the probability that all lines will be occupied, or that all will be free, or how many of them will be occupied, and how long it takes to wait in line. It is also important to point out the mean values of the selected random variables, which are, for example, the average number of occupied lines, requests in the system, the average length of the queue, etc. [
16].
In this article, we first present an overview of the academic literature concerning the adaptation of queueing theory for the optimization of various processes within the aviation sector. In following section, the creation of the simulation model necessary for choosing the best possible solutions for the execution of processes in air transport, particularly passenger handling, is elaborated along with the presentation of the simulation model and evaluation criteria utilized for the proposed case study. The final part includes the assessment and graphical presentation of the data obtained from the simulations for flights from Košice and Prague to Warsaw, their comparison, and results.
2. Literature Review
Over the years, there have been multiple studies concentrating on queueing theory, employing a wide range of models utilizing different modeling and optimization criteria, and taking into account the different needs of airports. In general, it can be said that the main factors for modeling the optimal queueing mechanism are usually the arrival time in the queue and service time and levels [
17]. However, Yakubu and Najim [
18], in their analysis of possible ways for the reduction of waiting times, concluded that even though queuing theory may be used to determine ideal service levels, waiting times may still be excessive due to other influences, such as a service failure.
Although most of the research related to queueing theory in aviation is connected to security checks, several studies are focusing on other aspects of air travel. We can mention research by Zhou and Zhang [
19]. Every winter, snow and ice conditions will result in numerous flight delays, and de-icing work has a significant impact on the aircraft’s time of departure. It requires cooperation between airports, airlines, weather bureaus, de-icing firms, and several other uncontrolled variables, including the amount of ice and snow, the strength of the wind, and crises. Therefore, their study focused on developing the airport de-icing queueing system model, which could be further transferred for use in other airport operations, using the notion of queueing theory based on the examination of domestic and international expert de-icing activity. Looking at other airport-related services, Ma, Lui, and Wang [
20] created a model of a cab driver’s decision-making process employing queueing theory approach, with the goal of solving a number of issues that airport taxis encounter more logically and effectively as well as fostering the effective growth of the airport taxi business, and consequently proving its logic through the simulation.
The main focus of queueing theory is inside airport terminal buildings, where passengers experience several handling procedures. The amount of time passengers need and their level of comfort are typically used to gauge how well these processes are working. In relation to the activities within air transport, Chen et al. [
21] built a model to perform an empirical study on the capacity of the passenger transportation business. They concluded that the capacity of the passenger transportation industry is constrained by the capacity of each activity’s processing. Similarly, Munasinga and Adikariwattage [
22] used discrete event simulation theory to simulate a network of processes and determine patterns of time variations to identify the shortcomings of the system.
Variations in the length of the airport security check can result in the varying time of aircraft departure, which can be either unreasonably early or late. In order to accommodate the passenger processing facilities, such as the check-in service, queueing analysis is needed at the airport check-in counter. There are numerous studies utilizing queueing theory for the analysis of check-in and security check process efficiency [
23]. They all provide different models using different parameters and variables. Parlar and Sharafali [
24] provided a multi-counter queueing model and developed a stochastic dynamic programming model to identify the ideal number of counters to open during the given time interval. A study conducted by Rodríguez-Sanz et al. [
6] used actual flight data to simulate the passenger flow and determine line lengths at a popular European airport between 2014 and 2016 and consequently recommended airport operators the most effective response strategies and how to anticipate behavior trends at check-in desks and security checkpoints.
Li et al. [
25] in their research simulated various passenger tactics for queueing at airport security checkpoints. Their research shows that in order to achieve the best performance, various network layouts call for various passenger methods. Zhu et al. [
26] examined the efficiency of airport self-service kiosks in order to optimize the system, finding that the Vienna airport’s general percentage of idle kiosk time is extremely high, particularly on weekdays. Široký and Hlavsová [
27] developed a model that analyzes the passenger flow at the terminal in order to evaluate prospective modifications to the check-in and security check systems at airport terminals. Ding et al. [
28] used the average arrival rate, departure rate, and the number of security gates as primary variables to investigate the issue of increasing airport throughput and reducing waiting times. Additionally, this study shows how throughput index and waiting time may be affected when appropriate steps are taken, proving that opening the right check lane can lower wait time variance. A study by Wibowo and Fadilah [
29] concluded there are several ways to reduce the check-in line, some of which include offering a self-service check-in facility or offering city check-in services.
Lee and Longton [
30] describe how to identify the ideal system using both theoretical and empirical techniques to understand how the check-in procedures work and what is the capacity to address some long-standing issues with check-in systems. In order to model and study the flow conditions and waiting times for airport passenger check-in and security checks, Shi, Zhou, and Yu [
31] employed computer simulation technology. Using the fundamental ideas of queue models—arrival and service time distributions, queue disciplines, and queue behavior—a queueing system may be used to assess how effective a model is. The major objective of Zaki et al. [
32] was to examine how the Queueing Theory Model and Fuzzy Queueing Model behave when used to simulate a queueing system at check-in counters. While the Fuzzy Queueing Model includes a range of values, the Queueing Theory Model only provides performance metrics for a single value.
In this research, we aim to demonstrate how a simulation model may be used to simulate queueing system in air transport. In order to optimize the specified simulated process, the measured data from the airport are applied to the developed simulation model. Based on the evaluation of the information obtained from the simulations, it is possible to suggests improvements or the removal of potential problematic issues that could occur during the passenger handling process.
3. Creation of the Model Necessary for Optimization of the Air Transport Process
The growing trend of using air transport is causing an increase in the number of passengers, i.e., also the number of people who need to be handled at check-in desks. With the increase in the number of passengers and thus the densification of operations at airports, several other activities must also be optimized, whether it is the movement of aircraft in operating areas or in the airspace, check-in of aircraft before departure and after arrival, or loading and unloading of luggage and cargo. Optimization in the field of aviation is aimed at gradually speeding up and facilitating the handling of passengers so that they spend as little time as possible at the check-in desks, thereby speeding up the handling, reducing the cost of operating desks and employee wages, and increasing revenues, because airports will have to handle a greater number of passengers at the same time.
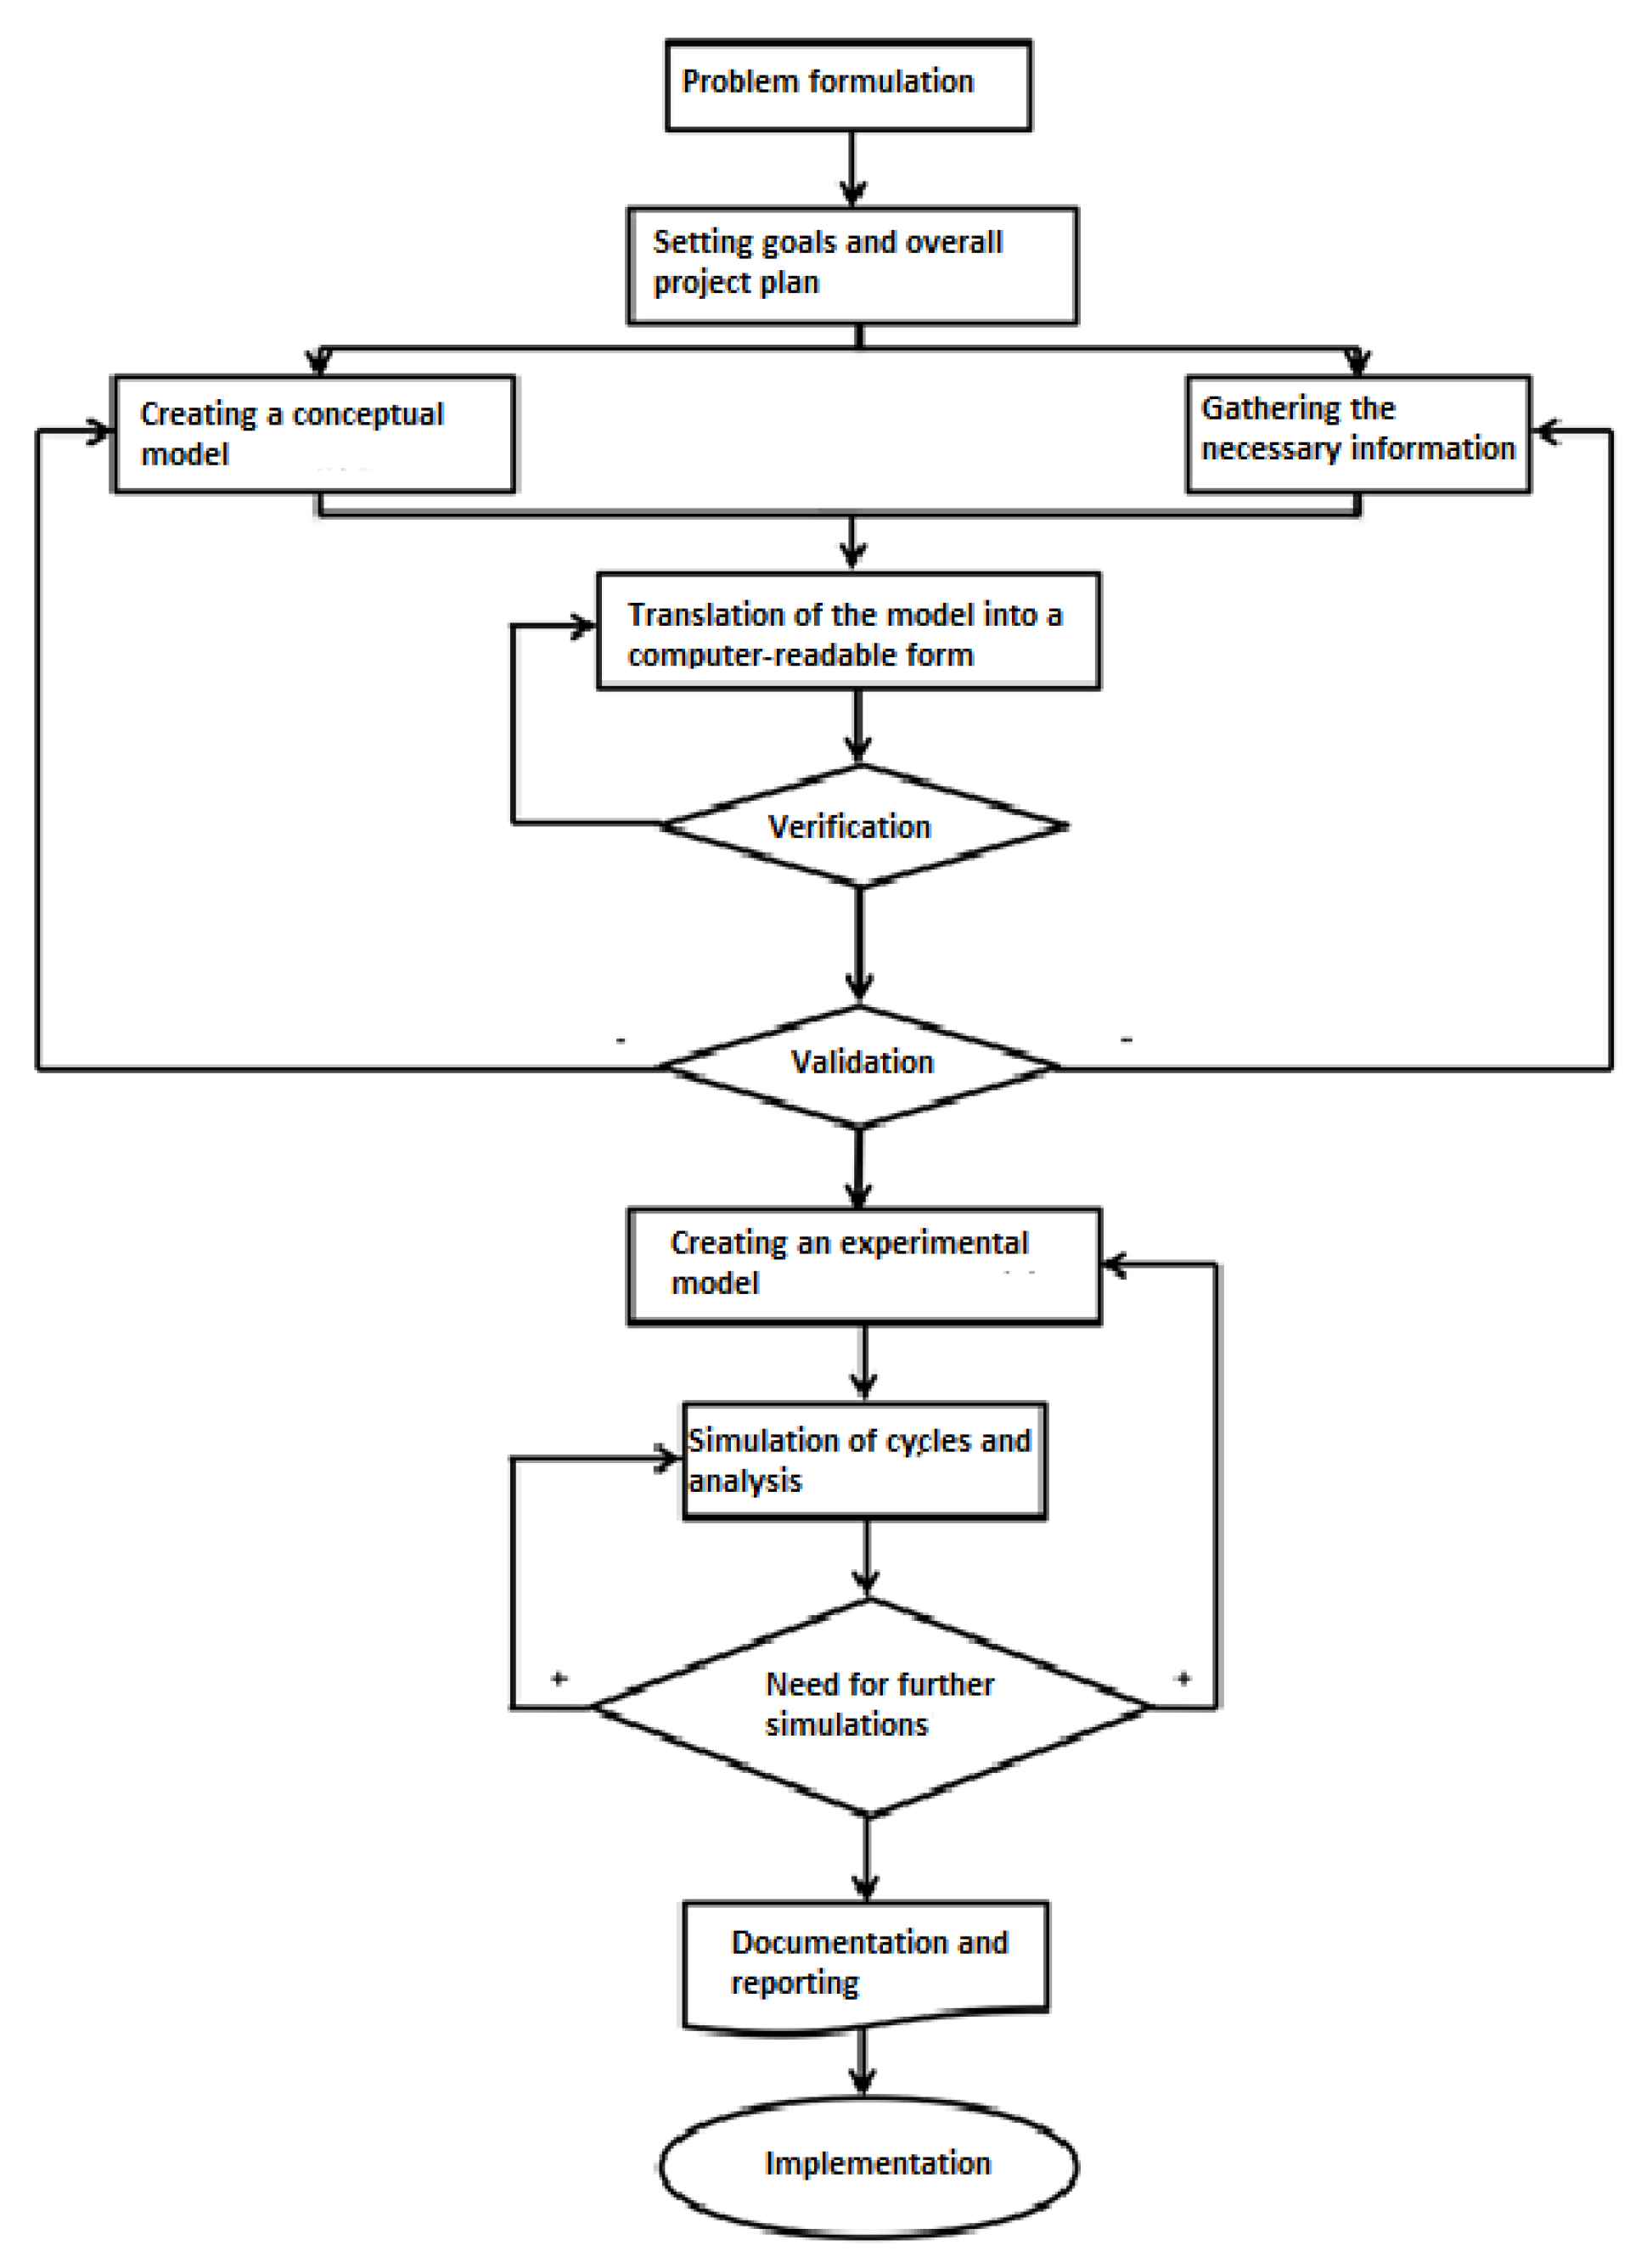
When creating simulation models, certain steps should be followed that lead to the creation of a model which is then suitable for use in simulations. However, models consist of certain parts that are necessary for their creation. These parts are system entities, input variables, functional relationships, and model performance measures. The basic steps in modeling and subsequent simulation can be divided into the following steps (
Figure 2) [
15].
Methodology
In our work, we dealt with the problems of queueing systems when handling passengers at check-in desks at airports. It was assumed that the investigated systems are systems with waiting, i.e., without losses, and therefore, all requests registered for the selected flight, which come from an unlimited source, must be handled. The service desks that conduct passenger handling are equal to each other. When all service desks available to handle requests for that flight are occupied, the request that follows must wait for one of the check-in desks to be freed in order to be handled. The reason that requests have to wait when all the available desks are occupied is that all requests that have been received for that flight—in this case, we consider the number of requests to be the number of passengers who have purchased a ticket for that flight—must be handled in a certain predefined time.
MATLAB is the programming environment used for modeling the best options for the process in air transport. Before starting the simulation, it was necessary to select the required number of attempts to run the simulation to ensure the required accuracy of the results. The number of attempts to run the simulation depends (among others) on the available computing power and performance. During the modeling and simulation, we chose to evaluate the criteria of the efficiency of service check-in desks in the passenger handling process at the international airport in Košice and Prague. We mainly focused on the criteria that indicate the probability of passengers waiting in line for handling and, if necessary, the time they have to spend in line. Among these efficiency criteria will be the criterion of the probability of waiting in the queue, the average waiting time of a request in the queue for handling, and the average number of requests in the queue. For the purposes of modeling, flights from Košice to Warsaw operated by ČSA airline was chosen, as well as flights from Prague to Warsaw, operated by the airline LOT Polish Airlines back in 2019. The reason for choosing these flights from this particular year was that the subsequent crisis caused by COVID-19 has greatly limited flights carried out almost all over the world. Flights from these two airports were chosen as the aim of this study is to compare the efficiency criteria, from the point of view of the time passengers have to spend waiting, of the airport with fewer flights in Košice and the airport with a higher number of flights in Prague, on a flight to the same destination, in the same period of one week.
Table 1 shows the number of passengers on each flight. When handling each flight at the check-in desk, two check-in desks, equal to each other, were opened. For flights from Košice, the check-in process started 120 min before departure and ended 30 min before departure. For flights from Prague, the check-in process started 150 min before the departure and closed 40 min before departure. This means that the net handling time in Košice was 90 min, which represented 5400 s, and in Prague, it was 110 min, which is 6600 s. The simulations were performed in the conversion of all necessary time data to seconds, considering that the handling times of individual passengers at the check-in desks were in most cases shorter than a minute.
The number of passengers follows the flights from
Table 1. As can be seen, flights from Prague had higher numbers of passengers than flights from Košice airport. Efficiency criteria will be evaluated according to these data. Other necessary data for the following calculations are the minimum, average, or most common and maximum passenger handling times.
Table 2 shows the minimum, average, and maximum time for handling passengers at the check-in desks in Košice and Prague, given in seconds. The time passengers spend at the check-in desks is influenced by several factors, the most common of which are how much luggage the passengers have with them, whether they have all the necessary documents, whether the passengers have already checked in before arriving at the airport or not, etc.
The next step after clarifying the problem we want to solve and obtaining all the data is to create the model needed for the simulation. Through the MATLAB program, we created a program describing a model of the queueing system of the passenger handling process, which served to calculate the five criteria described above and the number of handled requests with and without waiting, or unhandled requests. First, when creating the information model, we defined the type of parameters that were used in the simulations and the number of characters they can contain.
Then, it is necessary to insert the input data obtained from the airports, which will be gradually changed during the simulations in order to find out their effect on the time of the handling process. The necessary input parameters are [
16]:
N—number of check-in desks intended for service. For both flights, there was the same basic number of desks, i.e., two. However, during the simulations, we varied their numbers to find out what effect this has on the speed of passenger handling.
A—minimum service time for one request. The minimum handling times were obtained from the airports in Košice and Prague and can be found in
Table 2, where the time is 10 s in Košice and 20 s in Prague.
B—the most common service time for one request. It represents the average time, which is also found in
Table 2, and has the same value of 40 s for both airports.
C—maximum service time for one request. This is the time that sometimes occurs with certain problems at the check-in desk, also shown in
Table 2. For Košice, this time was higher than for Prague, where it was 120 s, and for Košice, 300 s.
MT—the maximum time that is intended for serving all requests. This time corresponded to the length of the handling process; it was 5400 s in Košice and 6600 s in Prague.
MNR—the maximum number of requests that can be handled during the time specified for handling requests. The numbers of passengers on individual flights, which can be found in
Table 1, were used.
NG—the number of games simulated for the given phenomenon. In our case, each flight was simulated five times with the same values and then created average values for each flight, which were further used when comparing the results. The number of simulations was limited by the power and performance of the used computer as well as by the computational time.
The first simulations for each number of passengers, which are found in
Table 1, were created with parameters that were obtained from the airports. For flights from Košice, the check-in process lasted 90 min. The minimum, maximum, and average times corresponded to the values from
Table 2 and the number of check-in desks was two. For flights from Prague, the check-in process lasted 110 min, the passenger check-in time values also corresponded to
Table 2 and two desks were also opened. The times intended for handling passengers were recalculated to seconds, to have the same units for all times used in the simulations, i.e., in Košice it was 5400 s, and in Prague, 6600 s.
The number of simulated rounds for each flight was 30; then, the obtained information were evaluated model in Excel. After creating simulations under the baseline conditions obtained from the airports, individual inputs were varied to see how they affect service time. Later, simulations with modified data were performed, where the number of check-in desks was changed to one or three, while all other data remained unchanged, or the length of handling time was changed from 4200 to 6600 s and all other parameters remained the same. The simulations for all the flights were performed in this way and consequently evaluated in Excel. The mean interval between the arrival of requests to the system, as described above, was set to a random value from the range of 40 to 60 s.
After entering the input data and calculating the average interval of requests entering the system, the model was used to calculate five efficiency criteria. During the simulation, other parameters were registered, which were necessary for the calculation of the criteria. The selected parameters that were directly involved in the calculation of the criteria were [
16]:
PCR—expresses the number of completed requests waiting for handling. With each completed request, the PCR data increased by 1.
TNR—expresses the total number of requests that could be handled during the specified time of the check-in process. Its value increases by 1 every time a new request arrives in the system, regardless of whether it is handled with or without waiting.
TT—expresses the total waiting time for handling requests. After each request that had to wait for handling, the time that the given request had to wait is written into the data.
EH—expresses the moment of the end of handling of requests. The simulation of one round ends when the time allocated for handling requests is up, or all requests entered at the beginning of the simulations are handled.
Using the data that we entered and which were registered during the simulation, it was possible to calculate the following five efficiency criteria at the end of the simulation. These criteria were:
Criterion—according to this, the probability passengers will have to wait in line for handling is calculated:
Criterion—serves to calculate the total waiting time of all requests in the queue; it is calculated using the data that are registered during the simulation:
Criterion—expresses the average waiting time of request handling, where the total waiting time of all requests is converted to all requests for a given round, regardless of whether they had to wait in a queue or not. It is calculated as follows:
Criterion—expresses the average waiting time in the queue, when the total idle time of the requests is recalculated to only those requests that actually had to wait in the queue for service. We calculate it by the relation:
Criterion—expresses the average number of requests that had to wait for handling in the queue. We obtain it according to the relationship:
Data recording during the simulation was carried out until the end of the simulation. The end of the simulation was set either after the time specified at the beginning in the MT data, which corresponded to the length of the handling process, or after the completion of all requirements that were also entered at the beginning in the input data as MNR, depending on which of the phenomena occurred first. Therefore, in some cases, there was no time to handle all MNR requests during the MT time, or the requests were handled before the MT time expired. After the end of part of the simulation, which was used to write down all the data needed to calculate the criteria, the model gradually went through the written data and calculated the efficiency criteria, using the mentioned parameters. This simulation process was repeated until all the handling processes were completed, the number of which was initially specified in the NG data, which corresponded to the number of rounds that the model is supposed to simulate.
4. Discussion of Results
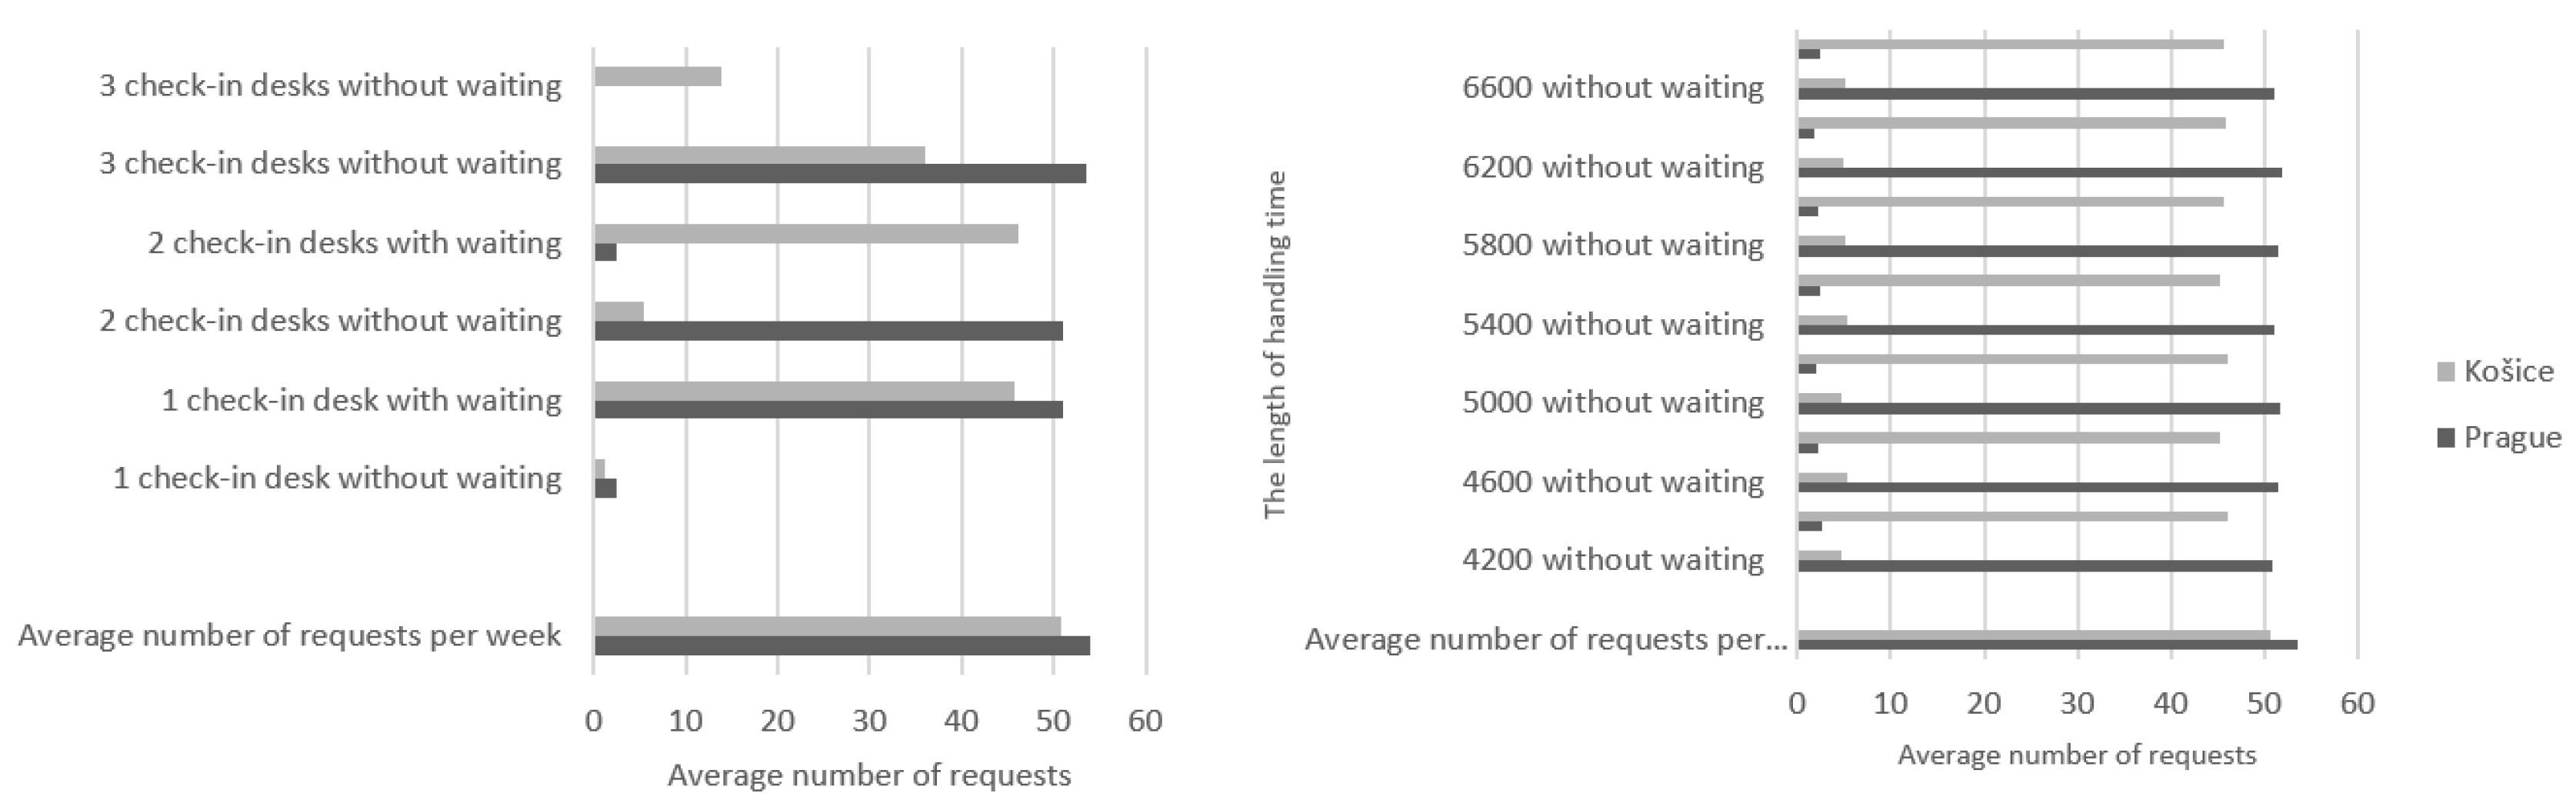
All results obtained from simulations in MATLAB were processed in Excel in the form of tables. After evaluating the data, we proceeded with the graphical display and comparison. First, we evaluated the number of served requests with and without waiting for each variation of individual values.
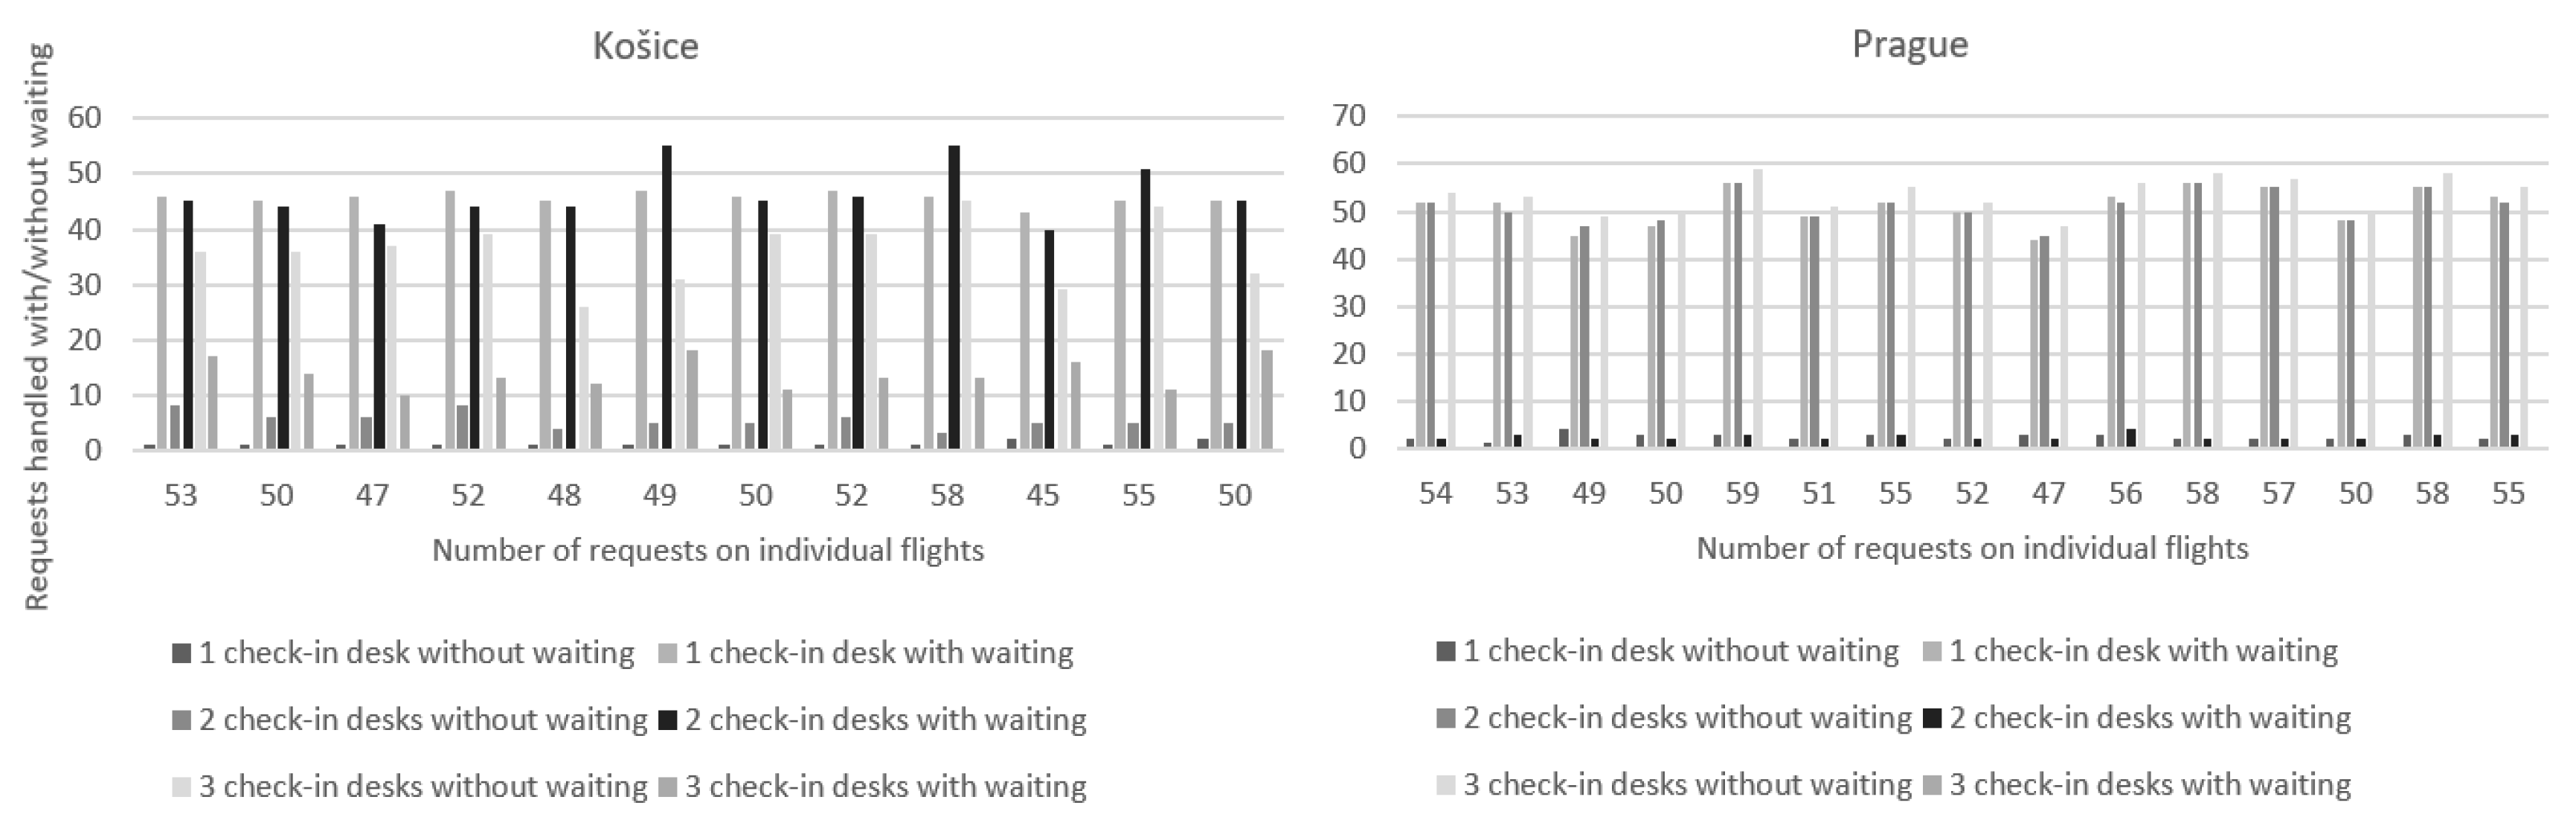
Figure 3 shows a graph that compares the number of serviced requests without waiting, the number of serviced requests with waiting, and the number of backlogged requests. These graphs show a comparison of flights where the basic parameters were set, which are two check-in desks, a 5400 s check-in time for flights from Košice, a 6600 s check-in time for flights from Prague, and passenger check-in times from
Table 2. Further simulations were created by changing the number of check-in desks to one and three. On the left side of
Figure 2 is a comparison of flights from Košice airport and on the right, flights from Prague airport.
As can be seen for the flights from Košice, some requests were not handled. These requests occurred in one case, and that was during simulations where the requests were handled at only one check-in desk. In other cases, they managed to handle all requests in the required time. For flights from Košice, there are also more requests that had to wait for their handling, because the time for handling was 20 min shorter than in Prague, but there were also fewer passengers departing there, which means fewer requests. For flights from Prague even at one check-in desk, all requests could be handled. With three check-in desks for flights from Prague, not a single passenger had to wait for handling and everyone could be checked in without waiting. With two desks, the number of people waiting did not exceed four; however, at one desk, most passengers already had to wait in line. By increasing or decreasing the number of desks, it is possible to see how the number of check-in desks greatly affects the speed and also the possibility of handling requests.
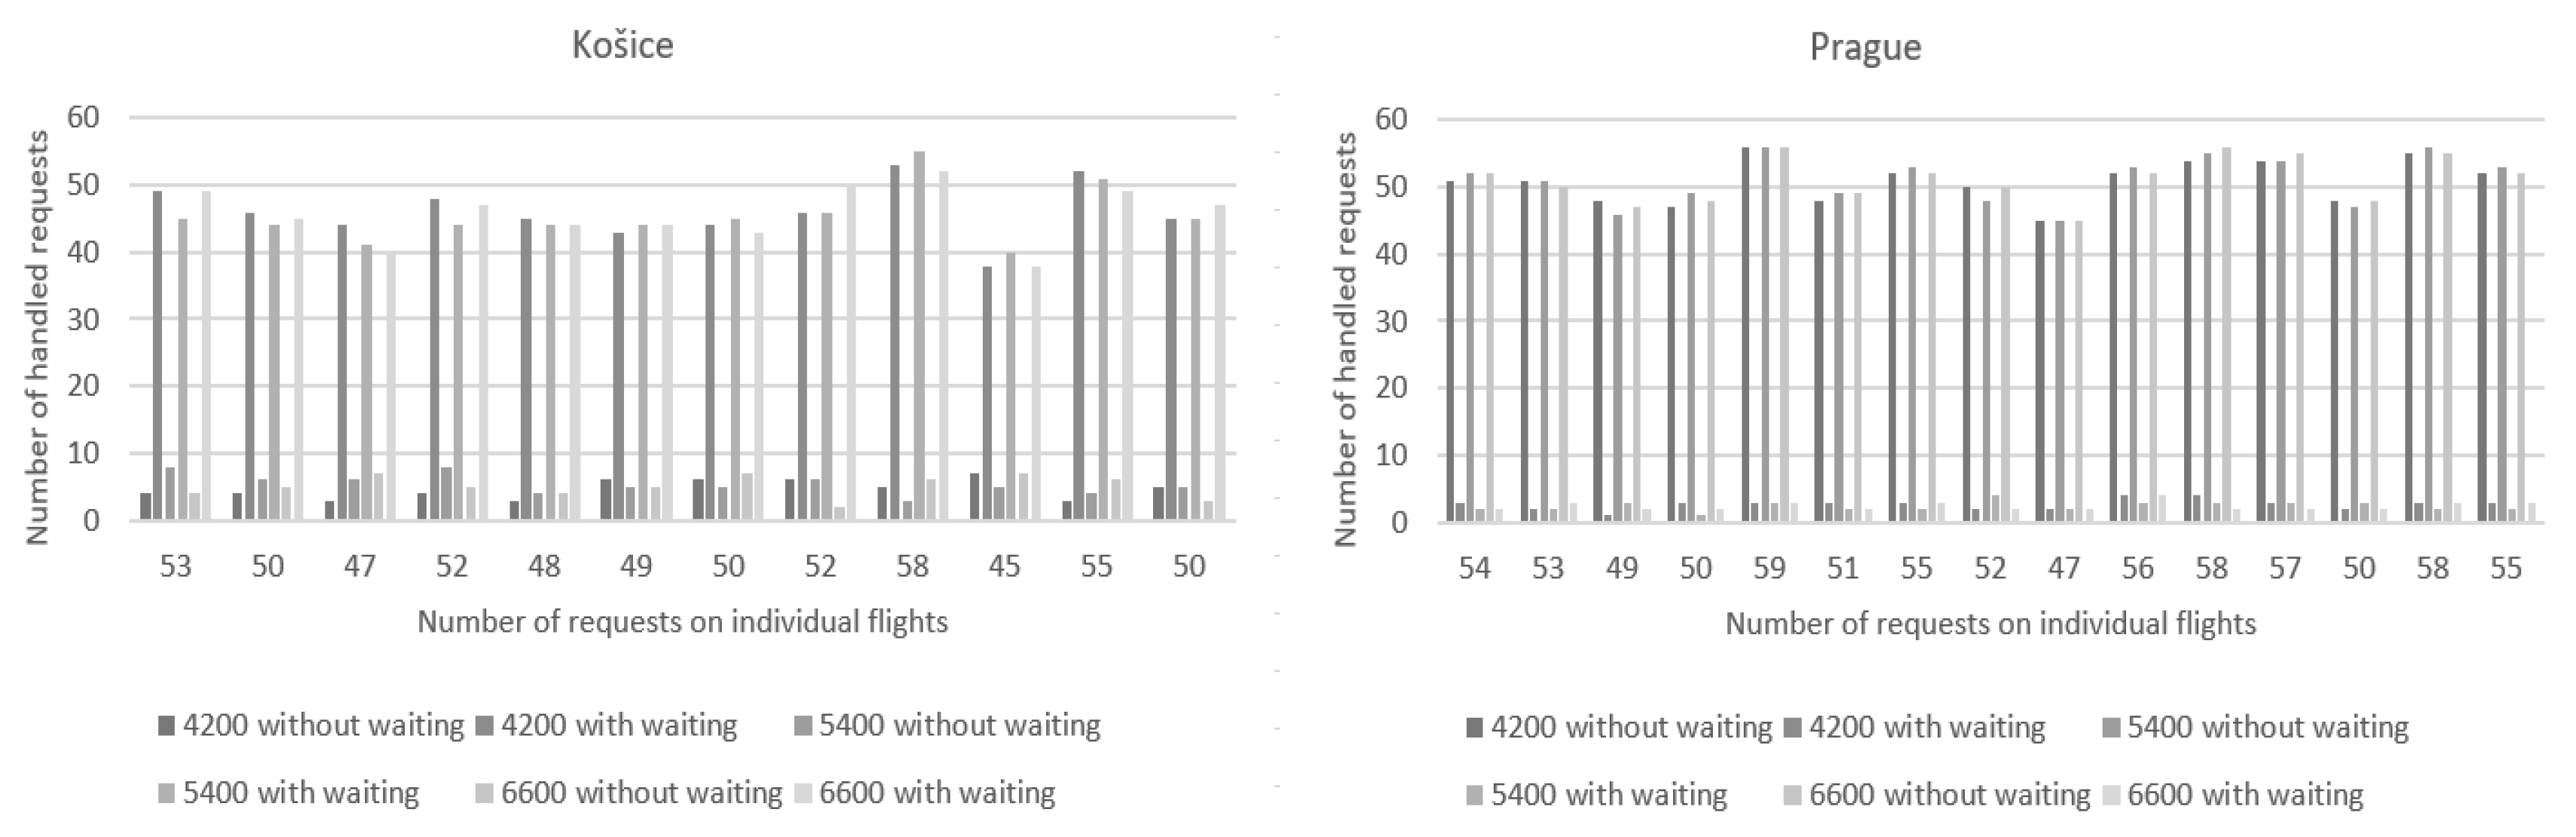
Figure 4 shows a comparison of the number of handled requests without waiting and the number of processed requests with waiting, on the left at the airport in Košice and on the right at the airport in Prague. In
Figure 3, there is a comparison of the handled requests when the number of check-in desks is changed and other parameters are constant, and in
Figure 4 is a comparison of the fulfilled requests with varying handling times and other parameters kept constant. As we can see, the simulations were performed at times of 4200, 5400, and 6600 s. In this case, unlike the previous one, there were no requests at any airport that could not be handled due to insufficient time. As in the previous case, there were fewer requests with waiting at the airport in Prague.
Taking into account the number of processed requests with and without waiting, or pending requests, we can assess that it is unacceptable that only one check-in desk was open at the airport in Košice during the processing of similar flights since it was not possible to handle all requests in 5400 s. In the case of one desk, the time can be increased, which would create the necessary time to handle passengers. Most of the requests in other cases were handled without much waiting, which gives us the possibility of combining different numbers of open desks, or the time designated for handling according to the number of estimated passengers.
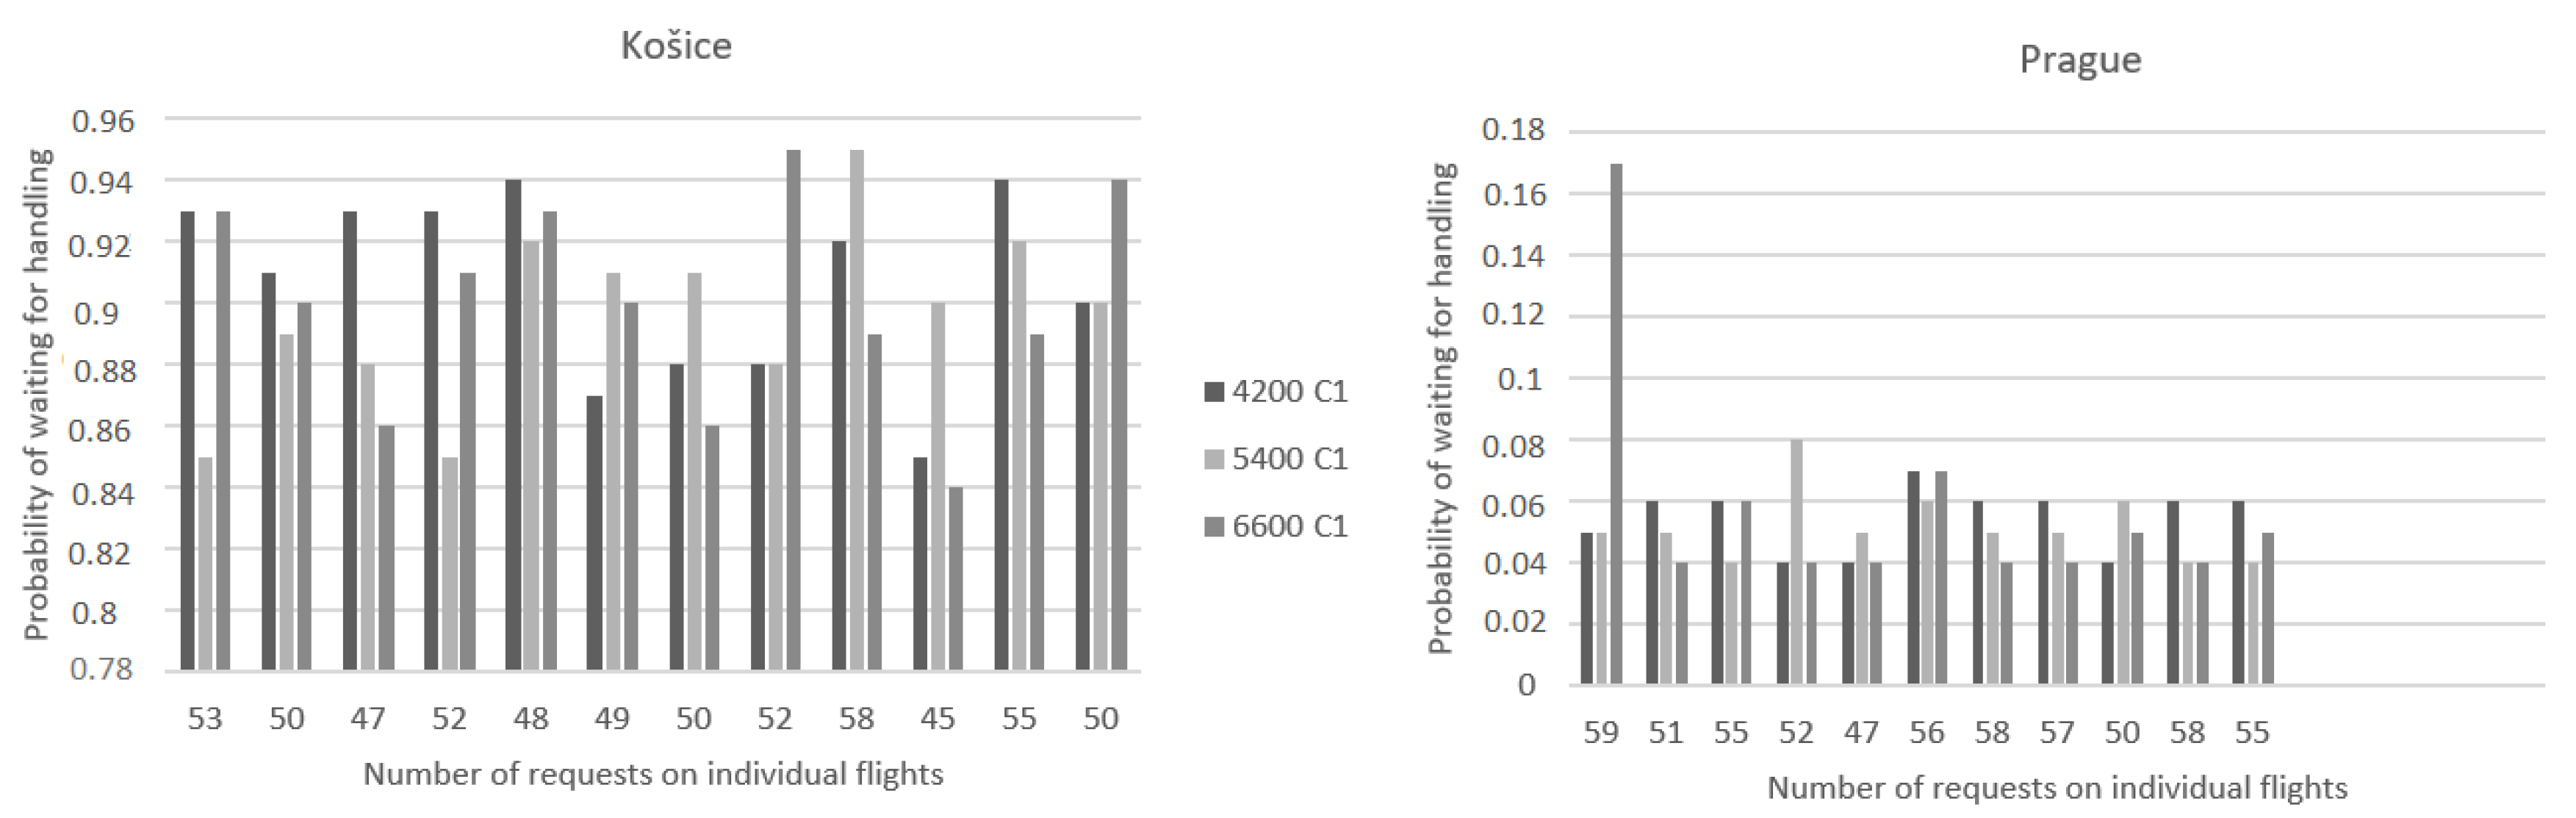
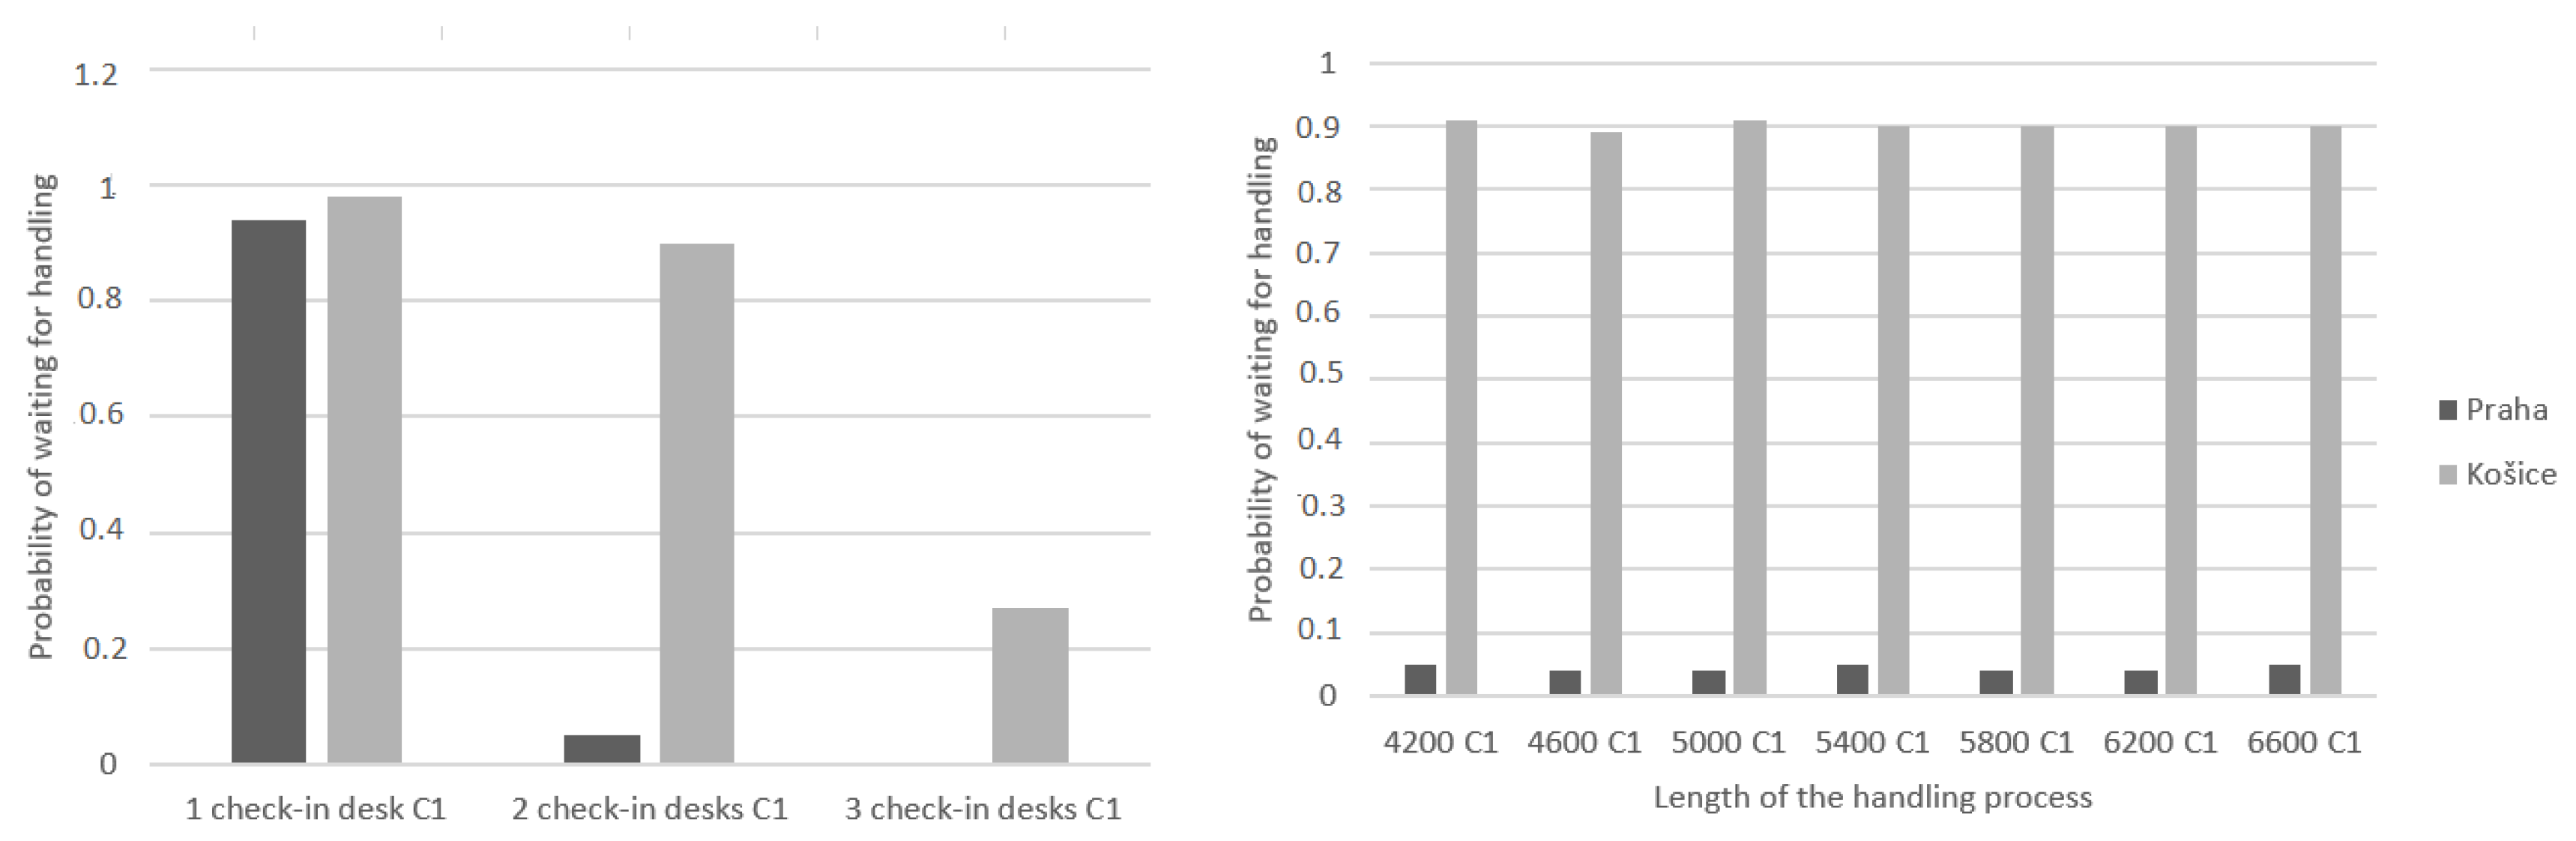
The first efficiency criterion that will be evaluated is the probability of a queue forming or waiting for handling requests. As in the previous case, we divided the comparison according to the change in the time dedicated to handling requests at a constant number of two desks and the change in the number of check-in desks at a constant time dedicated to handling requests. First, the probability of waiting depending on the change in the handling time will be described. The times intended for service were also 4200, 5400, and 6600 s under the basic conditions that were determined by the airports, i.e., two check-in desks and request handling times corresponding to
Table 2.
In
Figure 5, it is possible to see the representation of the probability of waiting for handling requests. Košice airport is on the left and Prague airport is on the right. In this case, the probability of a queue in Košice ranges from 0.85 to 0.95 and in Prague from 0.03 to 0.17. In Košice, the range of probability was larger and ranged in higher values, because the handling times of individual requests, which are found in
Table 2, are larger than at the Prague airport and the maximum processing time for one passenger was 300 s, while in Prague it was only 120 s, so it can be said that the requests at the Prague airport came to the desks in denser intervals and they could be processed in a shorter time than in Košice.
At the Prague airport, the values of the probability of waiting for the handling of requests at any given time were sufficiently small, but as a result, there are large downtimes of service desks that have to wait for incoming requests, but the costs of operating these service desks are still going up. In Košice, due to the higher probability of waiting, however, station downtimes were lower, but from the point of view of passengers, it is better to have a higher probability of downtimes at service desks and spend less time waiting.
In these simulations, when the time allocated for processing requests was changed, all requests that came into the system were processed. The highest efficiency, in this case, would be represented by the time needed to process all requests in the form of 4200 s in Prague. The time of 4200 s would also be sufficient in Košice, as they managed to process all requests even in the shortest simulated time, but it would not be very advantageous for passengers, because they would have to wait a long time for service.
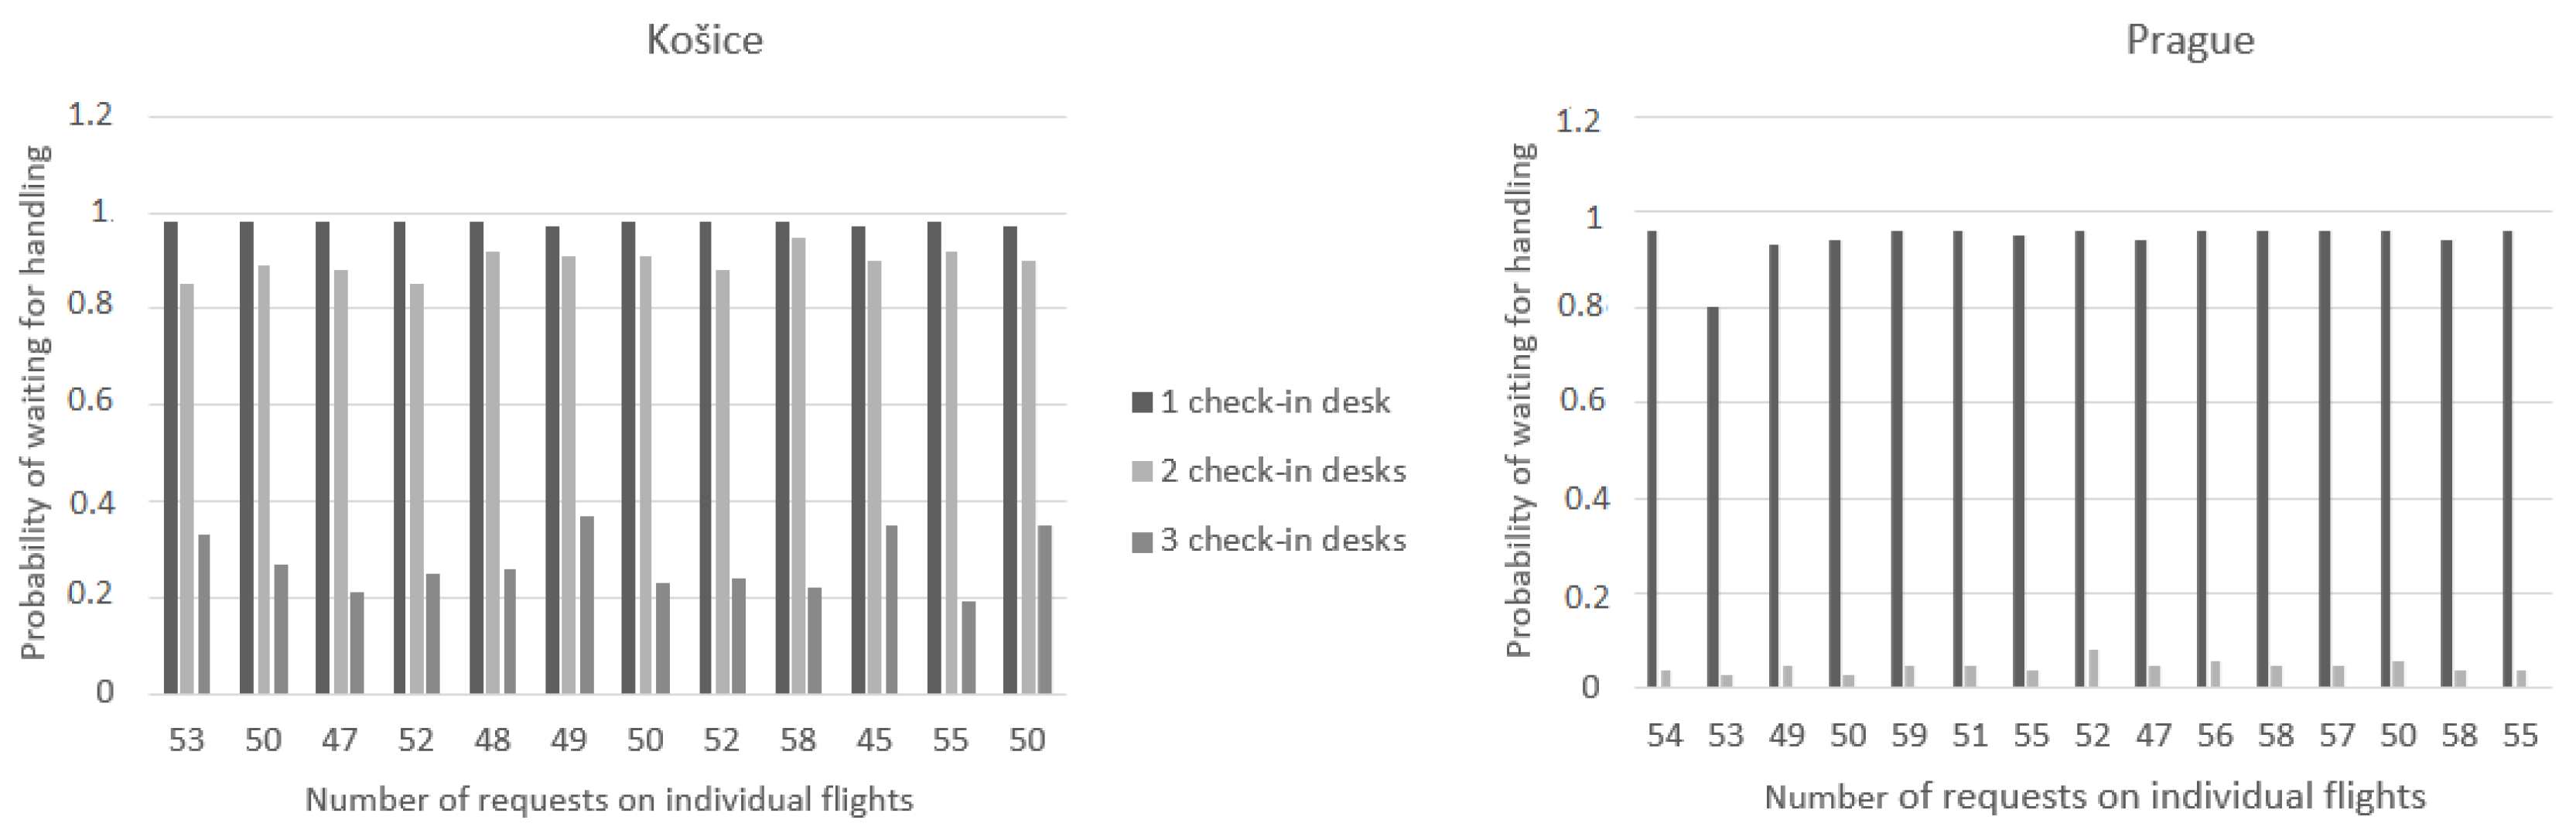
In the second case, the number of check-in desks was changed, while the handling time remained unchanged. Simulations at one, two, and three check-in desks were subsequently created.
Figure 6 presents the results from the mentioned simulations. On the left side are the results from the airport in Košice and on the right side are the results from the airport in Prague. During the simulation, when only one check-in desk in Košice was used, there were already requests that could not be handled in the period of 5400 s. The numbers of these requests are found in the first comparisons that were presented on the graphs in
Figure 3.
It is necessary to handle all requests that come to the system. In this case, it is the number of passengers who came to check in for the flight, so it is not possible to take this case into account in the final best strategy selection. In all other cases, all requests were handled. With three desks, the probability of waiting was already quite low, which would create a lot of downtime. In this case, the best solution for us was the number of desks for both passengers and airlines.
On flights from Prague, when three desks were opened, the probability of requests waiting in a queue was zero in all cases, which means that all requests that arrived could be handled without waiting, which is efficient for passengers who would not have to wait in line for handling, but cost-inefficient for the airlines and the airport. In the case of two service desks, the probability values were also close to zero, which would also mean large downtimes for the desks. In this case, the best solution is one service desk with a handling time of 6600 s.
According to the first criterion, it can be judged that due to the probability of a queue, the best solution for passengers is the maximum handling time or the number of desks, but since we are looking for a method that could be used at airports, the costs for airlines also need to be taken into account. The most suitable solution from the simulated cases would be the use of two desks at the time of 4200 s for the Prague airport. In terms of the number of passengers, it is most appropriate to use three desks at the Košice airport at the time of 5400 s, when passengers would not have to wait in long lines, because in other cases, the waiting times for passengers were high.
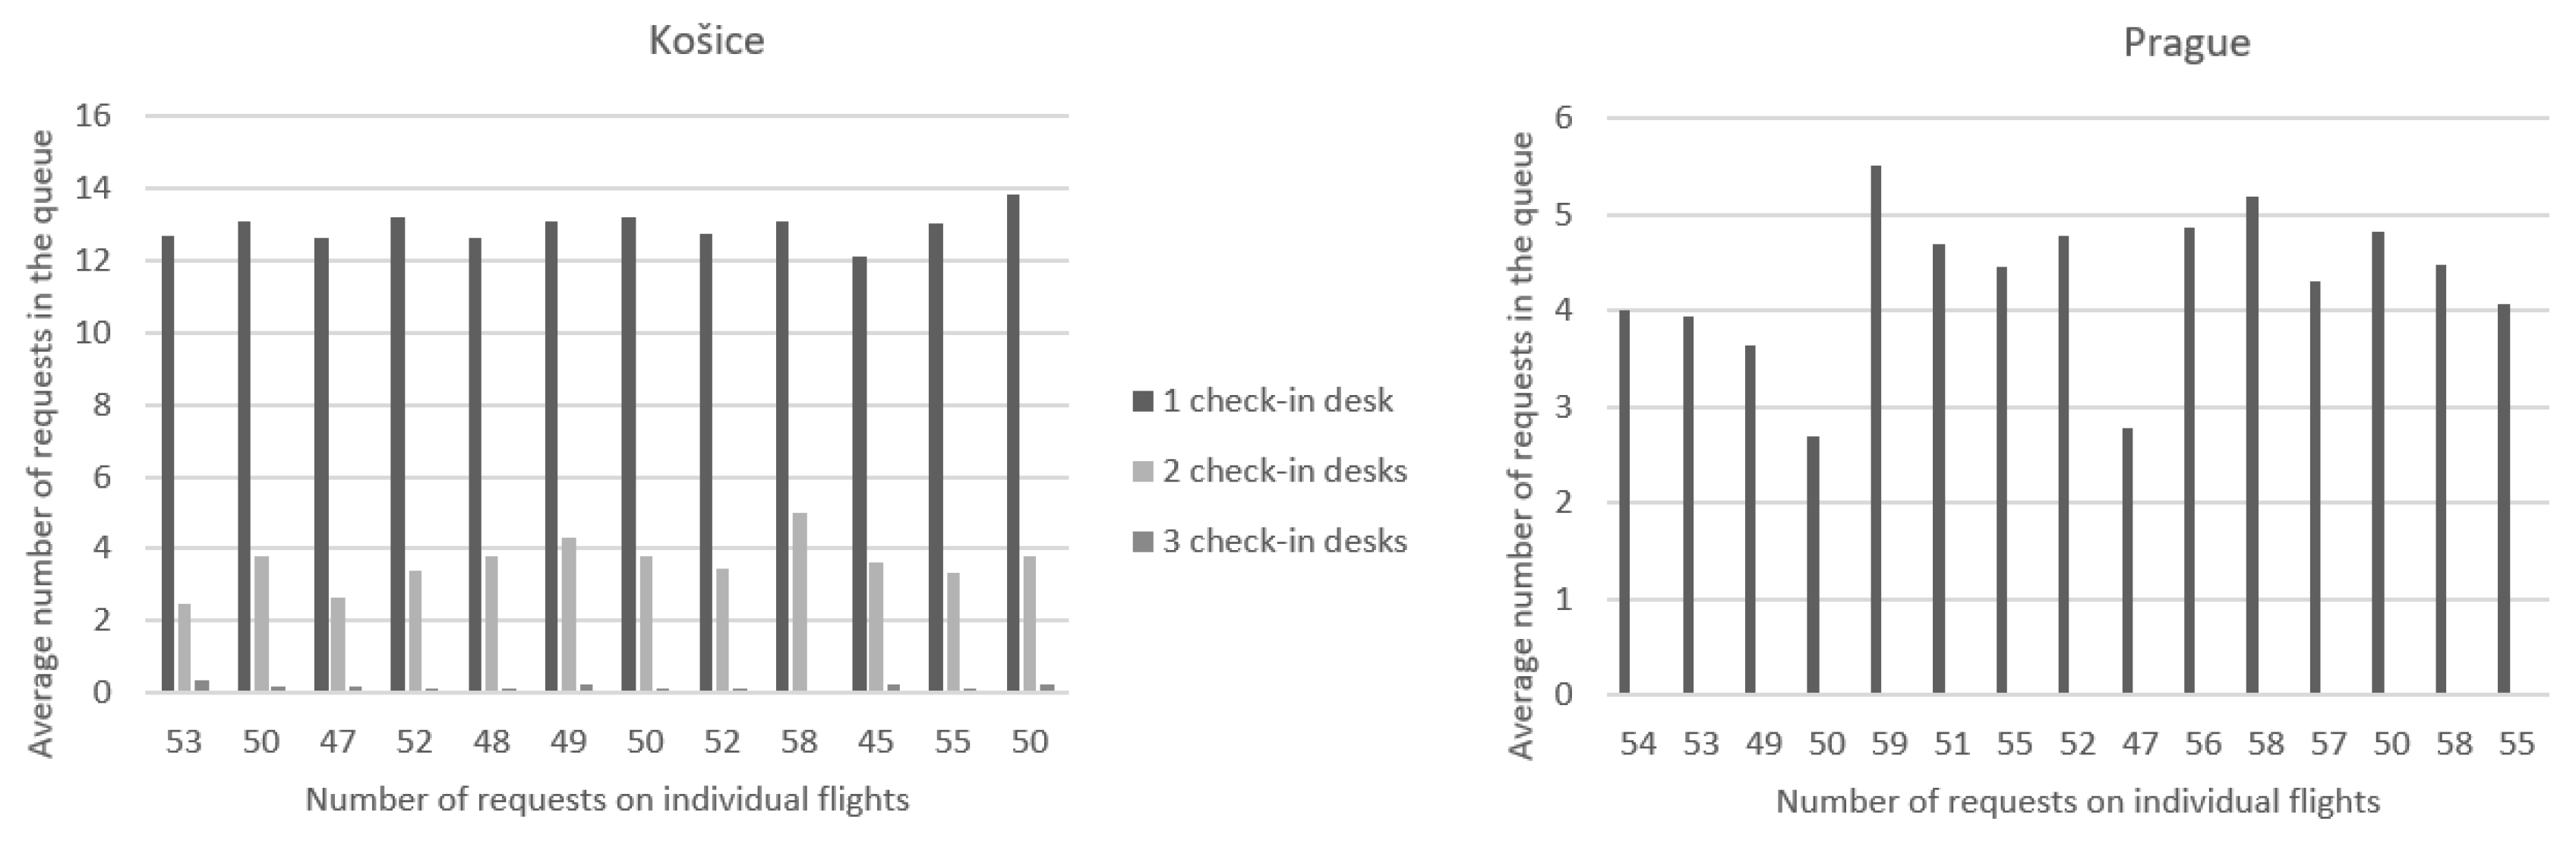
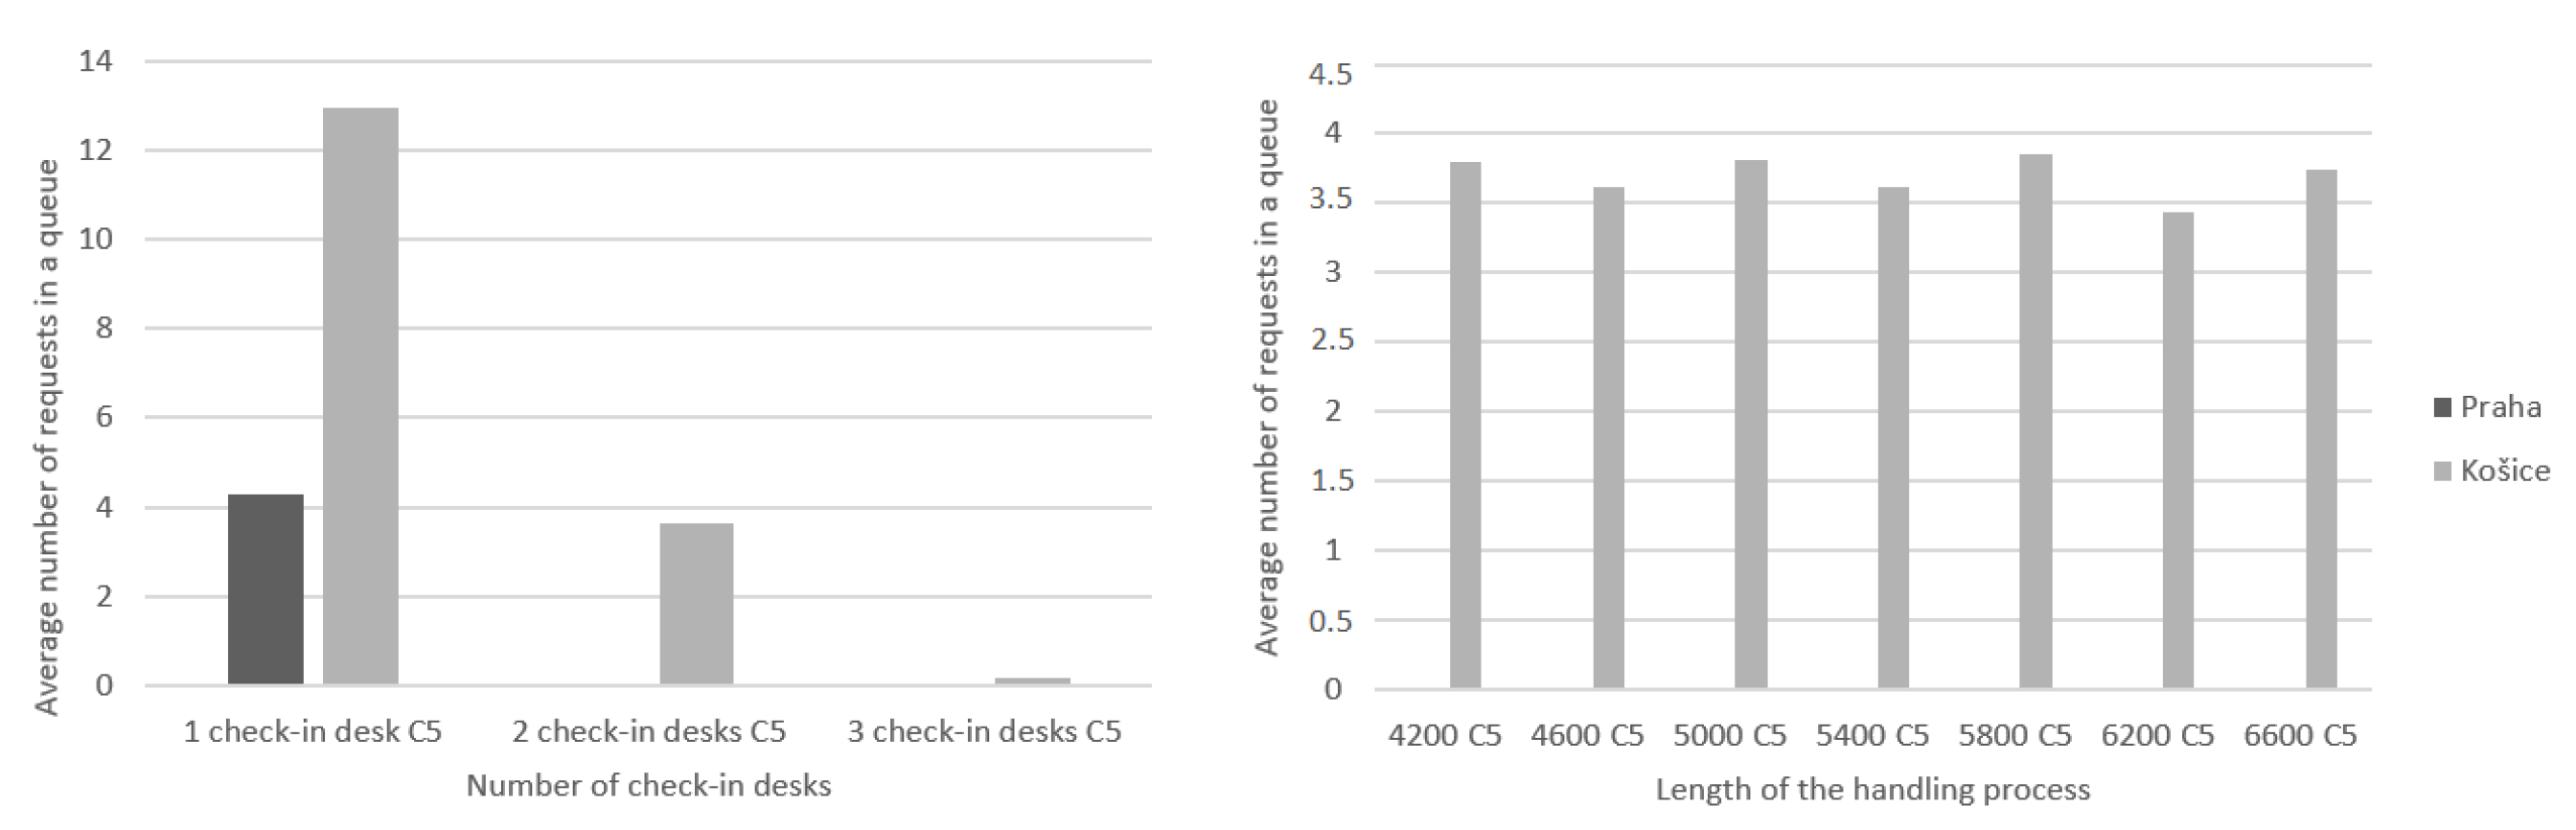
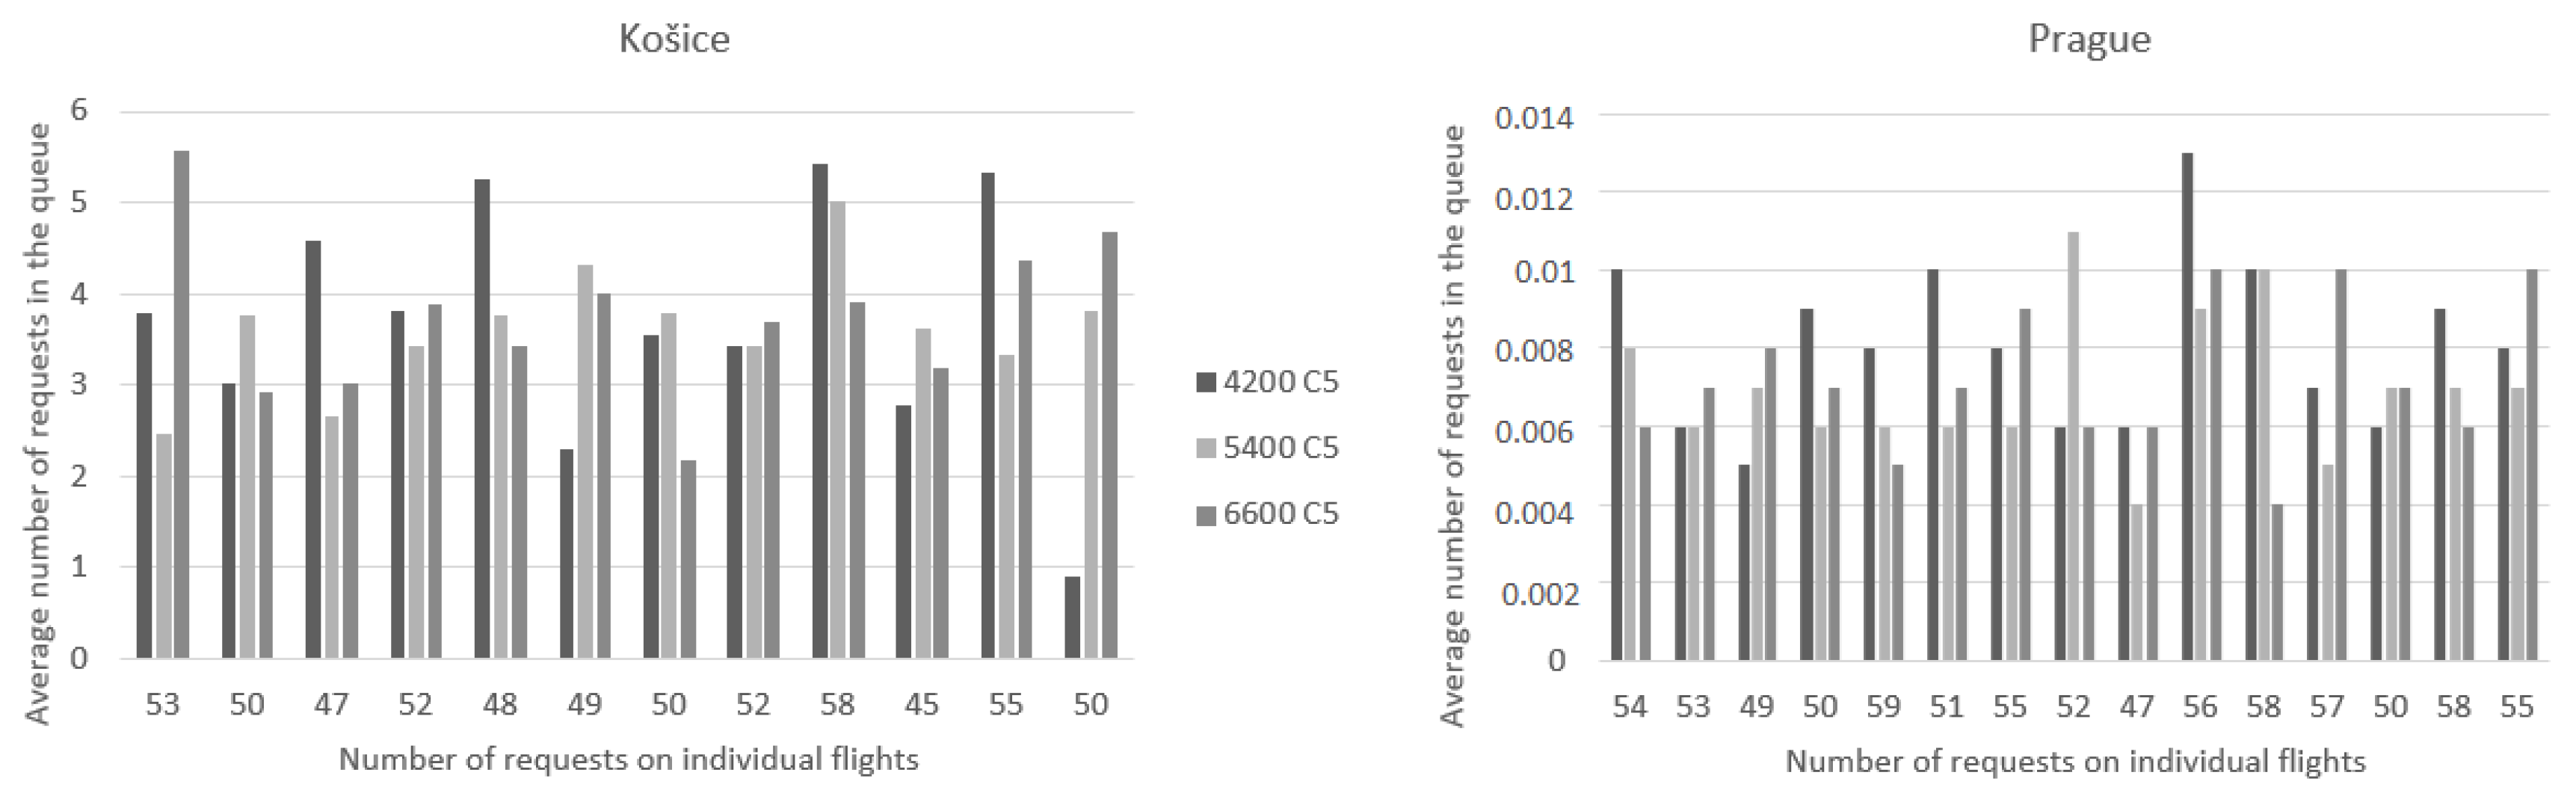
Another criterion that was evaluated is the average number of requests in the queue. This criterion is linked to the number of passengers handled with waiting, without waiting, and the number of pending requests. It was also assessed from two points of view.
The first comparison will take into account the handling process with changing times and a constant number of desks of two. We gradually changed the time to 4200, 5400, and 6600 s. The graph on the left in
Figure 7 presents the results from Košice, and the graph on the right shows flights from Prague. It can be seen that the results correspond to the probability of requests waiting; that is, for flights from Košice, the most requests in the queue occurred at 4200 and 5400 s, although in the case of 6600 s, there were similar results in the simulated cases, in all cases, all requests were handled. In the case of the Prague airport, the average number of requests waiting in the queue did not exceed one request, as the values ranged from 0.004 to 0.013. Here, the connection with
Figure 5 can be seen, where the probability of waiting for handling at the Prague airport is very low.
Figure 8 shows a comparison of the number of requests waiting in the queue when the number of check-in desks is changed. As shown in the previous graphs, in the case of the Košice airport, which is located on the left, it was not possible to handle all the necessary requests at one check-in desk, so in this case, there were also the most requests that had to wait in the queue for processing. With two service desks, the number of requests waiting in the queue ranged from two to five, and in the case of three desks, the number of requests in the queue did not exceed one. For flights from the Prague airport, just like when comparing 5400 and 6600 s, the number of requests waiting to be handled did not even rise to one, and in the case of one desk, the values ranged from two to six.
According to the evaluation of the number of requests in the queue, a possible solution when focusing on the time criteria in Košice is also the lowest selected time of 4200 s, but when looking at the number of desks, the lowest possible number is two desks with a base time of 5400 s. In the case of the Prague airport, it is possible to handle all requests in a suitable time even with one check-in desk with its standard time of 6600 s, or even with the time designated for check-in of 4200 s but with two service desks.
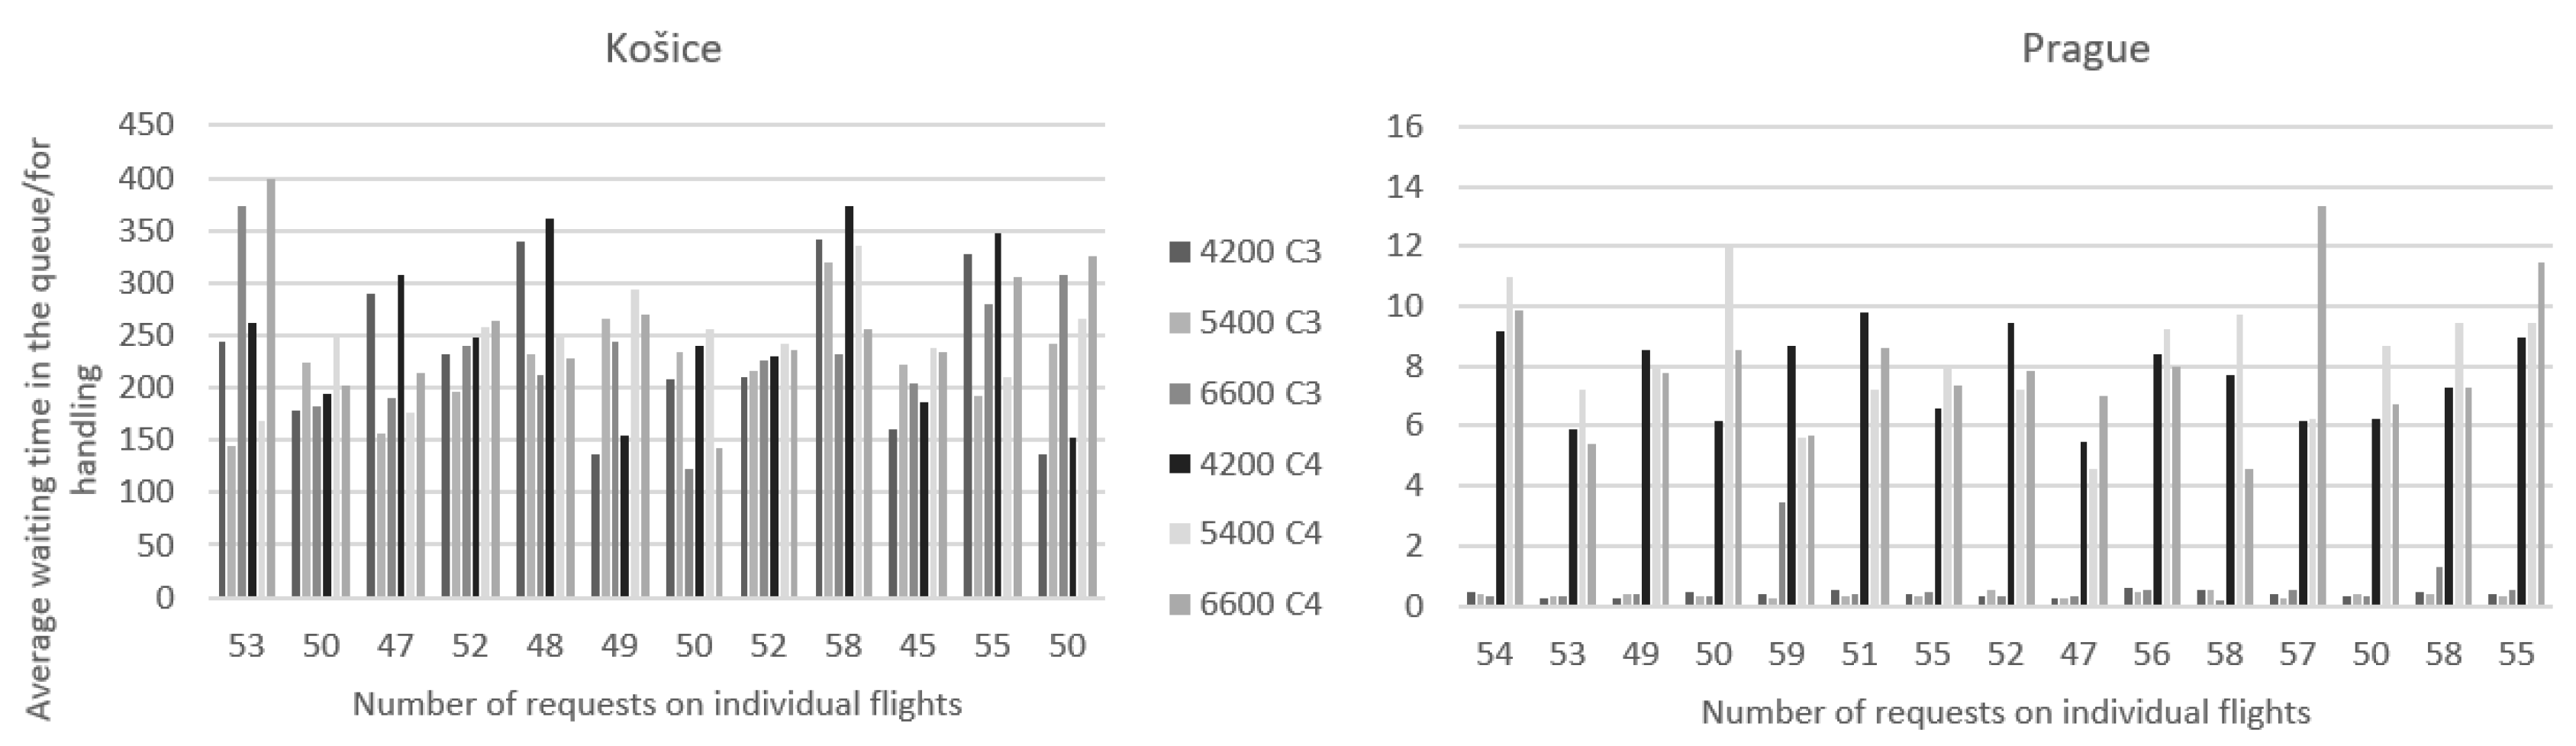
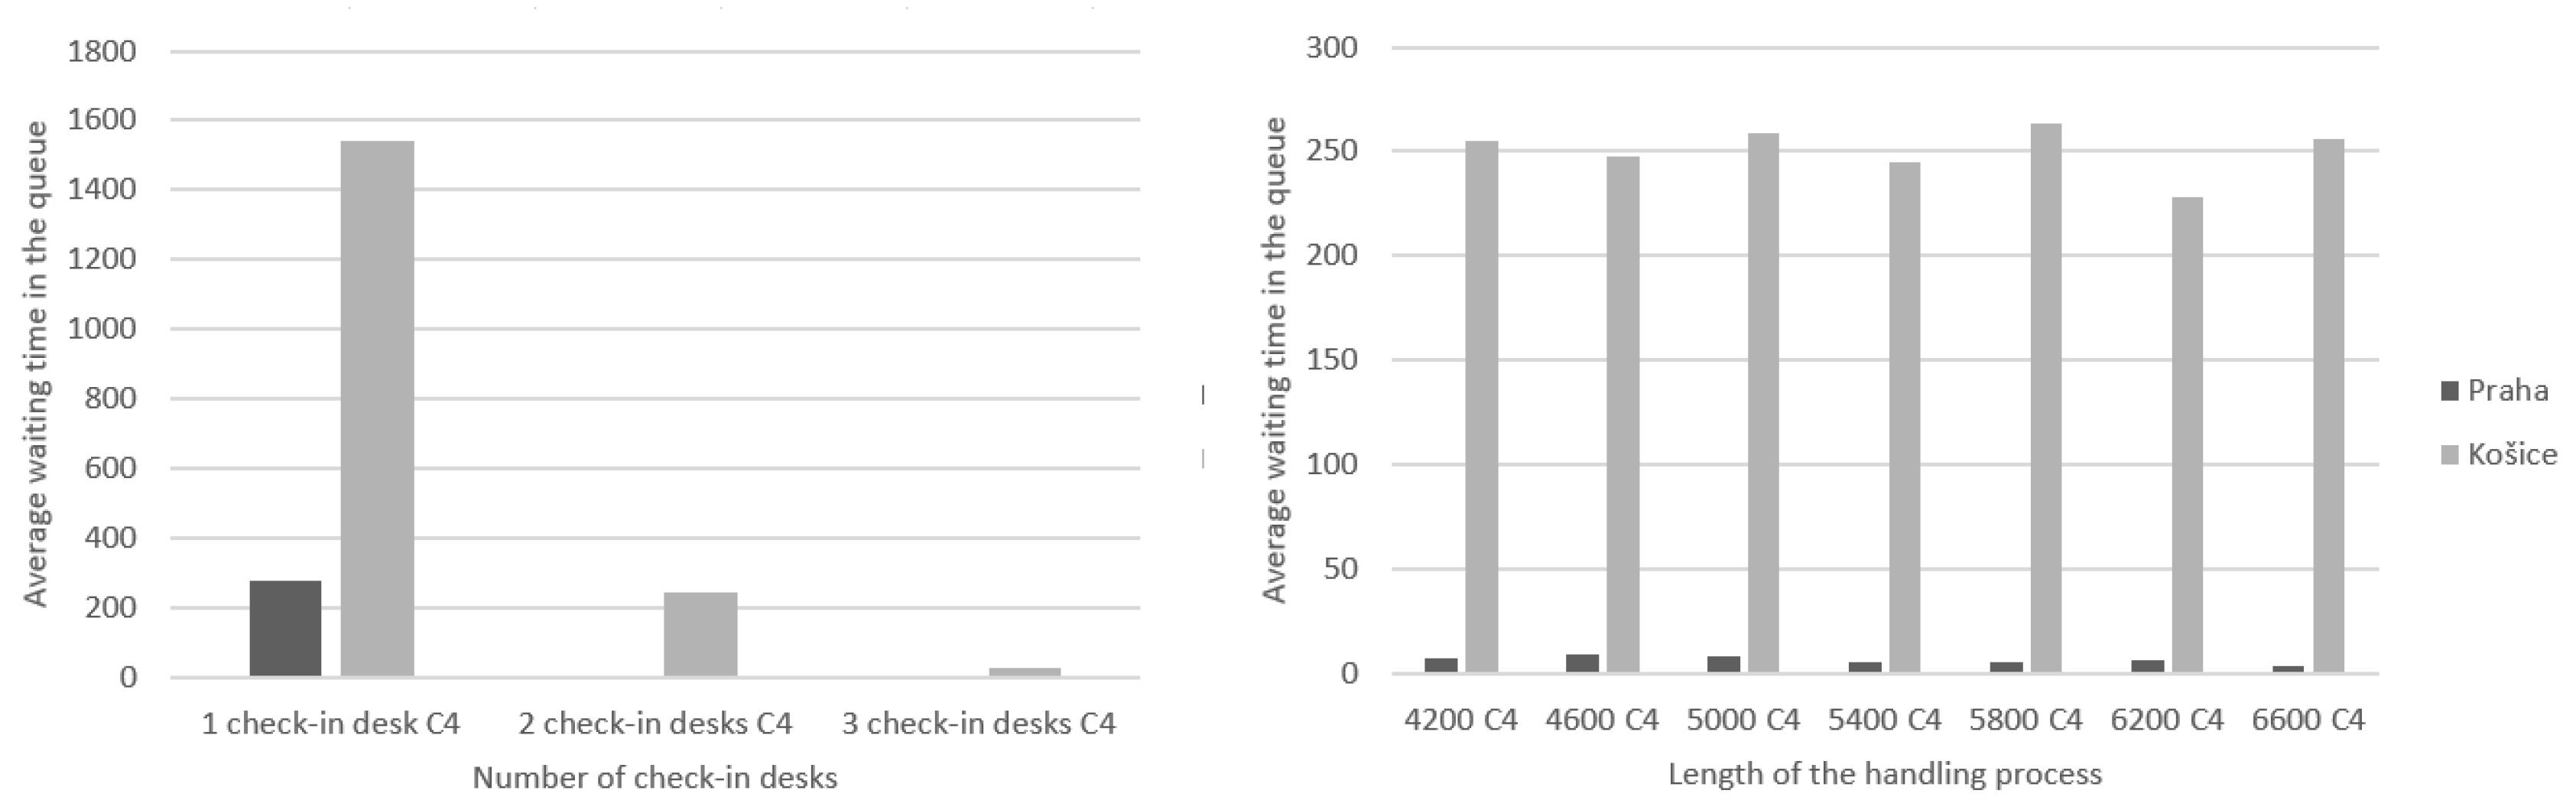
The last criterion we focused on was the average waiting time in the queue/for handling. For the average waiting time of requests in the queue, the total idle time of flight requests was divided only by the number of such requests that have been placed in the waiting queue. In the following graphs, it is possible to see a comparison of these two datasets.
As with the previous criteria, first we compared the last two criteria in terms of the change in handling time. The left side of
Figure 9 is dedicated to Košice airport and the right side to Prague airport. For flights from Košice, all handling times showed approximately the same values of the average waiting time in the queue and for handling. Values for the C3 criterion, which represents the average time spent waiting for handling, ranged from 137 s to 373 s, and in the case of the C4 criterion, which represents the average waiting time in the queue, the times ranged from 142 s to 400. As can be seen, these times are similar.
For Prague flights, the difference between the C3 and C4 criteria is more visible. In the case of criterion C3, i.e., waiting for handling, the values ranged from 0.25 s to 1.29 s. With the C4 criterion, waiting for requests in the queue, the times are from 5 to 15 s. There are small differences between criteria C3 and C4 concerning the Prague airport, but compared to the Košice airport, these times are significantly lower. Since all requirements were met under all conditions, we can also choose the lowest processing time of 4200 s at two check-in desks for both Košice and Prague as the most suitable. However, at the airport in Košice, the time of 4200 s is unsuitable for passengers due to the long waiting times, so a longer one is a more suitable time designated for handling. In the following two graphs, which are shown in
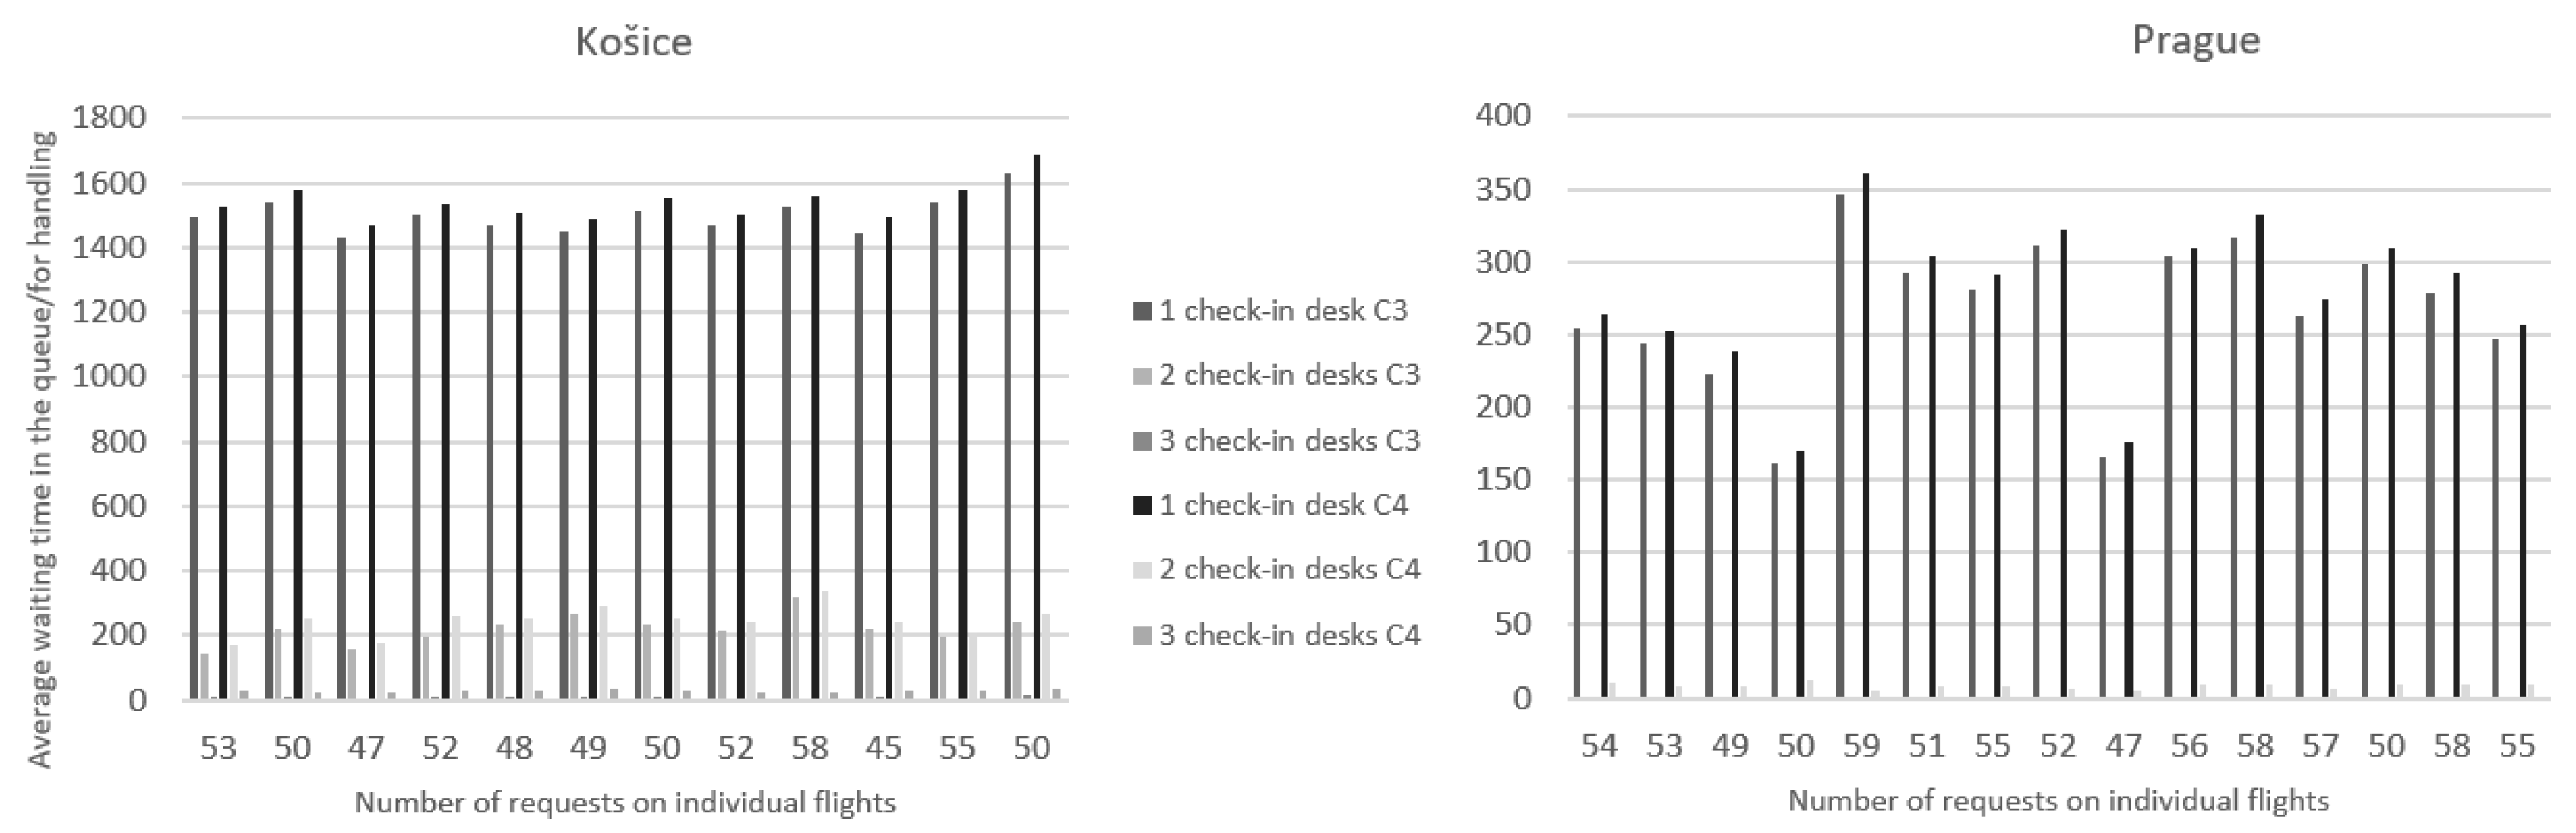
Figure 10, the behavior of criteria C3 and C4 will be compared when the number of handling desks is changed. These graphs will be the last efficiency criteria described in this paper.
The criteria for Košice airport are shown on the left and for Prague airport on the right. High values for both criteria at one check-in desk were identified at the Košice airport because most of the requests had to wait for their handling, and also a few of them were not even handled. As mentioned above, this criterion is closely related to the previous one, when the total downtime of requests was taken into account; therefore, the results are similar to the previous graphs. The times at the two desks at the Košice airport ranged from 144 to 320 s for the C3 criterion, and for the C4 criterion, it was from 4 to 14 s per request.
The situation at Prague airport is also similar to the previous graphs when the highest values were shown by criteria C3 and C4 at one service desk. Here, the times ranged from 160 s to 310, and for the C4 criterion from 170 to 360. The data obtained at the Prague airport with one desk are almost in the same range as at the Košice airport with the operation of two desks. At the two service desks in Prague, the values of the C3 criteria did not exceed a second, and for the C4 criterion, they ranged from 4 to 12 s. In the last case, when three service desks were in operation, both criteria had values of zero, because all requests were handled without any waiting.
With the above graphs, it is possible to see a comparison of the results for individual flights from both airports. To better illustrate the impact of changing the number of check-in desks or the length of check-in time on efficiency criteria, the simulation results were evaluated from a more general point of view. In the same way, as with the previous graphs, the individual criteria were gradually evaluated.
In this comparison, it is possible to see the effect of changing the parameters on the criteria. In these cases, the average number of passengers per week at each airport was calculated, i.e., in the case of Košice airport, it was 51 passengers per flight and at Prague airport, it was 54 passengers per flight. In this comparison, we took into account the handling process times from 4200 to 6600 s, adding 400 s. For the other basic parameters and when changing the desks, we counted on one, two, and three desks.
From
Figure 11, it was found that a change in the number of check-in desks has a more significant effect on the number of completed requests than a change in the length of the handling time. For both airports, there are the opposite values of processed requests with waiting and processed requests without waiting. In the case of the Košice airport, there are also pending requests when only one desk was in use.
Moreover, for the first criterion, which is shown in
Figure 12, the impact of the change in the number of desks is much more pronounced, because with one check-in desk, most passengers have to wait for service at both airports. In the case of Košice, the impact of the change of desks is somewhat smaller, because at two desks, the majority still have to wait, and at three desks, the probability of waiting for handling is significantly reduced. In Prague, with two functioning desks, the probability of waiting is almost zero. In the second case, when the handling time was changed, the effect on the probability is significantly smaller, because in all cases, it varies in the same values at both airports.
Another efficiency criterion, concerned with the average waiting time of requests in the handling queue, is also based on the second criterion. In this case, the values are recalculated only for requests that were waiting to be handled, and not for all that had to be handled. In this case, it was possible to combine the comparison again into only two graphs, which can be found in
Figure 13.
As can be seen, the graphs in
Figure 13 are similar to the previous two criteria. A change in the number of desks still has a more significant impact on the time passengers have to spend waiting for handling than a change in the length of the check-in process.
The last criterion, concerned with the number of requests in the service queue, is shown in
Figure 14. It also applies here that the change in the number of desks has a more significant impact. At the Prague airport, there were significantly fewer requests waiting for handling in all simulated cases than in Košice. More requests occurred only in the case when one check-in desk was working; in other conditions, the value hovered around zero. In Košice, such a case occurred only once, when three check-in desks were working; in other cases, most requests had to wait to be handled.
5. Conclusions
One of the main objectives of airports and airlines is to maximize profit while minimizing costs. From this point of view, we would still choose those options where it is possible to meet all requirements even at the expense of long waiting times for passengers to be handled. However, airlines must also look at the interests of their passengers, who are less and less willing to wait in long lines for handling and want to arrive at the airport just before departure and get ready very quickly. Therefore, it is not advisable to choose the shortest possible check-in times or the fewest possible desks, because if the passenger has a bad experience with some part of his/her flight, he/she may no longer choose this particular airline for the next flight. In addition to the satisfaction of passengers, so that they do not have to wait long in queues for handling, it is also important to take into account the interests of airlines and airports, which would have high costs for desk downtime. Therefore, it is necessary to find a compromise between these requirements. From the results of the simulations, we found that the change in the number of desks affected the speed of processing requests significantly more than the change in the handling time. From this, it can be said that the number of check-in desks is a critical part of the check-in process. As we could see, the biggest waiting time for passengers occurred at one functional check-in desk. When the check-in time was changed, big changes did not occur, because there was still more time for service since each of those functional desks checked in passengers during the check-in time. The differences in the speed of handling processes were caused by the different minimum/maximum times needed to handle one passenger at the airports. There are innumerable combinations of how to select the right number of parallel check-in desks or decide on the best times in passenger handling processes at check-in desks because it is possible to focus either on handling speed or on revenues, costs, and many other factors. However, the most appropriate way is to look for a compromise between all the criteria, so that all interested parties are as satisfied as possible. However, in general, from the information collected, we propose a procedure for modeling the best strategy, which starts by collecting all the necessary information about the flights that require optimization, or similar to them, from which information could also be used for the flights we are targeting. We then processed and sorted the obtained information so that they are comparable to each other, and so that we can use them to create a simulation model that corresponds to reality to the widest possible extent. After creating the simulation model, we simulated different conditions that can occur and thus investigated how they affect the handling process. From the results of our simulation, we recommend first choosing the number of check-in desks that will be opened, with the most realistic handling time, which, according to estimates, could be sufficient to handle all the requests that may come into the system. The choice of the number of desks can be justified first by the fact that, as could be seen from the performed simulations, the number of desks had a greater influence on the speed of the handling process. After we choose the most suitable number of desks in simulations, we find that it is possible to handle all requests with that number even with a certain time reserve. We can fine-tune the best solutions by creating simulations when changing the length of the handling process, which makes it possible to identify the best strategies for the handling process of passengers at check-in desks.
However, when creating the best solution, other conditions must also be taken into account. In our simulations, we focused primarily on the time passengers spent waiting for handling, but it is also important to take into account the economic parameters of airports or air carriers. Therefore, at some airports, for example, more flights are processed at the same check-in desks, which means more check-in desks are open, but they also have to process a larger number of requests. In the simulations, only the waiting times spent at the check-in desk were taken into account, and not all other checks and security checks, which may differ slightly at each airport and also for individual flights, for example, those within the Schengen area and those outside of it. Other factors that affect the speed of check-in are, for example, the fact that some passengers check in at home before arriving at the airport, or that self-service check-in desks already operate at some airports. Future work in this area will be focused on assessing the economic parameters of the passenger handling process as part of the overall optimization focused on increasing the efficiency of airport operations employing queueing systems modeling and simulation using available software.


