
Total Usual Nutrient Intakes and Nutritional Status of United Arab Emirates Children (4 Years–12.9 Years): Findings from the Kids Nutrition and Health Survey (KNHS) 2021

 , , ,
, , , 
 ,
,  ,
,  ,
,  ,
,
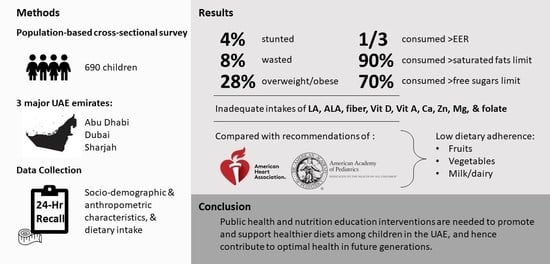
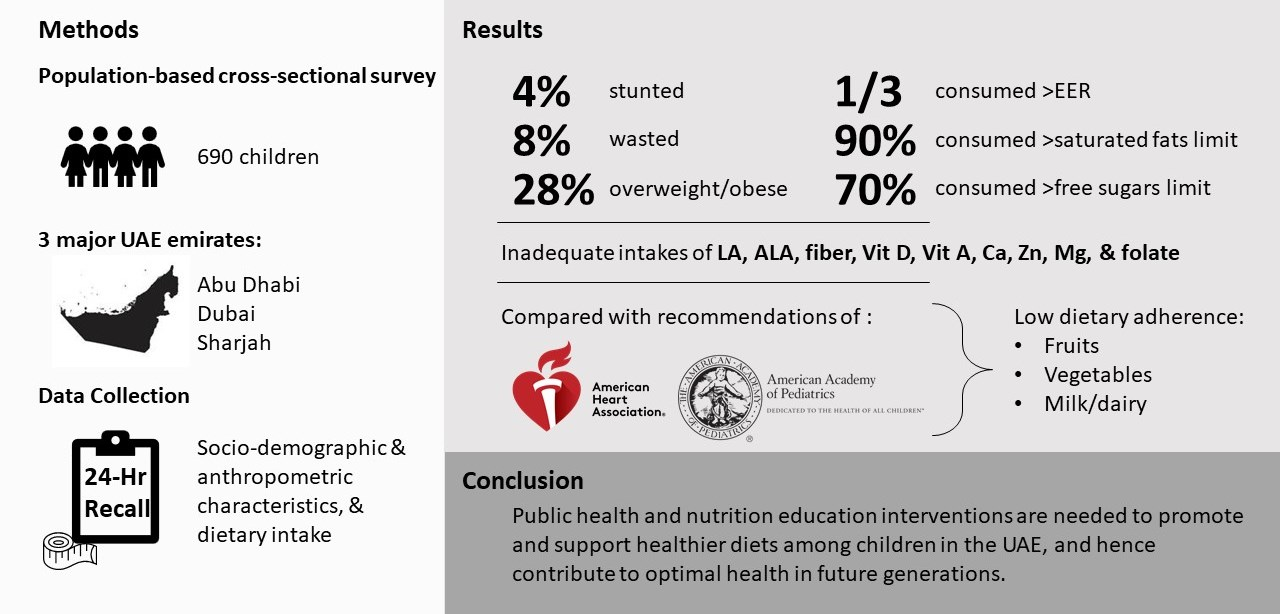
Abstract
1. Introduction
2. Materials and Methods
2.1. Study Design
2.2. Study Population
2.3. Data Collection
2.4. Anthropometric Assessment
2.5. Dietary Intake Assessment
2.6. Data Analysis
3. Results
3.1. Household and Sociodemographic Characteristics
3.2. Anthropometric Characteristics
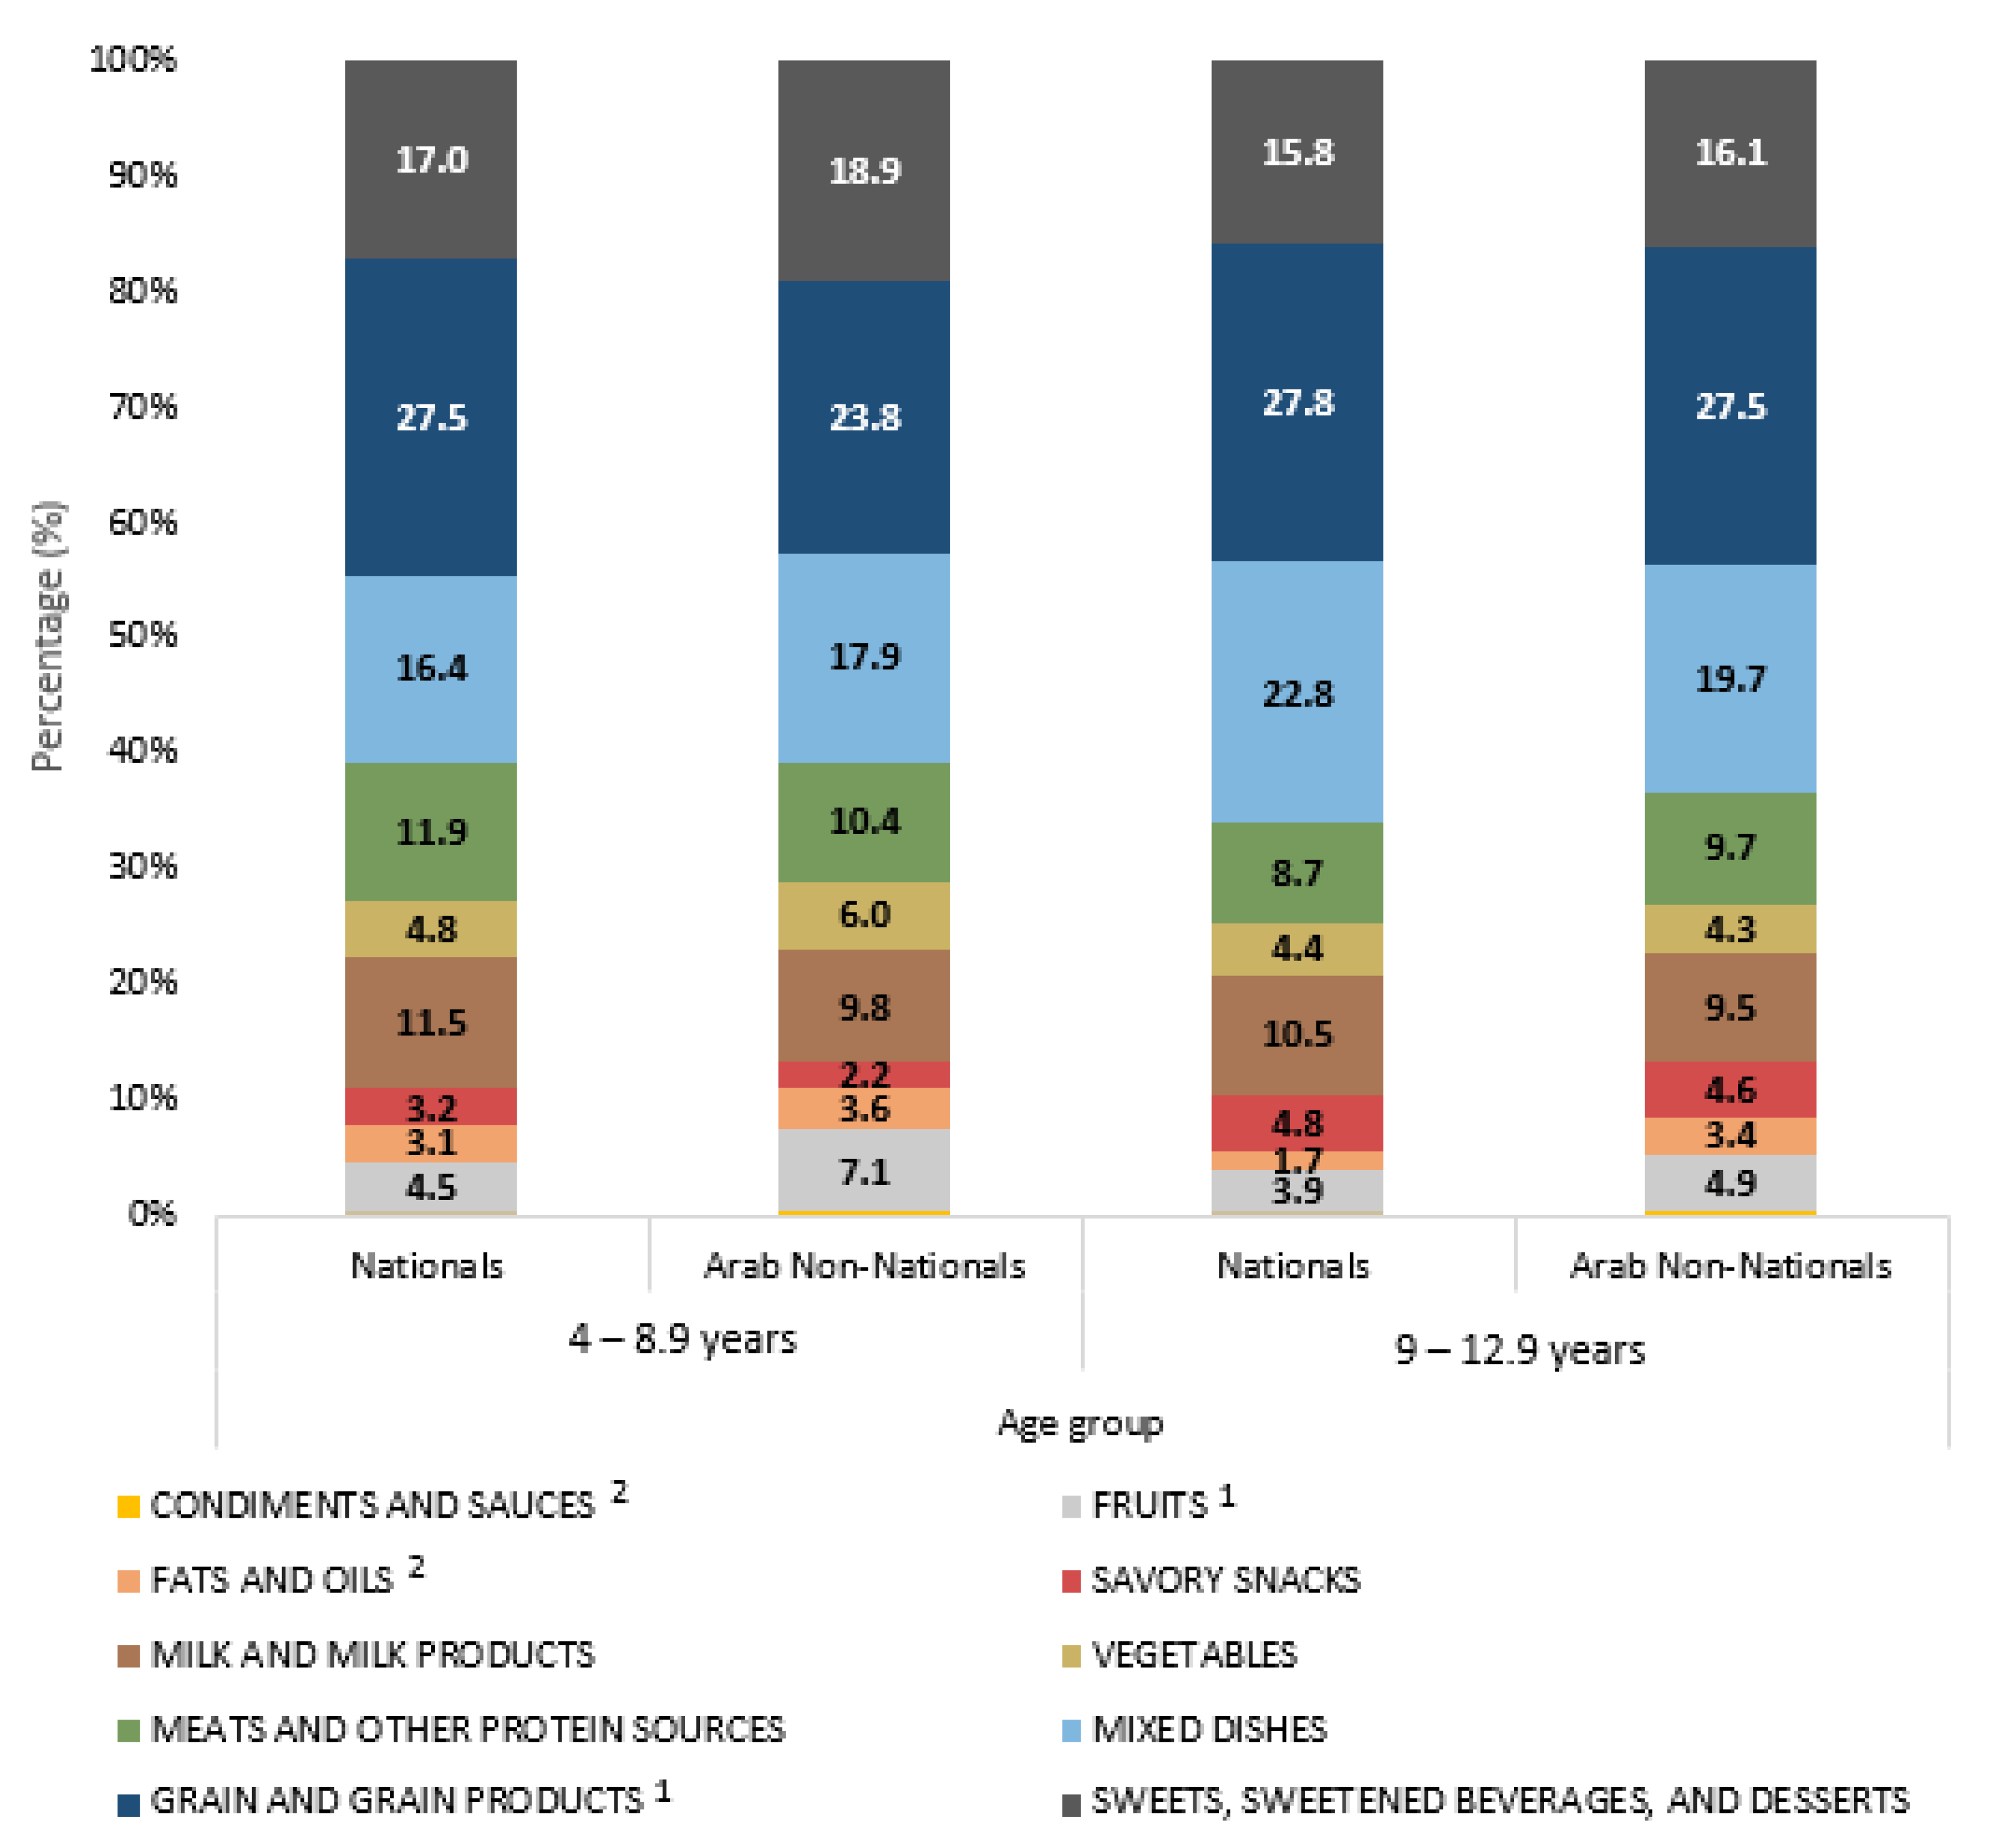
3.3. Food Consumption Patterns
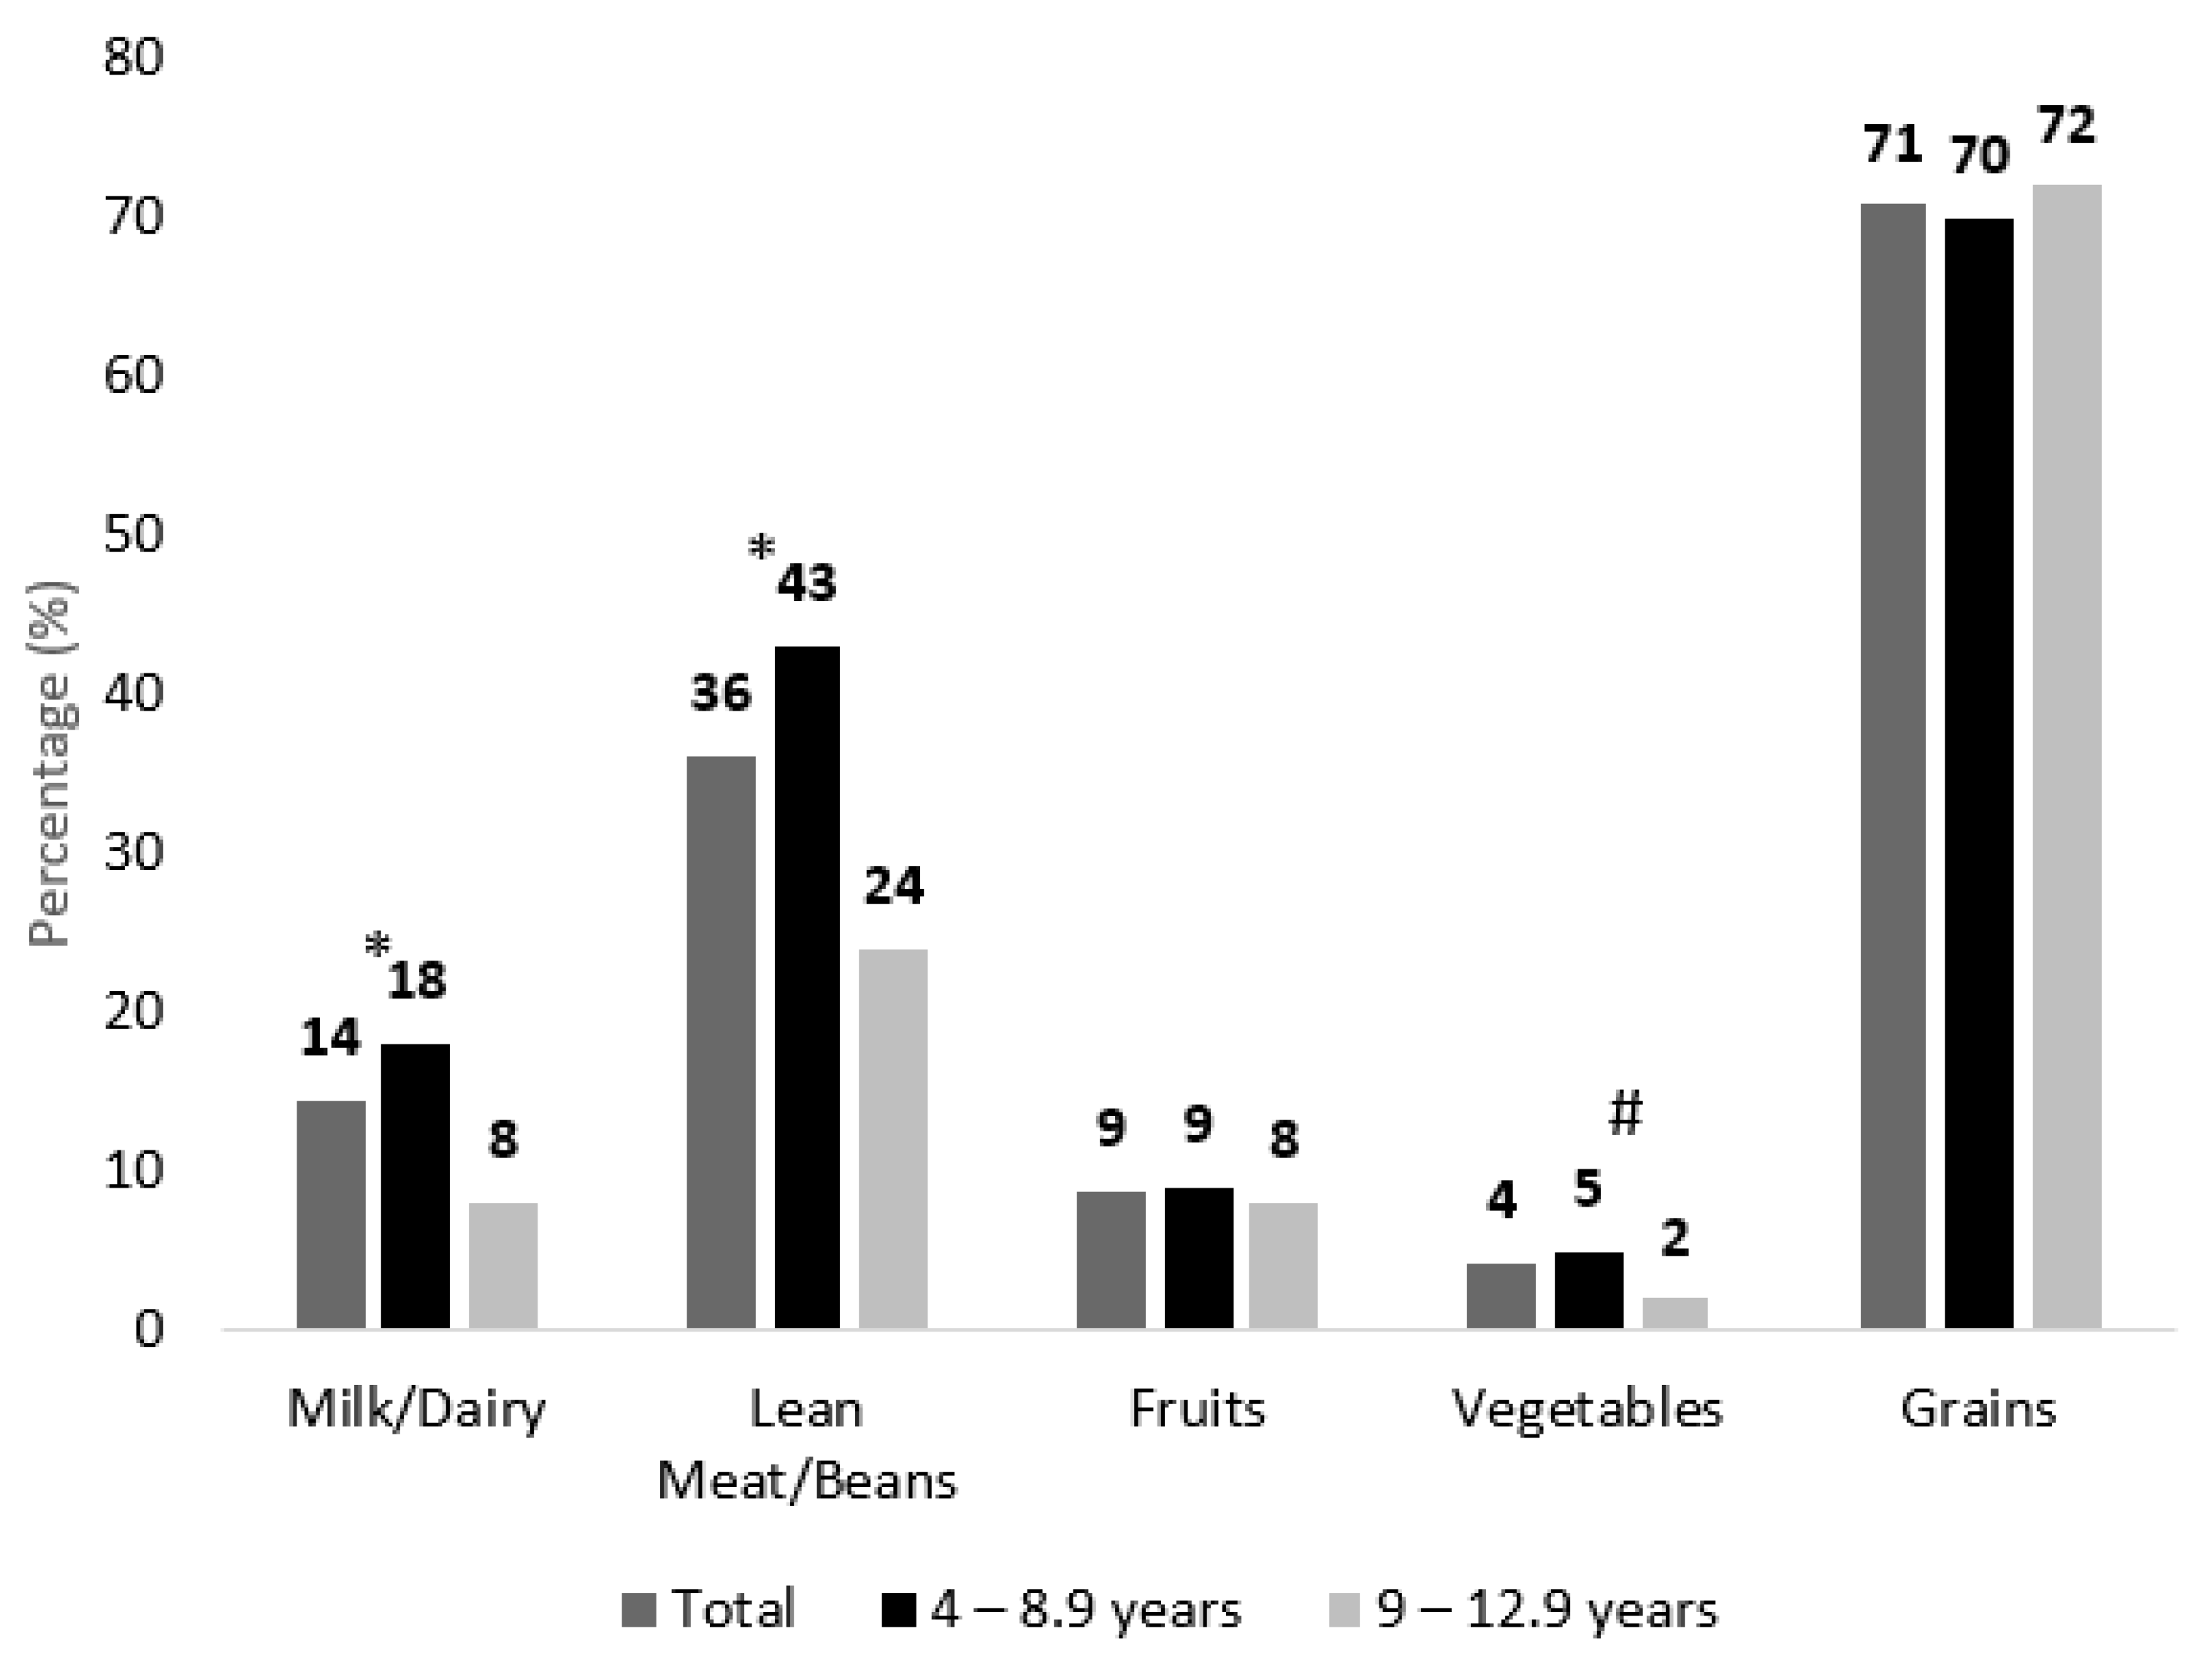
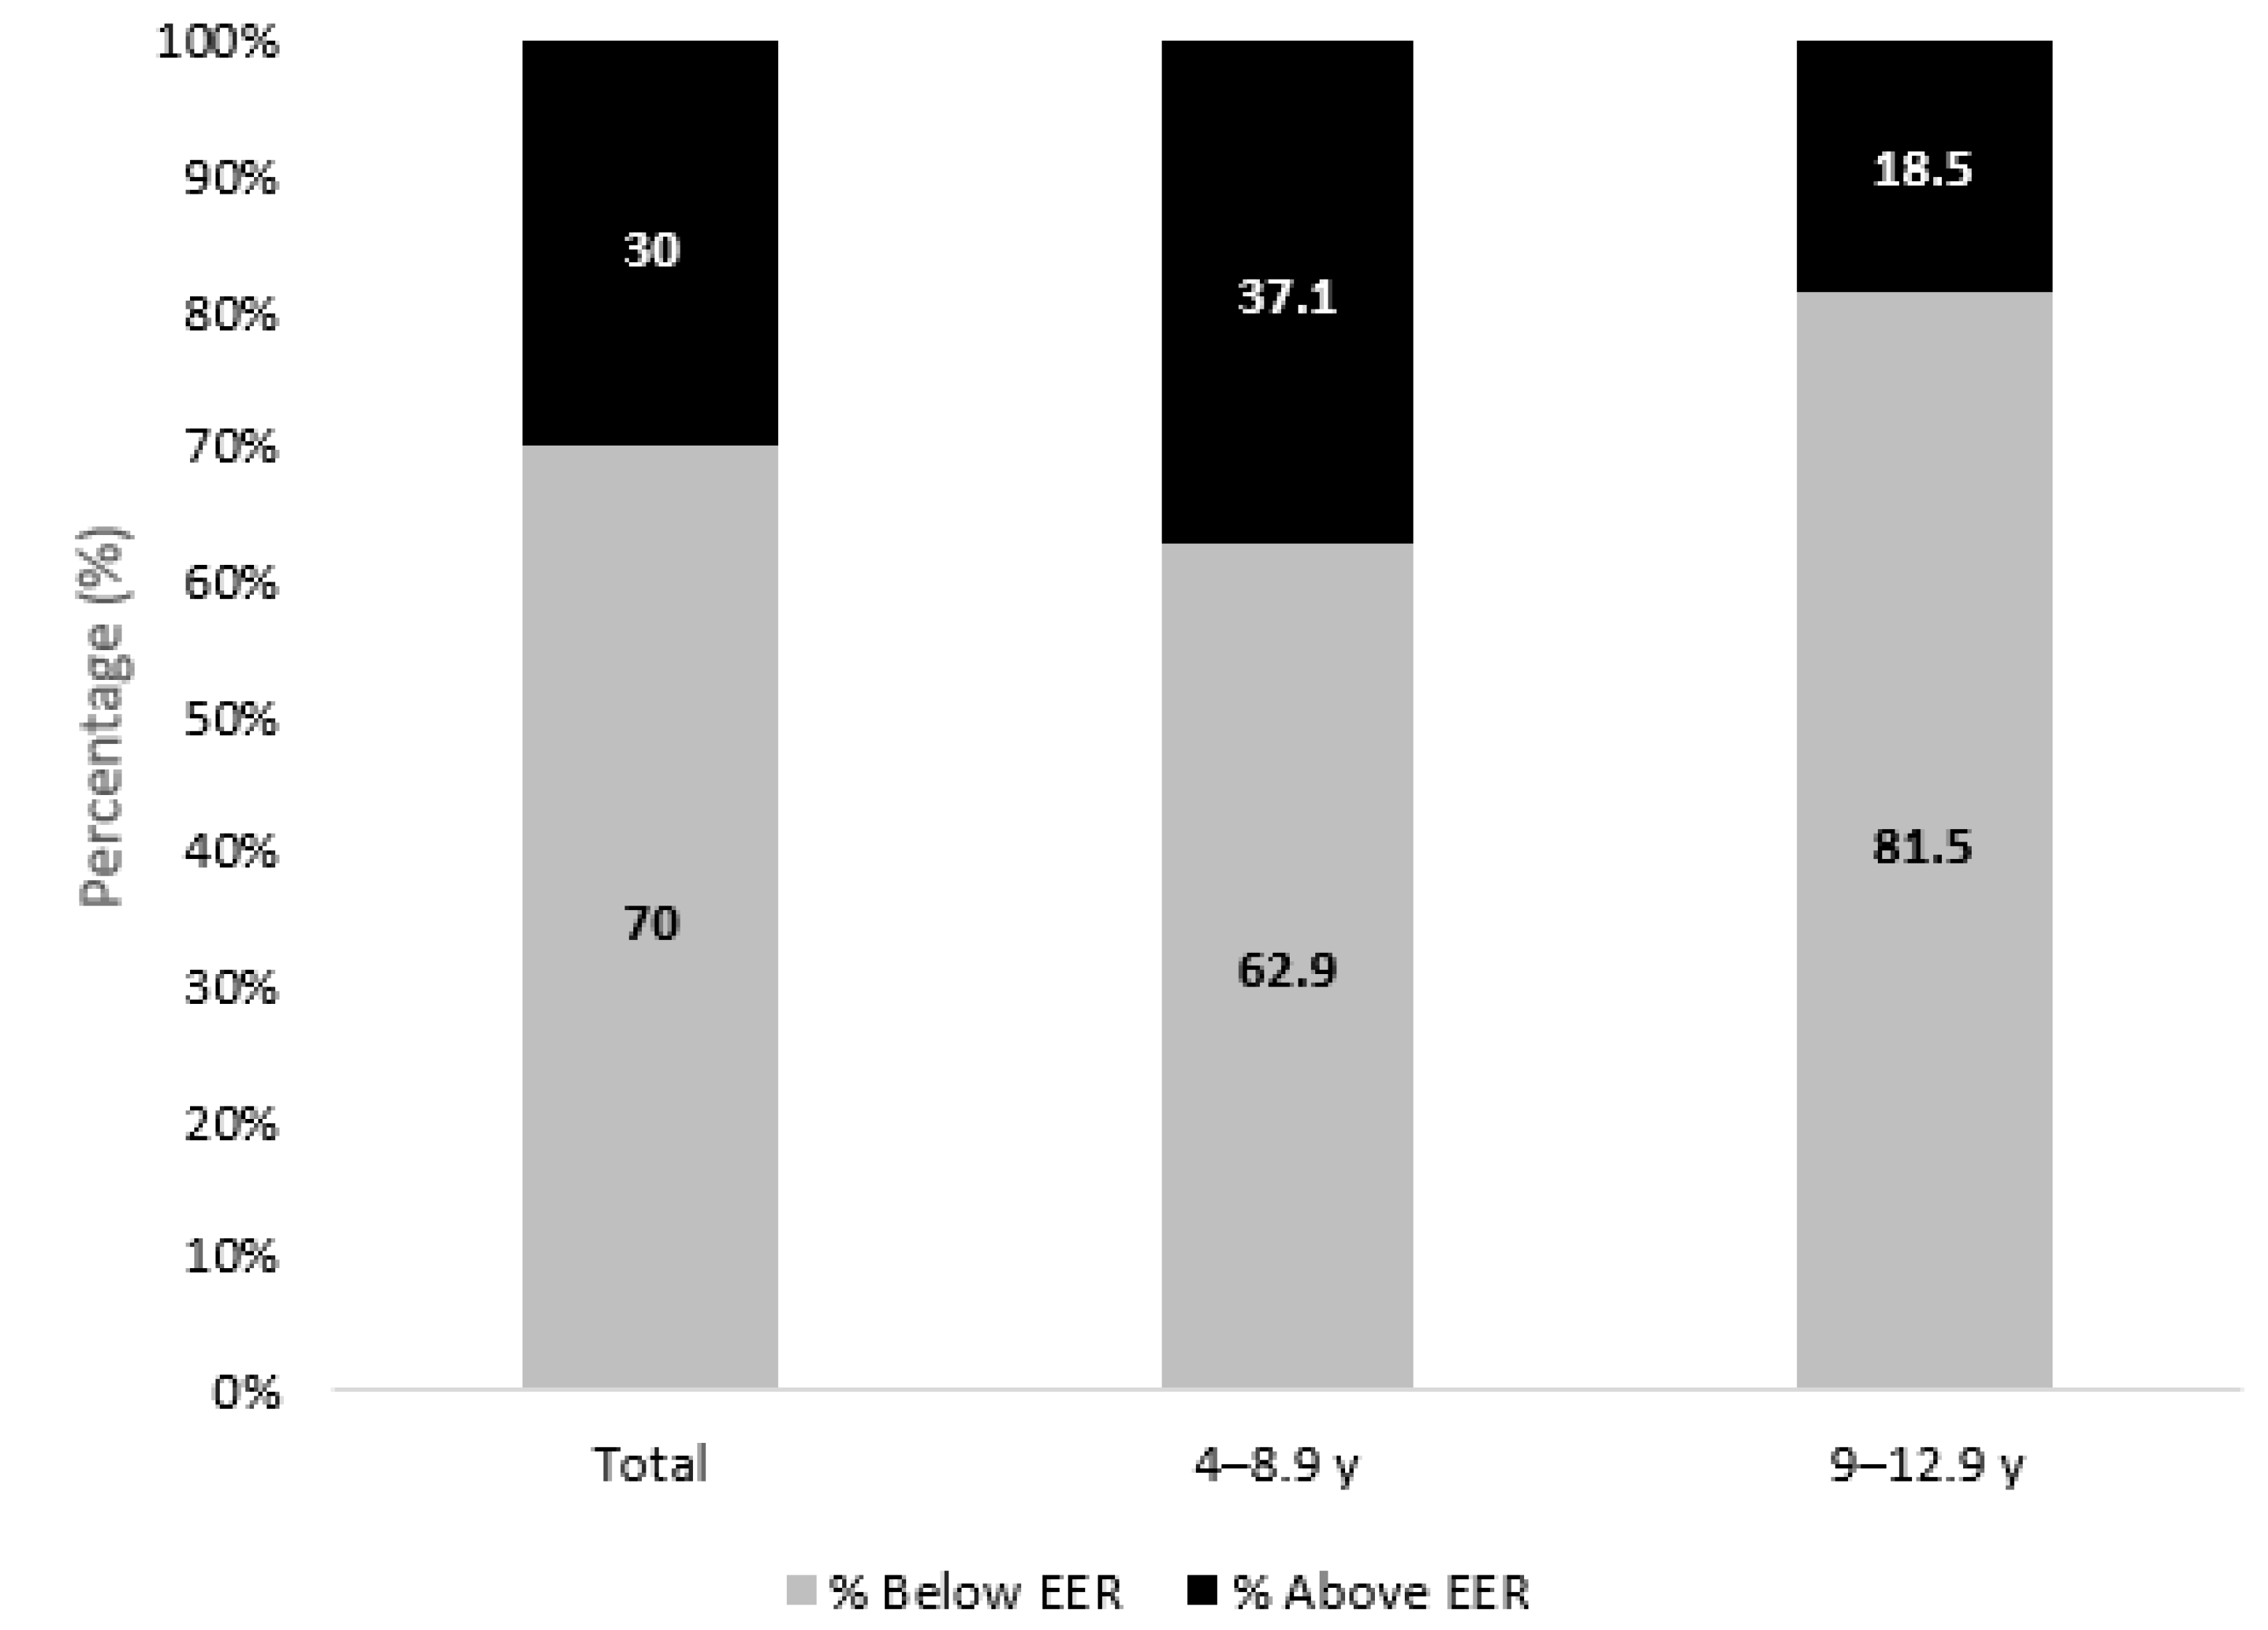
3.4. Adherence to Dietary Recommendations
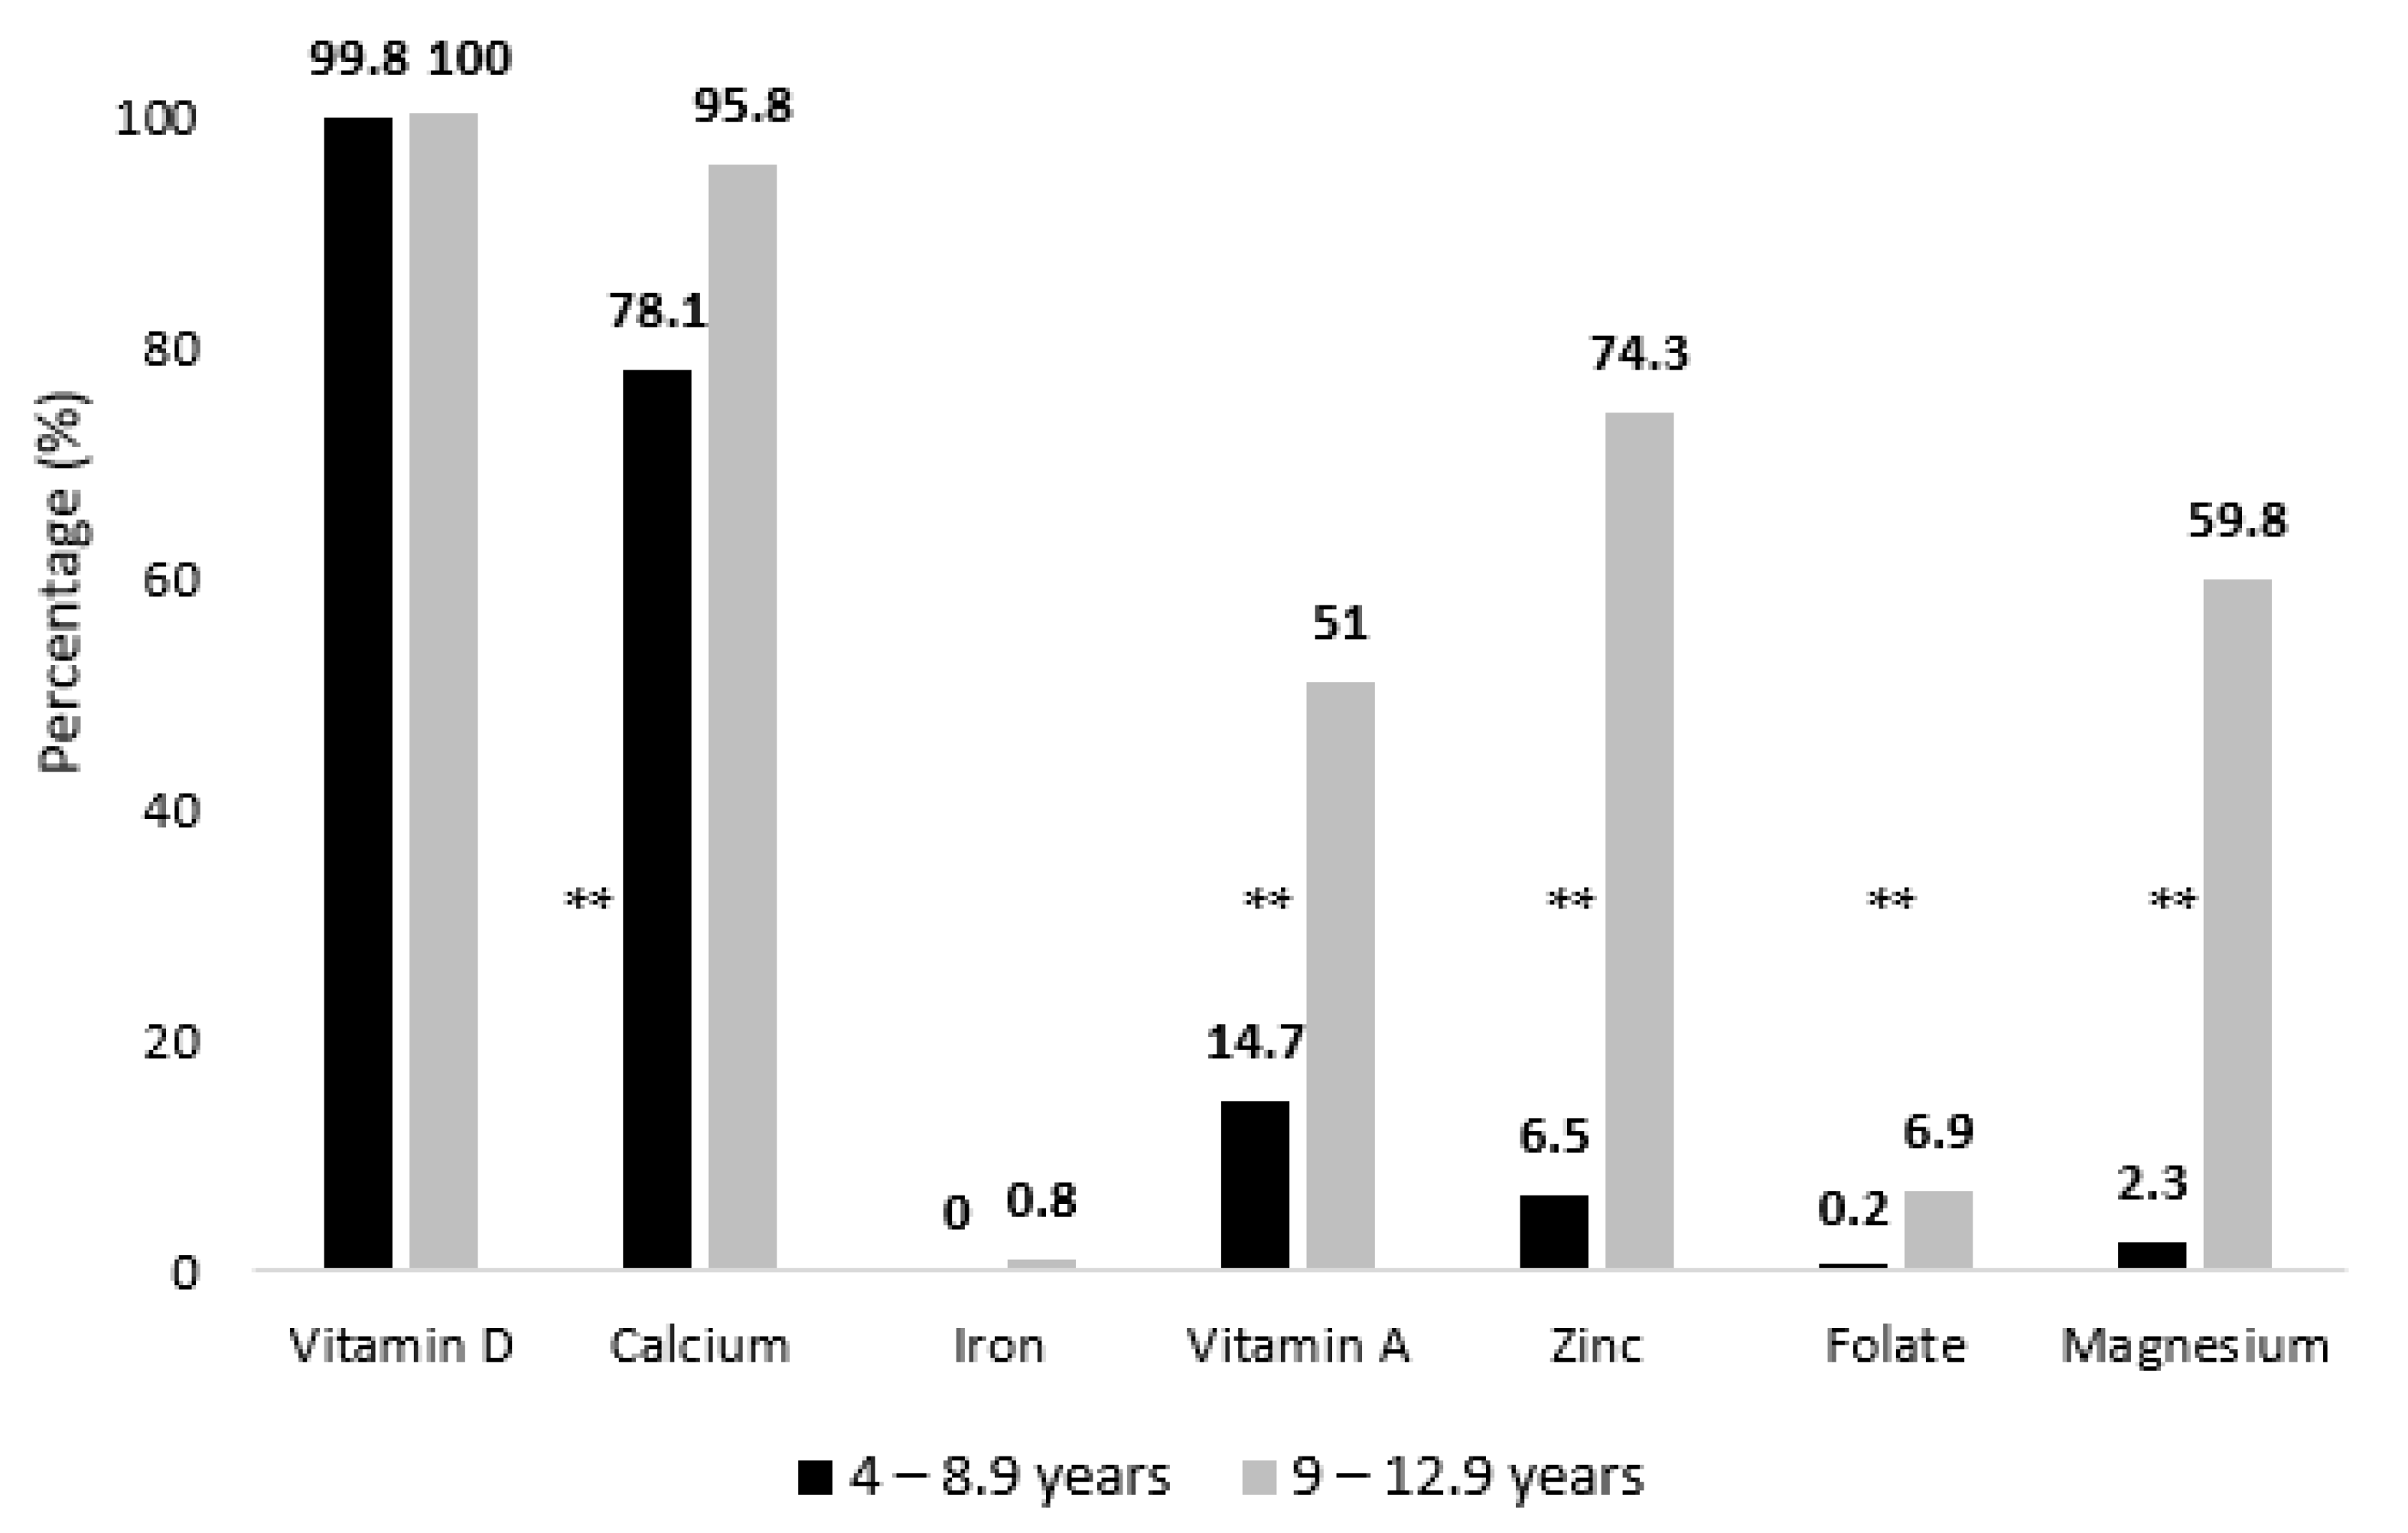
3.5. Energy, Macro- and Micronutrient Intakes
4. Discussion
5. Conclusions
Supplementary Materials
Author Contributions
Funding
Institutional Review Board Statement
Informed Consent Statement
Data Availability Statement
Acknowledgments
Conflicts of Interest
References
- United Nations International Children’s Emergency Fund (UNICEF). Early Childhood Nutrition: Preventing Malnutrition in Infants and Young Children. Available online: https://www.unicef.org/nutrition/early-childhood-nutrition (accessed on 27 December 2021).
- United States Department of Agriculture (USDA). Dietary Guidelines for Americans, 2020–2025. Available online: https://www.dietaryguidelines.gov/sites/default/files/2021-03/Dietary_Guidelines_for_Americans-2020-2025.pdf (accessed on 27 December 2021).
- Prado, E.L.; Dewey, K.G. Nutrition and brain development in early life. Nutr. Rev. 2014, 72, 267–284. [Google Scholar] [CrossRef] [PubMed]
- Deshmukh-Taskar, P.; Nicklas, T.A.; Morales, M.; Yang, S.J.; Zakeri, I.; Berenson, G.S. Tracking of overweight status from childhood to young adulthood: The Bogalusa Heart Study. Eur. J. Clin. Nutr. 2006, 60, 48–57. [Google Scholar] [CrossRef] [PubMed]
- Heidari-Beni, M. Early Life Nutrition and Non Communicable Disease. Adv. Exp. Med. Biol. 2019, 1121, 33–40. [Google Scholar] [CrossRef]
- World Cancer Research Fund International (WCRF). The Link between Food, Nutrition, Diet and Non-Communicable Diseases. Available online: https://www.wcrf.org/wp-content/uploads/2021/07/WCRF-NCD-A4-WEB.pdf (accessed on 27 December 2021).
- Musaiger, A.O.; Al-Hazzaa, H.M. Prevalence and risk factors associated with nutrition-related noncommunicable diseases in the Eastern Mediterranean region. Int. J. Gen. Med. 2012, 5, 199. [Google Scholar] [CrossRef] [PubMed]
- United Nations International Children’s Emergency Fund (UNICEF). Programme Guidance for Early Life Prevention of Non-Communicable Diseases. Available online: https://www.unicef.org/media/61431/file (accessed on 18 January 2022).
- Kaneda, T.; El-Saharty, S. Curbing the Noncommunicable Disease Epidemic in the Middle East and North Africa: Prevention among Young People Is Key. Available online: https://www.prb.org/wp-content/uploads/2017/12/NCDs_MENA_Report.pdf (accessed on 28 January 2022).
- Bigna, J.J.; Noubiap, J.J. The rising burden of non-communicable diseases in sub-Saharan Africa. Lancet Glob. Health 2019, 7, e1295–e1296. [Google Scholar] [CrossRef]
- Food and Agriculture Organization (FAO); International Fund for Agricultural Development (IFAD); United Nations Children’s Fund (UNICEF); World Food Programme (WFP); World Health Organization (WHO); Economic and Social Commission for Western Asia (ESCWA). Regional Overview of Food Security and Nutrition in the Near East and North Africa 2020—Enhancing Resilience of Food Systems in the Arab States. Available online: https://www.fao.org/3/cb4902en/cb4902en.pdf (accessed on 10 January 2022).
- Naja, F.; Hwalla, N.; El Zouhbi, A.; Abbas, N.; Chamieh, M.C.; Nasreddine, L.; Jomaa, L. Changes in environmental footprints associated with dietary intake of Lebanese adolescents between the years 1997 and 2009. Sustainability 2020, 12, 4519. [Google Scholar] [CrossRef]
- World Health Organization (WHO). Fact Sheet—Malnutrition. Available online: https://www.who.int/news-room/fact-sheets/detail/malnutrition (accessed on 15 April 2022).
- Bundy, D.A.; de Silva, N.; Horton, S.; Patton, G.C.; Schultz, L.; Jamison, D.T. Child and Adolescent Health and Development: Disease Control Priorities, 3rd ed.; The World Bank: Washington, DC, USA, 2017; Volume 8. [Google Scholar]
- Global Nutrition Report (GNR). Country Nutrition Profiles—The Burden of Malnutrition. Available online: https://globalnutritionreport.org/resources/nutrition-profiles/asia/western-asia/united-arab-emirates/ (accessed on 18 January 2022).
- Al-Haddad, F.H.; Little, B.B.; Abdul Ghafoor, A.G. Childhood obesity in United Arab Emirates schoolchildren: A national study. Ann. Hum. Biol. 2005, 32, 72–79. [Google Scholar] [CrossRef]
- The World Bank. Population Ages 0–14 (% of Total Population)—United Arab Emirates. Available online: https://data.worldbank.org/indicator/SP.POP.0014.TO.ZS?locations=AE (accessed on 8 April 2022).
- Ng, S.W.; Zaghloul, S.; Ali, H.; Harrison, G.; Yeatts, K.; El Sadig, M.; Popkin, B.M. Nutrition transition in the United Arab Emirates. Eur. J. Clin. Nutr. 2011, 65, 1328–1337. [Google Scholar] [CrossRef]
- Eldridge, A.L. FITS and KNHS Overview: Methodological Challenges in Dietary Intake Data Collection among Infants, Toddlers, and Children in Selected Countries. Nestle Nutr. Inst. Workshop Ser. 2019, 91, 69–78. [Google Scholar] [CrossRef]
- Kassis, A.; Chokor, F.A.Z.; Nasreddine, L.; Hwalla, N.; O’Neill, L. Food Sources of Fiber and Micronutrients of Concern in Infants and Children in the United Arab Emirates: Findings from the Feeding Infants and Toddlers Study (FITS) and the Kids Nutrition and Health Survey (KNHS) 2020. Nutrients 2022, 14, 2819. [Google Scholar] [CrossRef]
- Deeb, A.; Suliman, S.; Tomy, M.; Yousef, H.; Mohamed, L.; Saleh, S.; Mahmoud, S.; Akle, M.; Nagelkerke, N. Is There a Correlation between Body Weight and Awareness of Healthy Life Style Components in Children? Open J. Pediatr. 2015, 5, 49–55. [Google Scholar] [CrossRef][Green Version]
- World Health Organization (WHO). Guideline: Assessing and Managing Children at Primary Health-Care Facilities to Prevent Overweight and Obesity in the Context of the Double Burden of Malnutrition. Available online: https://www.who.int/publications/i/item/9789241550123 (accessed on 14 April 2022).
- World Health Organization (WHO). WHO Child Growth Standards: Length/Height-for-Age, Weight-for-Age, Weight-for-Length, Weight-for-Height and Body Mass Index-for-Age: Methods and Development. Available online: https://www.who.int/publications/i/item/924154693X (accessed on 27 January 2022).
- World Health Organization (WHO). WHO AnthroPlus for Personal Computers Manual. Available online: https://cdn.who.int/media/docs/default-source/child-growth/growth-reference-5-19-years/who-anthroplus-manual.pdf?sfvrsn=ddd24b2_1 (accessed on 27 January 2022).
- NHLBI. Obesity Education Initiative Expert Panel on the Identification, Evaluation, and Treatment of Obesity in Adults (US). In Clinical Guidelines on the Identification, Evaluation, and Treatment of Overweight and Obesity in Adults: The Evidence Report; National Heart, Lung, and Blood Institute: Bethesda, MD, USA, 1998. [Google Scholar]
- World Health Organization (WHO). WHO Child Growth Standards: Training Course on Child Growth Assessment: Interpreting Growth Indicators. Available online: https://apps.who.int/iris/bitstream/handle/10665/43601/9789241595070_C_eng.pdf?sequence=3&isAllowed=y (accessed on 27 December 2022).
- World Health Organization (WHO). Growth Reference Data for 5–19 Years: BMI-For-Age. Available online: https://www.who.int/tools/growth-reference-data-for-5to19-years/indicators/bmi-for-age (accessed on 27 December 2022).
- Conway, J.M.; Ingwersen, L.A.; Moshfegh, A.J. Accuracy of dietary recall using the USDA five-step multiple-pass method in men: An observational validation study. J. Am. Diet. Assoc. 2004, 104, 595–603. [Google Scholar] [CrossRef] [PubMed]
- Steinfeldt, L.; Anand, J.; Murayi, T. Food reporting patterns in the USDA automated multiple-pass method. Procedia Food Sci. 2013, 2, 145–156. [Google Scholar] [CrossRef]
- Pellet, P.; Shadarevian, S. Food Composition. Tables for Use in the Middle East; American University of Beirut: Beirut, Lebanon, 2013. [Google Scholar]
- Al Dhaheri, A.S.; Al Ma’awali, A.K.; Laleye, L.C.; Washi, S.A.; Jarrar, A.H.; Al Meqbaali, F.T.; Mohamad, M.N.; Masuadi, E.M. The effect of nutritional composition on the glycemic index and glycemic load values of selected Emirati foods. BMC Nutr. 2015, 1, 1–8. [Google Scholar] [CrossRef]
- Al Dhaheri, A.S.; Henry, C.J.K.; Mohamad, M.N.; Ohuma, E.O.; Ismail, L.C.; Al Meqbaali, F.T.; Jarrar, A.H. Glycaemic index and glycaemic load values of commonly consumed foods in the United Arab Emirates. Br. J. Nutr. 2017, 117, 1110–1117. [Google Scholar] [CrossRef]
- Otten, J.J.; Hellwig, J.P.; Meyers, L.D. Dietary Reference Intakes: The Essential Guide to Nutrient Requirements; National Academies Press: Washington, DC, USA, 2006. [Google Scholar]
- Bernstein, M.; McMahon, K. Nutrition Across Life Stages, 1st ed.; Jones & Bartlett Learning: Burlington, MA, USA, 2017. [Google Scholar]
- Trumbo, P.; Schlicker, S.; Yates, A.A.; Poos, M. Dietary reference intakes for energy, carbohydrate, fiber, fat, fatty acids, cholesterol, protein and amino acids. J. Am. Diet. Assoc. 2002, 102, 1621–1630. [Google Scholar] [CrossRef]
- Gidding, S.S.; Dennison, B.A.; Birch, L.L.; Daniels, S.R.; Gilman, M.W.; Lichtenstein, A.H.; Rattay, K.T.; Steinberger, J.; Stettler, N.; Van Horn, L. Dietary recommendations for children and adolescents: A guide for practitioners. Pediatrics 2006, 117, 544–559. [Google Scholar] [CrossRef]
- Grimm, K.A.; Kim, S.A.; Yaroch, A.L.; Scanlon, K.S. Fruit and vegetable intake during infancy and early childhood. Pediatrics 2014, 134, S63–S69. [Google Scholar] [CrossRef]
- Galobardes, B.; Shaw, M.; Lawlor, D.A.; Lynch, J.W. Indicators of socioeconomic position (part 2). J. Epidemiol. Community Health 2006, 60, 95. [Google Scholar] [CrossRef]
- Zaragoza-Jordana, M.; Closa-Monasterolo, R.; Luque, V.; Ferre, N.; Grote, V.; Koletzko, B.; Pawellek, I.; Verduci, E.; ReDionigi, A.; Socha, J.; et al. Micronutrient intake adequacy in children from birth to 8 years. Data from the Childhood Obesity Project. Clin. Nutr. 2018, 37, 630–637. [Google Scholar] [CrossRef]
- Bailey, R.L.; Dodd, K.W.; Gahche, J.J.; Dwyer, J.T.; Cowan, A.E.; Jun, S.; Eicher-Miller, H.A.; Guenther, P.M.; Bhadra, A.; Thomas, P.R. Best practices for dietary supplement assessment and estimation of total usual nutrient intakes in population-level research and monitoring. J. Nutr. 2019, 149, 181–197. [Google Scholar] [CrossRef] [PubMed]
- World Health Organization (WHO). Guideline: Sugars Intake for Adults and Children. Available online: https://www.who.int/publications/i/item/9789241549028 (accessed on 9 July 2022).
- Vos, M.B.; Kaar, J.L.; Welsh, J.A.; Van Horn, L.V.; Feig, D.I.; Anderson, C.A.M.; Patel, M.J.; Cruz Munos, J.; Krebs, N.F.; Xanthakos, S.A.; et al. Added Sugars and Cardiovascular Disease Risk in Children: A Scientific Statement from the American Heart Association. Circulation 2017, 135, e1017–e1034. [Google Scholar] [CrossRef] [PubMed]
- World Health Organization. Interim Summary of Conclusions and Dietary Recommendations on Total Fat & Fatty Acids. From the Joint FAO/WHO Expert Consultation on Fats and Fatty Acids in Human Nutrition; World Health Organization: Geneva, Switzerland, 2008; pp. 10–14. [Google Scholar]
- National Academies of Sciences Engineering Medicine. Dietary Reference Intakes for Sodium and Potassium; 0309488346; National Academies Press: Washington, DC, USA, 2019. [Google Scholar]
- Abduelkarem, A.R.; Sharif, S.I.; Bankessli, F.G.; Kamal, S.A.; Kulhasan, N.M.; Hamrouni, A.M. Obesity and its associated risk factors among school-aged children in Sharjah, UAE. PLoS ONE 2020, 15, e0234244. [Google Scholar] [CrossRef] [PubMed]
- World Health Organization (WHO). Global School-Based Student Health Survey 2016—United Arab Emirates. Available online: https://cdn.who.int/media/docs/default-source/ncds/ncd-surveillance/data-reporting/united-arab-emirates/gshs/uae-2016-gshs-fact-sheet.pdf?sfvrsn=7ac30a41_3&download=true (accessed on 18 January 2022).
- Abdullatif, M.; AlAbady, K.; Altheeb, A.; Rishmawi, F.; Jaradat, H.; Farooq, S. Prevalence of Overweight, Obesity, and Dietary Behaviors among Adolescents in Dubai Schools: A Complex Design Survey 2019. Dubai Med. J. 2022, 5, 1–9. [Google Scholar] [CrossRef]
- AlBlooshi, A.; Shaban, S.; AlTunaiji, M.; Fares, N.; AlShehhi, L.; AlShehhi, H.; AlMazrouei, A.; Souid, A.K. Increasing obesity rates in school children in United Arab Emirates. Obes. Sci. Pract. 2016, 2, 196–202. [Google Scholar] [CrossRef]
- Neufeld, L.M.; Andrade, E.B.; Ballonoff Suleiman, A.; Barker, M.; Beal, T.; Blum, L.S.; Demmler, K.M.; Dogra, S.; Hardy-Johnson, P.; Lahiri, A.; et al. Food choice in transition: Adolescent autonomy, agency, and the food environment. Lancet 2022, 399, 185–197. [Google Scholar] [CrossRef]
- University of Rochester Medical Center. Healthy Eating for Teens. Available online: https://www.urmc.rochester.edu/encyclopedia/content.aspx?ContentTypeID=90&ContentID=P01610 (accessed on 22 April 2022).
- Dalia, H.; Ola, E.; Lesley, W. Dietary and Activity Habits in Adolescents Living in the United Arab Emirates: A Cross-Sectional Study. Arab. J. Nutr. Exerc. 2017, 1, 85–100. [Google Scholar] [CrossRef]
- Elsevier. Frequent Consumption of Meals Prepared Away from Home Linked to Increased Risk of Early Death. Available online: https://www.sciencedaily.com/releases/2021/03/210325084824.htm (accessed on 31 January 2022).
- United Nations International Children’s Emergency Fund (UNICEF). Malnutrition. Available online: https://data.unicef.org/topic/nutrition/malnutrition/ (accessed on 19 December 2022).
- Joulaei, H.; Keshani, P.; Ashourpour, M.; Bemani, P.; Amiri, S.; Rahimi, J.; Aliakbarpour, M.; Salehi-Abargouei, A. The prevalence of stunting among children and adolescents living in the Middle East and North Africa region (MENA): A systematic review and meta-analysis. J. Glob. Health 2021, 11, 04070. [Google Scholar] [CrossRef]
- United Nations International Children’s Emergency Fund (UNICEF). The State of the World’s Children 2019: Children, Food and Nutrition: Growing Well in a Changing World. Available online: https://www.unicef.org/media/60806/file/SOWC-2019.pdf (accessed on 19 December 2022).
- Nasreddine, L.; Hwalla, N.; Al Zahraa Chokor, F.; Naja, F.; O’Neill, L.; Jomaa, L. Food and nutrient intake of school-aged children in Lebanon and their adherence to dietary guidelines and recommendations. BMC Public Health 2022, 22, 922. [Google Scholar] [CrossRef]
- Ali, H.I.; Ng, S.W.; Zaghloul, S.; Harrison, G.G.; Qazaq, H.S.; El Sadig, M.; Yeatts, K. High proportion of 6 to 18-year-old children and adolescents in the United Arab Emirates are not meeting dietary recommendations. Nutr. Res. 2013, 33, 447–456. [Google Scholar] [CrossRef]
- Nasreddine, L.; Naja, F.; Akl, C.; Chamieh, M.C.; Karam, S.; Sibai, A.-M.; Hwalla, N. Dietary, Lifestyle and Socio-Economic Correlates of Overweight, Obesity and Central Adiposity in Lebanese Children and Adolescents. Nutrients 2014, 6, 1038–1062. [Google Scholar] [CrossRef] [PubMed]
- Novak, T.E.; Babcock, T.A.; Jho, D.H.; Helton, W.S.; Espat, N.J. NF-κB inhibition by ω-3 fatty acids modulates LPS-stimulated macrophage TNF-α transcription. Am. J. Physiol. Lung Cell Mol. Physiol. 2003, 284, L84–L89. [Google Scholar] [CrossRef] [PubMed]
- Johnson, R.K.; Appel, L.J.; Brands, M.; Howard, B.V.; Lefevre, M.; Lustig, R.H.; Sacks, F.; Steffen, L.M.; Wylie-Rosett, J. Dietary sugars intake and cardiovascular health: A scientific statement from the American Heart Association. Circulation 2009, 120, 1011–1020. [Google Scholar] [CrossRef] [PubMed]
- Ventura, E.; Davis, J.; Byrd-Williams, C.; Alexander, K.; McClain, A.; Lane, C.J.; Spruijt-Metz, D.; Weigensberg, M.; Goran, M. Reduction in risk factors for type 2 diabetes mellitus in response to a low-sugar, high-fiber dietary intervention in overweight Latino adolescents. Arch. Pediatr. Adolesc. Med. 2009, 163, 320–327. [Google Scholar] [CrossRef] [PubMed]
- Uauy, R.; Mena, P.; Valenzuela, A. Essential fatty acids as determinants of lipid requirements in infants, children and adults. Eur. J. Clin. Nutr. 1999, 53, s66–s77. [Google Scholar] [CrossRef] [PubMed]
- Scully, C. 27—Dietary factors and health and disease. In Scully’s Medical Problems in Dentistry, 7th ed.; Churchill Livingstone: Oxford, UK, 2014; pp. 659–675. [Google Scholar]
- Oddy, W.H.; de Klerk, N.H.; Kendall, G.E.; Mihrshahi, S.; Peat, J.K. Ratio of omega-6 to omega-3 fatty acids and childhood asthma. J. Asthma 2004, 41, 319–326. [Google Scholar] [CrossRef]
- Simopoulos, A.P. An Increase in the Omega-6/Omega-3 Fatty Acid Ratio Increases the Risk for Obesity. Nutrients 2016, 8, 128. [Google Scholar] [CrossRef]
- Bailey, R.L.; Fulgoni, V.L.; Cowan, A.E.; Gaine, P.C. Sources of Added Sugars in Young Children, Adolescents, and Adults with Low and High Intakes of Added Sugars. Nutrients 2018, 10, 102. [Google Scholar] [CrossRef]
- Miller, G.; Merlo, C.; Demissie, Z.; Sliwa, S.; Park, S. Trends in Beverage Consumption Among High School Students—United States, 2007–2015. MMWR Morb. Mortal. Wkly. Rep. 2017, 66, 112–116. [Google Scholar] [CrossRef]
- Mumena, W.A. Consumption of Free Sugar Predicts Nutrient Intake of Saudi Children. Front. Nutr. 2021, 8. [Google Scholar] [CrossRef]
- Faruque, S.; Tong, J.; Lacmanovic, V.; Agbonghae, C.; Minaya, D.M.; Czaja, K. The Dose Makes the Poison: Sugar and Obesity in the United States—A Review. Pol. J. Food Nutr. Sci. 2019, 69, 219–233. [Google Scholar] [CrossRef] [PubMed]
- Malik, V.S.; Popkin, B.M.; Bray, G.A.; Després, J.P.; Hu, F.B. Sugar-sweetened beverages, obesity, type 2 diabetes mellitus, and cardiovascular disease risk. Circulation 2010, 121, 1356–1364. [Google Scholar] [CrossRef] [PubMed]
- Yang, Q.; Zhang, Z.; Gregg, E.W.; Flanders, W.D.; Merritt, R.; Hu, F.B. Added Sugar Intake and Cardiovascular Diseases Mortality Among US Adults. JAMA Intern. Med. 2014, 174, 516–524. [Google Scholar] [CrossRef] [PubMed]
- Janzi, S.; Ramne, S.; González-Padilla, E.; Johnson, L.; Sonestedt, E. Associations between Added Sugar Intake and Risk of Four Different Cardiovascular Diseases in a Swedish Population-Based Prospective Cohort Study. Front. Nutr. 2020, 7. [Google Scholar] [CrossRef] [PubMed]
- DiNicolantonio, J.J.; O’Keefe, J.H.; Lucan, S.C. Added fructose: A principal driver of type 2 diabetes mellitus and its consequences. Mayo Clin. Proc. 2015, 90, 372–381. [Google Scholar] [CrossRef] [PubMed]
- Debras, C.; Chazelas, E.; Srour, B.; Kesse-Guyot, E.; Julia, C.; Zelek, L.; Agaësse, C.; Druesne-Pecollo, N.; Galan, P.; Hercberg, S.; et al. Total and added sugar intakes, sugar types, and cancer risk: Results from the prospective NutriNet-Santé cohort. Am. J. Clin. Nutr. 2020, 112, 1267–1279. [Google Scholar] [CrossRef] [PubMed]
- DiNicolantonio, J.J.; Subramonian, A.M.; O’Keefe, J.H. Added fructose as a principal driver of non-alcoholic fatty liver disease: A public health crisis. Open Heart 2017, 4, e000631. [Google Scholar] [CrossRef]
- Jensen, T.; Abdelmalek, M.F.; Sullivan, S.; Nadeau, K.J.; Green, M.; Roncal, C.; Nakagawa, T.; Kuwabara, M.; Sato, Y.; Kang, D.-H.; et al. Fructose and sugar: A major mediator of non-alcoholic fatty liver disease. J. Hepatol. 2018, 68, 1063–1075. [Google Scholar] [CrossRef]
- Mahboobi, Z.; Pakdaman, A.; Yazdani, R.; Azadbakht, L.; Montazeri, A. Dietary free sugar and dental caries in children: A systematic review on longitudinal studies. Health Promot. Perspect. 2021, 11, 271–280. [Google Scholar] [CrossRef]
- Valenzuela, M.J.; Waterhouse, B.; Aggarwal, V.R.; Bloor, K.; Doran, T. Effect of sugar-sweetened beverages on oral health: A systematic review and meta-analysis. Eur. J. Public Health 2021, 31, 122–129. [Google Scholar] [CrossRef]
- Nishida, C.; Uauy, R.; Kumanyika, S.; Shetty, P. The joint WHO/FAO expert consultation on diet, nutrition and the prevention of chronic diseases: Process, product and policy implications. Public Health Nutr. 2004, 7, 245–250. [Google Scholar] [CrossRef] [PubMed]
- Al-Jawaldeh, A.; Taktouk, M.; Nasreddine, L. Food Consumption Patterns and Nutrient Intakes of Children and Adolescents in the Eastern Mediterranean Region: A Call for Policy Action. Nutrients 2020, 12, 3345. [Google Scholar] [CrossRef] [PubMed]
- Harvard School of Public Health. The Nutrition Source. Available online: https://www.hsph.harvard.edu/nutritionsource/what-should-you-eat/whole-grains/ (accessed on 31 January 2022).
- Aune, D.; Keum, N.; Giovannucci, E.; Fadnes, L.T.; Boffetta, P.; Greenwood, D.C.; Tonstad, S.; Vatten, L.J.; Riboli, E.; Norat, T. Whole grain consumption and risk of cardiovascular disease, cancer, and all cause and cause specific mortality: Systematic review and dose-response meta-analysis of prospective studies. BMJ 2016, 353, i2716. [Google Scholar] [CrossRef] [PubMed]
- Schlesinger, S.; Neuenschwander, M.; Schwedhelm, C.; Hoffmann, G.; Bechthold, A.; Boeing, H.; Schwingshackl, L. Food Groups and Risk of Overweight, Obesity, and Weight Gain: A Systematic Review and Dose-Response Meta-Analysis of Prospective Studies. Adv. Nutr. 2019, 10, 205–218. [Google Scholar] [CrossRef] [PubMed]
- Guo, H.; Ding, J.; Liang, J.; Zhang, Y. Associations of Whole Grain and Refined Grain Consumption with Metabolic Syndrome. A Meta-Analysis of Observational Studies. Front. Nutr. 2021, 8. [Google Scholar] [CrossRef]
- Schwingshackl, L.; Schwedhelm, C.; Hoffmann, G.; Knüppel, S.; Laure Preterre, A.; Iqbal, K.; Bechthold, A.; De Henauw, S.; Michels, N.; Devleesschauwer, B.; et al. Food groups and risk of colorectal cancer. Int. J. Cancer 2018, 142, 1748–1758. [Google Scholar] [CrossRef]
- Afshin, A.; Sur, P.J.; Fay, K.A.; Cornaby, L.; Ferrara, G.; Salama, J.S.; Mullany, E.C.; Abate, K.H.; Abbafati, C.; Abebe, Z.; et al. Health effects of dietary risks in 195 countries, 1990–2017: A systematic analysis for the Global Burden of Disease Study 2017. Lancet 2019, 393, 1958–1972. [Google Scholar] [CrossRef]
- Hwalla, N.; Weaver, C.M.; Mekary, R.A.; El Labban, S. Editorial: Public Health Nutrition in the Middle East. Front. Public Health 2016, 4, 33. [Google Scholar] [CrossRef]
- Mehio Sibai, A.; Nasreddine, L.; Mokdad, A.H.; Adra, N.; Tabet, M.; Hwalla, N. Nutrition Transition and Cardiovascular Disease Risk Factors in Middle East and North Africa Countries: Reviewing the Evidence. Ann. Nutr. Metab. 2010, 57, 193–203. [Google Scholar] [CrossRef]
- World Health Organization (WHO). Regional Strategy on Nutrition 2010–2019 and Plan of Action. Available online: https://apps.who.int/iris/handle/10665/116694 (accessed on 2 February 2022).
- Augusto, R.A.; Cobayashi, F.; Cardoso, M.A. Associations between low consumption of fruits and vegetables and nutritional deficiencies in Brazilian schoolchildren. Public Health Nutr. 2015, 18, 927–935. [Google Scholar] [CrossRef]
- Duthie, S.J.; Duthie, G.G.; Russell, W.R.; Kyle, J.A.M.; Macdiarmid, J.I.; Rungapamestry, V.; Stephen, S.; Megias-Baeza, C.; Kaniewska, J.J.; Shaw, L.; et al. Effect of increasing fruit and vegetable intake by dietary intervention on nutritional biomarkers and attitudes to dietary change: A randomised trial. Eur. J. Nutr. 2018, 57, 1855–1872. [Google Scholar] [CrossRef] [PubMed]
- Jayedi, A.; Soltani, S.; Abdolshahi, A.; Shab-Bidar, S. Healthy and unhealthy dietary patterns and the risk of chronic disease: An umbrella review of meta-analyses of prospective cohort studies. Br. J. Nutr. 2020, 124, 1133–1144. [Google Scholar] [CrossRef] [PubMed]
- Nasreddine, L.M.; Kassis, A.N.; Ayoub, J.J.; Naja, F.A.; Hwalla, N.C. Nutritional status and dietary intakes of children amid the nutrition transition: The case of the Eastern Mediterranean Region. Nutr. Res. 2018, 57, 12–27. [Google Scholar] [CrossRef] [PubMed]
- The Royal Children’s Hospital—Immigrant Health Department. Vitamin D: Signs and Symptoms of Low Vitamin D (or Vitamin D Deficiency). Available online: https://www.rch.org.au/kidsinfo/fact_sheets/Vitamin_D_low/#:~:text=Very%20low%20vitamin%20D%20can,ah)%20in%20adolescents%20and%20adults (accessed on 2 February 2022).
- Chakhtoura, M.; Rahme, M.; Chamoun, N.; El-Hajj Fuleihan, G. Vitamin D in the Middle East and North Africa. Bone Rep. 2018, 8, 135–146. [Google Scholar] [CrossRef] [PubMed]
- Hoteit, M.; Al-Shaar, L.; Yazbeck, C.; Sleiman, M.B.; Ghalayini, T.; Fuleihan, G.E.-H. Hypovitaminosis D in a sunny country: Time trends, predictors, and implications for practice guidelines. Metabolism 2014, 63, 968–978. [Google Scholar] [CrossRef]
- World Health Organization (WHO). Vitamin A Deficiency. Available online: https://www.who.int/data/nutrition/nlis/info/vitamin-a-deficiency#:~:text=Deficiency%20of%20vitamin%20A%20is,outcomes%20of%20pregnancy%20and%20lactation (accessed on 2 February 2022).
- Brown, K.H.; Rivera, J.A.; Bhutta, Z.; Gibson, R.S.; King, J.C.; Lönnerdal, B.; Ruel, M.T.; Sandtröm, B.; Wasantwisut, E.; Hotz, C. International Zinc Nutrition Consultative Group (IZiNCG) technical document #1. Assessment of the risk of zinc deficiency in populations and options for its control. Food Nutr. Bull. 2004, 25, S99–S203. [Google Scholar]
- Schwalfenberg, G.K.; Genuis, S.J. The Importance of Magnesium in Clinical Healthcare. Scientifica 2017, 2017, 4179326. [Google Scholar] [CrossRef]
- World Health Organization (WHO). Guideline: Sodium Intake for Adults and Children. Available online: https://apps.who.int/iris/bitstream/handle/10665/77985/9789241504836_eng.pdf (accessed on 2 February 2022).
- Lava, S.A.; Bianchetti, M.G.; Simonetti, G.D. Salt intake in children and its consequences on blood pressure. Pediatr. Nephrol. 2015, 30, 1389–1396. [Google Scholar] [CrossRef]
- Centers for Disease Control Prevention. High Sodium Intake in Children and Adolescents: Cause for Concern. Available online: https://www.naccho.org/uploads/downloadable-resources/children_sodium.pdf (accessed on 20 March 2022).
- World Health Organization (WHO). Potassium Intake for Adults and Children. Available online: https://apps.who.int/iris/bitstream/handle/10665/77986/9789241504829_eng.pdf (accessed on 20 March 2022).
- Westerterp, K.R.; Goris, A.H. Validity of the assessment of dietary intake: Problems of misreporting. Curr. Opin. Clin. Nutr. Metab. Care 2002, 5, 489–493. [Google Scholar] [CrossRef]
- Livingstone, M.; Robson, P. Measurement of dietary intake in children. Proc. Nutr. Soc. 2000, 59, 279–293. [Google Scholar] [CrossRef]
- Burrows, T.L.; Martin, R.J.; Collins, C.E. A systematic review of the validity of dietary assessment methods in children when compared with the method of doubly labeled water. J. Am. Diet. Assoc. 2010, 110, 1501–1510. [Google Scholar] [CrossRef] [PubMed]


| Total n (%) | Nationals n (%) | Arab Non-Nationals n (%) | p-Value | |
|---|---|---|---|---|
| 690 (100) | 461 (66.8) | 229 (33.2) | ||
| Socioeconomic Characteristics | ||||
| Age Distribution | 0.077 | |||
| 4 to 8.9 years | 429 (62.2) | 276 (59.9) | 153 (66.8) | |
| 9 to 12.9 years | 261 (37.8) | 185 (40.1) | 76 (33.2) | |
| Gender | 0.029 * | |||
| Male | 330 (47.8) | 207 (44.9) | 123 (53.7) | |
| Female | 360 (52.2) | 254 (55.1) | 106 (46.3) | |
| Household monthly Income 1 | <0.001 * | |||
| <30,000 DHS | 261 (37.8) | 127 (27.5) | 134 (58.5) | |
| 30,000 to 50,000 Dhs | 124 (18.0) | 117 (25.4) | 7 (3.1) | |
| 50,000 to 100,000 Dhs | 18 (2.6) | 17 (3.7) | 1 (0.4) | |
| Don’t Know/Refused | 287 (41.6) | 200 (43.4) | 87 (38.0) | |
| Crowding Index | <0.001 * | |||
| <1 person/room | 76 (11.1) | 71 (15.6) | 5 (2.2) | |
| ≥1 person/room | 607 (88.9) | 383 (84.4) | 224 (97.8) | |
| Education of Mother | <0.001 * | |||
| Less than Elementary 2 | 11 (1.6) | 7 (1.5) | 4 (1.7) | |
| Elementary to Secondary 3 | 361 (52.3) | 279 (60.5) | 82 (35.8) | |
| University degree | 294 (42.6) | 160 (34.7) | 134 (58.5) | |
| Graduate/Professional degree | 24 (3.5) | 15 (3.3) | 9 (3.9) | |
| Education of Father | <0.001 * | |||
| Less than Elementary 2 | 5 (0.7) | 5 (1.1) | 0 (0.0) | |
| Elementary to Secondary 3 | 337 (49.3) | 266 (58.2) | 71 (31.4) | |
| University degree | 297 (43.5) | 157 (34.4) | 140 (61.9) | |
| Graduate/Professional degree | 44 (6.4) | 29 (6.3) | 15 (6.6) | |
| Mother Employed | 0.187 | |||
| Yes | 301 (43.6) | 193 (41.9) | 108 (47.2) | |
| No | 389 (56.4) | 268 (58.1) | 121 (52.8) | |
| Father Employed | 0.124 | |||
| Yes | 634 (93.0) | 420 (91.9) | 214 (95.1) | |
| No | 48 (7.0) | 37 (8.1) | 11 (4.9) | |
| Anthropometric Characteristics | ||||
| Stunting Status 4 | 0.293 | |||
| Stunted | 29 (4.2) | 22 (4.8) | 7 (3.1) | |
| Not Stunted | 656 (95.8) | 436 (95.2) | 220 (96.9) | |
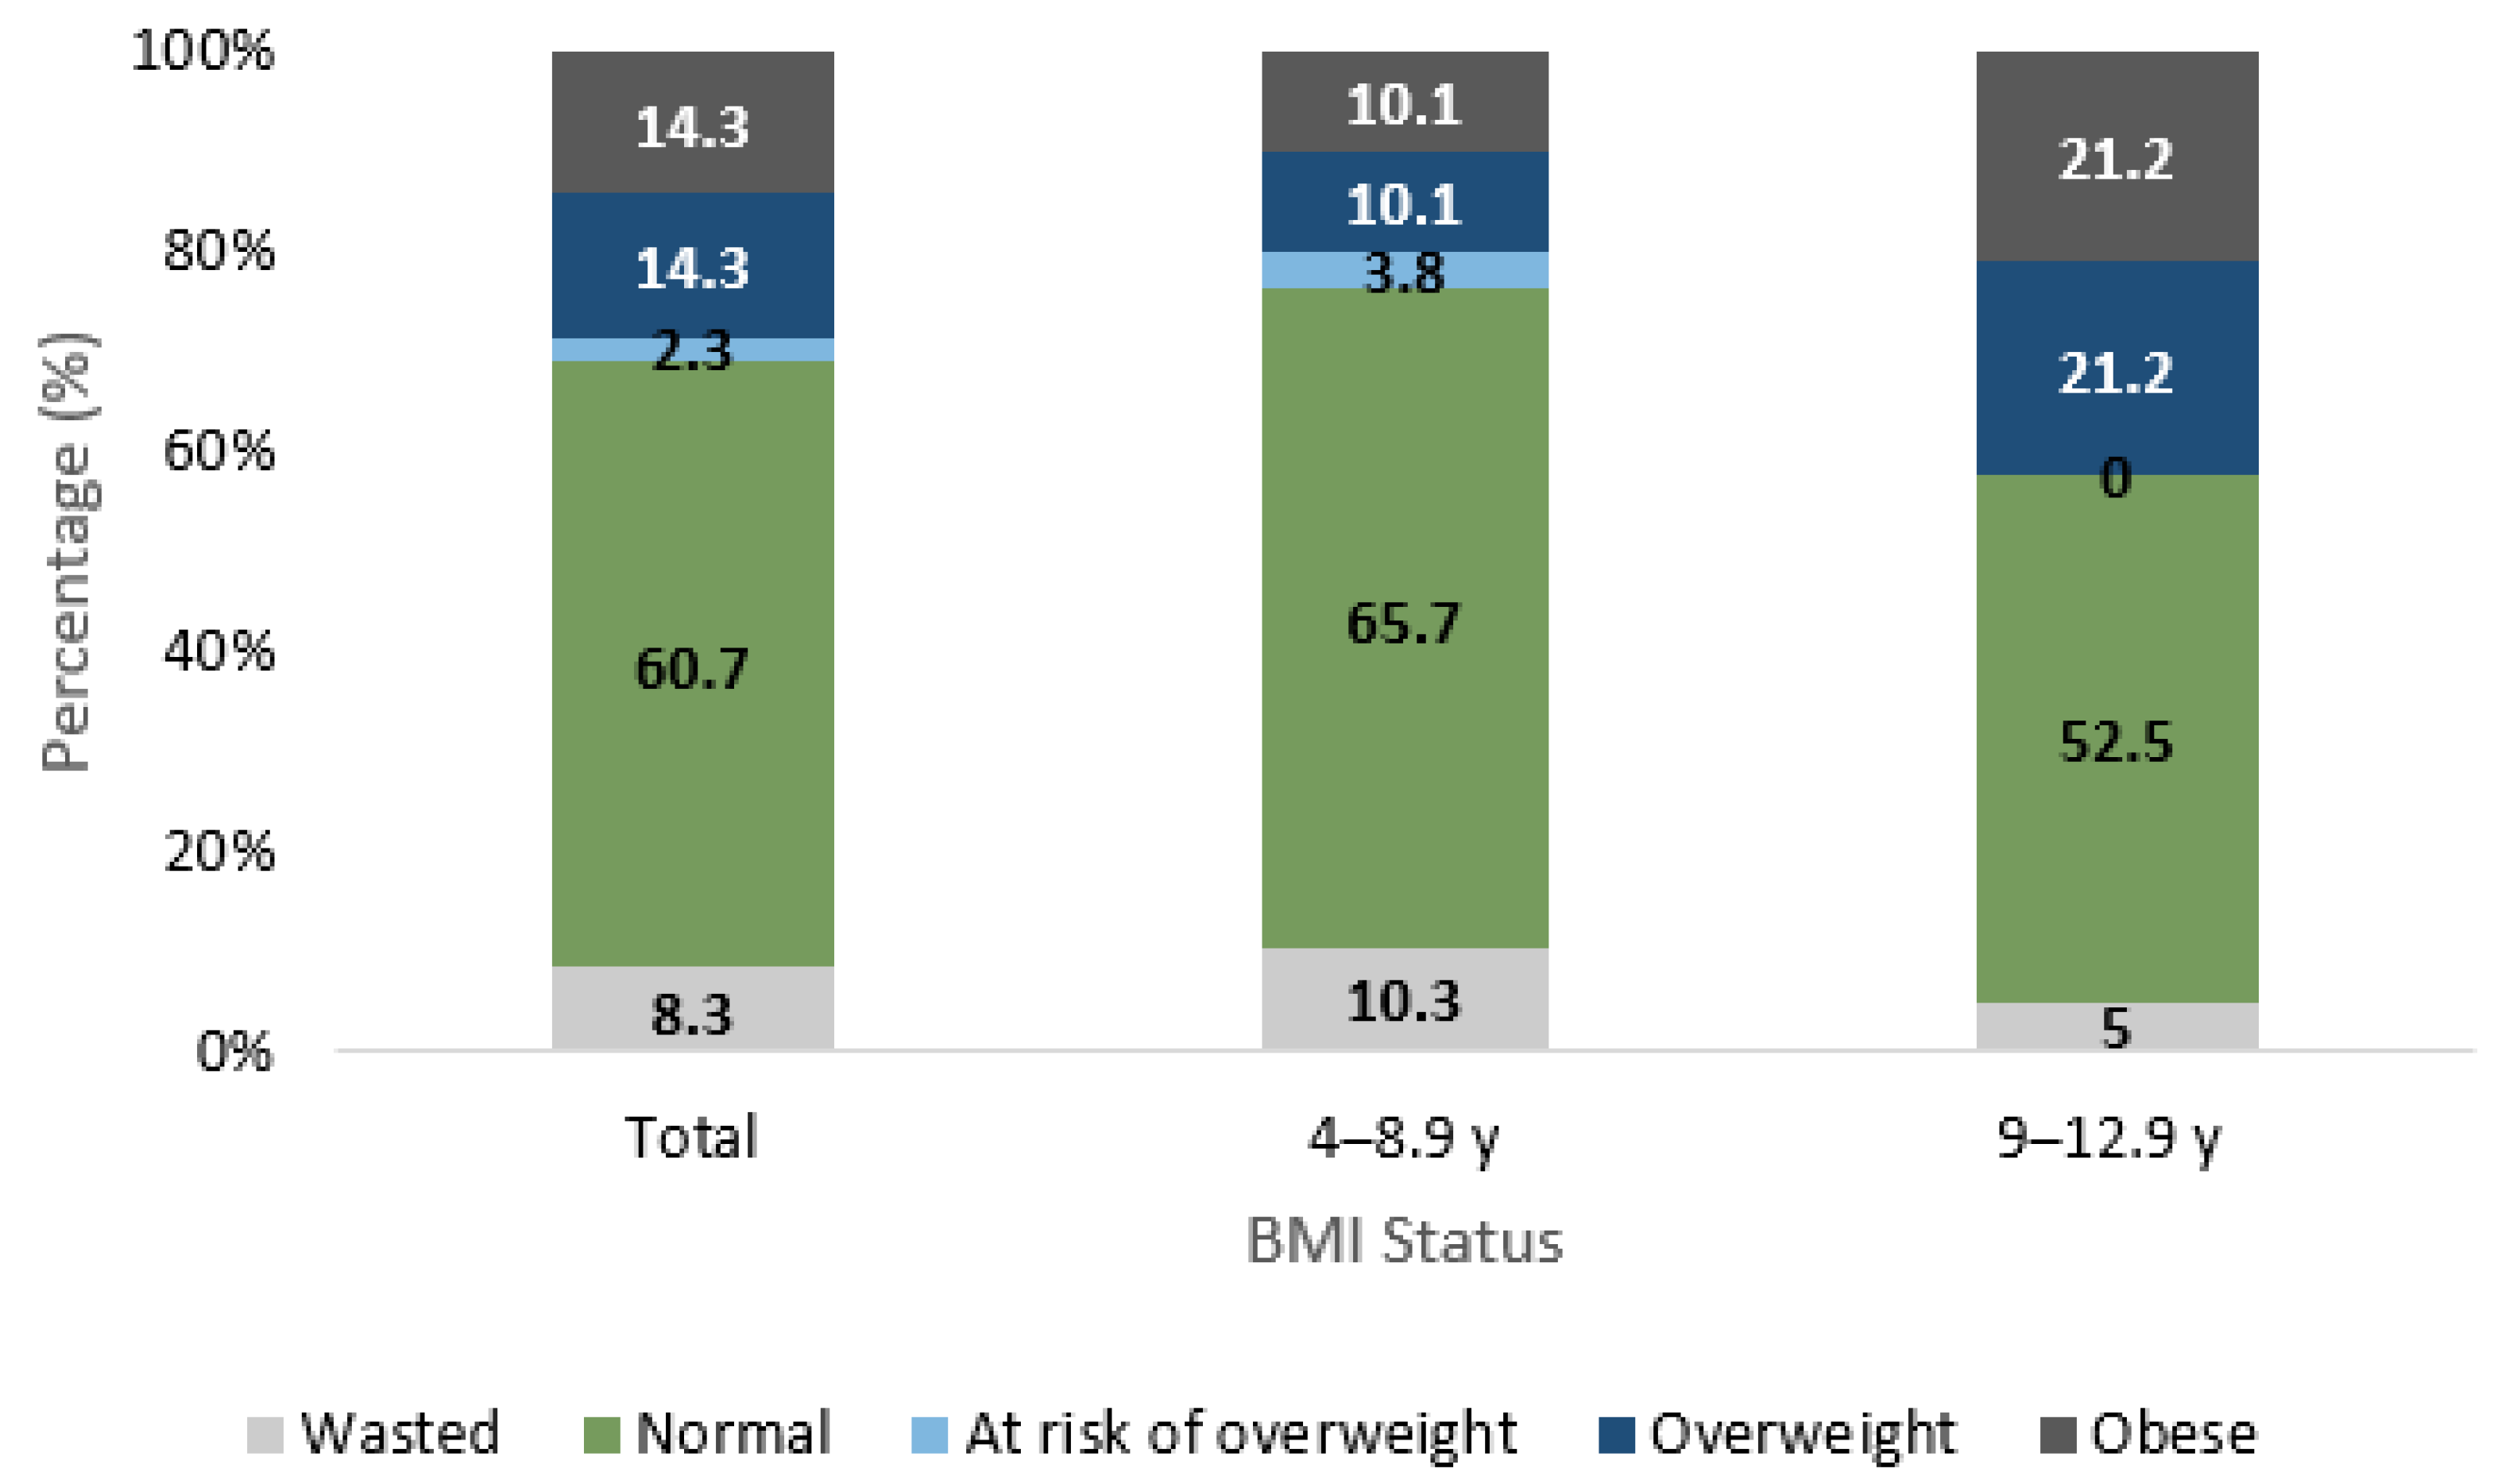
| BMI Status 5 | 0.892 | |||
| Wasted | 57 (8.3) | 41 (9.0) | 16 (7.0) | |
| Normal | 416 (60.7) | 279 (60.9) | 137 (60.4) | |
| At Risk of Overweight 6 | 16 (2.3) | 10 (2.2) | 6 (2.6) | |
| Overweight | 98 (14.3) | 63 (13.8) | 35 (15.4) | |
| Obese | 98 (14.3) | 65 (14.2) | 33 (14.5) | |
| Food Group | Grams/Day | Kcals/Day | %Kcal/Day | p-Value | |||
|---|---|---|---|---|---|---|---|
| 4–8.9 Years (n = 429) | 9–12.9 Years (n = 261) | 4–8.9 Years (n = 429) | 9–12.9 Years (n = 261) | 4–8.9 Years (n = 429) | 9–12.9 Years (n = 261) | ||
| Mean ± SE | Mean ± SE | Mean ± SE | |||||
| Grain and Grain Products | 184 ± 8 | 210 ± 10 | 355 ± 12 | 397 ± 16 | 26 ± 1 | 28 ± 1 | 0.2272 |
| Fruits | 116 ± 8 | 90 ± 10 | 71 ± 5 | 55 ± 7 | 5 ± 0 | 4 ± 0 | 0.0055 |
| Vegetables | 59 ± 4 | 70 ± 7 | 69 ± 6 | 67 ± 8 | 5 ± 1 | 4 ± 1 | 0.2570 |
| Milk and Milk Products | 206 ± 9 | 209 ± 13 | 145 ± 6 | 153 ± 10 | 11 ± 1 | 10 ± 1 | 0.4020 |
| Meats and Other Protein Sources | 73 ± 4 | 65 ± 5 | 157 ± 9 | 128 ± 10 | 11 ± 1 | 9 ± 1 | 0.0093 |
| Mixed Dishes | 189 ± 13 | 256 ± 23 | 247 ± 16 | 343 ± 22 | 17 ± 1 | 22 ± 1 | 0.0005 |
| Savory Snacks | 8 ± 1 | 15 ± 2 | 42 ± 5 | 78 ± 12 | 3 ± 0 | 5 ± 1 | 0.0015 |
| Sweets, Sweetened Beverages, and Desserts | 237 ± 10 | 281 ± 16 | 242 ± 11 | 237 ± 13 | 18 ± 1 | 16 ± 1 | 0.1016 |
| Fats and Oils | 13 ± 1 | 9 ± 1 | 45 ± 3 | 33 ± 4 | 3 ± 0 | 2 ± 0 | 0.0015 |
| Condiments And Sauces | 2 ± 1 | 1 ± 0 | 3 ± 1 | 2 ± 1 | 0 ± 0 | 0 ± 0 | 0.2108 |
| Nutrients | 4–8.9 Years | 9–12.9 Years | ||||||
|---|---|---|---|---|---|---|---|---|
| Nutrient Intake | DRI Compliance (%) | Nutrient Intake | DRI Compliance (%) | |||||
| Mean ± SE | >AI | <EAR/ AMDR | >UL/ AMDR | Mean ± SE | >AI | <EAR/ AMDR | >UL/ AMDR | |
| Energy (kcal/day) | 1393.3 ± 13.0 | -- | -- | -- | 1465.3 ± 17.7 | -- | -- | -- |
| Total Fat (g/day) | 48.3 ± 0.6 | -- | -- | -- | 50.7 ± 0.8 | -- | -- | -- |
| Saturated fat (g/day) | 16.4 ± 0.2 | -- | -- | -- | 17.2 ± 0.3 | -- | -- | -- |
| Cholesterol (mg/day) | 181.0 ± 2.7 | -- | -- | -- | 183.4 ± 3.4 | -- | -- | -- |
| Total Monounsaturated fat (g/day) | 16.1 ± 0.2 | -- | -- | -- | 17.0 ± 0.3 | -- | -- | -- |
| Total Polyunsaturated fat (g/day) | 9.6 ± 0.2 | -- | -- | -- | 9.9 ± 0.2 | -- | -- | -- |
| Linoleic acid (g/day) | 8.9 ± 0.2 | 32.9 | -- | -- | 9.3 ± 0.1 | 29.1 | -- | -- |
| Alpha linolenic acid(g/day) | 0.7 ± 0.0 | 17.7 ** | -- | -- | 0.8 ± 0.0 | 8.1 ** | -- | -- |
| Docosahexaenoic acid (g/day) | 0.08 ± 0.00 | -- | -- | -- | 0.08 ± 0.003 | -- | -- | -- |
| Carbohydrate (g/day) | 189.9 ± 2.0 | -- | 0.5 | -- | 200.0 ± 2.7 | -- | 0.8 | -- |
| Total Sugar (g/day) | 64.4 ± 0.8 | -- | -- | -- | 66.1 ± 1.1 | -- | -- | -- |
| Free Sugars (g/day) 1 | 40.0 ± 0.6 | -- | -- | -- | 43.7 ± 0.9 | -- | -- | -- |
| Added Sugars (g/day) | 34.7 ± 0.5 | -- | -- | -- | 37.3 ± 0.8 | -- | -- | -- |
| Protein (g/day) | 52.2 ± 0.6 | -- | 0.2 ** | -- | 53.8 ± 0.8 | -- | 7.3 ** | -- |
| Dietary fiber (g/day) | 10.8 ± 0.1 | 0.0 | -- | -- | 10.8 ± 0.2 | 0.0 | -- | -- |
| Total Fat (%) | 31.3 ± 0.2 | -- | 8.4 | 20.1 | 31.1 ± 0.3 | -- | 11.1 | 19.2 |
| Saturated fat (%) 2 | 10.6 ± 0.1 | -- | -- | 91.4 | 10.6 ± 0.1 | -- | -- | 88.5 |
| Linoleic acid (%) | 5.7 ± 0.1 | -- | 36.4 | 0.9 | 5.7 ± 0.1 | -- | 36.4 | 0.8 |
| Alpha linolenic acid (%) | 0.5 ± 0.0 | -- | 90.7 | 0.0 | 0.5 ± 0.0 | -- | 90.8 | 0.0 |
| Carbohydrate (%) | 54.6 ± 0.3 | -- | 5.4 | 2.6 | 54.6 ± 0.4 | -- | 5.0 | 4.6 |
| Total Sugar (%) | 18.7 ± 0.2 | -- | -- | -- | 18.1 ± 0.2 | -- | -- | -- |
| Free Sugar (%) | 11.6 ± 0.2 | -- | 29.6 | 70.4 | 12.0 ± 0.2 | -- | 26.0 | 74.0 |
| Added Sugar (%) | 10.1 ± 0.1 | -- | 48.7 | 51.3 | 10.2 ± 0.2 | -- | 50.6 | 49.4 |
| Protein (%) | 15.0 ± 0.1 | -- | 0.0 | 0.0 | 14.8 ± 0.2 | -- | 0.0 | 0.0 |
| Vitamin C (mg/day) | 71.6 ± 1.4 | -- | 0.5 ** | 0.0 | 70.0 ± 1.8 | -- | 11.5 ** | 0.0 |
| Thiamin (mg/day) | 1.2 ± 0.0 | -- | 0.0 | -- | 1.3 ± 0.0 | -- | 0.8 | -- |
| Riboflavin (mg/day) | 1.3 ± 0.0 | -- | 0.0 ** | -- | 1.4 ± 0.0 | -- | 5.0 ** | -- |
| Niacin (mg/day) | 16.9 ± 0.3 | -- | 0.0 * | -- | 17.3 ± 0.3 | -- | 1.5 * | -- |
| Vitamin B6 (mg/day) | 1.3 ± 0.0 | -- | 0.2 ** | 0.0 | 1.3 ± 0.0 | -- | 5.0 ** | 0.0 |
| Folate (μg/d) | 370.4 ± 5.0 | -- | 0.2 ** | -- | 388.6 ± 5.7 | -- | 6.9 ** | -- |
| Vitamin B12 (μg/day) | 3.5 ± 0.1 | -- | 0.9 ** | -- | 3.4 ± 0.1 | -- | 9.6 ** | -- |
| Vitamin D (μg/day) | 3.5 ± 0.1 | -- | 99.8 | 0.0 | 3.4 ± 0.1 | -- | 100.0 | 0.0 |
| Vitamin A (RE/day) | 437.9 ± 10.0 | -- | 14.7 ** | 0.0 | 456.4 ± 12.1 | -- | 51.0 ** | 0.0 |
| Vitamin K (μg/day) | 52.5 ± 1.5 | 42.9 | -- | -- | 58.9 ± 2.5 | 42.9 | -- | -- |
| Calcium (mg/day) | 664.0 ± 9.6 | -- | 78.1 ** | 0.0 | 696.7 ± 13.1 | -- | 95.8 ** | 0.0 |
| Magnesium (mg/day) | 188.6 ± 2.1 | -- | 2.3 ** | -- | 195.5 ± 2.6 | -- | 59.8 ** | -- |
| Iron (mg/day) | 10.5 ± 0.1 | -- | 0.0 | 0.0 | 10.9 ± 0.1 | -- | 0.8 | 0.0 |
| Zinc (mg/day) | 5.7 ± 0.1 | -- | 6.5 ** | 0.0 | 5.9 ± 0.1 | -- | 74.3 ** | 0.0 |
| Sodium (mg/day) 3 | 1616.1 ±20.4 | -- | -- | 58.3 ** | 1718.9 ± 31.7 | -- | -- | 35.6 ** |
| Potassium (mg/day) | 1660.9 ± 16.2 | 3.5 | -- | -- | 1678.6 ± 22.5 | 3.1 | -- | -- |
Disclaimer/Publisher’s Note: The statements, opinions and data contained in all publications are solely those of the individual author(s) and contributor(s) and not of MDPI and/or the editor(s). MDPI and/or the editor(s) disclaim responsibility for any injury to people or property resulting from any ideas, methods, instructions or products referred to in the content. |
© 2023 by the authors. Licensee MDPI, Basel, Switzerland. This article is an open access article distributed under the terms and conditions of the Creative Commons Attribution (CC BY) license (https://creativecommons.org/licenses/by/4.0/).
Share and Cite
Hwalla, N.; Chehade, L.; O’Neill, L.M.; Kharroubi, S.; Kassis, A.; Cheikh Ismail, L.; Al Dhaheri, A.S.; Ali, H.I.; Ibrahim, S.; Chokor, F.A.Z.; et al. Total Usual Nutrient Intakes and Nutritional Status of United Arab Emirates Children (4 Years–12.9 Years): Findings from the Kids Nutrition and Health Survey (KNHS) 2021. Nutrients 2023, 15, 234. https://doi.org/10.3390/nu15010234
Hwalla N, Chehade L, O’Neill LM, Kharroubi S, Kassis A, Cheikh Ismail L, Al Dhaheri AS, Ali HI, Ibrahim S, Chokor FAZ, et al. Total Usual Nutrient Intakes and Nutritional Status of United Arab Emirates Children (4 Years–12.9 Years): Findings from the Kids Nutrition and Health Survey (KNHS) 2021. Nutrients. 2023; 15(1):234. https://doi.org/10.3390/nu15010234
Chicago/Turabian StyleHwalla, Nahla, Lara Chehade, Lynda M. O’Neill, Samer Kharroubi, Amira Kassis, Leila Cheikh Ismail, Ayesha S. Al Dhaheri, Habiba I. Ali, Sarah Ibrahim, Fatima Al Zahraa Chokor, and et al. 2023. "Total Usual Nutrient Intakes and Nutritional Status of United Arab Emirates Children (4 Years–12.9 Years): Findings from the Kids Nutrition and Health Survey (KNHS) 2021" Nutrients 15, no. 1: 234. https://doi.org/10.3390/nu15010234
APA StyleHwalla, N., Chehade, L., O’Neill, L. M., Kharroubi, S., Kassis, A., Cheikh Ismail, L., Al Dhaheri, A. S., Ali, H. I., Ibrahim, S., Chokor, F. A. Z., Mohamad, M. N., Ayesh, W., Nasreddine, L., & Naja, F. (2023). Total Usual Nutrient Intakes and Nutritional Status of United Arab Emirates Children (4 Years–12.9 Years): Findings from the Kids Nutrition and Health Survey (KNHS) 2021. Nutrients, 15(1), 234. https://doi.org/10.3390/nu15010234