
Influences of Meteorological Factors on Maize and Sorghum Yield in Togo, West Africa


Abstract
1. Introduction
2. Materials and Methods
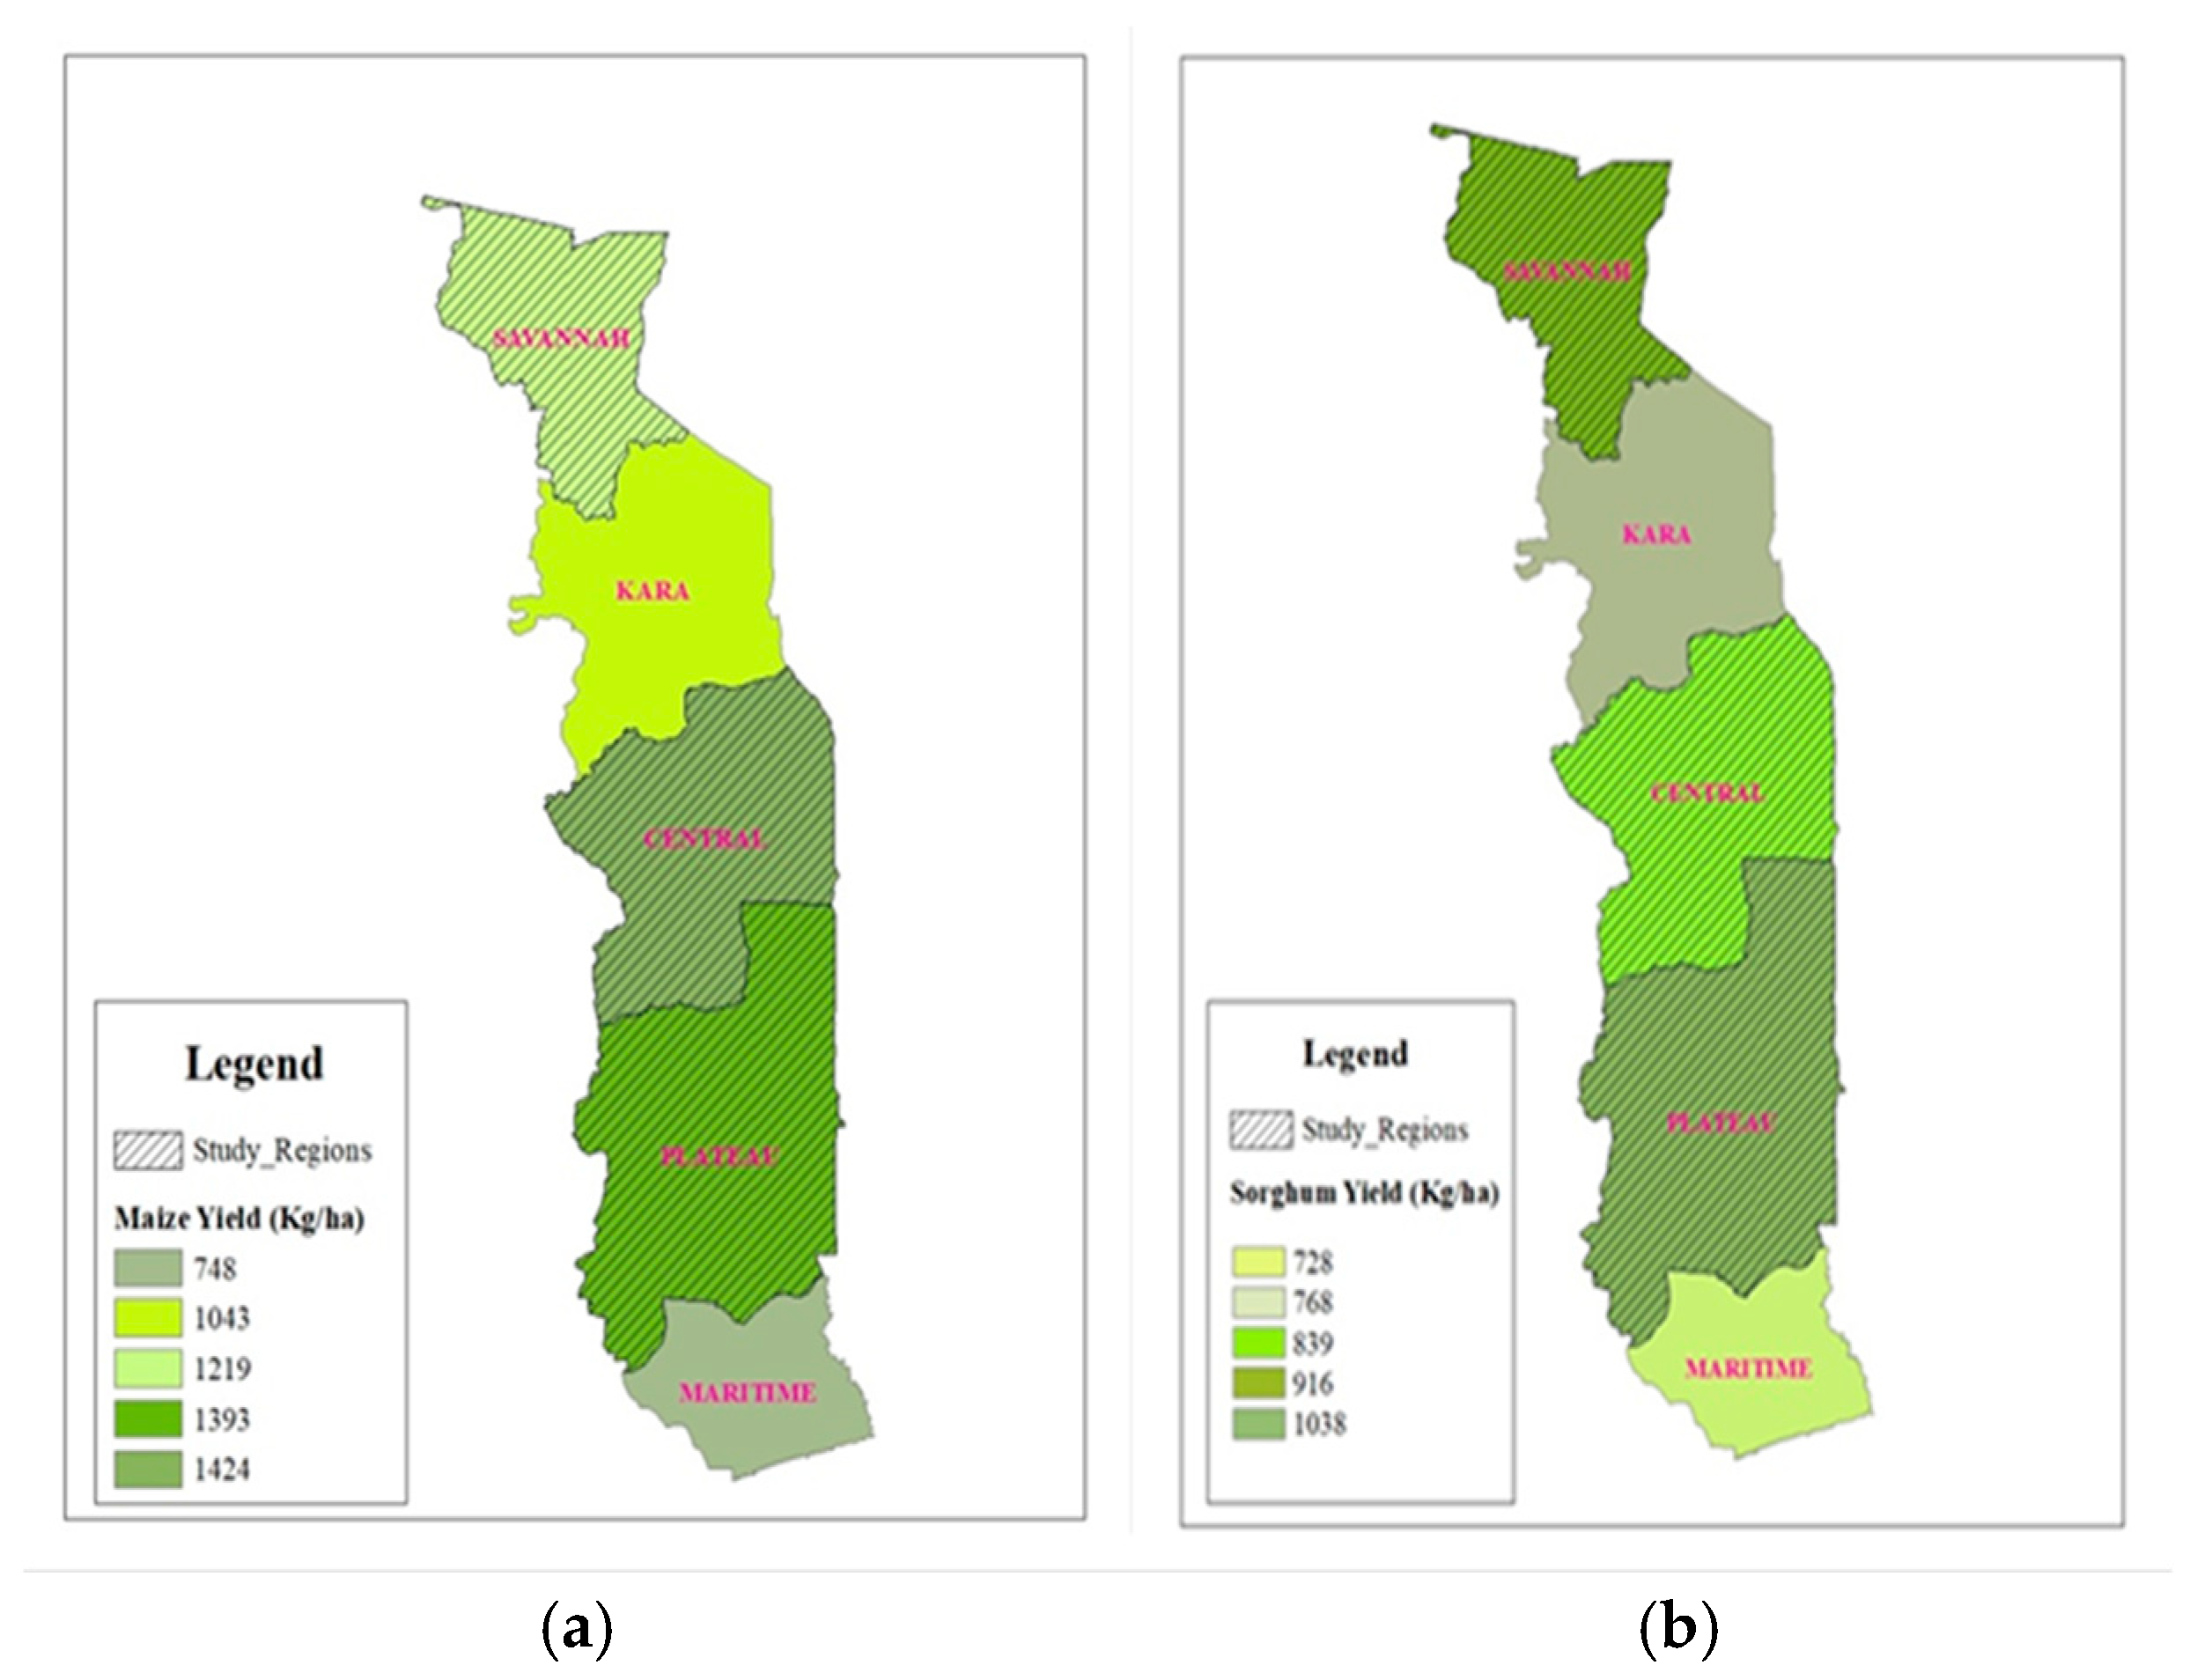
2.1. Study Area
2.2. Data Sources
2.3. Research Method
2.3.1. Actual, Trend, and Meteorological Yield Model
2.3.2. Fisher Integral Regression Model and Chebyshev Orthogonal Polynomial Function
3. Results
3.1. Descriptive Analyses
3.2. Trend Yield Determination
3.3. Determination of Coefficients of the Variables: Stepwise Regressions on Orthogonal Polynomial
- Maize
- Sorghum
3.4. Impact of Meteorological Factors on Maize and Sorghum Yields by Growth Stages
3.4.1. Maize
- Model 1
- Model 2
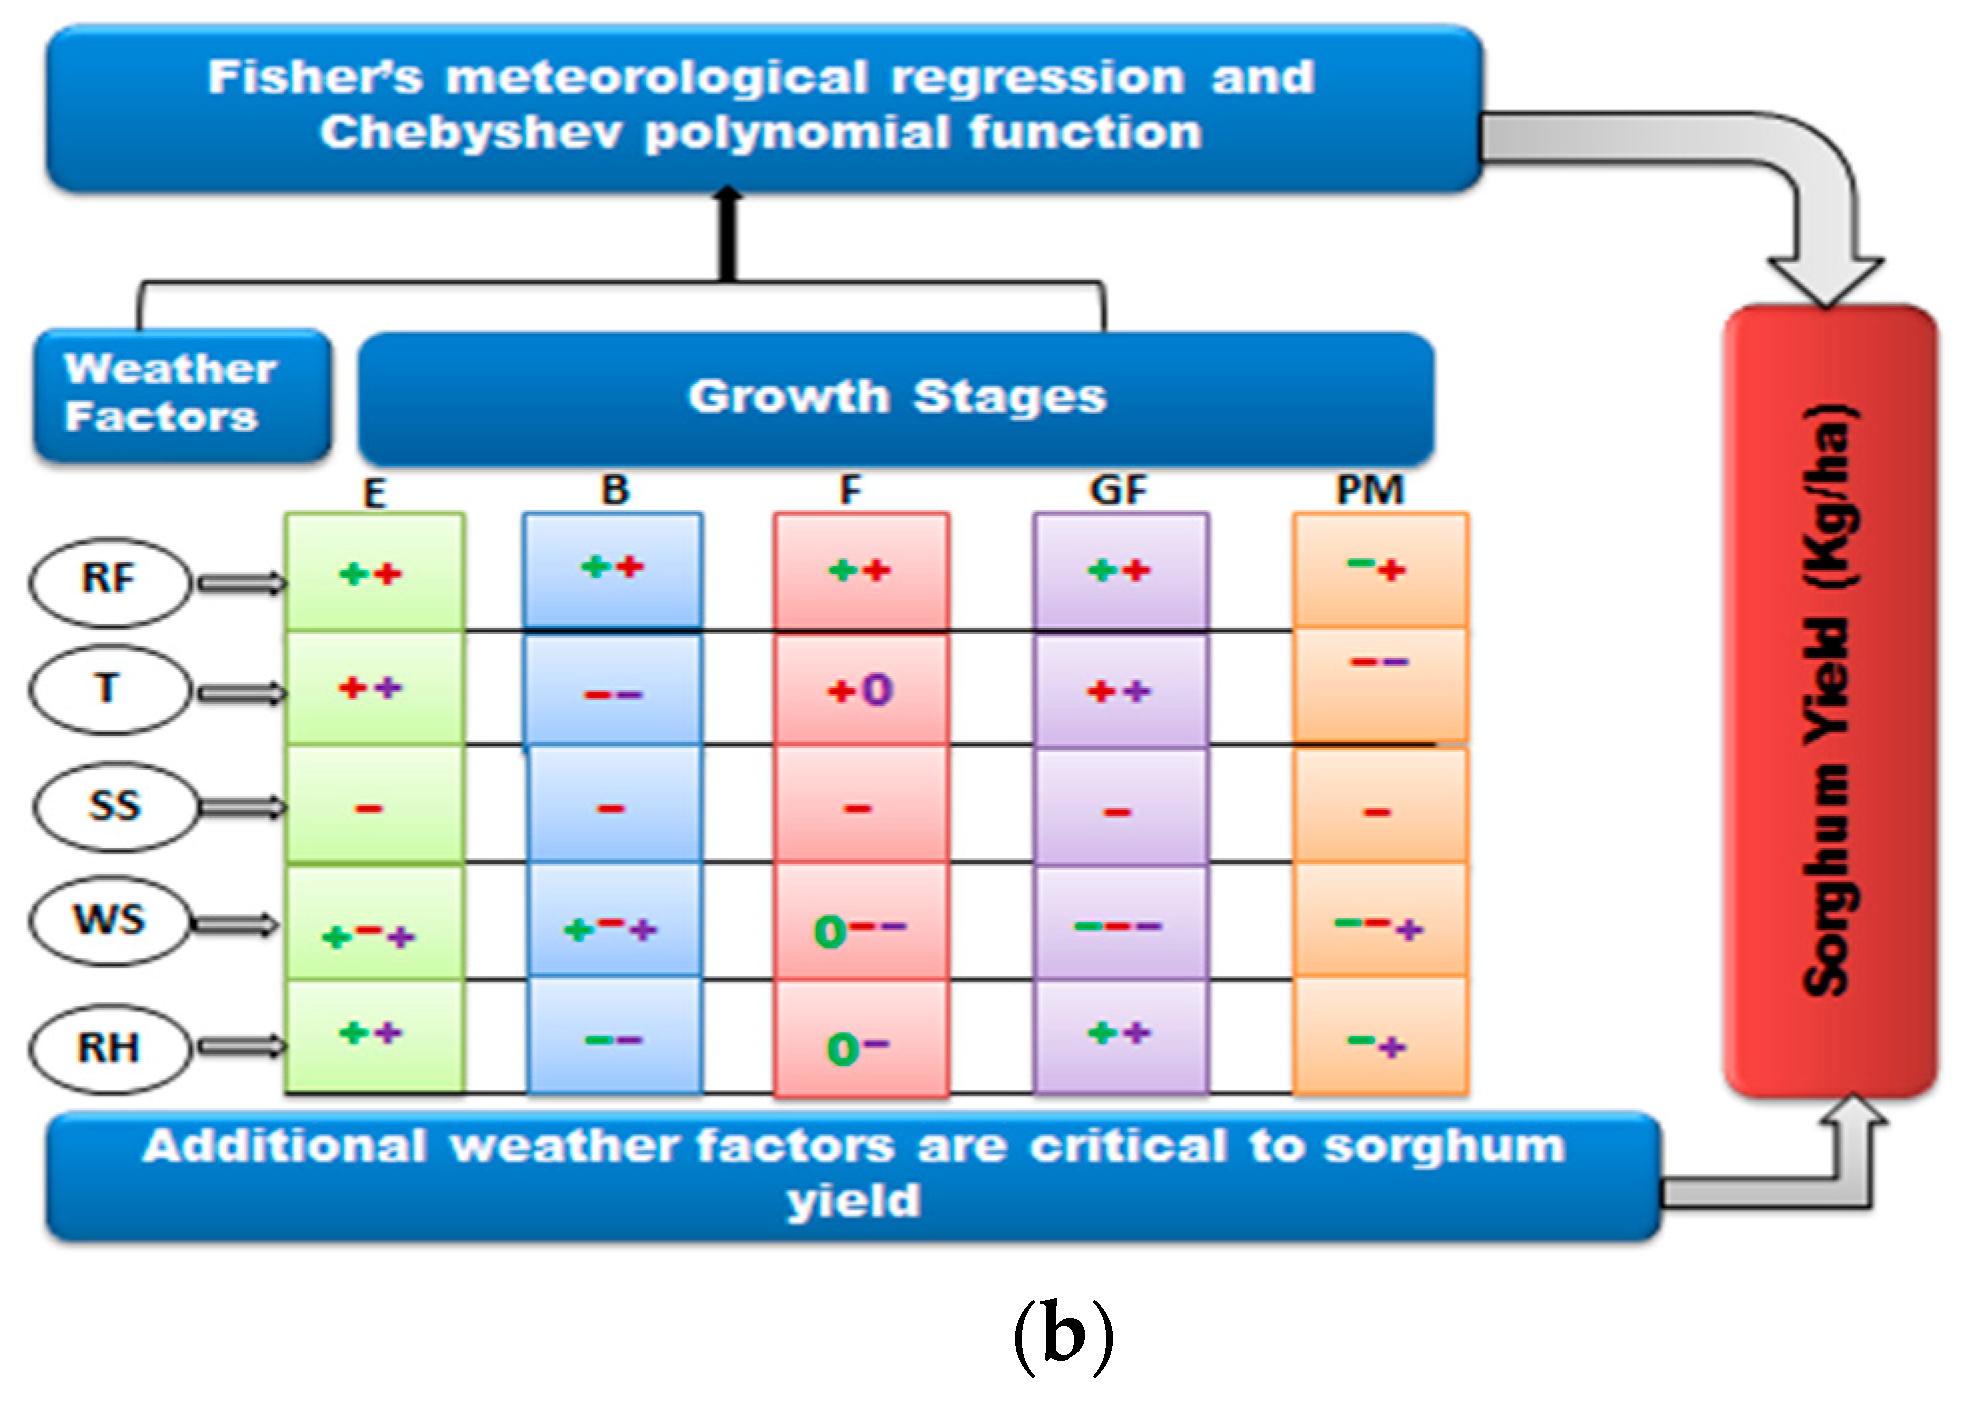
3.4.2. Sorghum
- Model 1

| Variable | Region | Unit | Growth Stage | ||||
|---|---|---|---|---|---|---|---|
| Emergence | Booting | Flowering | Grain Filling | Physiological Maturity | |||
| Model 1 | |||||||
| Rainfall | Plateau | Kg/ha/mm | 0.5 | 0.5 | 0.5 | 0.5 | 0.5 |
| Central | 0.48 | 0.09 | 0.35 | 0.61 | 0.22 | ||
| Temperature | Central | Kg/ha/°C | 198.72 | −356.75 | 47.12 | 181.13 | −70.22 |
| Sunshine | Savannah | Kg/ha/h | −59.07 | 29.54 | 59.07 | 29.54 | −59.07 |
| Model 2 | |||||||
| Rainfall | Plateau | Kg/ha/mm | 1 | 0.7 | 0.4 | 0.1 | −0.2 |
| Central | 0.48 | 0.48 | 0.48 | 0.48 | 0.48 | ||
| Temperature | Central | Kg/ha/°C | 229.36 | −410.39 | 61.97 | 189.77 | −70.72 |
| Savannah | 51.08 | −102.16 | 0 | 102.16 | −51.08 | ||
| Sunshine | Central | Kg/ha/h | −26.97 | −26.97 | −26.97 | −26.97 | −26.97 |
| Wind | Plateau | Kg/ha/m/s | 257.38 | 128.69 | 0 | −128.69 | −257.38 |
| Central | −63.47 | −63.47 | −63.47 | −63.47 | −63.47 | ||
| Savannah | 112.06 | 81.82 | −203.96 | −285.78 | 295.86 | ||
| Humidity | Plateau | Kg/ha/% | 31.14 | −62.27 | 0 | 62.27 | −31.14 |
| Savannah | 21.83 | −19.62 | −16.02 | 3.6 | 10.22 | ||
- Model 2
4. Discussion
5. Summary of Results
Author Contributions
Funding
Data Availability Statement
Conflicts of Interest
Appendix A. Autocorrelation of Rainfall, Temperature, Sunshine, Wind Speed, and Relative Humidity in the Plateau Region
| RF3 | RF4 | RF5 | RF6 | RF7 | RF8 | RF9 | T3 | T4 | T5 | T6 | T7 | T8 | T9 | SS3 | SS4 | SS5 | SS6 | SS7 | SS8 | SS9 | RH3 | RH4 | RH5 | RH6 | RH7 | RH8 | RH9 | WS3 | WS4 | WS5 | WS6 | WS7 | WS8 | WS9 | |
| RF3 | 1 | ||||||||||||||||||||||||||||||||||
| RF4 | −0.12 | 1 | |||||||||||||||||||||||||||||||||
| RF5 | 0.25 | 0.17 | 1 | ||||||||||||||||||||||||||||||||
| RF6 | −0.01 | −0.12 | 0 | 1 | |||||||||||||||||||||||||||||||
| RF7 | 0.03 | −0.02 | 0.15 | 0.48 | 1 | ||||||||||||||||||||||||||||||
| RF8 | −0.04 | −0.27 | 0.07 | 0.13 | 0.34 | 1 | |||||||||||||||||||||||||||||
| RF9 | −0.13 | −0.12 | −0.09 | 0.28 | 0.34 | 0.1 | 1 | ||||||||||||||||||||||||||||
| T3 | 0.06 | 0.25 | −0.18 | −0.11 | 0.23 | −0.17 | −0.04 | 1 | |||||||||||||||||||||||||||
| T4 | −0.02 | −0.25 | 0.04 | 0.18 | 0.05 | −0.1 | 0.04 | −0.03 | 1 | ||||||||||||||||||||||||||
| T5 | 0.36 | −0.22 | −0.14 | 0.19 | 0.04 | −0.17 | −0.05 | 0.28 | 0.53 | 1 | |||||||||||||||||||||||||
| T6 | 0.27 | −0.17 | 0.15 | 0.1 | 0.09 | 0.01 | −0.08 | 0 | 0.32 | 0.48 | 1 | ||||||||||||||||||||||||
| T7 | 0.32 | −0.27 | 0.34 | −0.02 | 0.2 | 0.26 | −0.04 | −0.17 | 0.15 | 0.06 | 0.47 | 1 | |||||||||||||||||||||||
| T8 | 0.64 | −0.11 | 0.15 | −0.09 | 0.19 | 0.13 | −0.04 | 0.03 | 0.25 | 0.42 | 0.43 | 0.32 | 1 | ||||||||||||||||||||||
| T9 | 0.5 | −0.11 | 0.19 | −0.17 | 0.16 | −0.09 | −0.21 | 0.2 | 0.19 | 0.29 | 0.4 | 0.38 | 0.7 | 1 | |||||||||||||||||||||
| SS3 | 0.17 | −0.07 | −0.23 | 0.34 | −0.1 | −0.2 | −0.23 | 0.13 | −0.1 | −0.02 | 0.09 | −0.07 | −0.06 | 0.14 | 1 | ||||||||||||||||||||
| SS4 | −0.15 | −0.34 | −0.21 | −0.09 | −0.2 | −0.12 | 0.08 | 0.06 | 0.21 | 0.02 | 0.18 | 0.28 | −0.25 | 0 | 0.32 | 1 | |||||||||||||||||||
| SS5 | 0.16 | −0.1 | −0.22 | −0.15 | 0.08 | 0.1 | −0.13 | −0.03 | −0.23 | −0.22 | −0.26 | −0.11 | 0.18 | 0.23 | −0.01 | −0.13 | 1 | ||||||||||||||||||
| SS6 | −0.02 | 0.36 | 0.23 | −0.3 | −0.13 | −0.03 | −0.11 | 0.03 | −0.1 | −0.1 | −0.02 | −0.01 | −0.17 | −0.17 | −0.41 | 0.01 | −0.24 | 1 | |||||||||||||||||
| SS7 | 0.1 | −0.23 | 0.02 | −0.2 | 0.09 | −0.03 | 0.03 | 0.08 | 0.09 | 0.08 | −0.14 | 0.19 | 0.14 | 0.3 | −0.13 | −0.14 | 0.01 | −0.2 | 1 | ||||||||||||||||
| SS8 | 0.35 | −0.19 | −0.25 | −0.05 | −0.14 | −0.03 | 0.15 | −0.03 | −0.07 | −0.14 | 0.03 | −0.19 | 0.15 | 0.12 | 0.39 | 0.05 | 0.04 | −0.16 | −0.01 | 1 | |||||||||||||||
| SS9 | −0.38 | 0.04 | −0.11 | 0.09 | 0.25 | 0.2 | −0.07 | 0.04 | 0.08 | −0.13 | 0.27 | 0.12 | −0.26 | −0.17 | 0.07 | 0.23 | −0.05 | 0.21 | −0.06 | −0.29 | 1 | ||||||||||||||
| RH3 | 0.64 | −0.27 | 0.3 | −0.02 | 0.06 | 0.1 | −0.09 | −0.03 | −0.15 | 0.19 | 0.19 | 0.29 | 0.23 | 0.21 | −0.04 | −0.14 | −0.07 | 0.02 | 0.06 | 0.12 | −0.28 | 1 | |||||||||||||
| RH4 | 0.32 | 0.2 | 0.21 | −0.4 | −0.13 | −0.33 | −0.24 | 0.36 | −0.37 | 0.17 | 0.07 | 0.04 | 0.09 | 0.26 | −0.07 | −0.01 | 0.1 | 0.44 | −0.07 | −0.21 | 0.01 | 0.33 | 1 | ||||||||||||
| RH5 | 0.11 | −0.04 | 0.47 | −0.31 | 0.09 | 0.08 | −0.31 | −0.03 | 0.18 | −0.05 | 0.21 | 0.49 | 0.21 | 0.3 | −0.15 | 0.06 | −0.31 | 0.29 | 0.14 | −0.11 | 0.16 | 0.2 | 0.17 | 1 | |||||||||||
| RH6 | −0.15 | −0.08 | 0.18 | 0.02 | 0.09 | −0.12 | −0.2 | 0.24 | −0.15 | 0.01 | −0.16 | 0.1 | −0.1 | 0.19 | −0.07 | −0.09 | −0.11 | 0.15 | 0.15 | −0.38 | −0.09 | 0.07 | 0.35 | 0.28 | 1 | ||||||||||
| RH7 | −0.24 | 0.21 | 0.15 | −0.06 | 0 | 0.17 | −0.27 | 0.25 | −0.19 | −0.26 | −0.26 | −0.21 | −0.38 | −0.15 | −0.07 | −0.05 | 0.13 | 0.43 | 0.02 | −0.18 | 0.22 | −0.06 | 0.24 | 0.17 | 0.31 | 1 | |||||||||
| RH8 | −0.21 | −0.07 | 0.14 | −0.02 | −0.15 | 0.33 | 0.06 | −0.03 | −0.28 | −0.27 | −0.41 | −0.04 | −0.31 | −0.15 | −0.27 | −0.1 | 0.06 | 0 | 0.02 | −0.11 | −0.39 | 0.08 | −0.08 | 0.05 | 0.34 | 0.38 | 1 | ||||||||
| RH9 | −0.13 | −0.3 | 0.06 | −0.2 | −0.08 | 0.36 | 0.03 | −0.13 | 0.2 | 0.16 | 0.08 | 0.24 | −0.16 | −0.11 | −0.41 | 0.2 | −0.27 | 0.26 | 0.21 | −0.16 | 0.12 | 0.08 | −0.12 | 0.43 | 0.03 | 0.19 | 0.43 | 1 | |||||||
| WS3 | −0.34 | 0.07 | −0.09 | −0.12 | −0.21 | 0.08 | 0.04 | 0.01 | −0.13 | −0.34 | −0.46 | −0.16 | −0.49 | −0.56 | −0.27 | 0.07 | −0.01 | 0.2 | −0.16 | −0.07 | −0.09 | −0.01 | −0.09 | 0.06 | 0.14 | 0.39 | 0.59 | 0.3 | 1 | ||||||
| WS4 | −0.47 | 0.11 | −0.25 | −0.12 | −0.12 | 0.1 | −0.1 | 0.09 | −0.09 | −0.37 | −0.42 | −0.29 | −0.4 | −0.47 | −0.11 | 0.12 | 0.19 | 0.19 | −0.03 | −0.08 | 0.18 | −0.42 | −0.18 | −0.03 | 0.06 | 0.49 | 0.33 | 0.24 | 0.76 | 1 | |||||
| WS5 | −0.45 | 0.27 | −0.37 | 0.12 | −0.01 | 0.06 | −0.12 | 0.08 | −0.06 | −0.2 | −0.31 | −0.3 | −0.35 | −0.46 | −0.02 | 0.08 | 0.12 | 0.22 | −0.1 | −0.16 | 0.29 | −0.52 | −0.18 | −0.23 | 0.06 | 0.46 | 0.04 | 0.04 | 0.47 | 0.79 | 1 | ||||
| WS6 | −0.28 | 0.22 | −0.09 | −0.11 | −0.1 | −0.08 | −0.2 | 0.03 | −0.15 | −0.26 | −0.43 | −0.33 | −0.46 | −0.44 | −0.22 | 0.02 | 0.15 | 0.45 | −0.07 | −0.18 | 0.12 | −0.06 | 0.1 | 0.04 | 0.18 | 0.64 | 0.28 | 0.23 | 0.72 | 0.76 | 0.7 | 1 | |||
| WS7 | −0.37 | 0.3 | 0.13 | −0.15 | −0.17 | 0.04 | −0.22 | 0.01 | −0.26 | −0.46 | −0.35 | −0.09 | −0.5 | −0.44 | −0.27 | −0.09 | −0.04 | 0.33 | −0.19 | −0.27 | 0.05 | −0.05 | −0.02 | 0.19 | 0.35 | 0.46 | 0.54 | 0.22 | 0.82 | 0.67 | 0.45 | 0.72 | 1 | ||
| WS8 | −0.21 | 0.16 | 0.07 | −0.17 | −0.19 | −0.07 | −0.18 | 0.02 | 0 | −0.36 | −0.35 | −0.11 | −0.37 | −0.35 | −0.16 | 0.03 | −0.03 | 0.29 | −0.12 | −0.02 | 0.01 | 0.06 | −0.07 | 0.2 | 0.29 | 0.32 | 0.3 | 0.18 | 0.78 | 0.65 | 0.43 | 0.7 | 0.83 | 1 | |
| WS9 | −0.29 | 0.42 | 0.14 | −0.22 | −0.13 | −0.14 | −0.36 | 0.12 | −0.2 | −0.49 | −0.39 | −0.1 | −0.39 | −0.21 | 0.01 | 0.09 | 0.09 | 0.36 | −0.14 | −0.23 | 0.15 | −0.19 | 0.1 | 0.26 | 0.37 | 0.46 | 0.24 | 0.01 | 0.62 | 0.68 | 0.52 | 0.72 | 0.83 | 0.81 | 1 |
Appendix B. Autocorrelation of Rainfall, Temperature, Sunshine, Wind Speed, and Relative Humidity in the Central Region
| RF6 | RF7 | RF8 | RF9 | RF10 | T6 | T7 | T8 | T9 | T10 | SS6 | SS7 | SS8 | SS9 | SS10 | RH6 | RH7 | RH8 | RH9 | RH10 | WS6 | WS7 | WS8 | WS9 | WS10 | |
| RF6 | 1 | ||||||||||||||||||||||||
| RF7 | 0.37 | 1 | |||||||||||||||||||||||
| RF8 | 0.09 | −0.1 | 1 | ||||||||||||||||||||||
| RF9 | −0.19 | −0.08 | −0.12 | 1 | |||||||||||||||||||||
| RF10 | −0.17 | −0.18 | 0.03 | 0.33 | 1 | ||||||||||||||||||||
| T6 | −0.25 | −0.35 | −0.21 | 0.19 | 0.24 | 1 | |||||||||||||||||||
| T7 | −0.26 | −0.12 | −0.26 | 0.26 | 0.25 | 0.48 | 1 | ||||||||||||||||||
| T8 | −0.3 | −0.14 | −0.11 | 0.13 | 0.09 | 0.2 | 0.6 | 1 | |||||||||||||||||
| T9 | −0.25 | 0.03 | −0.1 | −0.06 | 0.12 | 0.1 | 0.65 | 0.54 | 1 | ||||||||||||||||
| T10 | 0.09 | −0.27 | −0.17 | 0.07 | −0.06 | 0.69 | 0.01 | −0.12 | −0.27 | 1 | |||||||||||||||
| SS6 | −0.34 | −0.07 | 0.19 | 0.14 | −0.12 | −0.1 | 0.12 | 0.24 | 0.1 | −0.3 | 1 | ||||||||||||||
| SS7 | 0.09 | −0.37 | 0.3 | −0.05 | 0.02 | −0.17 | −0.22 | −0.12 | −0.25 | 0.19 | −0.11 | 1 | |||||||||||||
| SS8 | −0.04 | −0.29 | −0.2 | 0.31 | 0.3 | 0.17 | 0.17 | 0.33 | 0.17 | 0.03 | −0.08 | 0.11 | 1 | ||||||||||||
| SS9 | −0.09 | −0.09 | −0.27 | 0.17 | 0.18 | 0.18 | −0.1 | −0.27 | 0.04 | 0.24 | −0.4 | 0.23 | 0.31 | 1 | |||||||||||
| SS10 | 0.11 | 0.03 | −0.18 | −0.32 | −0.11 | −0.19 | 0.12 | 0.24 | 0.12 | −0.11 | −0.08 | 0.24 | −0.31 | −0.27 | 1 | ||||||||||
| RH6 | 0.42 | 0.23 | 0.07 | −0.01 | −0.05 | −0.35 | −0.4 | −0.43 | −0.04 | −0.03 | −0.35 | 0.03 | 0.08 | 0.16 | −0.23 | 1 | |||||||||
| RH7 | 0.39 | 0.47 | −0.02 | 0.03 | −0.14 | −0.19 | −0.15 | −0.16 | −0.03 | −0.13 | −0.28 | −0.06 | 0.21 | 0.28 | −0.08 | 0.5 | 1 | ||||||||
| RH8 | −0.05 | 0.12 | 0.1 | 0.13 | 0.02 | −0.29 | −0.17 | −0.29 | −0.04 | −0.33 | −0.1 | 0.12 | 0.1 | 0.18 | −0.05 | 0.26 | 0.43 | 1 | |||||||
| RH9 | −0.01 | 0.02 | −0.05 | 0.16 | 0.03 | −0.07 | 0.2 | 0.01 | 0.06 | −0.14 | −0.06 | 0.13 | 0.05 | 0.07 | 0.03 | 0.05 | 0.38 | 0.61 | 1 | ||||||
| RH10 | −0.42 | −0.07 | 0.09 | 0.17 | 0.49 | 0.11 | 0.34 | 0.35 | 0.36 | −0.3 | −0.12 | −0.2 | 0.25 | 0.05 | −0.15 | −0.15 | 0.11 | 0.34 | 0.41 | 1 | |||||
| WS6 | 0 | −0.39 | 0.22 | −0.14 | 0.02 | −0.08 | −0.44 | −0.27 | −0.33 | 0.24 | −0.24 | 0.32 | −0.02 | 0.06 | −0.14 | 0.23 | −0.19 | −0.23 | −0.33 | −0.18 | 1 | ||||
| WS7 | −0.09 | −0.39 | 0.41 | −0.11 | 0.04 | −0.06 | −0.51 | −0.25 | −0.41 | 0.15 | −0.2 | 0.41 | −0.04 | 0.05 | −0.18 | 0.18 | −0.13 | 0 | −0.23 | −0.02 | 0.87 | 1 | |||
| WS8 | 0.01 | −0.34 | 0.19 | −0.11 | 0.24 | 0.05 | −0.41 | −0.28 | −0.29 | 0.25 | −0.11 | 0.35 | 0.12 | 0.25 | −0.37 | 0.25 | −0.23 | −0.24 | −0.39 | −0.14 | 0.76 | 0.74 | 1 | ||
| WS9 | 0.12 | −0.34 | 0.12 | −0.14 | −0.23 | −0.07 | −0.64 | −0.41 | −0.51 | 0.24 | −0.14 | 0.32 | 0.09 | 0.25 | −0.26 | 0.24 | −0.03 | −0.08 | −0.38 | −0.4 | 0.74 | 0.74 | 0.75 | 1 | |
| WS10 | 0.09 | −0.1 | 0.1 | −0.39 | −0.26 | −0.16 | −0.5 | −0.1 | −0.13 | 0.14 | −0.25 | 0.19 | −0.05 | 0.12 | −0.11 | 0.23 | −0.04 | −0.14 | −0.28 | −0.18 | 0.62 | 0.69 | 0.59 | 0.7 | 1 |
Appendix C. Autocorrelation of Rainfall, Temperature, Sunshine, Wind Speed, and Relative Humidity in the Savannah Region
| RF5 | RF6 | RF7 | RF8 | RF9 | T5 | T6 | T7 | T8 | T9 | SS5 | SS6 | SS7 | SS8 | SS9 | RH5 | RH6 | RH7 | RH8 | RH9 | WS5 | WS6 | WS7 | WS8 | WS9 | |
| RF5 | 1 | ||||||||||||||||||||||||
| RF6 | 0.02 | 1 | |||||||||||||||||||||||
| RF7 | 0.2 | −0.11 | 1 | ||||||||||||||||||||||
| RF8 | 0.02 | 0.15 | 0.05 | 1 | |||||||||||||||||||||
| RF9 | −0.18 | 0.09 | −0.05 | 0.29 | 1 | ||||||||||||||||||||
| T5 | −0.29 | −0.23 | −0.09 | 0.2 | 0.34 | 1 | |||||||||||||||||||
| T6 | −0.39 | −0.41 | 0.14 | 0.29 | 0.15 | 0.68 | 1 | ||||||||||||||||||
| T7 | −0.06 | −0.23 | −0.23 | 0.19 | 0.25 | 0.53 | 0.55 | 1 | |||||||||||||||||
| T8 | −0.23 | −0.14 | 0.01 | −0.15 | −0.02 | 0.47 | 0.22 | 0.4 | 1 | ||||||||||||||||
| T9 | 0.07 | 0.07 | −0.01 | −0.25 | −0.62 | −0.02 | −0.1 | −0.06 | 0.25 | 1 | |||||||||||||||
| SS5 | 0.13 | 0.17 | 0.11 | 0.22 | 0.08 | 0.18 | −0.03 | 0.25 | 0.08 | 0.06 | 1 | ||||||||||||||
| SS6 | 0.05 | 0 | −0.16 | 0.25 | 0.06 | 0.14 | 0.12 | −0.06 | −0.32 | 0.02 | −0.23 | 1 | |||||||||||||
| SS7 | −0.23 | 0.17 | −0.49 | −0.14 | 0.23 | 0.28 | −0.08 | 0.29 | 0.51 | −0.08 | 0.02 | −0.02 | 1 | ||||||||||||
| SS8 | −0.09 | −0.34 | 0.16 | 0 | 0.02 | 0.18 | 0.28 | 0.34 | 0.11 | −0.09 | 0.24 | 0.05 | −0.15 | 1 | |||||||||||
| SS9 | −0.1 | 0.16 | −0.06 | 0.19 | −0.37 | 0.14 | 0.12 | −0.22 | −0.1 | 0.38 | −0.25 | 0.34 | −0.1 | −0.23 | 1 | ||||||||||
| RH5 | 0.32 | 0.23 | 0.09 | −0.09 | −0.06 | −0.8 | −0.68 | −0.54 | −0.31 | −0.21 | −0.1 | −0.22 | −0.13 | −0.18 | −0.24 | 1 | |||||||||
| RH6 | 0.39 | 0.27 | 0.05 | −0.17 | −0.13 | −0.46 | −0.64 | −0.36 | −0.04 | 0.11 | 0.09 | −0.31 | 0.16 | −0.38 | −0.12 | 0.59 | 1 | ||||||||
| RH7 | 0.24 | 0.21 | 0.43 | 0.09 | −0.1 | −0.12 | −0.17 | −0.55 | 0 | −0.03 | −0.02 | −0.22 | −0.14 | −0.24 | 0.16 | 0.45 | 0.42 | 1 | |||||||
| RH8 | 0.19 | 0.14 | 0.12 | 0.3 | 0.12 | −0.1 | −0.14 | −0.2 | −0.17 | −0.36 | 0.01 | 0.19 | −0.05 | 0.14 | 0.01 | 0.32 | 0.14 | 0.36 | 1 | ||||||
| RH9 | 0.05 | −0.1 | 0.14 | 0.06 | 0.21 | −0.09 | −0.09 | −0.07 | −0.03 | −0.18 | 0.18 | −0.34 | 0.05 | −0.09 | −0.1 | 0.14 | 0.52 | 0.16 | −0.03 | 1 | |||||
| WS5 | −0.19 | 0.14 | −0.28 | 0.08 | 0.12 | 0.36 | −0.13 | 0.04 | 0.14 | 0.22 | 0.28 | 0.18 | 0.42 | 0.12 | 0.23 | −0.33 | 0.17 | −0.03 | 0.06 | 0.2 | 1 | ||||
| WS6 | −0.23 | 0.02 | −0.32 | 0.07 | 0.1 | 0.07 | −0.2 | −0.03 | −0.05 | 0.2 | 0.15 | 0.19 | 0.26 | 0.13 | 0.25 | −0.14 | 0.06 | −0.1 | 0 | 0.21 | 0.82 | 1 | |||
| WS7 | −0.13 | 0.19 | −0.32 | 0.13 | 0.18 | 0.08 | −0.27 | −0.06 | −0.09 | 0.11 | 0.19 | 0.13 | 0.31 | 0.08 | 0.3 | −0.03 | 0.16 | 0.04 | 0.17 | 0.23 | 0.84 | 0.9 | 1 | ||
| WS8 | −0.09 | 0.15 | −0.32 | 0.02 | 0.15 | 0.06 | −0.35 | −0.03 | 0.04 | 0.06 | 0.18 | −0.04 | 0.4 | 0.1 | 0.18 | 0.03 | 0.29 | 0.08 | 0.12 | 0.34 | 0.81 | 0.87 | 0.93 | 1 | |
| WS9 | −0.15 | 0.19 | −0.44 | −0.11 | 0.22 | 0.12 | −0.36 | 0.07 | 0.11 | 0.19 | 0.07 | 0.04 | 0.46 | 0.03 | 0.18 | −0.11 | 0.15 | −0.24 | −0.03 | 0.18 | 0.75 | 0.81 | 0.84 | 0.86 | 1 |
References
- Ji, Z.; Pan, Y.; Li, N. Integrating the temperature vegetation dryness index and meteorology parameters to dynamically predict crop yield with fixed date intervals using an integral regression model. Ecol. Model. 2021, 455, 109651. [Google Scholar] [CrossRef]
- Ferrante, A.; Mariani, L. Agronomic management for enhancing plant tolerance to abiotic stresses: High and low values of temperature, light intensity, and relative humidity. Horticulturae 2018, 4, 21. [Google Scholar] [CrossRef]
- Vickers, N.J. Animal communication: When I’m calling you, will you answer too? Curr. Biol. 2017, 27, R713–R715. [Google Scholar] [CrossRef] [PubMed]
- Zhuang, J.; Xu, S.; Li, G.; Zhang, Y.; Wu, J.; Liu, J. The influence of meteorological factors on wheat and rice yields in China. Crop Sci. 2018, 58, 837–852. [Google Scholar] [CrossRef]
- Kulyakwave, P.D.; Xu, S.; Yu, W. Impact of Meteorological Factors on Rice Growth Stages and Yield. Pertanika J. Sci. Technol. 2020, 28, 1009–1026. [Google Scholar]
- Zhang, P.; Zhang, J.; Chen, M. Economic impacts of climate change on agriculture: The importance of additional climatic variables other than temperature and precipitation. J. Environ. Econ. Manag. 2017, 83, 8–31. [Google Scholar] [CrossRef]
- Chung, N.T.; Jintrawet, A.; Promburom, P. Impacts of seasonal climate variability on rice production in the central highlands of Vietnam. Agric. Agric. Sci. Procedia 2015, 5, 83–88. [Google Scholar] [CrossRef]
- FAO. World Food Situation. 2022. Available online: https://www.fao.org/worldfoodsituation/csdb/en (accessed on 10 November 2022).
- Togolese agricultural data center (DSID). Cereal production in Togo; DSID: Lomé, Togo, 2021. [Google Scholar]
- Affoh, R.; Zheng, H.; Dangui, K.; Dissani, B.M. The Impact of Climate Variability and Change on Food Security in Sub-Saharan Africa: Perspective from Panel Data Analysis. Sustainability 2022, 14, 759. [Google Scholar] [CrossRef]
- Zhao, C.; Liu, B.; Piao, S.; Wang, X.; Lobell, D.B.; Huang, Y.; Huang, M.; Yao, Y.; Bassu, S.; Ciais, P. Temperature increase reduces global yields of major crops in four independent estimates. Proc. Natl. Acad. Sci. USA 2017, 114, 9326–9331. [Google Scholar] [CrossRef]
- De Leon, M.R.; Jalao, E.R. Prediction Model Framework for Imbalanced Datasets. In Proceedings of the Data Analytics 2014: The Third International Conference on Data Analytics, Rome, Italy, 24–28 August 2014; pp. 33–41. [Google Scholar]
- Dwamena, H.A.; Tawiah, K.; Akuoko Kodua, A.S. The Effect of Rainfall, Temperature, and Relative Humidity on the Yield of Cassava, Yam, and Maize in the Ashanti Region of Ghana. Int. J. Agron. 2022, 2022, 9077383. [Google Scholar] [CrossRef]
- Boansi, D. Effect of climatic and non-climatic factors on cassava yields in Togo: Agricultural policy implications. Climate 2017, 5, 28. [Google Scholar] [CrossRef]
- Ali, E. Impact of climate variability on staple food crops production in Northern Togo. J. Agric. Environ. Int. Dev. 2018, 112, 321–341. [Google Scholar] [CrossRef]
- Koudahe, K.; Koffi, D.; Kayode, J.; Awokola, S.; Adebola, A. Impact of climate variability on crop yields in southern Togo. Environ. Pollut. Clim. Chang. 2018, 2, 1–9. [Google Scholar] [CrossRef]
- Gadedjisso-Tossou, A.; Adjegan, K.I.; Kablan, A.K. Rainfall and Temperature Trend Analysis by Mann–Kendall Test and Significance for Rainfed Cereal Yields in Northern Togo. Science 2021, 3, 17. [Google Scholar] [CrossRef]
- Yu, W.; Wang, Y.; Li, D.; Xu, S.; Abdul-Gafar, A. Could Rice Yield Change Be Caused by Weather? J. Agric. Food Chem. 2016, 5, 31–37. [Google Scholar] [CrossRef][Green Version]
- United Nations Development Programme, UNDP. L’impact des Changements Climatiques: Analyse des Volets Relatifs à la Pauvreté au Togo. Rapport Final; UNDP: New York, NY, USA, 2011. [Google Scholar]
- Ministry of Environment and Forest Resources (MEFR). First Biennial Updated Report; MEFR: Lomé, Togo, 2017. [Google Scholar]
- World Bank Group. Climate Risk Profile: Togo. 2021. Available online: https://climateknowledgeportal.worldbank.org/sites/default/files/201810/wb_gfdrr_climate_change_country_profile_for_TGO.pdf (accessed on 10 November 2022).
- Dabija, A.; Ciocan, M.E.; Chetrariu, A.; Codină, G.G. Maize and sorghum as raw materials for brewing, a review. Appl. Sci. 2021, 11, 3139. [Google Scholar] [CrossRef]
- Hakeem, A.A.; Akinseye, F.M.; Ayuba Kunihya, J.J. Sorghum productivity, water use efficiency and P-Use efficiency in relation to cultivars and phosphorus fertilizer levels in Sudan Savanna zone of Nigeria. Glob. Adv. Res. J. Agric. Sci. 2018, 7, 245–257. [Google Scholar]
- Ajeigbe, H.A.; Akinseye, F.M.; Ayuba, K.; Jonah, J.J. Productivity and water use efficiency of sorghum [Sorghum bicolor (L.) moench] grown under different nitrogen applications in Sudan savanna zone, Nigeria. Int. J. Agron. Agric. Res. 2018, 2018, 7676058. [Google Scholar] [CrossRef]
- Yue, Y.; Li, J.-H.; Fan, L.-F.; Zhang, L.-L.; Zhao, P.-F.; Zhou, Q.; Wang, N.; Wang, Z.-Y.; Huang, L.; Dong, X.H. Prediction of maize growth stages based on deep learning. Comput. Electron. Agric. 2020, 172, 105351. [Google Scholar] [CrossRef]
- Dang, Y.; Qin, L.; Huang, L.; Wang, J.; Li, B.; He, H. Water footprint of rain-fed maize in different growth stages and associated climatic driving forces in Northeast China. Agric. Water Manag. 2022, 263, 107463. [Google Scholar] [CrossRef]
- Guo, E.; Liu, X.; Zhang, J.; Wang, Y.; Wang, C.; Wang, R.; Li, D. Assessing spatiotemporal variation of drought and its impact on maize yield in Northeast China. J. Hydrol. 2017, 553, 231–247. [Google Scholar] [CrossRef]
- Zhang, F.; Chen, Y.; Zhang, J.; Guo, E.; Wang, R.; Li, D. Dynamic drought risk assessment for maize based on crop simulation model and multi-source drought indices. J. Clean. Prod. 2019, 233, 100–114. [Google Scholar] [CrossRef]
- Rao, S.; Elangovan, M.; Umakanth, A.; Seetharama, N. Characterizing phenology of sorghum hybrids in relation to production management for high yields. NRCS-ICRISAT Learn. Program Sorghum Hybrids Parents Hybrids Res. Dev. 2007, 2007, 6–17. [Google Scholar]
- Dell, M.; Jones, B.F.; Olken, B.A. What do we learn from the weather? The new climate-economy literature. J. Econ. Lit. 2014, 52, 740–798. [Google Scholar] [CrossRef]
- Fisher, R.A. Statistical methods for research workers. In Breakthroughs in Statistics; Springer: New York, NY, USA, 1925; pp. 66–70. [Google Scholar]
- Kim, H.-Y. Statistical notes for clinical researchers: Assessing normal distribution (2) using skewness and kurtosis. Restor. Dent. Endod. 2013, 38, 52–54. [Google Scholar] [CrossRef]
- Liu, Y.; Wang, E.; Yang, X.; Wang, J. Contributions of climatic and crop varietal changes to crop production in the North China Plain, since 1980s. Glob. Chang. Biol. 2010, 16, 2287–2299. [Google Scholar] [CrossRef]
- Zhao, X.; Fitzgerald, M. Climate change: Implications for the yield of edible rice. PLoS ONE 2013, 8, e66218. [Google Scholar] [CrossRef]
- Zhao, J.; Pu, F.; Li, Y.; Xu, J.; Li, N.; Zhang, Y.; Guo, J.; Pan, Z. Assessing the combined effects of climatic factors on spring wheat phenophase and grain yield in Inner Mongolia, China. PLoS ONE 2017, 12, e0185690. [Google Scholar] [CrossRef]
- Yin, G.; Gu, J.; Zhang, F.; Hao, L.; Cong, P.; Liu, Z. Maize yield response to water supply and fertilizer input in a semi-arid environment of Northeast China. PLoS ONE 2014, 9, e86099. [Google Scholar] [CrossRef]
- Prasad, P.; Pisipati, S.; Momčilović, I.; Ristic, Z. Independent and combined effects of high temperature and drought stress during grain filling on plant yield and chloroplast EF-Tu expression in spring wheat. J. Agron. Crop Sci. 2011, 197, 430–441. [Google Scholar] [CrossRef]
- Sehgal, A.; Sita, K.; Kumar, J.; Kumar, S.; Singh, S.; Siddique, K.H.; Nayyar, H. Effects of drought, heat and their interaction on the growth, yield and photosynthetic function of lentil (Lens culinaris Medikus) genotypes varying in heat and drought sensitivity. Front. Plant Sci. 2017, 8, 1776. [Google Scholar] [CrossRef] [PubMed]
- Song, L.; Jin, J.; He, J. Effects of severe water stress on maize growth processes in the field. Sustainability 2019, 11, 5086. [Google Scholar] [CrossRef]
- Cakir, R. Effect of water stress at different development stages on vegetative and reproductive growth of corn. Field Crops Res. 2004, 89, 1–16. [Google Scholar] [CrossRef]
- NeSmith, D.; Ritchie, J. Short-and long-term responses of corn to a pre-anthesis soil water deficit. J. Agron. 1992, 84, 107–113. [Google Scholar] [CrossRef]
- Tack, J.; Lingenfelser, J.; Jagadish, S.K. Disaggregating sorghum yield reductions under warming scenarios exposes narrow genetic diversity in US breeding programs. Proc. Natl. Acad. Sci. USA 2017, 114, 9296–9301. [Google Scholar] [CrossRef]
- Prasad, P.; Djanaguiraman, M.; Jagadish, S.; Ciampitti, I. Drought and high temperature stress and traits associated with tolerance. Sorghum A State Art Future Perspetives 2019, 58, 241–265. [Google Scholar] [CrossRef]
- Tonapi, V.A.; Talwar, H.S.; Are, A.K.; Bhat, B.V.; Reddy, C.R.; Dalton, T.J. Sorghum in the 21st Century: Food, Fodder, Feed, Fuel for a Rapidly Changing World; Springer: Singapore, 2020. [Google Scholar] [CrossRef]
- Dangui, K.; Jia, S. Water Infrastructure Performance in Sub-Saharan Africa: An Investigation of the Drivers and Impact on Economic Growth. Water 2022, 14, 3522. [Google Scholar] [CrossRef]
- Togolese meteorological center (DGMN). Meteorological Data; DGMN: Lomé, Togo, 2021. [Google Scholar]
- Wang, N.; Huang, H.-J.; Ren, S.-T.; Li, J.-J.; Sun, Y.; Sun, D.-Y.; Zhang, S.-Q. The rice wall-associated receptor-like kinase gene OsDEES1 plays a role in female gametophyte development. Plant Physiol. 2012, 160, 696–707. [Google Scholar] [CrossRef]
- Schauberger, B.; Archontoulis, S.; Arneth, A.; Balkovic, J.; Ciais, P.; Deryng, D.; Elliott, J.; Folberth, C.; Khabarov, N.; Müller, C. Consistent negative response of US crops to high temperatures in observations and crop models. Nat. Commun. 2017, 8, 1–9. [Google Scholar] [CrossRef]
- Yang, H.; Lu, D.; Shen, X.; Cai, X.; Lu, W. Heat stress at different grain filling stages affects fresh waxy maize grain yield and quality. Cereal Chem. 2015, 92, 258–264. [Google Scholar] [CrossRef]
- Siebers, M.H.; Slattery, R.A.; Yendrek, C.R.; Locke, A.M.; Drag, D.; Ainsworth, E.A.; Bernacchi, C.J.; Ort, D.R. Simulated heat waves during maize reproductive stages alter reproductive growth but have no lasting effect when applied during vegetative stages. Agric. Ecosyst. Environ. 2017, 240, 162–170. [Google Scholar] [CrossRef]
- Prasad, P.; Djanaguiraman, M.; Perumal, R.; Ciampitti, I.A. Impact of high temperature stress on floret fertility and individual grain weight of grain sorghum: Sensitive stages and thresholds for temperature and duration. Front. Plant Sci. 2015, 6, 820. [Google Scholar] [CrossRef] [PubMed]
- Sunoj, V.J.; Somayanda, I.M.; Chiluwal, A.; Perumal, R.; Prasad, P.V.; Jagadish, S.K. Resilience of pollen and post-flowering response in diverse sorghum genotypes exposed to heat stress under field conditions. Crop Sci. 2017, 57, 1658–1669. [Google Scholar] [CrossRef]
- Abdel-Ghani, A.H.; Kumar, B.; Pace, J.; Jansen, C.; Gonzalez-Portilla, P.J.; Reyes-Matamoros, J.; San Martin, J.P.; Lee, M.; Lübberstedt, T. Association analysis of genes involved in maize (Zea mays L.) root development with seedling and agronomic traits under contrasting nitrogen levels. Plant Mol. Biol. 2015, 88, 133–147. [Google Scholar] [CrossRef]
- World Agro Meteorological Information Service (WAMIS). Agrometeorology of Some Selected Crops. 2011. Available online: http://www.wamis.org/agm/gamp/GAMP_Chap10.pdf (accessed on 15 June 2022).
- Potuschak, T.; Bachmair, A. Seedling germination: Seedlings follow sunshine and fresh air. Curr. Biol. 2015, 25, R565–R566. [Google Scholar] [CrossRef]
- Jing, L.Q.; Wu, Y.Z.; Zhuang, S.T.; Wang, Y.X.; Zhu, J.G.; Wang, Y.L.; Yang, L.X. Effects of CO2 enrichment and spikelet removal on rice quality under open-air field conditions. J. Integr. Agric. 2016, 15, 2012–2022. [Google Scholar] [CrossRef]
- Szambelan, K.; Nowak, J.; Szwengiel, A.; Jeleń, H. Comparison of sorghum and maize raw distillates: Factors affecting ethanol efficiency and volatile by-product profile. J. Cereal Sci. 2020, 91, 102863. [Google Scholar] [CrossRef]
- Xu, S.; Yu, W.; Liu, S.; Ahmed, A.; Wang, Y. Meteorological impact on the winter wheat yield in Weishan, China. Res. J. Appl. Sci. 2013, 13, 2740–2743. [Google Scholar] [CrossRef]
- Sharma, O.P.; Kannan, N.; Cook, S.; Pokhrel, B.K.; McKenzie, C. Analysis of the effects of high precipitation in Texas on rainfed sorghum yields. Water 2019, 11, 1920. [Google Scholar] [CrossRef]
- Burgess, A.J.; Retkute, R.; Preston, S.P.; Jensen, O.E.; Pound, M.P.; Pridmore, T.P.; Murchie, E.H. The 4-dimensional plant: Effects of wind-induced canopy movement on light fluctuations and photosynthesis. Front. Plant Sci. 2016, 7, 1392. [Google Scholar] [CrossRef]
- Ohsumi, A.; Hamasaki, A.; Nakagawa, H.; Homma, K.; Horie, T.; Shiraiwa, T. Response of leaf photosynthesis to vapor pressure difference in rice (Oryza sativa L.) varieties in relation to stomatal and leaf internal conductance. Plant Prod. Sci. 2008, 11, 184–191. [Google Scholar] [CrossRef]
- Pantin, F.; Simonneau, T.; Rolland, G.; Dauzat, M.; Muller, B. Control of leaf expansion: A developmental switch from metabolics to hydraulics. Plant Physiol. 2011, 156, 803–815. [Google Scholar] [CrossRef] [PubMed]
- Kuwagata, T.; Ishikawa-Sakurai, J.; Hayashi, H.; Nagasuga, K.; Fukushi, K.; Ahamed, A.; Takasugi, K.; Katsuhara, M.; Murai-Hatano, M. Influence of low air humidity and low root temperature on water uptake, growth and aquaporin expression in rice plants. Plant Cell Physiol. 2012, 53, 1418–1431. [Google Scholar] [CrossRef] [PubMed]
- Weerakoon, W.; Maruyama, A.; Ohba, K. Impact of humidity on temperature-induced grain sterility in rice (Oryza sativa L.). J. Agron. Crop Sci. 2008, 194, 135–140. [Google Scholar] [CrossRef]
- Stuerz, S.; Asch, F. Responses of rice growth to day and night temperature and relative air humidity—Dry matter, leaf area, and partitioning. Plants 2019, 8, 521. [Google Scholar] [CrossRef] [PubMed]
- Stuerz, S.; Asch, F. Responses of rice growth to day and night temperature and relative air humidity—Leaf elongation and assimilation. Plants 2021, 10, 134. [Google Scholar] [CrossRef]
- Roriz, M.; Carvalho, S.M.; Vasconcelos, M.W. High relative air humidity influences mineral accumulation and growth in iron deficient soybean plants. Front. Plant Sci. 2014, 5, 726. [Google Scholar] [CrossRef]
- Hatfield, J.L.; Prueger, J.H. Temperature extremes: Effect on plant growth and development. Weather Clim. Extrem. 2015, 10, 4–10. [Google Scholar] [CrossRef]
- Romero, F.; Cazzato, S.; Walder, F.; Vogelgsang, S.; Bender, S.F.; van der Heijden, M.G. Humidity and high temperature are important for predicting fungal disease outbreaks worldwide. New Phytol. 2022, 234, 1553–1556. [Google Scholar] [CrossRef]
- Gadédjisso-Tossou, A.; Avellán, T.; Schütze, N. Potential of deficit and supplemental irrigation under climate variability in northern Togo, West Africa. Water 2018, 10, 1803. [Google Scholar] [CrossRef]


| Region | Growth Stage | ||||
|---|---|---|---|---|---|
| Emergence | Jointing (Booting) | Tasselling (Flowering) | Milk (Grain-Filling) | Physiological Maturity | |
| Maize | |||||
| Plateau | March | April | May | June | July |
| Central | June | July | August | September | October |
| Savannah | May | June | July | August | September |
| Sorghum | |||||
| Plateau | May | June | July | August | September |
| Central | June | July | August | September | October |
| Savannah | May | June | July | August | September |
| Crop | Obs | Mean | Min | Max | Variance | Std. Dev | Kurtosis | Skew |
|---|---|---|---|---|---|---|---|---|
| Plateau | ||||||||
| Maize | 30 | 1392.85 | 963.15 | 1962.42 | 59,143.35 | 243.19 | 3.48 | 0.57 |
| Sorghum | 30 | 1038.02 | 591.1 | 1433.92 | 55,500.29 | 235.59 | 2.28 | −0.29 |
| Central | ||||||||
| Maize | 30 | 1423.57 | 943.76 | 1812.07 | 54,246.48 | 237.29 | 2.20 | −0.54 |
| Sorghum | 30 | 839.365 | 488.25 | 1538.94 | 38,443.11 | 196.07 | 7.49 | 1.90 |
| Savannah | ||||||||
| Maize | 30 | 1218.99 | 606.16 | 1745.35 | 54,228.26 | 232.87 | 4.10 | 0.18 |
| Sorghum | 30 | 915.91 | 303.39 | 1435.34 | 99,545.95 | 315.51 | 1.94 | −0.33 |
| Crop | Variable | Coef | Std. Err | R2 |
|---|---|---|---|---|
| Plateau | ||||
| Maize | year | 1.40 | 5.21 | 0.00 |
| cons | −1411.40 | 10,451.43 | ||
| Sorghum | year | −4.21 | 4.99 | 0.02 |
| cons | 9468.74 | 10,011.44 | ||
| Central | ||||
| Maize | year | 17.37 *** | 3.89 | 0.42 |
| cons | −33,399.22 *** | 7807.13 | ||
| Sorghum | year | 8.98 ** | 3.85 | 0.16 |
| cons | −17,151.12 ** | 7721.66 | ||
| Savannah | ||||
| Maize | year | −2.57 | 4.98 | |
| cons | 6372.51 | 9973.14 | ||
| Sorghum | year | 27.14 *** | 4.42 | 0.57 |
| cons | −53,482.85 *** | 8867.71 | ||
| Maize | Sorghum | ||||||||
|---|---|---|---|---|---|---|---|---|---|
| Variable | Model 1 | Model 2 | Variable | Model 1 | Model 2 | ||||
| Coefficient | Std.Err | Coefficient | Std.Err | Coefficient | Std.Err | Coefficient | Std.Err | ||
| Plateau | |||||||||
| RH | −68.29 | 31.23 | RF | 2.32 ** | 1.10 | 2.32 ** | 1.10 | ||
| cons | 1392.85 *** | 44.4 | 6796.13 ** | 2471.06 | cons | 589.13 ** | 216.16 | 589.13 ** | 216.16 |
| F test | F(0, 29) = 0 | F(1, 28) = 4.78 | F test | F(1, 28) = 4.47 | F(1, 28) = 4.47 | ||||
| R2 | 0 | 0.15 | R2 | 0.14 | 0.14 | ||||
| Adj R2 | 0 | 0.12 | Adj R2 | 0.11 | 0.11 | ||||
| Central | |||||||||
| WS | −590.69 *** | 195.31 | WS | −530.41 *** | 155.43 | ||||
| cons | 1423.57 *** | 43.32 | 1841.38 *** | 143.35 | cons | 839.36*** | 35.80 | 1214.37 *** | 114.07 |
| F test | F(0, 29) = 0 | F(1, 28) = 9.15 | F test | F(0, 29) = 0 | F(1, 28) = 11.65 | ||||
| R2 | 0 | 0.25 | R2 | 0 | 0.2938 | ||||
| Adj R2 | 0 | 0.22 | Adj R2 | 0 | 0.2685 | ||||
| Savannah | |||||||||
| T | −192.71 * | 104.48 | −184.26 * | 91.16 | RH | 6.8 * | 3.44 | ||
| cons | 6518.09 ** | 2873.25 | 6306.42 ** | 2506.77 | T | 396.91 *** | 129.80 | 427.63 *** | 124.53 |
| F test | F(1, 28) = 3.4 | F(1, 27) = 4.09 | cons | −9998.13 *** | 3569.44 | −11,347.7 *** | 3465.97 | ||
| R2 | 0.11 | 0.13 | F test | F(1, 28) = 9.35 | F(2, 27) = 7.11 | ||||
| Adj R2 | 0.08 | 0.10 | R2 | 0.25 | 0.34 | ||||
| Adj R2 | 0.22 | 0.30 | |||||||
| Maize | Sorghum | ||||||||
|---|---|---|---|---|---|---|---|---|---|
| Variable | Model 1 | Model 2 | Variable | Model 1 | Model 2 | ||||
| Coef | Std.Err | Coef | Std.Err | Coef | Std.Err | Coef | Std.Err | ||
| Plateau | |||||||||
| RF0 | 1.92 ** | 0.31 | 1.11 *** | 0.23 | RF0 | 0.50** | 0.21 | 0.4 ** | 0.17 |
| RF1 | −1.23 * | 0.12 | RF1 | −0.30 * | 0.11 | ||||
| T3 | −31.25 * | 15.59 | −46.25 *** | 12.02 | WS1 | −128.69 * | 68.63 | ||
| SS1 | 32.91 ** | 14.22 | 38.31 *** | 10.12 | RH3 | −31.14 ** | 12.9 | ||
| WS2 | −83.46 ** | 37.97 | cons | −486.42 ** | 209.97 | −136.26 ** | 61.87 | ||
| RH0 | −17.79 *** | 5.16 | F test | F(1, 28) = 5.56 | F(3, 26) = 3.05 | ||||
| cons | 241.39 * | 115.75 | 7348.21 *** | 2065.44 | R2 | 0.17 | 0.26 | ||
| F test | F(4, 25) = 3.25 | F(5, 24) = 9.77 | Adj R2 | 0.14 | 0.18 | ||||
| R2 | 0.34 | 0.67 | |||||||
| Adj R2 | 0.24 | 0.6 | |||||||
| Central | |||||||||
| RF0 | 0.35 * | 0.18 | 0.54 ** | 0.21 | RF0 | 0.35 ** | 0.16 | 0.48 *** | 0.15 |
| RF3 | −0.35 * | 0.17 | RF3 | −0.13 ** | 0.04 | ||||
| T1 | 52.98 * | 28.58 | T2 | 24.17 ** | 10.79 | 29.57 ** | 10.1 | ||
| T2 | −39.17 ** | 17.28 | T3 | −134.47 *** | 35.2 | −150.04 *** | 31.91 | ||
| SS0 | −39.59 * | 19.28 | −77.67 *** | 21.61 | T4 | 15.91 * | 8.56 | 20.19 ** | 7.67 |
| SS1 | −26.69 * | 14.66 | SS0 | −26.97 * | 14.74 | ||||
| SS3 | −26.28 * | 12.45 | −50.39 *** | 13.07 | WS0 | −63.47 ** | 27.13 | ||
| WS2 | −84.97 * | 34.33 | cons | −181.06 ** | 65.52 | 653.84 * | 366.25 | ||
| WS3 | 50.33 ** | 26.66 | F test | F(5, 24) = 5.06 | F(7, 22) = 5.97 | ||||
| WS4 | −76.79 ** | 36.39 | R2 | 0.51 | 0.66 | ||||
| RH2 | −10.65 ** | 3.89 | Adj R2 | 0.41 | 0.55 | ||||
| cons | 941.20 * | 456.35 | 2137.80 *** | 552.48 | |||||
| F test | F(3, 26) = 4 | F(11, 18) = 4.12 | |||||||
| R2 | 0.32 | 0.72 | |||||||
| Adj R2 | 0.24 | 0.54 | |||||||
| Savannah | |||||||||
| −0.91 * | 0.12 | T3 SS2 | −29.54 ** | 12.86 | −51.08 * | ||||
| RF4 T2 | −0.76 *** −153.72 *** | 0.15 28.02 | WS2 | 101.98 ** | |||||
| T3 | −81.38 ** | 27.04 | WS3 | 91.90 ** | |||||
| SS0 | −67.38 *** | 16.38 | RH2 | 8.01 * | |||||
| SS2 | 36.46 ** | 11.27 | cons | 110.42 * | 59.54 | 246.44 ** | |||
| SS4 | −20.56 *** | 4.49 | F test | F(1,28) = 5.27 | F(5, 23) = 2.66 | ||||
| WS1 | −76.05 *** | 36.36 | R2 | 0.16 | 0.37 | ||||
| WS2 | 109.12 *** | 47.82 | Adj R2 | 0.13 | 0.23 | ||||
| WS3 | 95.42 ** | 50.41 | |||||||
| RH0 | 5.02 ** | 1.82 | |||||||
| RH3 | 4.12 ** | 1.35 | |||||||
| cons | 0 | 42.31 | 649.37 | 843.24 | |||||
| F test | F(0, 29) = 0 | F(11, 17) = 6.88 | |||||||
| R2 | 0 | 0.82 | |||||||
| Adj R2 | 0 | 0.7 | |||||||
| Month | φ0 | φ1 | φ2 | φ3 | φ4 |
|---|---|---|---|---|---|
| 1 | 1 | −2 | 2 | −1 | 1 |
| 2 | 1 | −1 | −1 | 2 | −4 |
| 3 | 1 | 0 | −2 | 0 | 6 |
| 4 | 1 | 1 | −1 | −2 | −4 |
| 5 | 1 | 2 | 2 | 1 | 1 |
| Variable | Region | Unit | Growth Stage | ||||
|---|---|---|---|---|---|---|---|
| Emergence | Jointing | Tasselling | Milk | Physiological Maturity | |||
| Model 1 | |||||||
| Rainfall | Plateau | Kg/ha/mm | 4.38 | 3.15 | 1.92 | 0.69 | −0.54 |
| Central | 0.35 | 0.35 | 0.35 | 0.35 | 0.35 | ||
| Temperature | Plateau | Kg/ha/°C | 31.25 | −62.51 | 0 | 62.51 | −31.25 |
| Sunshine | Plateau | Kg/ha/h | −65.83 | −32.91 | 0 | 32.91 | 65.83 |
| Central | −13.31 | −92.15 | −39.59 | 12.96 | −65.87 | ||
| Model 2 | |||||||
| Plateau | Kg/ha/mm | 1.11 | 1.11 | 1.11 | 1.11 | 1.11 | |
| Rainfall | Central | 0.89 | 0.89 | 0.54 | 0.19 | −0.16 | |
| Savannah | 0.15 | 1.22 | 0 | 1.06 | −1.43 | ||
| Temperature | Plateau | Kg/ha/°C | 46.25 | −92.51 | 0 | 92.51 | −46.25 |
| Central | −184.31 | −13.8 | 78.35 | 92.15 | 27.61 | ||
| Savannah | −226.05 | −9.05 | 307.43 | 316.48 | −388.82 | ||
| Sunshine | Plateau | −76.63 | −38.31 | 0 | 38.31 | 76.63 | |
| Central | Kg/ha/h | 26.09 | −151.77 | −77.67 | −3.57 | −181.44 | |
| Savannah | −15.03 | −21.59 | −263.67 | −21.59 | −15.03 | ||
| Wind | Plateau | Kg/ha/m/s | −166.93 | 83.46 | 166.93 | 83.46 | −166.93 |
| Central | −297.06 | 492.79 | −290.80 | 291.47 | −196.39 | ||
| Savannah | 274.92 | 157.77 | −218.24 | −376.01 | 161.56 | ||
| Humidity | Plateau | Kg/ha/% | −17.79 | −17.79 | −17.79 | −17.79 | −17.79 |
| Central | −21.31 | 10.65 | 21.31 | 10.65 | −21.31 | ||
| Savannah | 0.9 | 13.25 | 5.02 | −3.21 | 9.13 | ||
Disclaimer/Publisher’s Note: The statements, opinions and data contained in all publications are solely those of the individual author(s) and contributor(s) and not of MDPI and/or the editor(s). MDPI and/or the editor(s) disclaim responsibility for any injury to people or property resulting from any ideas, methods, instructions or products referred to in the content. |
© 2022 by the authors. Licensee MDPI, Basel, Switzerland. This article is an open access article distributed under the terms and conditions of the Creative Commons Attribution (CC BY) license (https://creativecommons.org/licenses/by/4.0/).
Share and Cite
Affoh, R.; Zheng, H.; Zhang, X.; Yu, W.; Qu, C. Influences of Meteorological Factors on Maize and Sorghum Yield in Togo, West Africa. Land 2023, 12, 123. https://doi.org/10.3390/land12010123
Affoh R, Zheng H, Zhang X, Yu W, Qu C. Influences of Meteorological Factors on Maize and Sorghum Yield in Togo, West Africa. Land. 2023; 12(1):123. https://doi.org/10.3390/land12010123
Chicago/Turabian StyleAffoh, Raïfatou, Haixia Zheng, Xuebiao Zhang, Wen Yu, and Chunhong Qu. 2023. "Influences of Meteorological Factors on Maize and Sorghum Yield in Togo, West Africa" Land 12, no. 1: 123. https://doi.org/10.3390/land12010123
APA StyleAffoh, R., Zheng, H., Zhang, X., Yu, W., & Qu, C. (2023). Influences of Meteorological Factors on Maize and Sorghum Yield in Togo, West Africa. Land, 12(1), 123. https://doi.org/10.3390/land12010123