
Development and Psychometric Validation of Tinnitus Qualities and Impact Questionnaire

 , , , , ,

Abstract
1. Introduction
2. Method
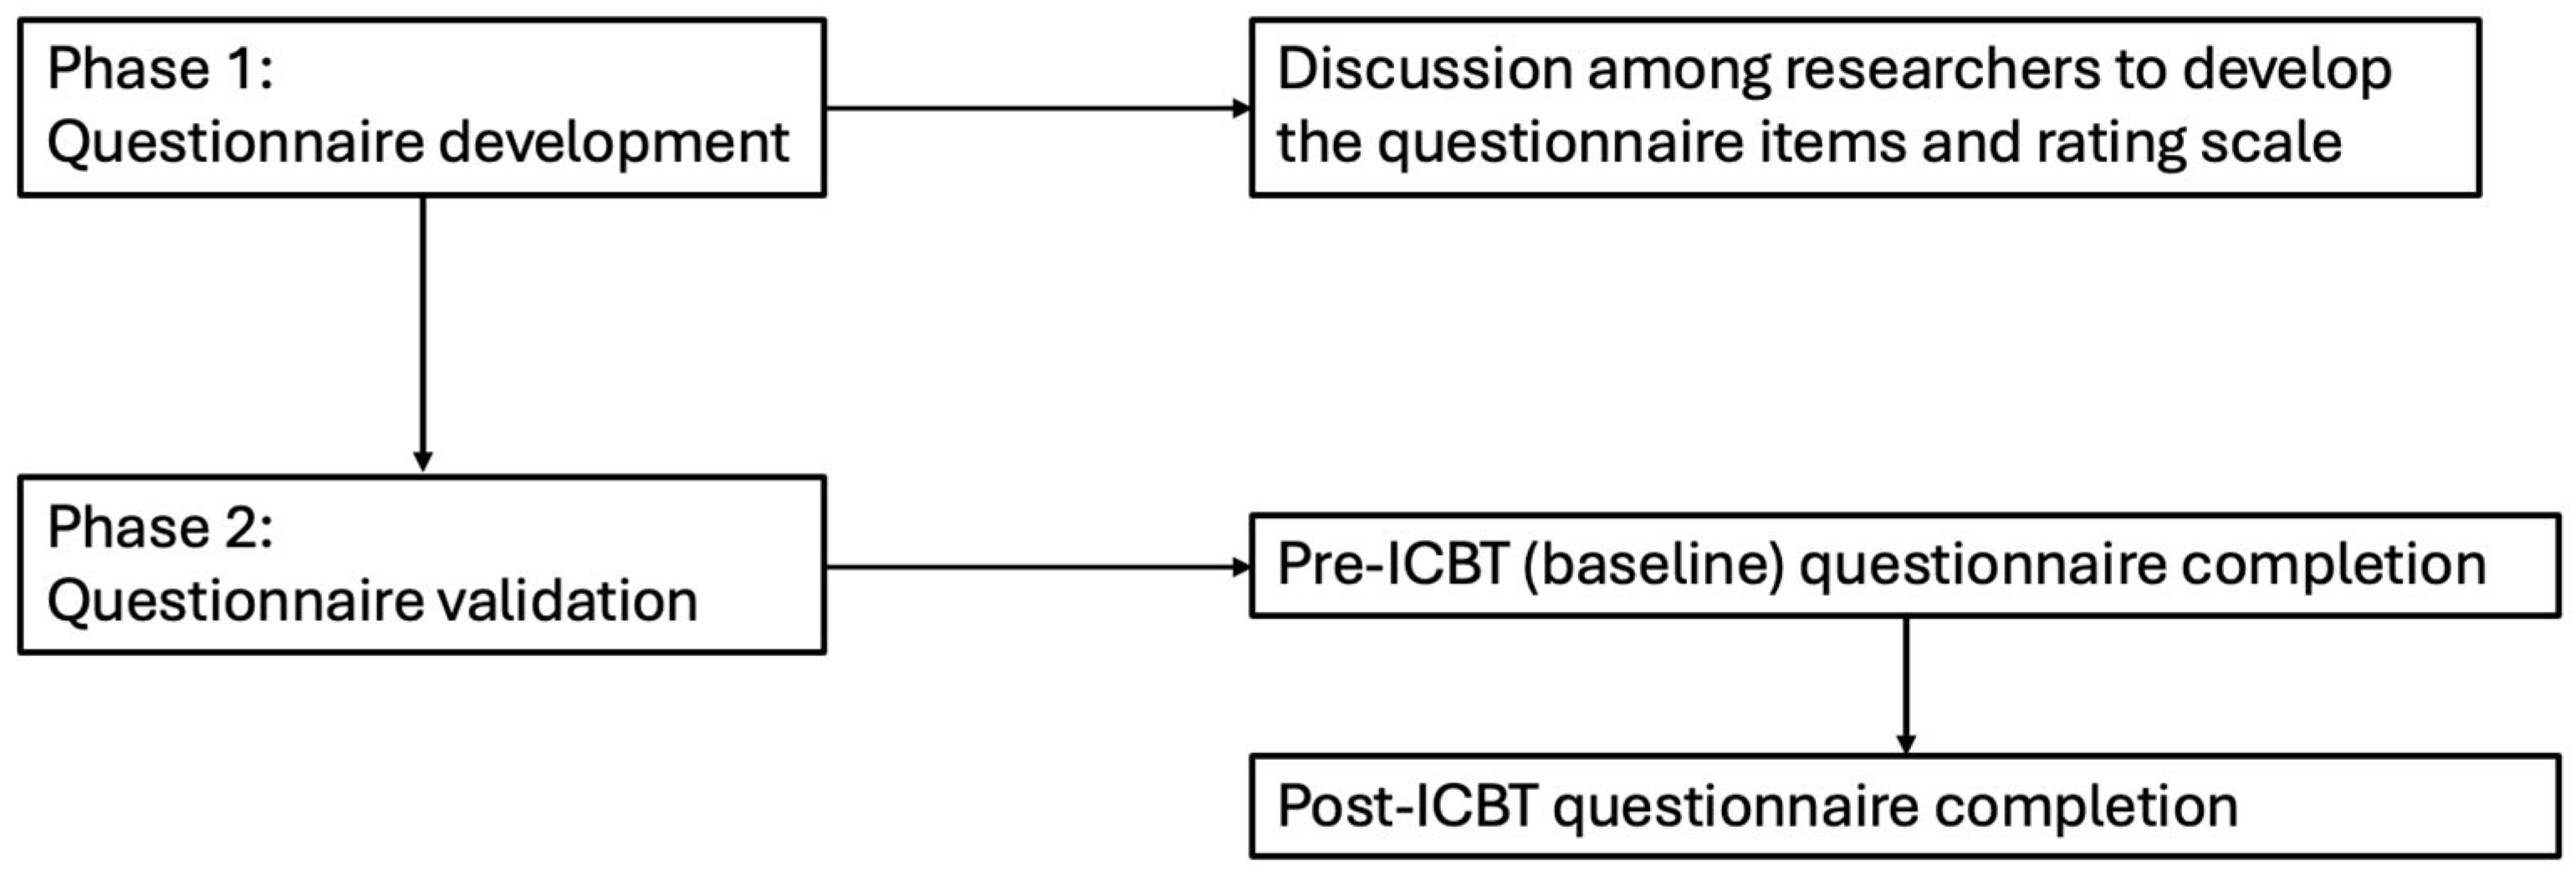
2.1. Study Design
2.2. Participants
2.3. Data Collection
2.4. Data Analysis
3. Results
3.1. Phase I: Questionnaire Development
3.2. Phase II: Psychometric Validation
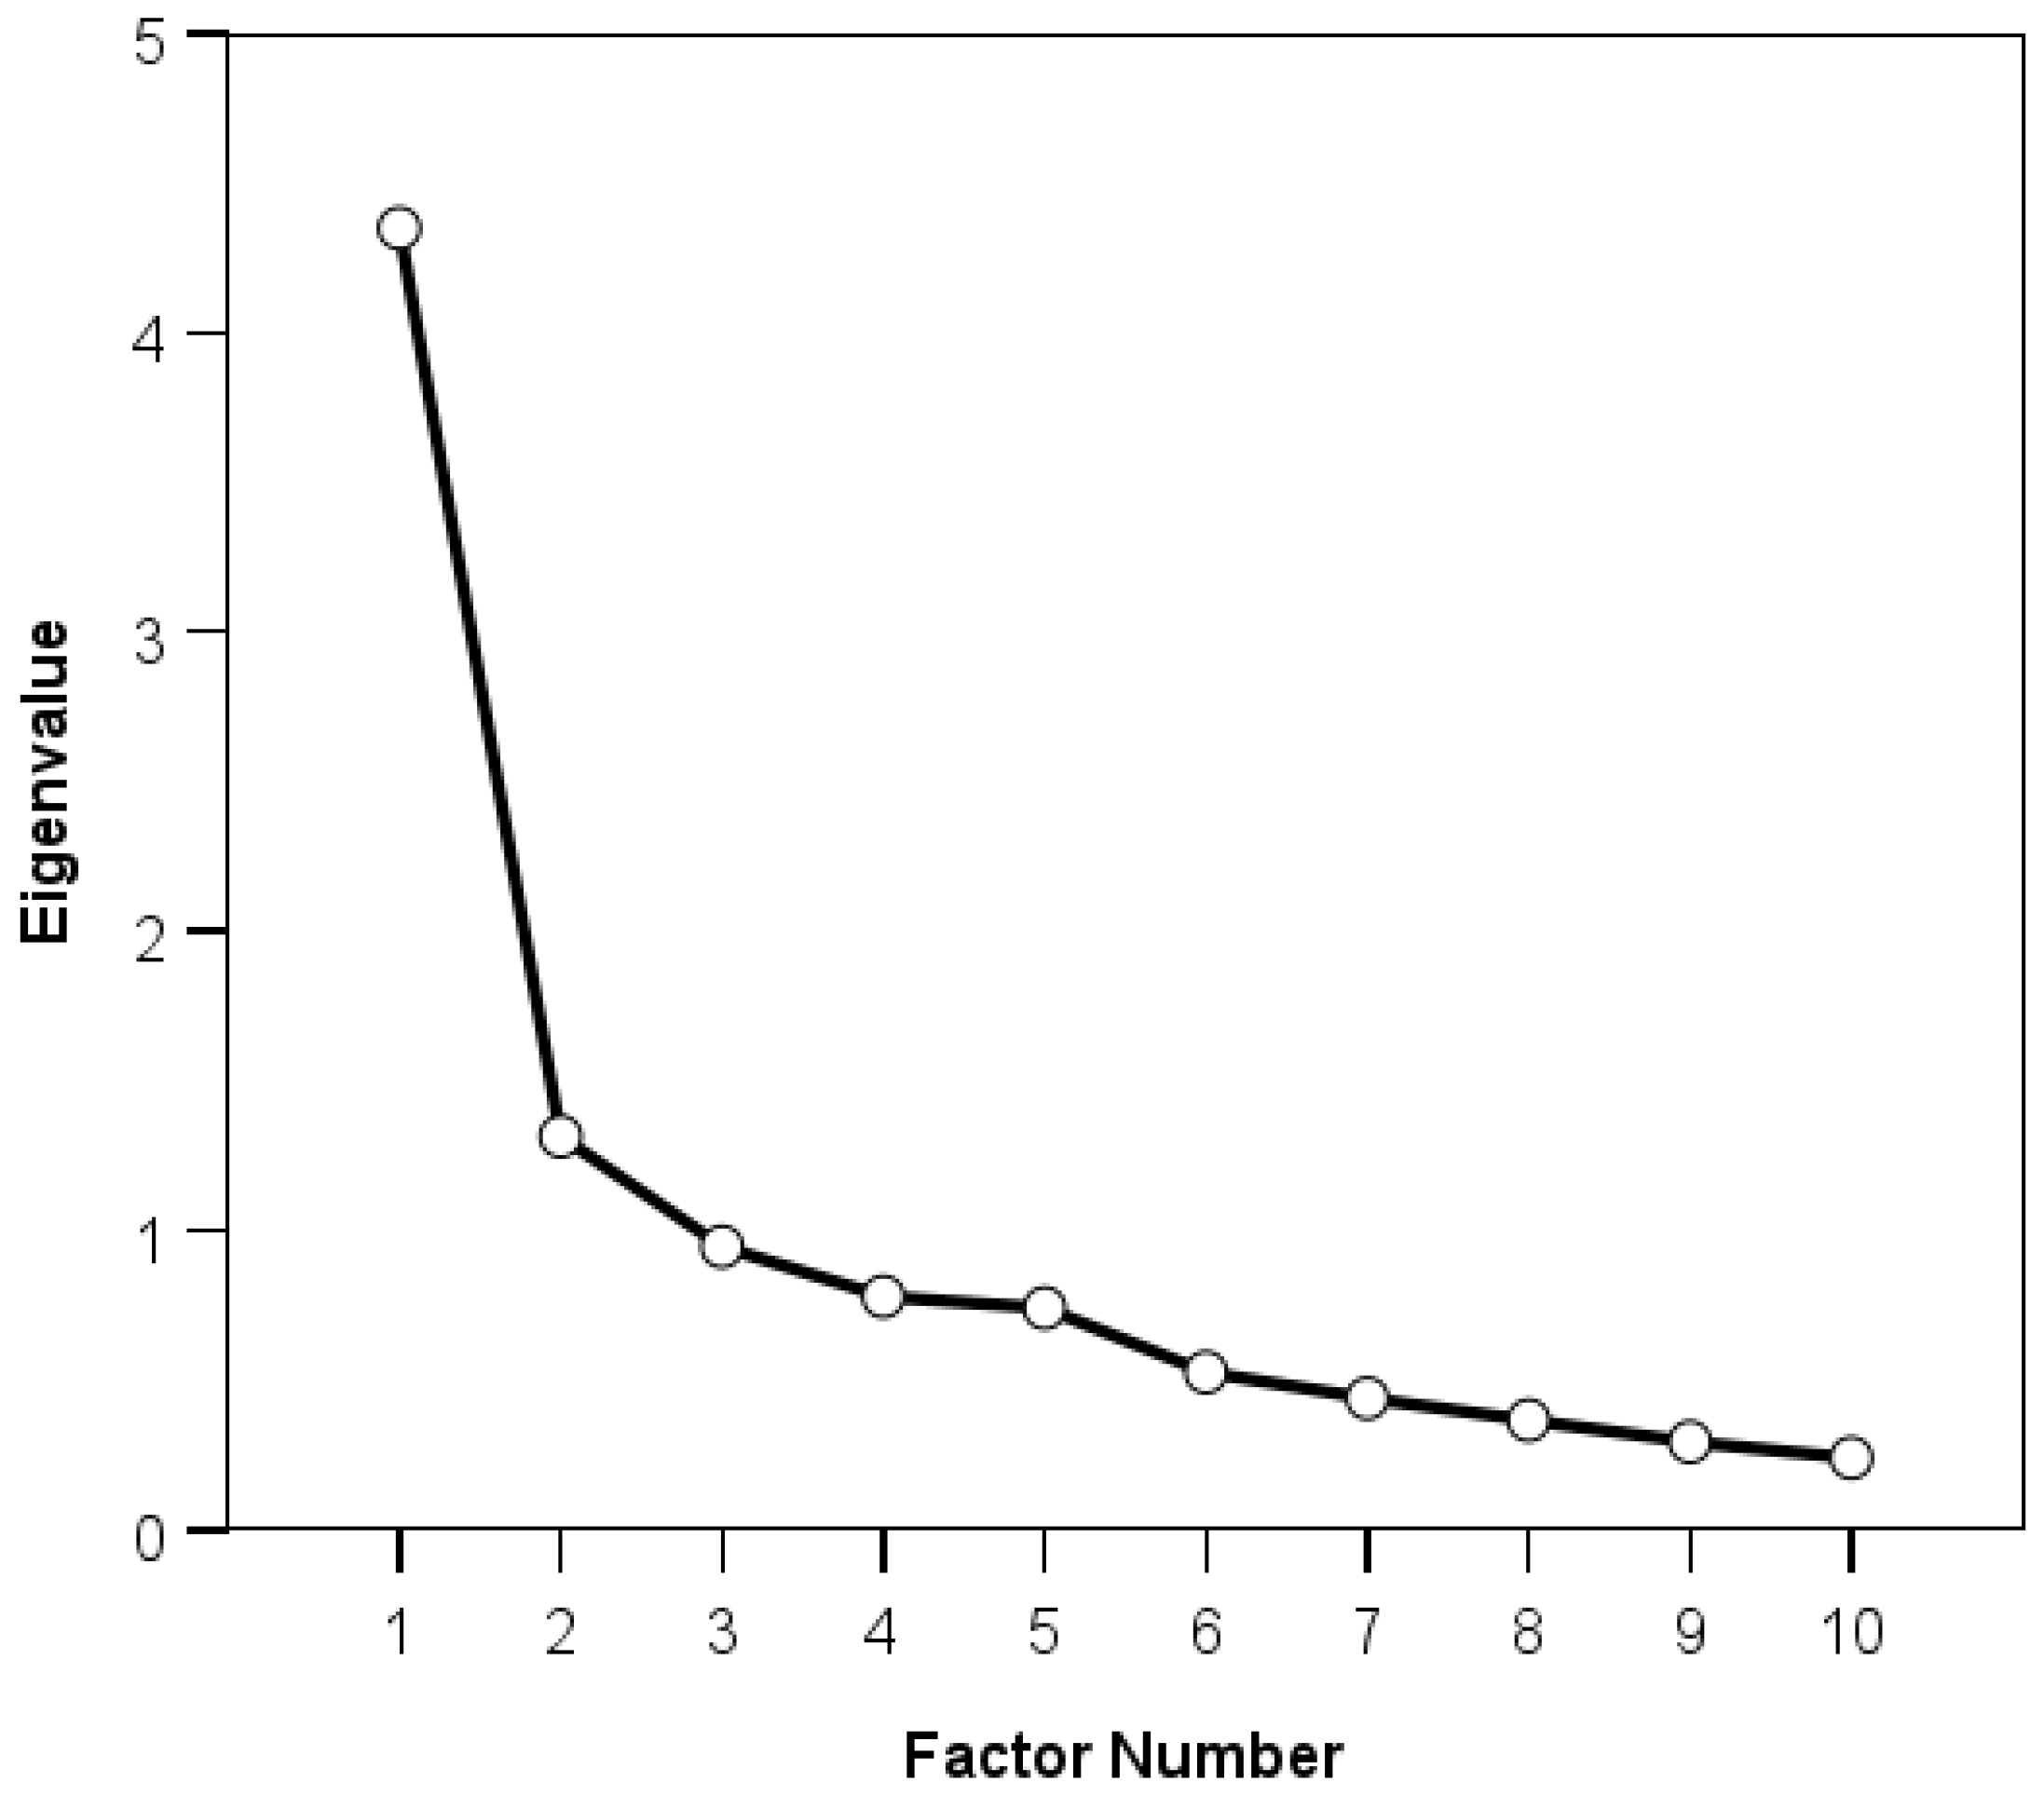
3.3. Exploratory Factor Analysis
3.4. Construct Validity
3.5. Internal Consistency
3.6. Floor and Ceiling Effects
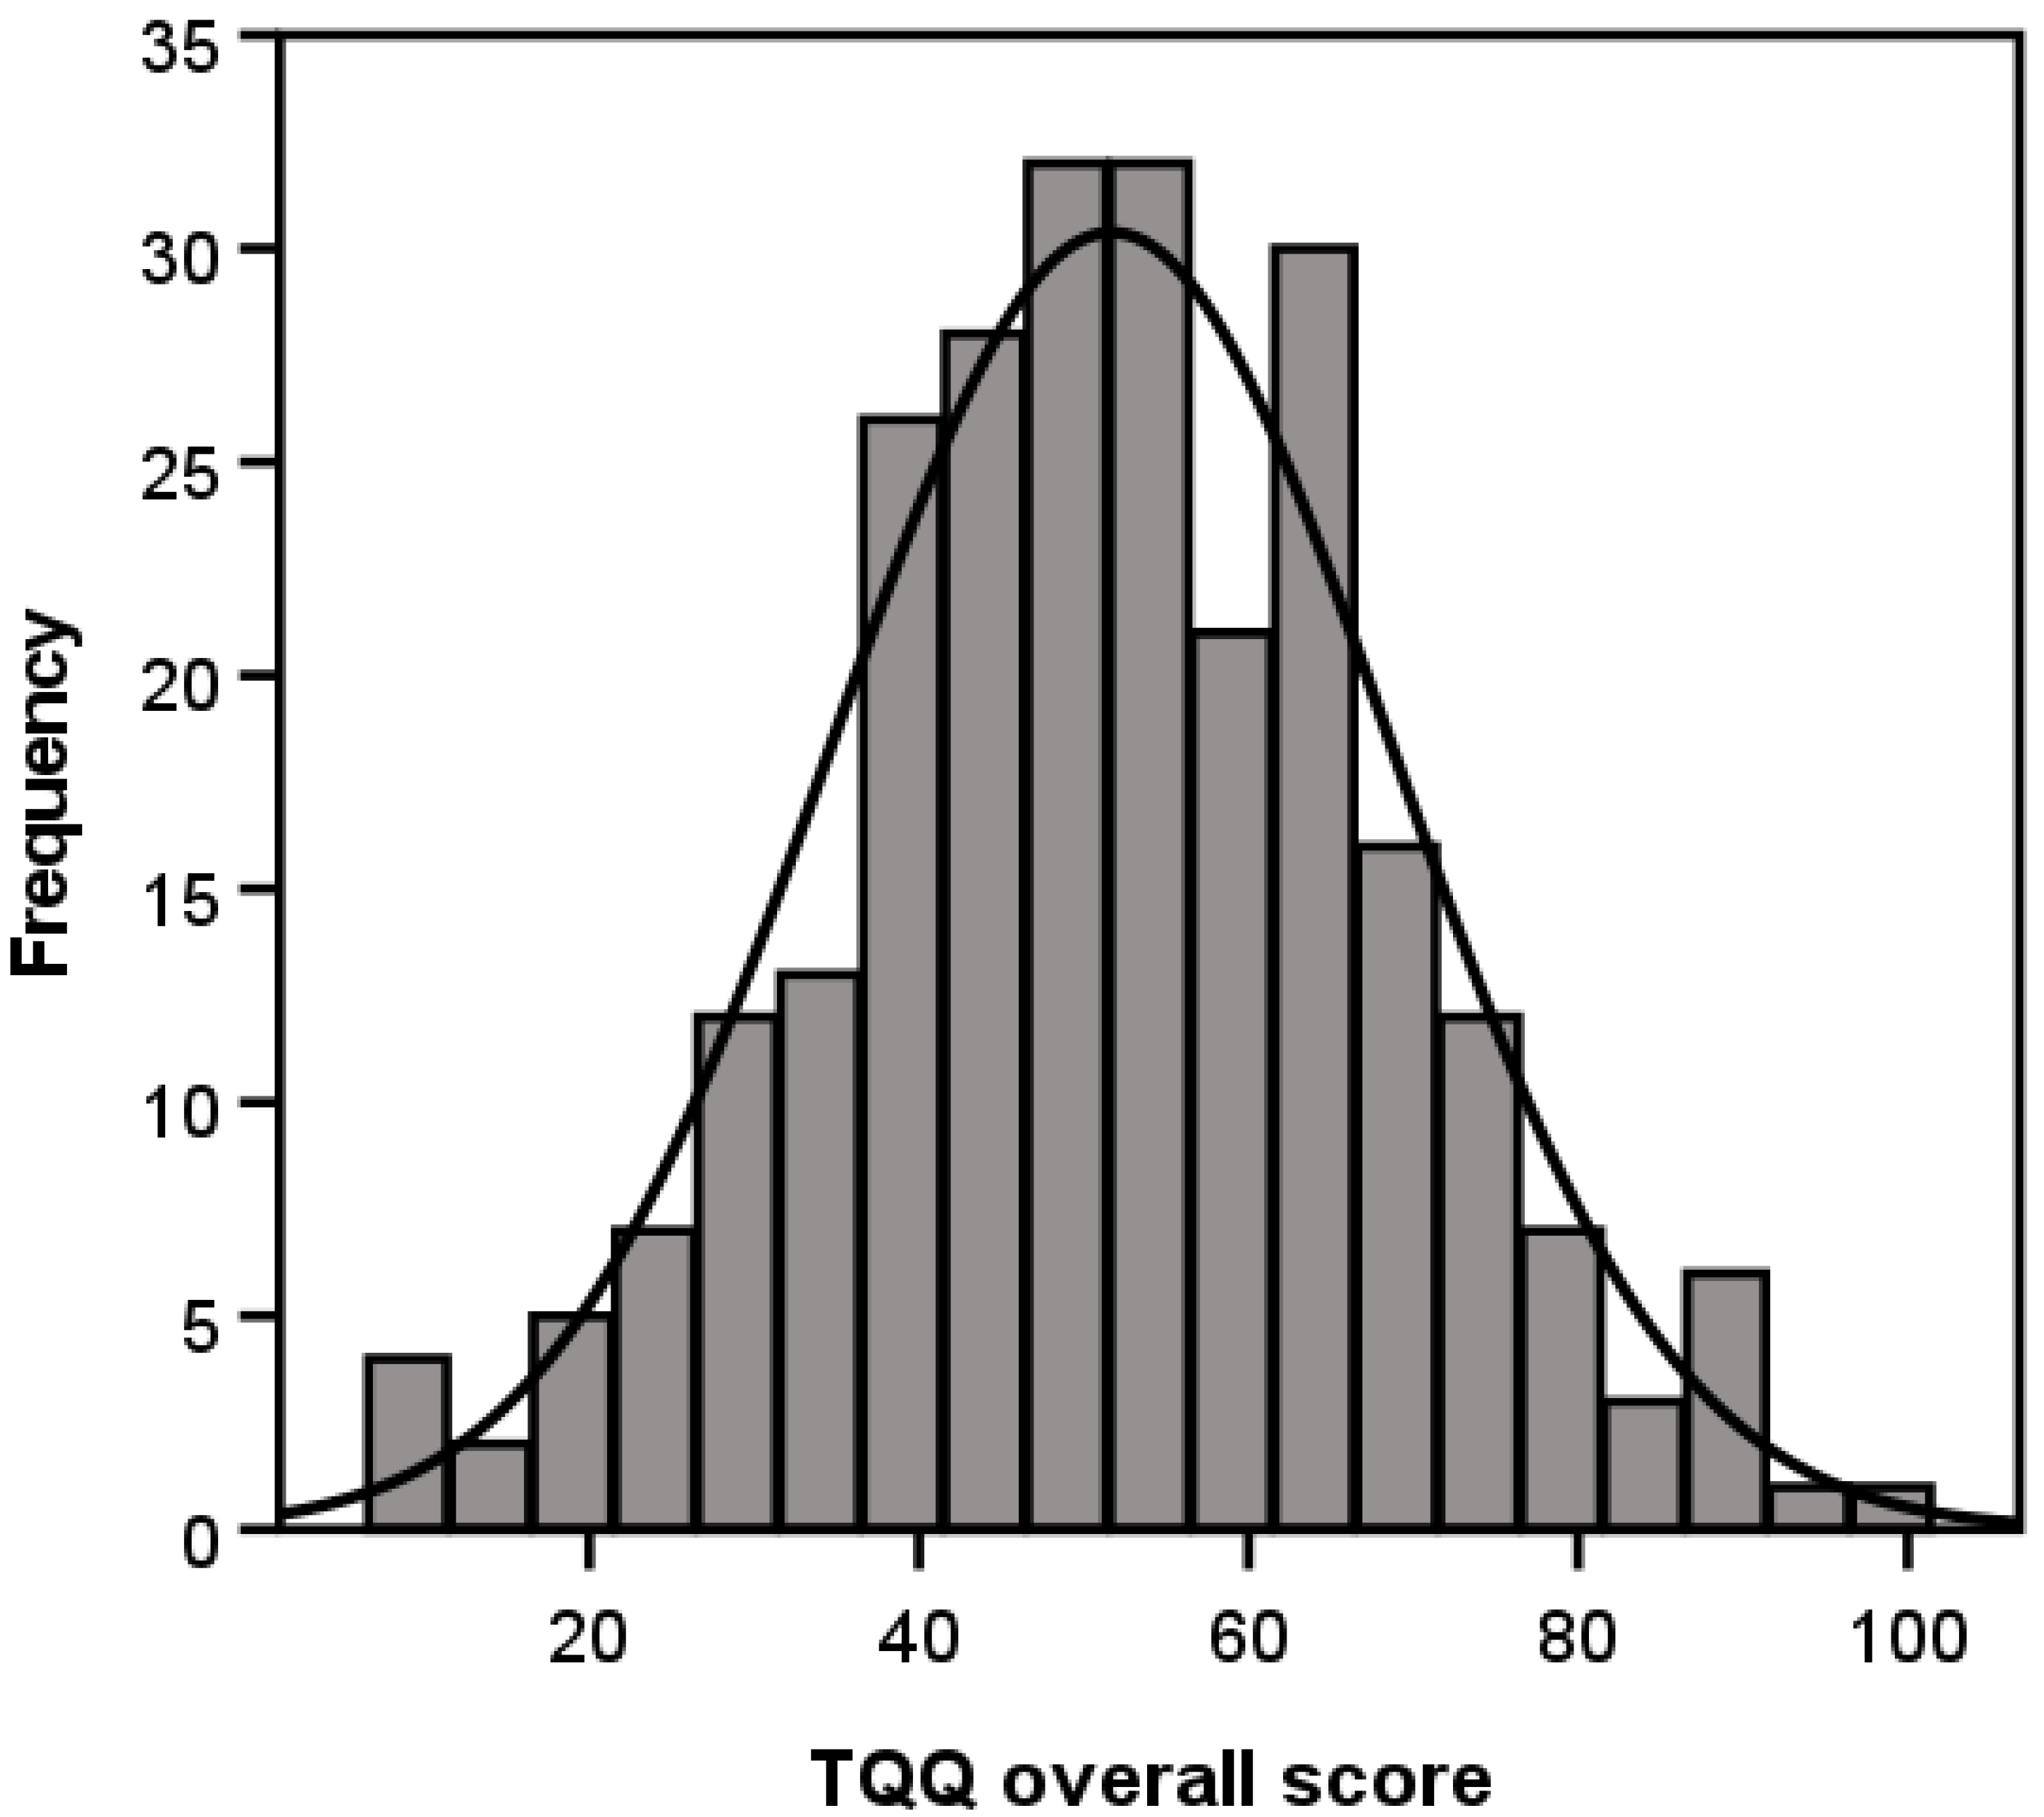
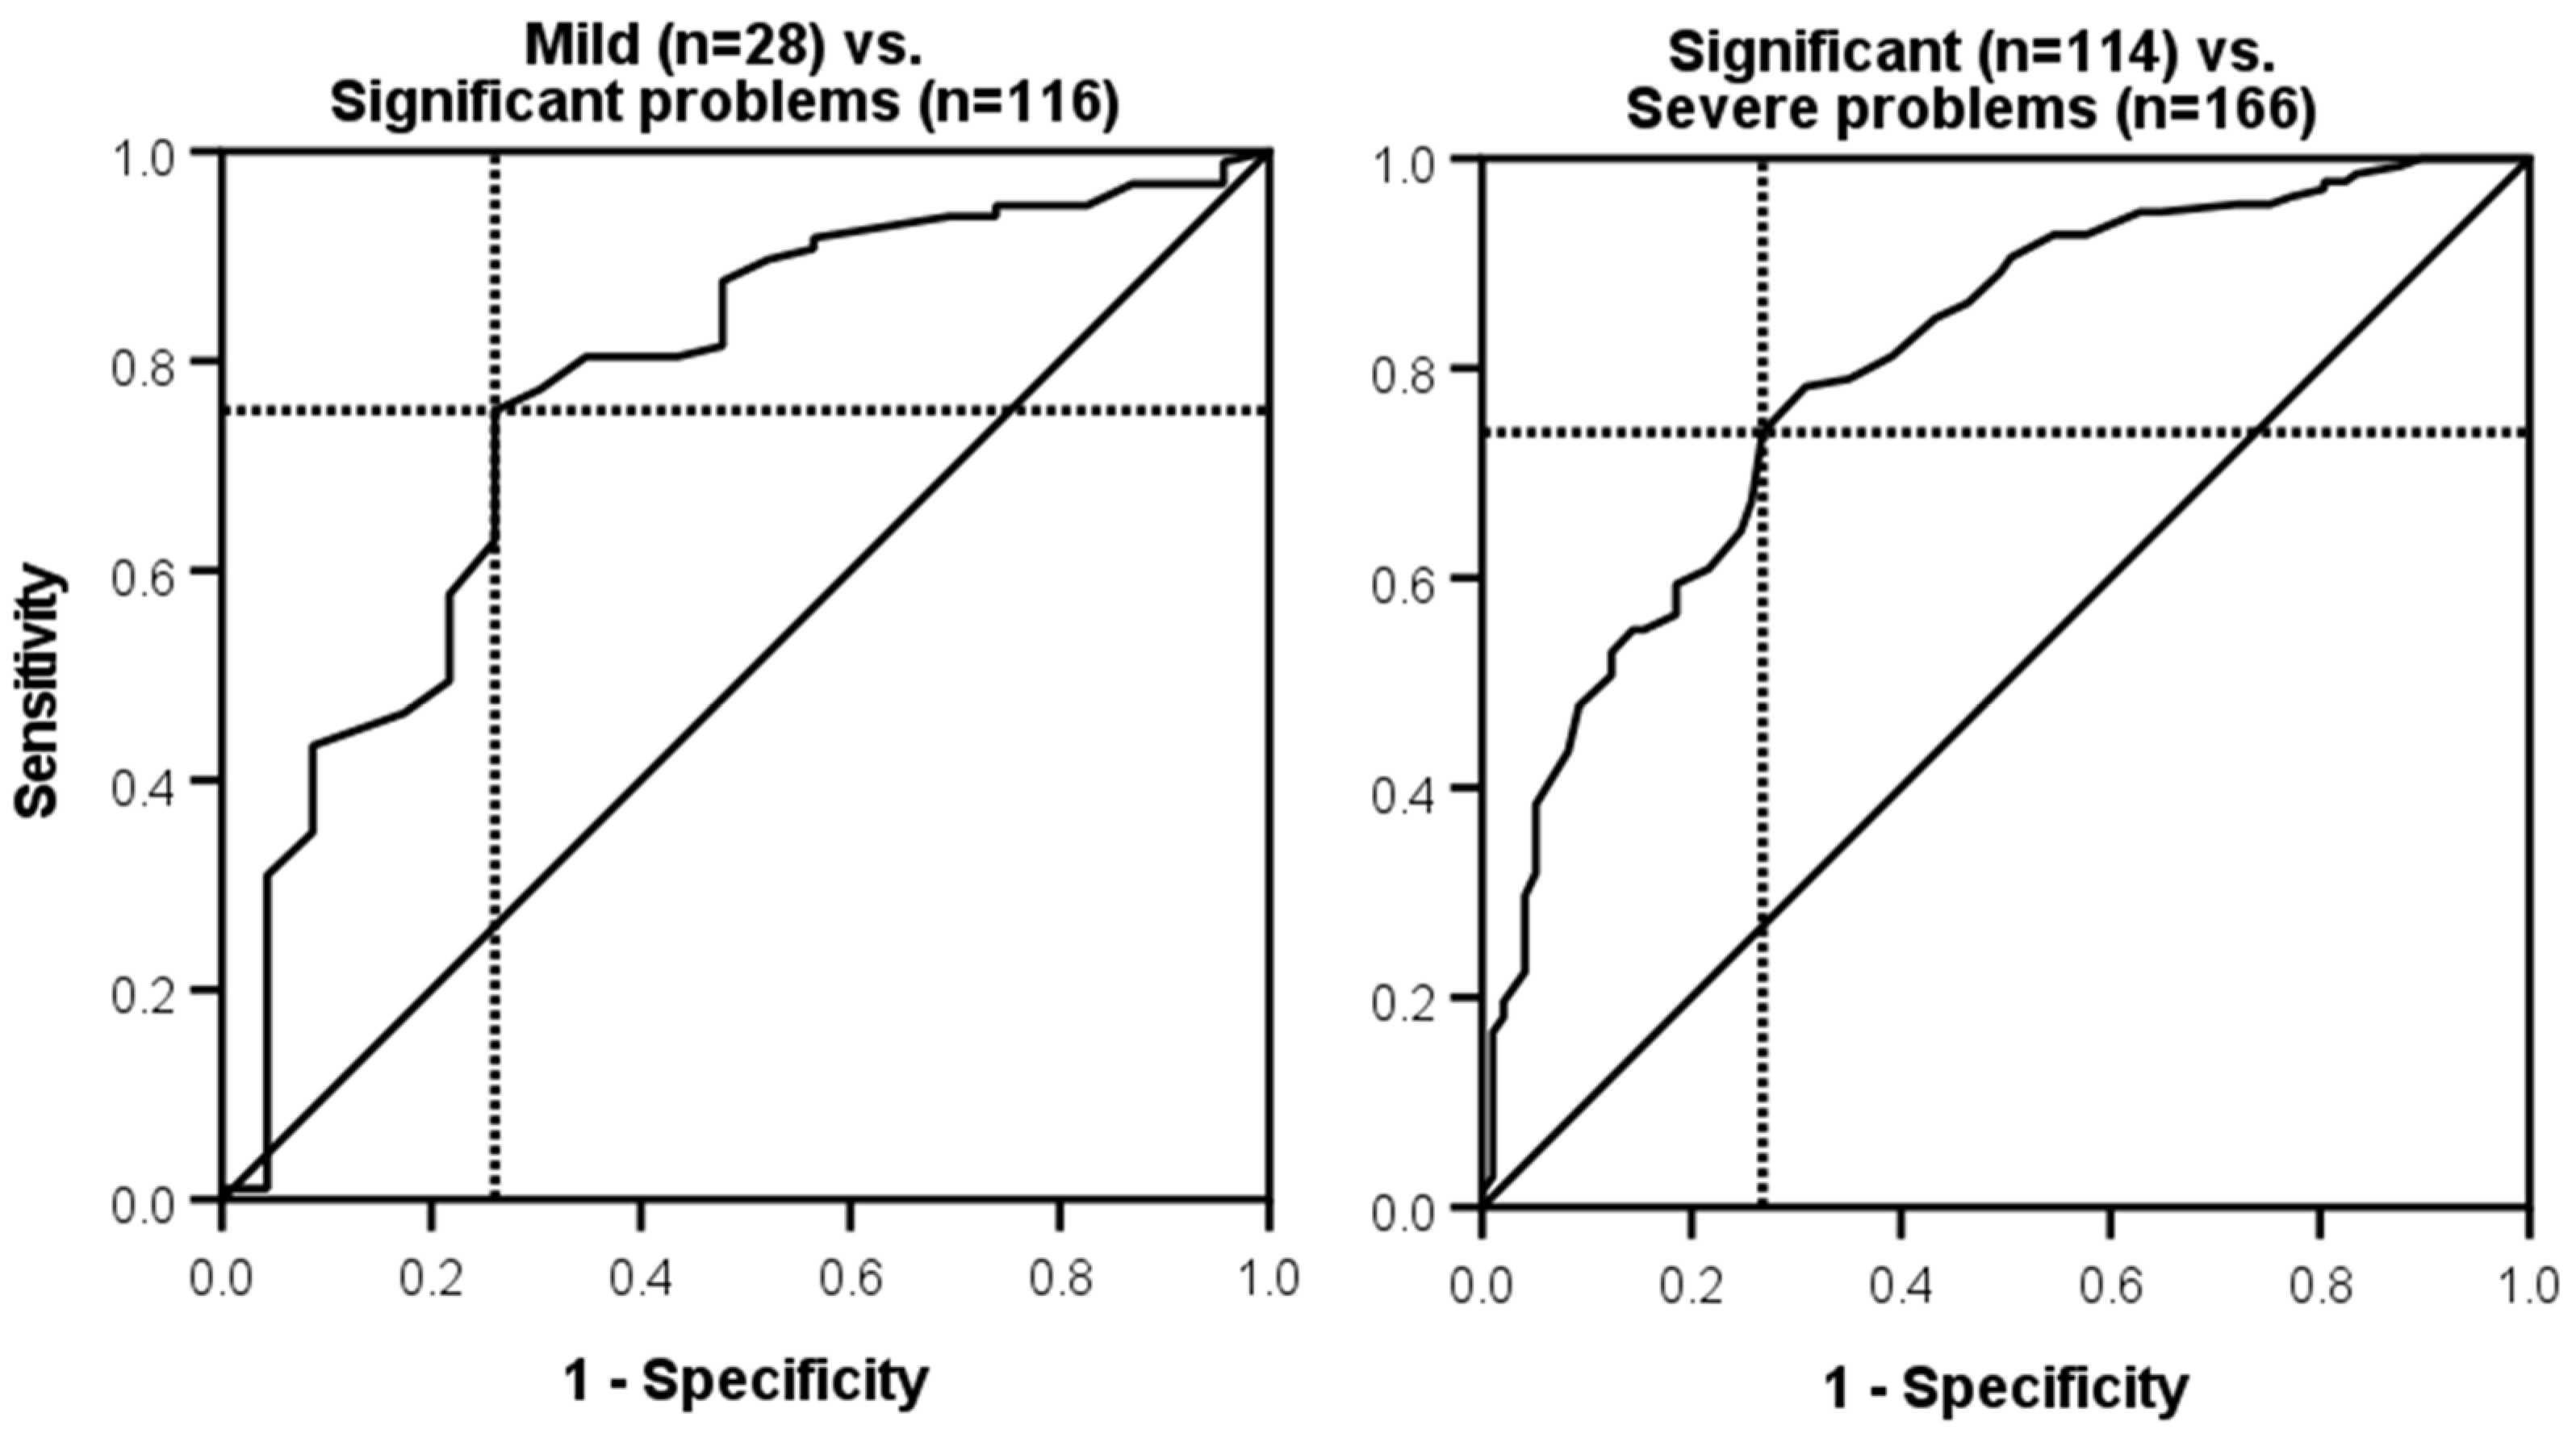
3.7. Interpretability
3.8. Responsiveness
3.9. Minimum Clinical Important Difference (MCID)
4. Discussion
4.1. Relations Between Tinnitus Severity and Tinnitus Qualities
4.2. Change in Tinnitus Qualities over Time or Following Intervention
4.3. Strengths, Limitations, and Future Directions
5. Conclusions
Supplementary Materials
Author Contributions
Funding
Institutional Review Board Statement
Informed Consent Statement
Data Availability Statement
Conflicts of Interest
References
- Beukes, E.W.; Manchaiah, V.; Allen, P.M.; Andersson, G.; Baguley, D.M. Exploring tinnitus heterogeneity. Prog. Brain Res. 2021, 260, 79–99. [Google Scholar] [CrossRef]
- Manchaiah, V.; Nisha, K.V.; Prabhu, P.; Granberg, S.; Karlsson, E.; Andersson, G.; Beukes, E.W. Examining the consequences of tinnitus using the multidimensional perspective. Acta Oto-Laryngol. 2022, 142, 67–72. [Google Scholar] [CrossRef] [PubMed]
- Landgrebe, M.; Azevedo, A.; Baguley, D.; Bauer, C.; Cacace, A.; Coelho, C.; Dornhoffer, J.; Figueiredo, R.; Flor, H.; Hajak, G.; et al. Methodological aspects of clinical trials in tinnitus: A proposal for an international standard. J. Psychosom. Res. 2012, 73, 112–121. [Google Scholar] [CrossRef] [PubMed]
- Stephens, D. A history of tinnitus. In Tinnitus Handbook; Tyler, R.S., Ed.; Singular; Thomson Learning: San Diego, CA, USA, 2000; pp. 437–448. [Google Scholar]
- Henry, J.A.; Manning, C. Clinical Protocol to Promote Standardization of Basic Tinnitus Services by Audiologists. Am. J. Audiol. 2019, 28, 152–161. [Google Scholar] [CrossRef] [PubMed]
- Lentz, J.J.; He, Y. Perceptual Dimensions Underlying Tinnitus-Like Sounds. J. Speech Lang. Hear. Res. 2020, 63, 3560–3566. [Google Scholar] [CrossRef]
- Meikle, M.B.; Creedon, T.A.; Griest, S.E. Tinnitus. Available online: http://www.tinnitusarchive.org (accessed on 5 July 2004).
- Meikle, M.B.; Henry, J.A.; Griest, S.E.; Stewart, B.J.; Abrams, H.B.; McArdle, R.; Myers, P.J.; Newman, C.W.; Sandridge, S.; Turk, D.C.; et al. The tinnitus functional index: Development of a new clinical measure for chronic, intrusive tinnitus. Ear Hear. 2012, 33, 153–176. [Google Scholar] [CrossRef]
- Han, B.I.; Lee, H.W.; Kim, T.Y.; Lim, J.S.; Shin, K.S. Tinnitus: Characteristics, causes, mechanisms, and treatments. J. Clin. Neurol. 2009, 5, 11–19. [Google Scholar] [CrossRef]
- Mavrogeni, P.; Molnár, A.; Molnár, V.; Tamás, L.; Maihoub, S. Correlation Between the Pitch and Loudness of Tinnitus, Hearing Levels, and Tinnitus Handicap Inventory Scores in Patients with Chronic Subjective Tinnitus. J. Clin. Med. 2024, 13, 7261. [Google Scholar] [CrossRef]
- Searchfield, G.D. Tinnitus what and where: An ecological framework. Front. Neurol. 2014, 5, 271. [Google Scholar] [CrossRef]
- Vasudevan, H.; Ganapathy, K.; Palaniswamy, H.P.; Searchfield, G.; Rajashekhar, B. Systematic review and meta-analysis on the effect of continuous subjective tinnitus on attention and habituation. PeerJ 2021, 9, e12340. [Google Scholar] [CrossRef]
- Waechter, S. Association between hearing status and tinnitus distress. Acta Oto-Laryngol. 2021, 141, 381–385. [Google Scholar] [CrossRef]
- Aazh, H.; Moore, B.C.J.; Erfanian, M. Confirmatory factor analysis of the Tinnitus Impact Questionnaire using data from patients seeking help for tinnitus alone or tinnitus combined with hyperacusis. PLoS ONE 2024, 19, e0302837. [Google Scholar] [CrossRef] [PubMed]
- Skarżyński, H.; Gos, E.; Raj-Koziak, D.; Skarżyński, P.H. Skarzynski Tinnitus Scale: Validation of a brief and robust tool for assessing tinnitus in a clinical population. Eur. J. Med. Res. 2018, 23, 54. [Google Scholar] [CrossRef]
- Theodoroff, S.M. Tinnitus Questionnaires for Research and Clinical Use. Curr. Top. Behav. Neurosci. 2021, 51, 403–418. [Google Scholar] [CrossRef] [PubMed]
- McFerran, D.J.; Stockdale, D.; Holme, R.; Large, C.H.; Baguley, D.M. Why Is There No Cure for Tinnitus? Front. Neurosci. 2019, 13, 802. [Google Scholar] [CrossRef] [PubMed]
- Beukes, E.W.; Andersson, G.; Fagelson, M.; Manchaiah, V. Audiologist-Supported Internet-Based Cognitive Behavioral Therapy for Tinnitus in the United States: A Pilot Trial. Am. J. Audiol. 2021, 30, 717–729. [Google Scholar] [CrossRef]
- Beukes, E.W.; Andersson, G.; Fagelson, M.A.; Manchaiah, V. Dismantling internet-based cognitive behavioral therapy for tinnitus. The contribution of applied relaxation: A randomized controlled trial. Internet Interv. 2021, 25, 100402. [Google Scholar] [CrossRef]
- Beukes, E.W.; Andersson, G.; Fagelson, M.; Manchaiah, V. Internet-Based Audiologist-Guided Cognitive Behavioral Therapy for Tinnitus: Randomized Controlled Trial. J. Med. Internet Res. 2022, 24, e27584. [Google Scholar] [CrossRef]
- Mokkink, L.B.; Terwee, C.B.; Patrick, D.L.; Alonso, J.; Stratford, P.W.; Knol, D.L.; Bouter, L.M.; de Vet, H.C. The COSMIN checklist for assessing the methodological quality of studies on measurement properties of health status measurement instruments: An international Delphi study. Qual. Life Res. 2010, 19, 539–549. [Google Scholar] [CrossRef]
- Mokkink, L.B.; Terwee, C.B.; Patrick, D.L.; Alonso, J.; Stratford, P.W.; Knol, D.L.; Bouter, L.M.; de Vet, H.C. The COSMIN Checklist Manual; VU University Medical Center: Amsterdam, The Netherlands, 2012. [Google Scholar]
- Terwee, C.B.; Bot, S.D.; de Boer, M.R.; van der Windt, D.A.; Knol, D.L.; Dekker, J.; Bouter, L.M.; de Vet, H.C. Quality criteria were proposed for measurement properties of health status questionnaires. J. Clin. Epidemiol. 2007, 60, 34–42. [Google Scholar] [CrossRef]
- Spitzer, R.L.; Kroenke, K.; Williams, J.B.; Löwe, B. A brief measure for assessing generalized anxiety disorder: The GAD-7. Arch. Intern. Med. 2006, 166, 1092–1097. [Google Scholar] [CrossRef] [PubMed]
- Kroenke, K.; Spitzer, R.L.; Williams, J.B. The PHQ-9: Validity of a brief depression severity measure. J. Gen. Intern. Med. 2001, 16, 606–613. [Google Scholar] [CrossRef]
- Bastien, C.H.; Vallières, A.; Morin, C.M. Validation of the Insomnia Severity Index as an outcome measure for insomnia research. Sleep Med. 2001, 2, 297–307. [Google Scholar] [CrossRef] [PubMed]
- Rabin, R.; de Charro, F. EQ-5D: A measure of health status from the EuroQol Group. Ann. Med. 2001, 33, 337–343. [Google Scholar] [CrossRef]
- Mokkink, L.B.; Terwee, C.B.; Patrick, D.L.; Alonso, J.; Stratford, P.W.; Knol, D.L.; Bouter, L.M.; de Vet, H.C. The COSMIN study reached international consensus on taxonomy, terminology, and definitions of measurement properties for health-related patient-reported outcomes. J. Clin. Epidemiol. 2010, 63, 737–745. [Google Scholar] [CrossRef]
- Costello, A.B.; Osborne, J.W. Best practices in exploratory factor analysis: Four recommendations for getting the most from your analysis. Pract. Assess. Res. Eval. 2005, 10, 7. [Google Scholar]
- Tobias, S.; Carlson, J.E. Brief report: Bartlett’s test of sphericity and chance findings in factor analysis. Multivar. Behav. Res. 1969, 4, 375–377. [Google Scholar] [CrossRef]
- Cureton, E.E.; D’Agostino, R.B. Factor Analysis; Psychology Press: East Sussex, UK, 2013. [Google Scholar] [CrossRef]
- Fabrigar, L.R.; Wegener, D.T.; MacCallum, R.C.; Strahan, E.J. Evaluating the use of exploratory factor analysis in psychological research. Psychol. Methods 1999, 4, 272–299. [Google Scholar] [CrossRef]
- Beavers, A.S.; Lounsbury, J.W.; Richards, J.K.; Huck, S.W.; Skolits, G.J.; Esquivel, S.L. Practical Considerations for Using Exploratory Factor Analysis in Educational Research. Pract. Assess. Res. Eval. 2013, 18, n6. [Google Scholar]
- Salazar, J.W.; Meisel, K.; Smith, E.R.; Quiggle, A.; McCoy, D.B.; Amans, M.R. Depression in Patients with Tinnitus: A Systematic Review. Otolaryngol. Head Neck Surg. 2019, 161, 28–35. [Google Scholar] [CrossRef]
- De Vet, H.C.; Terwee, C.B.; Mokkink, L.B.; Knol, D.L. Measurement in Medicine: A Practical Guide; Cambridge University Press: Cambridge, UK, 2011. [Google Scholar]
- Heffernan, E.; Habib, A.; Ferguson, M. Evaluation of the psychometric properties of the social isolation measure (SIM) in adults with hearing loss. Int. J. Audiol. 2019, 58, 45–52. [Google Scholar] [CrossRef]
- Ferketich, S. Focus on psychometrics. Aspects of item analysis. Res. Nurs. Health 1991, 14, 165–168. [Google Scholar] [CrossRef]
- Terwee, C.B.; Peipert, J.D.; Chapman, R.; Lai, J.S.; Terluin, B.; Cella, D.; Griffiths, P.; Mokkink, L.B. Minimal important change (MIC): A conceptual clarification and systematic review of MIC estimates of PROMIS measures. Qual. Life Res. 2021, 30, 2729–2754. [Google Scholar] [CrossRef]
- Stouffer, J.L.; Tyler, R.S. Characterization of tinnitus by tinnitus patients. J. Speech Hear. Disord. 1990, 55, 439–453. [Google Scholar] [CrossRef] [PubMed]
- Cohen, J. Statistical Power Analysis for the Behavioral Sciences, 2nd ed.; Lawrence Erlbaum Associates, Publishers: Hillsdale, NJ, USA, 1988. [Google Scholar]
- Tinnitus Retraining Therapy Trial Research Group; Scherer, R.W.; Formby, C. Effect of Tinnitus Retraining Therapy vs Standard of Care on Tinnitus-Related Quality of Life: A Randomized Clinical Trial. JAMA Otolaryngol. Head Neck Surg. 2019, 145, 597–608. [Google Scholar] [CrossRef] [PubMed]
- Meikle, M.B.; Vernon, J.; Johnson, R.M. The perceived severity of tinnitus. Some observations concerning a large population of tinnitus clinic patients. Otolaryngol. Head Neck Surg. 1984, 92, 689–696. [Google Scholar] [CrossRef]
- Hall, D.A.; Fackrell, K.; Li, A.B.; Thavayogan, R.; Smith, S.; Kennedy, V.; Tinoco, C.; Rodrigues, E.D.; Campelo, P.; Martins, T.D.; et al. A narrative synthesis of research evidence for tinnitus-related complaints as reported by patients and their significant others. Health Qual. Life Outcomes 2018, 16, 61. [Google Scholar] [CrossRef]
- Hallam, R.S.; Jakes, S.C.; Hinchcliffe, R. Cognitive variables in tinnitus annoyance. Br. J. Clin. Psychol. 1988, 27, 213–222. [Google Scholar] [CrossRef] [PubMed]
- Manchaiah, V.; Andersson, G.; Fagelson, M.A.; Boyd, R.L.; Beukes, E.W. Use of open-ended questionnaires to examine the effects of tinnitus and its relation to patient-reported outcome measures. Int. J. Audiol. 2022, 61, 592–599. [Google Scholar] [CrossRef]
- Dawes, P.; Newall, J.; Stockdale, D.; Baguley, D.M. Natural history of tinnitus in adults: A cross-sectional and longitudinal analysis. BMJ Open 2020, 10, e041290. [Google Scholar] [CrossRef]
- Sanchez, T.G.; Valim, C.C.A.; Schlee, W. Long-lasting total remission of tinnitus: A systematic collection of cases. In Progress in Brain Research; Schlee, W., Langguth, B., Kleinjung, T., Vanneste, S., De Ridder, D., Eds.; Elsevier: Amsterdam, The Netherlands, 2021; Volume 260, pp. 269–282. [Google Scholar]
- Simões, J.P.; Neff, P.K.A.; Langguth, B.; Schlee, W.; Schecklmann, M. The progression of chronic tinnitus over the years. Sci. Rep. 2021, 11, 4162. [Google Scholar] [CrossRef] [PubMed]
- Langguth, B.; De Ridder, D. Minimal Clinically Important Difference of Tinnitus Outcome Measurement Instruments-A Scoping Review. J. Clin. Med. 2023, 12, 7117. [Google Scholar] [CrossRef] [PubMed]


| Demographic Variable | Overall n = 308 | Intervention n = 240 | No Intervention n = 68 |
|---|---|---|---|
| Age (years) | |||
| Mean | 55.5 | 54.7 | 58.4 |
| SD | 12.7 | 13.2 | 10.4 |
| Range | 19–84 | 19–81 | 34–84 |
| Gender (n) | |||
| Male | 139 (45.1%) | 108 (45.0%) | 31 (45.6%) |
| Female | 169 (54.9%) | 132 (55.0%) | 37 (54.4%) |
| Employment status (n) | |||
| Entry level/unskilled work | 10 (3.2%) | 9 (3.8%) | 1 (1.5%) |
| Skilled/professional work | 179 (58.1%) | 145 (60.4%) | 34 (50.0%) |
| Retired | 93 (30.2%) | 68 (28.3%) | 25 (36.8%) |
| Not working/unemployed | 26 (8.4%) | 18 (7.5%) | 8 (11.8%) |
| Education (n) | |||
| <High school | 5 (1.6%) | 5 (2.1%) | 0 (0.0%) |
| High school | 30 (9.7%) | 20 (8.3%) | 10 (14.7%) |
| Some college but not degree | 84 (27.3%) | 60 (25.0%) | 24 (35.3%) |
| >University degree | 189 (61.4%) | 155 (64.6%) | 34 (50.0%) |
| Ethnicity (n) | |||
| American Indian/Alaska Native | 3 (1.0%) | 3 (1.3%) | 0 (0.0%) |
| Asian | 3 (1.0%) | 2 (0.8%) | 1 (1.5%) |
| Black/African American | 7 (2.3%) | 7 (2.9%) | 0 (0.0%) |
| Native Hawaiian/Other Pacific Islander | 1 (0.3%) | 1 (0.4%) | 0 (0.0%) |
| White Hispanic/Latino | 47 (16.8%) | 39 (18.2%) | 8 (12.3%) |
| White Non-Hispanic/Latino | 232 (83.2%) | 175 (81.8%) | 57 (87.7%) |
| More than One Race | 15 (4.9%) | 13 (5.4%) | 2 (2.9%) |
| Tinnitus duration (years) | |||
| Mean | 12.3 | 12.0 | 13.4 |
| SD | 13.1 | 13.3 | 12.5 |
| Range | <1–70 | <1–70 | <1–58 |
| Frequency awareness of tinnitus, mean (SD) | |||
| Morning | 2.5 (0.7) | 2.5 (0.8) | 2.6 (0.7) |
| Afternoon | 2.3 (0.7) | 2.5 (0.7) | 2.3 (0.7) |
| Evening | 2.6 (0.6) | 2.7 (0.5) | 2.6 (0.6) |
| Night | 2.3 (0.9) | 2.5 (0.7) | 2.3 (0.9) |
| TQIQ Domain | TQIQ Question | Factor 1 | Factor 2 |
|---|---|---|---|
| Frequency | How often are you aware of your tinnitus? | 0.80 | −0.16 |
| Distractibility | How much do you notice your tinnitus when you are busy doing other things? | 0.76 | 0.05 |
| Maskability | How much do you notice your tinnitus when there are other sounds around you? | 0.74 | 0.04 |
| Pitch | How annoyed are you with the pitch (or tone) of your tinnitus? | 0.74 | −0.02 |
| Loudness | How loud has your tinnitus been? | 0.72 | −0.02 |
| Coexisting | How easily have you lived with having tinnitus? | 0.69 | 0.14 |
| Complexity | How many different types of sound do you hear? | 0.18 | 0.12 |
| Loud Sounds | How has hearing loud noise affected your tinnitus? | −0.05 | 0.79 |
| Sensitivity | How sensitive are you to sounds you hear around you? | 0.01 | 0.60 |
| Mood | How much does your mood affect your tinnitus? | 0.28 | 0.36 |
| Instrument | r | p |
|---|---|---|
| TFI Overall | 0.70 | <0.001 |
| TFI Intrusive subscale | 0.61 | <0.001 |
| TFI Sense of Control subscale | 0.52 | <0.001 |
| TFI Cognitive subscale | 0.61 | <0.001 |
| TFI Sleep subscale | 0.48 | <0.001 |
| TFI Auditory subscale | 0.38 | <0.001 |
| TFI Relaxation subscale | 0.56 | <0.001 |
| TFI Quality of Life subscale | 0.61 | <0.001 |
| TFI Emotional subscale | 0.59 | <0.001 |
| GAD-7 | 0.49 | <0.001 |
| PHQ-9 | 0.49 | <0.001 |
| ISI | 0.43 | <0.001 |
| EQ-5D-5L VAS | −0.24 | <0.001 |
| TQIQ Item | Mean (SD) | Inter-Item Correlation | Corrected Item-Total Correlation | |||||||||
|---|---|---|---|---|---|---|---|---|---|---|---|---|
| 1 | 2 | 3 | 4 | 5 | 6 | 7 | 8 | 9 | 10 | |||
| 1. Loudness | 7.14 (2.08) | 1.0 | 0.63 | |||||||||
| 2. Pitch | 6.91 (2.57) | 0.69 | 1.0 | 0.62 | ||||||||
| 3. Complexity | 1.75 (2.45) | 0.23 | 0.15 | 1.0 | 0.24 | |||||||
| 4. Frequency | 7.08 (2.25) | 0.55 | 0.52 | 0.11 | 1.0 | 0.56 | ||||||
| 5. Co-existing | 5.22 (2.54) | 0.53 | 0.58 | 0.19 | 0.48 | 1.0 | 0.70 | |||||
| 6. Distractibility | 4.02 (2.66) | 0.44 | 0.49 | 0.15 | 0.59 | 0.62 | 1.0 | 0.67 | ||||
| 7. Maskability | 4.43 (2.74) | 0.49 | 0.48 | 0.25 | 0.54 | 0.55 | 0.73 | 1.0 | 0.66 | |||
| 8. Mood | 3.88 (3.07) | 0.29 | 0.33 | 0.15 | 0.25 | 0.48 | 0.34 | 0.31 | 1.0 | 0.48 | ||
| 9. Lound sounds | 5.41 (3.32) | 0.21 | 0.23 | 0.16 | 0.14 | 0.32 | 0.30 | 0.28 | 0.34 | 1.0 | 0.43 | |
| 10. Sensitivity | 5.85 (2.81) | 0.26 | 0.22 | 0.09 | 0.16 | 0.25 | 0.21 | 0.23 | 0.31 | 0.48 | 1.0 | 0.39 |
| Instrument | Mean Change (SD) | r | p |
|---|---|---|---|
| TFI Overall | 21.07 (20.54) | 0.55 | <0.001 |
| TFI Intrusive subscale | 18.78 (21.76) | 0.44 | <0.001 |
| TFI Sense of Control subscale | 24.68 (26.47) | 0.51 | <0.001 |
| TFI Cognitive subscale | 19.17 (26.46) | 0.48 | <0.001 |
| TFI Sleep subscale | 22.60 (27.85) | 0.34 | <0.001 |
| TFI Auditory subscale | 16.22 (27.55) | 0.26 | <0.001 |
| TFI Relaxation subscale | 25.90 (26.95) | 0.46 | <0.001 |
| TFI Quality of Life subscale | 20.61 (26.35) | 0.51 | <0.001 |
| TFI Emotional subscale | 20.77 (24.72) | 0.46 | <0.001 |
| TQIQ Difference | ||
|---|---|---|
| Mean | SD | |
| Meaningfully worse (≥−13) | 3.0 | 11.8 |
| Worse (−1 to −12) | −1.8 | 9.8 |
| No change | −4.3 | 10.5 |
| Better (1 to 12) | 8.2 | 12.1 |
| Meaningfully better (≥13) | 15.2 | 16.0 |
Disclaimer/Publisher’s Note: The statements, opinions and data contained in all publications are solely those of the individual author(s) and contributor(s) and not of MDPI and/or the editor(s). MDPI and/or the editor(s) disclaim responsibility for any injury to people or property resulting from any ideas, methods, instructions or products referred to in the content. |
© 2025 by the authors. Licensee MDPI, Basel, Switzerland. This article is an open access article distributed under the terms and conditions of the Creative Commons Attribution (CC BY) license (https://creativecommons.org/licenses/by/4.0/).
Share and Cite
Manchaiah, V.; Andersson, G.; Beukes, E.W.; Fagelson, M.A.; Swanepoel, D.W.; Heffernan, E.; Maidment, D. Development and Psychometric Validation of Tinnitus Qualities and Impact Questionnaire. Clin. Pract. 2025, 15, 87. https://doi.org/10.3390/clinpract15050087
Manchaiah V, Andersson G, Beukes EW, Fagelson MA, Swanepoel DW, Heffernan E, Maidment D. Development and Psychometric Validation of Tinnitus Qualities and Impact Questionnaire. Clinics and Practice. 2025; 15(5):87. https://doi.org/10.3390/clinpract15050087
Chicago/Turabian StyleManchaiah, Vinaya, Gerhard Andersson, Eldré W. Beukes, Marc A. Fagelson, De Wet Swanepoel, Eithne Heffernan, and David Maidment. 2025. "Development and Psychometric Validation of Tinnitus Qualities and Impact Questionnaire" Clinics and Practice 15, no. 5: 87. https://doi.org/10.3390/clinpract15050087
APA StyleManchaiah, V., Andersson, G., Beukes, E. W., Fagelson, M. A., Swanepoel, D. W., Heffernan, E., & Maidment, D. (2025). Development and Psychometric Validation of Tinnitus Qualities and Impact Questionnaire. Clinics and Practice, 15(5), 87. https://doi.org/10.3390/clinpract15050087