Abstract
Background: We sought to understand the innovativeness of nurses engaging in innovative behaviors and quantify the associated characteristics that make nurses more able to innovate in practice. We first compared the innovativeness scores of our population; then we examined those who self-identified as an innovator versus those who did not to explore differences associated with innovativeness between these groups. Methods: A cross-sectional survey study of nurses in the US engaging in innovative behaviors was performed. We performed an exploratory factor analysis (EFA) to determine the correlates of innovative behavior. Results: Three-hundred and twenty-nine respondents completed the survey. Respondents who viewed themselves as innovators had greater exposure to HCD/DT workshops in the past year (55.8% vs. 36.6%, p = 0.02). The mean innovativeness score of our sample was 120.3 ± 11.2 out of a score of 140. The mean innovativeness score was higher for those who self-identified as an innovator compared with those who did not (121.3 ± 10.2 vs. 112.9 ± 14.8, p =< 0.001). The EFA created four factor groups: Factor 1 (risk aversion), Factor 2 (willingness to try new things), Factor 3 (creativity and originality) and Factor 4 (being challenged). Conclusion: Nurses who view themselves as innovators have higher innovativeness scores compared with those who do not. Multiple individual and organizational characteristics are associated with the innovativeness of nurses.
1. Introduction
Incorporating innovative behaviors in the profession of nursing is a relatively new notion, with most literature examining the use of innovation methodologies in practice dating back just 10–15 years [1,2]. In the last five years though, we have seen a groundswell of support encouraging individuals and organizations to consider incorporating innovation into education and practice [3,4,5,6,7]. This transformation has occurred because of the ever-changing healthcare environment that struggles with “wicked problems” (those that are notoriously difficult to solve) and emerging health concerns, as well as the need to understand and create new models of care and emerging technologies [3,8]. Because nurses are situated in the problem space with patients and communities, they can more deeply contextualize the problem areas and innovative solutions needed. But not all nurses see themselves as innovators or have the support to innovate. Therefore, determining what combination of individual and organizational characteristics enhances a nurse’s innovativeness will be key to nurses leading in this space.
Innovativeness is a personal characteristic defined as “a behavior which is dependent upon the perceived attributes of the innovation” [9]. It is also an awareness of the need to innovate [10]. Few studies within nursing have examined innovativeness [11]. There is still a paucity of data regarding what factors contribute specifically to the innovativeness of nurses and whether nurses are inherently innovative, as some have suggested, or if it is a behavior that can be developed, as called for by the Future of Nursing 2020–2030 report [5,11,12,13,14]. Educational institutions, programs for continuing education, and healthcare settings have a distinct opportunity to develop nurses as leaders in innovation, as fostering innovation in healthcare has the potential to improve outcomes for patients and health systems alike [15,16]. By understanding the characteristics of nurses engaging in innovative behaviors, including whether they self-identify as an innovator, health system leaders could use these data to assess and cultivate more balanced, innovative teams. However, without reliable data on the characteristics contributing to nurses’ innovativeness, it will not be possible to properly quantify and cultivate those innovative behaviors in practice [17].
The purpose of this study was to expand the limited findings in this area by examining the characteristics of nurses in the US who show interest in innovation and engage in activities that encourage innovative behavior. We sought to understand the innovativeness of these nurses and quantify the associated characteristics that make nurses more able to innovate in practice. We also sought to determine differences between those nurses who self-identified as innovators and those who did not.
2. Materials and Methods
2.1. Study Design
This study was designed as a cross-sectional, observational survey study. We sought to measure participants’ innovativeness using the Scales for the Measurement of Innovativeness tool and examine their association with individual and organizational characteristics. Based on these results, we compared those who self-identified as innovators with those who did not to show similarities and differences related to their innovativeness scores. We hypothesized that there would be differences between the innovativeness scores and characteristics of those who identified as innovators the scores of those who did not; with those identifying as an innovator having higher innovativeness scores and possessing greater characteristics associated with innovativeness (e.g., attending more innovation events).
2.2. Setting
Data collection for this study began on 12 December 2022, and ended on 22 January 2023. The study population included nurses, and the sample specifically targeted nurses engaging in innovative behaviors.
2.3. Partcipants
Eligible participants included nurses who engaged in innovative behaviors, were licensed, and worked in all settings in the US (e.g., clinical, educational, start-ups). Participants under 18 years of age, undergraduate nursing students, and nurses who do not read English were excluded from the study.
We sought to recruit a national sample of nurses who showed interest in innovation by engaging in activities supporting innovative behaviors in the last three years. Nurses were asked to complete the 10–15 min survey. No incentives to participate in the survey were offered. The snowballing technique was used, asking all participants to share the study description and survey link with their colleagues and on their social media platforms.
As noted, not all nurses have the opportunity to innovate. Therefore, to determine the characteristics that make a nurse more innovative, we sampled nurses who were actively engaging in innovative behaviors. Future work will look at comparing nurses engaging in innovative behaviors versus those not engaging in innovative behaviors to determine if they have different characteristics.
2.4. Variables
Participants’ innovative behavior, individual sociodemographic (e.g., age, race, gender, income, education, institutional setting, years of practice), and organizational data (e.g., hospital location, Magnet status, job satisfaction) were collected via self-report using the Qualtrics survey platform. Variables included in the demographic and organizational surveys were chosen based on the conceptual models informing this study: the Individual Innovation in the Workplace theory and the Diffusion of Innovation theory [18,19]. Some items in the demographic and organizational survey were modeled on the survey used in the 2016 RN4CAST to examine institutional changes regarding education, staffing, work environment, and well-being [20]. Permission was obtained from the author (MM) for use on this project.
2.5. Data Sources/Measurement
All questionnaires were distributed and completed by participants via the Qualtrics website (Provo, UT, USA). At the beginning of the survey, a screening tool was completed by the respondent.
Once screening was completed, respondents who selected at least one innovative behavior were provided with study consent language. The participant consented by completing the survey and submitting it through the online portal (Qualtrics, Provo, UT, USA).
2.5.1. Scales for the Measurement of Innovativeness
The Scales for the Measurement of Innovativeness score was used to assess nurses’ innovativeness. The original validated tool is a paper-based, self-report survey developed in 1977 to measure the willingness to change in an individual, not actual adoption behavior. This is an important distinction, as nurses may want to be innovative but may have constraints or barriers preventing them from innovating [9]. The Scales for the Measurement of Innovativeness has been used in previous studies to quantify the innovativeness of nurses [12,14]. Based on the Diffusion of Innovation theory, the scale was designed as a 7-point Likert scale [18]. The Scales for the Measurement of Innovativeness has a maximum score of 140 (20 questions ranked per the Likert scale 1–7); a higher score is associated with a higher degree of innovativeness and willingness to change [9]. We received permission from the publisher (Blackwell Publishing, Inc.) for this study to transfer the survey into an electronic format.
The Innovativeness score was calculated by scoring the 7-point Likert scale (Strongly Agree = 7, Agree = 6, Moderately Agree = 5, Undecided = 4, Moderately Disagree = 3, Disagree = 2, Strongly Disagree = 1) and totaling each of the individual respondents’ scores for the 20 questions included in the Scale. Some questions from the survey were reverse scored to account for the directionality of the wording of the question, as recommended by Hurt & Cook [9]. The total sum was calculated to obtain a total possible score of 140 for each respondent.
2.5.2. Innovative Behavior
The innovative behavior items included information on whether a respondent participated in any innovation events such as hackathons, accelerators, incubators, design sprints, design thinking workshops, human-centered design courses, innovation fellowships, and challenges, reported as yes/no; the frequency of participation (e.g., 1–2 times over the past three years) was also captured. Questions specific to a respondent’s ability or willingness to innovate were captured on a frequency scale of never to always or not at all to very.
2.5.3. Individual Characteristics
Demographic data included age, race, gender, income, education, institutional setting, years of practice, clinical level, and specialty area. Questions were captured as continuous variables for age and years of practice; the remaining demographic questions were captured as categorical variables (e.g., for Race: Asian, Black, White, Other). Other individual characteristics captured included satisfaction with one’s current position as a nurse and institution, feeling supported, and number of years worked. The number of innovation events participated in and exposed to in the past year was also included.
2.5.4. Organizational Characteristics
Organizational data included items such as hospital location (urban/rural) and Magnet status (yes/no). Other variables regarding perceived facilitators of and barriers to innovativeness were collected. Questions related to satisfaction with opportunities to be creative and innovative and to lead, as well as whether their institution offered any HCD/DT or Innovation education, lectures, resources, and workshops were also collected.
2.6. Statistical Methods
We estimated descriptive statistics (mean, standard deviation) for our variables of interest. We then examined whether participants’ individual and organizational characteristics differed based on whether a participant self-identified as an innovator. For these analyses, we compared groups using Student’s t-tests or one-way ANOVAs with Tukey post hoc comparisons for continuous variables and Pearson’s Chi-square tests for categorical variables. To adjust for Type I errors in multigroup comparisons we employed a Tukey post hoc comparison where appropriate [21,22]. We also used Pearson correlations to examine linear associations between continuous variables. We used complete case analysis as minimal missing data did not affect the models we used.
Using exploratory factor analysis (EFA), we confirmed the construct validity of the Scales for the Measurement of Innovativeness tool. Using Principal Axis Factoring with a varimax rotation, we assessed whether distinct factor scores would emerge with eigenvalue scores greater than one. The presence of distinct factor scores would suggest different components of what constitutes innovation according to the Scales for the Measurement of Innovativeness tool. After determining the extracted factors, we estimated the unique and shared explained variance across the 20 items. Consistent with best practices, factor loads greater than 0.4 indicated an item’s contribution to a defined factor during the analysis. Using bivariate comparisons, we created standardized (z-score) factor scores from the EFA and subsequently examined whether nurses’ individual and organizational characteristics differed across these factors.
2.7. Ethics Criteria
The study was approved by the University of Pennsylvania Institute Review Board (Protocol #852671).
3. Results
We received 662 survey responses. Of those, 305 (46.07%) began the screening survey but did not complete it. Three-hundred and forty-nine (52.72%) respondents passed the screening survey and agreed to participate, 4 (0.60%) completed the screening survey but subsequently chose not to participate and 2 (0.30%) completed the innovativeness survey but did not select that they agreed to participate and thus were removed from the analysis.
Of the 349 who passed the screening and agreed to participate, 15 did not start the survey and were removed. Ten respondents started the survey twice. Of the ten duplicate surveys, five were kept in the analysis. If the respondent had both an incomplete and complete survey, their incomplete survey was removed. If they had two completed surveys, their most recently completed were kept for analysis. A total of 329 surveys were analyzed (Figure 1).
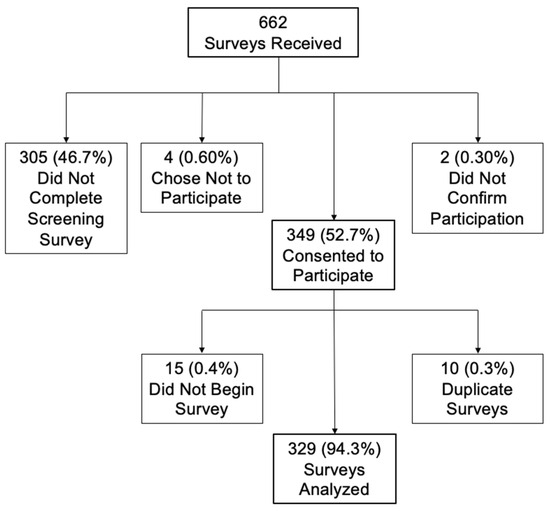
Figure 1.
Enrollment schematic.
3.1. Individual Characteristics
The mean age of respondents was 47.17 ± 12.19 years. Most respondents—264/305 (86.56%)—were female, and 234/305 (76.72%) were white (Table 1). Most respondents had either a master’s degree 122/306 (39.87%), or PhD or other Doctorate 87/306 (28.43%). The majority of respondents, 202/301 (67.11%), received their initial nursing education from a baccalaureate degree program (Table 1). On average, the respondents had worked in the nursing field for 21.49 ± 12.67 years. Less than half of the respondents, (129/300, 43.00%), worked in a hospital. The current positions of those who responded were quite diverse, with the most respondents in any category, 110/300 (36.67%), stating Other, which included positions such as “Founder”, “Entrepreneur”, “Consultant”, and “Educator”.

Table 1.
Individual characteristics by participant’s self-view as an innovator.
Most respondents, 285/326 (87.42%), viewed themselves as innovators. The majority of the respondents had been exposed to HCD and DT activities 209/323 (64.70%), lectures 224/325 (68.82%), projects 199/324 (61.42%), workshops 174/324 (53.70%), and other related innovative activities 227/324 (70.06%). In the last year, most respondents participated in 1–3 innovation events 230/321 (71.65%) (Table 1).
3.2. Organizational Characteristics
Of those who worked in a hospital, 126/298 (42.28%) were at a hospital with Magnet status. Most respondents, 212/296 (71.62%), considered their institution innovative, and 219/296 (73.98%) considered their institution supportive of innovative thinking by its nurses. However, of those where it was applicable, only 56/135 (41.48%) got protected time away from the bedside to work on projects. Just over half of the nurses who responded, 176/323 (54.48%), were very willing to implement innovation methodologies in their day-to-day work, but just 121/323 (37.46%) and 28/323 (8.67%) felt as though they were often or always able to implement innovation methodologies in their day-to-day work (Table 2).
Table 2.
Organizational Characteristics by Participant’s Self-view as an Innovator.
Few institutions offered resources 119/282 (42.20%), education 107/283 (37.81%), workshops 100/283 (35.34%), or lectures 102/283 (36.04%) specific to HCD and DT. Many institutions offered innovation resources 174/282 (61.70%), education 166/284 (58.45%), workshops 139/283 (49.12%), and lectures 156/285 (54.74%) (Table 2).
3.3. Self-Identified as an Innovator
Differences in respondent characteristics based on whether the respondents viewed themselves as innovators (n = 285) or not (n = 41) showed no statistically significant difference in demographic characteristics (Table 1). However, we observed significant differences in participants’ self-identification as innovators. Respondents who self-identified as innovators had greater exposure to HCD/DT workshops in the past year (56.38% vs. 46.13%, p = 0.02). Additionally, those who self-identified as innovators were more willing to implement innovation methodologies in their day-to-day work (57.80% vs. 31.71%, p = 0.002), more satisfied with their opportunities to be creative (43.58% vs. 24.39%, p = 0.001) and their opportunities to be innovative (42.86% vs. 24.39% p = 0.002) (Table 2).
3.4. Innovativeness Score
The total sample’s mean innovativeness score was 120.3 ± 11.2 out of a score of 140. We found the mean difference in the total innovativeness score was higher for those who viewed themselves as innovators compared with those who did not (121.3 ± 10.2 vs. 112.9 ± 14.8, p =< 0.001) (Table 1). We also found the innovativeness scores to be higher for those who work in healthcare compared with those who do not (120.9±10.3 vs. 115.1±12.5, p = 0.003) and for respondents who had been exposed to HCD/DT workshops (121.5 ± 9.9 vs. 118.8 ± 12.5, p = 0.04) (Table 3). Additionally, a Student’s t-test showed differences in innovativeness scores regarding whether respondents felt their institutions supported innovative thinking by its nurses, (121.3 ± 9.6 vs. 117.7 ± 12.8, p = 0.01) and whether respondents’ institutions offered HCD/DT education (122.7 ± 9.2 vs. 118.9 ± 11.4, p = 0.003), lectures (122.8 ± 9.2 vs. 118.9 ± 11.3, p = 0.003), resources (122.6 ± 9.1 vs. 119.0 ± 10.8, p = 0.004), HCD/DT education (122.7 ± 9.2 vs. 118.9 ± 11.4, p = 0.003), lectures (122.8 ± 9.2 vs. 118.9 ± 11.3, p = 0.003), resources (122.6 ± 9.1 vs. 119.0 ± 10.8, p = 0.004), and workshops (122.2 ± 10.2 vs. 119.3 ± 10.9, p = 0.03) and innovation lectures (122.1 ± 9.6 vs. 118.1 ± 11.7, p = 0.002), and workshops(121.7 ± 10.0 vs. 118.9 ± 11.6, p = 0.03) (Table 4).
Table 3.
Individual characteristics and innovativeness scores.
Table 4.
Organizational characteristics and innovativeness scores. (A) mean and standard deviation results; (B) correlation results.
A one-way ANOVA was used to compare the innovativeness scores with how many innovation events a respondent participated in over the past year. We found that the more innovation events a respondent participated in, the higher that person’s innovativeness score would be (one event, 118.6 ± 11.2 vs. 2–3, 119.4 ± 10.8 vs. 4–5, 122.5 ± 12.8 vs. six or more, 125.0 ± 8.3, p = 0.004). Tukey’s test for multiple comparisons found a statistically significant difference in the innovativeness scores between the two groups; one innovation event compared with six or more innovation events (p = 0.006) and 2–3 events compared with six or more innovation events (p = 0.02) (Table 3).
3.5. Exploratory Factor Analysis
An EFA was performed. The total variance explained was 56.66% (Table 5). Four factors emerged in the rotated factor matrix, with Factor 1 having an eigenvalue of 6.38, which accounted for 31.88% of the variance. Factor 2 had an eigenvalue of 2.46, accounting for 12.29% of the variance. Factor 3 had an eigenvalue of 1.47, accounting for 7.37% of the variance. Factor 4 had an eigenvalue of 1.03, accounting for 5.13% of the variance (Table 6).
Table 5.
Total variance explained.
Table 6.
Exploratory factor analysis—rotated factor matrix.
3.6. Description of Factors
Factor 1 (risk aversion) included eight survey questions about risk aversion and reluctance to accept new ideas. Factor 2 (willingness to try new things and being an influencer and leader) included nine items related to survey questions that focused on willingness to try new things and being an influencer and leader in relation to new ideas. Factor 3 (creativity and originality) included three items focused on survey questions about creativity and originality in thinking and behavior. Factor 4 (being challenged) included two items related to survey questions focused on being challenged by unanswered questions and ambiguity.
3.7. Comparison across the Factors
We examined the associations between our four factors and the individual and organization characteristics (see Supplementary Material; Figure 2).
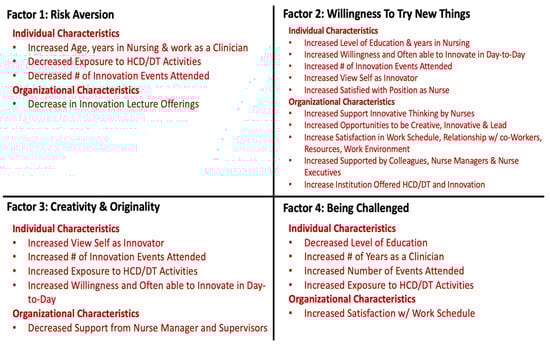
Figure 2.
Correlates of innovative behavior.
3.7.1. Factor 1
For Factor 1 (risk aversion), A one-way ANOVA comparing how many innovation events respondents had participated in over the last year (p = 0.04), and their willingness to implement innovative methodologies in day-to-day work (p = 0.0001) were all positively associated with increased risk aversion. Though the one-way ANOVA showed a statistically significant difference in at least two groups for each variable, a Tukey test for multiple comparisons did not show differences in the pairwise analysis, respectively. A Student’s t-test found that whether respondents were exposed to HCD/DT activities in the last year or not was associated with risk aversion (p = 0.03). Additionally, a Student’s t-test found a difference in the level of risk aversion related to whether or not a respondent’s institution had offered innovation lectures in the past year (0.08 ± 0.78 vs. −0.15 ± 0.97, p = 0.03) (see Supplementary Material).
3.7.2. Factor 2
For Factor 2 (willingness to try new things and being an influencer and leader), a one-way ANOVA was performed and found a positive association with how many innovation events the respondent participated in over the last year (p =< 0.001), how often they could implement innovative methodologies in day-to-day work (p = 0.0006), and their willingness to implement innovative methodologies (p = 0.002). Though the one-way ANOVA showed a statistically significant difference in at least two groups for each variable, a Tukey test for multiple comparisons did not show differences in the pairwise analysis, respectively (see Supplementary Material).
A Student’s t-test found that whether respondents viewed themselves as innovators (0.05 ± 0.76 vs. −0.40 ± 1.3, p = 0.002) and whether their institutions supported innovative thinking by their nurses (0.08 ± 0.63 vs. −0.16 ± 1.0, p = 0.01) were associated with willingness to try new things and being an influencer and leader about new ideas.
Whether an institution offered innovation resources (12 ± 0.61 vs. −0.12 ± 0.94, p = 0.01), education (0.10 ± 0.64 vs. −0.008 ± 0.91, p = 0.05), workshops (0.12 ± 0.60 vs. −0.08 ± 0.89, p = 0.03), lectures (0.13 ± 0.61 vs. −0.11 ± 0.91, p = 0.01) and HCD/DT education (0.20 ± 0.55 vs. −0.08 ± 0.86, p = 0.003), lectures (0.18±0.56 vs. −0.07±0.85, p = 0.01), and resources (0.20 ± 0.56 vs. −0.07 ± 0.69, p = 0.001) were all positively associated with willingness to try new things and being an influencer and leader about new ideas.
3.7.3. Factor 3
For Factor 3 (creativity and originality), a Student’s t-test showed that respondents were more willing to be creative and original in their thinking if they viewed themselves as innovators (0.11 ± 0.74 vs. −0.69 ± 1.0, p =< 0.001), and if in the last year, the respondent has been exposed to HCD/DT workshops (0.10 ± 0.68 vs. −0.09 ± 0.96, p = 0.04) and other HCD/DT events (0.21 ± 0.80 vs. −0.04 ± 0.80, p = 0.02).
A one-way ANOVA found that how many innovation events the respondent had participated in over the last year (p = 0.01) was also positively associated with creativity and originality in thinking. Tukey’s test for multiple comparisons found a more significant difference in the Factor 3 score in one group regarding how many innovation events the respondent had participated in over the last year, six or more events compared with one event (p = 0.02) (Tables S1 and S2 in the Supplemental Material).
3.7.4. Factor 4
For Factor 4 (being challenged), a one-way ANOVA found a significant difference in the respondents’ association with being challenged based on how many innovation events the respondents participated in over the last year (p =< 0.001). Though the Tukey test for multiple comparisons did not show differences in the pairwise analysis, the one-way ANOVA showed statistically significant differences in at least two groups for each variable (Tables S1 and S2 in the Supplemental Material).
4. Discussion
We were interested in understanding the innovativeness of nurses who engaged in innovative behaviors to quantify the characteristics and traits that make nurses more willing to be innovative in their practice. Understanding these will allow the tailoring of curricula for students, clinical education for nurses, and support work with health systems to create an environment more conducive to nurse-led innovation. Therefore, we sought to understand the individual and organizational characteristics of nurses who viewed themselves as innovators in comparison to those who did not, while also quantifying their innovativeness using the Scales for the Measurement of Innovativeness survey.
We also performed an EFA to confirm the survey items’ contribution to one of the four identified factors: Risk Aversion (Factor 1), Willingness to Try New Things and Being an Influencer and Leader (Factor 2), Creativity and Originality (Factor 3) and Being Challenged (Factor 4). From the survey results and the EFA, we were able to identify the correlates of innovative behavior (Figure 2).
4.1. Individual and Organizational Characteristics
As noted, there was a paucity of data regarding the characteristics that contribute to the innovativeness of nurses. Our results showed that there are individual and organizational characteristics that contribute to nurses’ innovativeness. Nurses who viewed themselves as innovators had higher average innovativeness scores and were more satisfied with their opportunities to be creative and innovative at their institutions.
Three main results emphasize these findings: (1) the number of innovation events participated in by respondents has a significant effect on their innovativeness scores, as those who attended six or more innovation events had higher innovativeness scores than those who attended 1–3 innovation events; (2) respondents who are more satisfied with aspects of their organizations had higher innovativeness scores than those who were not; and (3) respondents whose institutions offered various HCD/DT and innovation activities also had higher innovativeness scores compared with respondents whose institutions did not offer those activities. As noted, research focused on innovation has acknowledged specific individual and organizational characteristics that support innovative behavior; for individuals, a belief in one’s ability to be innovative and a focus on creativity; for organizations, supportive leadership as well as promoting awareness of and access to innovation [19,23,24].
Our findings showed that if nurses are exposed to innovation methodologies and activities, nurses are more willing to innovate. A recent study provided further evidence and found that nurses who attended innovation events, such as hackathons, were more confident when participating in innovative behaviors than those who had not [25].
Therefore, health system leaders invested in innovation should seek to create opportunities to encourage nurses to attend more HCD/DT and innovation events and offer these activities within their hospitals and health systems. Providing access to these may make nurses more willing to implement and create new ideas to solve the problems they see in their practices and be leaders in their institutions. Nevertheless, we found that only some institutions offered resources specific to HCD and DT. However, many offered resources specific to innovation. This is an important consideration, as we found in our previously published paper that nurses published papers regarding their use of HCD/DT methodologies in their practice less often than their physician counterparts [2]. Whether that means they are not using HCD/DT in practice or just not publishing their work needs further investigation. Regardless, future work should determine how hospitals and health systems define innovation, how they think about HCD and DT, and the rate at which they offer these activities to their nurses.
The work environment plays a prominent role in the innovativeness of nurses. We found that respondents who worked at institutions that supported innovative thinking by their nurses had higher innovativeness scores than nurses who worked at institutions that they felt did not support innovative thinking by nurses. There was also a relationship between innovativeness scores, how often respondents were able to implement innovation in their day-to-day work, and how satisfied they were with their overall work environment. Organizations that support nurses in their ability to innovate foster nurses with higher innovativeness scores and who are more willing to innovate. However, in our population, very few respondents (8.6%) felt as though they could “always” implement innovation methodologies in their day-to-day work, even though the majority of respondents (54.5%) were “very” willing to innovate.
Additionally, many respondents “often” felt obstacles at their institutions impeded them from being innovative. This is a crucial point to consider, as one may be willing to innovate but lack the resources, structure, and institutional support to innovate. For example, most nurses in our survey who worked in a clinical role stated that they did not get protected time away from the bedside to work on other projects.
This is concerning. As noted, respondents whose organizations supported innovative thinking by their nurses had higher innovativeness scores. With the current nursing climate of burnout and understaffing, some institutions may not see the value in allowing their nurses time away from their clinical responsibilities to work on innovation projects or attend innovation and HCD/DT activities [26]. Institutions should consider the future ramifications of this type of thinking, as our results show that it could have a detrimental effect on the innovativeness of their nurses.
Moreover, how supported by a Nurse Manager a respondent felt was significantly different for those who viewed themselves as innovators than for those who did not, with those identifying as innovators feeling less supported. Leadership is essential in how supported nurses feel and their abilities to innovate. Hospital and health system leaders should consider addressing how they support their leadership through innovation to have a nursing staff that thinks differently and feels supported to transform care.
4.2. Scales for the Measurement of Innovativeness
To understand the innovativeness of nurses, we sought to determine the reliability and face validity of the Scales for the Measurement of Innovativeness tool in our population. We found that the Scales for the Measurement of Innovativeness survey was highly reliable in our population of nurses engaging in innovative behaviors. In addition, face validity suggests that respondents understood the questions being asked of them regarding their innovativeness and found the questions appropriate.
From our EFA, we discovered four domains to guide our contextualization of nurses’ innovativeness: Factor 1 included questions related to risk aversion and reluctance to accept new ideas. Factor 2 included questions connected with a willingness to try new things and being an influencer and leader in relation to new ideas. Factor 3 included questions regarding creativity and originality in thinking and behavior. Factor 4 focused on being challenged by unanswered questions and ambiguity.
Interestingly, counter to our previous results showing a positive relationship between participation at innovation events and innovativeness scores, there was a negative correlation between the number of innovation events respondents participated in and risk aversion and reluctance to accept new ideas for Factor 1, meaning that those who are risk averse and reluctant to accept new ideas participated in fewer innovation events. Therefore, encouraging nurses who may tend more toward risk aversion to attend events such as hackathons, where participants are encouraged to take risks and be creative in a safe and supportive environment, may help to decrease reluctance to innovate in their clinical practices. Future work should explore this hypothesis further.
The EFA also showed that, for nurses to be innovative, organizational factors play a significant role. Consequently, we need to consider how the environment of hospitals and health systems enables or dissuades nurses from leading in innovation. As was shown, nurses engaging in innovative behaviors are willing to innovate. However, if the environment is not conducive to encouraging innovation by nurses, innovative behaviors could be stifled.
4.3. Limitations
There are several limitations to this study. This study only surveyed nurses in the US; therefore, the heterogeneity of this group may not be generalizable to other nurses residing outside of the US. This was a cross-sectional study and, as such, may not represent the experiences of nurses over time. Building on this program of study, a longitudinal study should be considered in the future. Additionally, whether willingness to innovate translates to implementation needs to be determined.
As this study only examined nurses actively engaging in innovation behaviors that support innovation, we may have unintentionally excluded nurses who innovate in their clinical practice but have yet to participate in innovative behaviors such as hackathons, innovation workshops, or design sprints. Future studies should examine the innovativeness of all nurses, not just those engaging in innovative behaviors. This will allow us to understand the innovativeness of the nursing profession in general.
5. Conclusions
Compared to those who do not, nurses who view themselves as innovators have higher innovativeness scores. There are multiple individual and organizational characteristics that support the innovativeness of nurses, including how many innovation events one has participated in within the past year, exposure to HCD/DT workshops, whether one feels there is institutional support for innovative thinking by nurses, and whether the institution offered certain HCD/DT and innovation activities. Understanding how to incorporate these characteristics into the curricula of nursing schools and workplace culture will allow more nurses to be prepared to innovate and feel confident doing so. Academic institutions and healthcare organizations have a responsibility to support and foster the innovativeness of nurses for the good of the profession as well as the health and well-being of our patients and communities.
Supplementary Materials
The following supporting information can be downloaded at: https://www.mdpi.com/article/10.3390/nursrep14020066/s1, Table S1: Exploratory Factor Analysis across Individual Characteristics; Table S2: Exploratory Factory Analysis across Organizational Characteristics.
Author Contributions
Conceptualization, M.L., J.A.B., G.D. and S.A.; methodology, M.L., J.A.B., G.D. and S.A.; validation, M.L., J.A.B. and S.A.; formal analysis, M.L., J.A.B. and S.A.; investigation, M.L.; data curation, M.L., J.A.B. and S.A.; writing—original draft preparation, M.L.; writing—review and editing, M.L., J.A.B., G.D., S.A., P.Z.C. and J.M.B.C.; visualization, M.L., J.A.B., G.D. and S.A; supervision, M.L., J.A.B., G.D. and S.A. All authors have read and agreed to the published version of the manuscript.
Funding
This research received no external funding.
Institutional Review Board Statement
The study was conducted in accordance with the Declaration of Helsinki and approved by the Institutional Review Board (or Ethics Committee) of the University of Pennsylvania (protocol code #852671 and 8 December 2022).
Informed Consent Statement
Informed consent was obtained from all subjects involved in the study. Respondents who passed the screening survey were provided with study consent language. The participants consented by completing the survey and submitting it through the online portal (Qualtrics, Provo, UT, USA).
Data Availability Statement
The data presented in this study are available on request from the corresponding author.
Public Involvement Statement
There was no public involvement in any aspect of this research.
Guidelines and Standards Statement
This manuscript was drafted against the Strengthening the Reporting of Observational Studies in Epidemiology (STROBE) guidelines for reporting observational studies.
Use of Artificial Intelligence
A language editing application was used to check the grammar, spelling and for any unintentional plagiarism.
Acknowledgments
We want to thank the nurses who took the time to participate in this study—and who engage in innovative behaviors.
Conflicts of Interest
M.L. is the PI and Co-I on grants related to the use of Human-centered Design and Design Thinking in healthcare.
References
- Altman, M.; Huang, T.T.; Breland, J.Y. Peer reviewed: Design thinking in health care. Prev. Chronic Dis. 2018, 15, E117. [Google Scholar] [CrossRef] [PubMed]
- Leary, M.; Cacchione, P.C.; Demiris, G.; Brooks Carthon, J.M.; Bauermeister, J.A. An Integrative Review of Human-centered Design and Design Thinking for the Creation of Health Interventions. Nurs. Forum 2022, 57, 1137–1152. [Google Scholar] [CrossRef] [PubMed]
- American Nurses Association. ANA Enterprise Strategic Plan. Available online: https://www.nursingworld.org/~4abeff/globalassets/ana-enterprise/about-us/descriptions-enterprise-strategies-and-objectives.pdf (accessed on 1 July 2022).
- BDO. Unleashing Nurse-Led Innovation. Available online: https://www.bdo.com/insights/industries/healthcare/unleashing-nurse-led-innovation (accessed on 13 February 2021).
- The Future of Nursing 2020–2030: Charting a Path to Achieve Health Equity. Available online: https://nap.nationalacademies.org/catalog/25982/the-future-of-nursing-2020-2030-charting-a-path-to (accessed on 29 April 2023).
- Hassmiller, S.B.; Daniel, G.A. Taking Action: Top 10 Priorities to Promote Health Equity and Well-Being in Nursing; Sigma Theta Tau: Indianapolis, IN, USA, 2023. [Google Scholar]
- O’Hara, S.; Ackerman, M.H.; Raderstorf, T.; Kilbridge, J.F.; Melnyk, B.M. Building and sustaining a culture of innovation in nursing Academics, Research, Policy, and Practice: Outcomes of the National Innovation Summit. J. Prof. Nurs. 2022, 43, 5–11. [Google Scholar] [CrossRef] [PubMed]
- American Hospital Association. Innovation/New Models of Care. 2023. Available online: https://www.aha.org/topics/innovationnew-models-care (accessed on 29 April 2023).
- Hurt, H.T.; Joseph, K.; Cook, C.D. Scales for the measurement of innovativeness. Hum. Commun. Res. 1977, 4, 58–65. [Google Scholar] [CrossRef]
- Asurakkody, T.A.; Shin, S.Y. Innovative Behavior in Nursing Context: A Concept Analysis. Asian Nurs. Res. 2018, 12, 237–244. [Google Scholar] [CrossRef] [PubMed]
- Dy Bunpin, J.J., 3rd; Chapman, S.; Blegen, M.; Spetz, J. Differences in Innovative Behavior Among Hospital-Based Registered Nurses. J. Nurs. Adm. 2016, 46, 122–127. [Google Scholar] [CrossRef] [PubMed]
- Clement-O’Brien, K.; Polit, D.F.; Fitzpatrick, J.J. Innovativeness of nurse leaders. J. Nurs. Manag. 2011, 19, 431–438. [Google Scholar] [CrossRef] [PubMed]
- Kennedy, B.; Curtis, K.; Waters, D. Is there a relationship between personality and choice of nursing specialty: An integrative literature review. BMC Nurs. 2014, 13, 40. [Google Scholar] [CrossRef] [PubMed]
- Stilgenbauer, D.J.; Fitzpatrick, J.J. Levels of Innovativeness among Nurse Leaders in Acute Care Hospitals. J. Nurs. Adm. 2019, 49, 150–155. [Google Scholar] [CrossRef] [PubMed]
- Kimble, L.; Massoud, M.R. What do we mean by innovation in healthcare. Eur. Med. J. 2017, 1, 89–91. [Google Scholar] [CrossRef]
- World Health Organization. Nursing and Midwifery; World Health Organization; Available online: https://www.who.int/news-room/fact-sheets/detail/nursing-and-midwifery (accessed on 18 March 2022).
- Selznick, B.S.; Mayhew, M.J. Measuring undergraduates’ innovation capacities. Res. High. Educ. 2018, 59, 744–764. [Google Scholar] [CrossRef]
- Rogers, E.M.; Singhal, A.; Quinlan, M.M. Diffusion of innovations. In An Integrated Approach to Communication Theory and Research; Routledge: Oxfordshire, UK, 2010; pp. 432–448. [Google Scholar]
- Scott, S.G.; Bruce, R.A. Determinants of innovative behavior: A path model of individual innovation in the workplace. Acad. Manag. J. 1994, 37, 580–607. [Google Scholar] [CrossRef]
- Sloane, D.M.; Smith, H.L.; McHugh, M.D.; Aiken, L.H. Effect of Changes in Hospital Nursing Resources on Improvements in Patient Safety and Quality of Care: A Panel Study. Med. Care 2018, 56, 1001–1008. [Google Scholar] [CrossRef] [PubMed]
- García-Pérez, M.A. Use and misuse of corrections for multiple testing. Methods Psychol. 2023, 8, 100120. [Google Scholar] [CrossRef]
- Rothman, K.J. No adjustments are needed for multiple comparisons. Epidemiology 1990, 1, 43–46. [Google Scholar] [CrossRef] [PubMed]
- Siregar ZM, E.; Suryana, E.A.; Senen, S.H. Factors influencing innovative work behavior: An individual factors perspective. Int. J. Sci. Technol. Res. 2019, 8, 324–327. [Google Scholar]
- Li, X.; Zheng, Y. The Influential Factors of Employees’ Innovative Behavior and the Management Advices. J. Serv. Sci. Manag. 2014, 7, 446–450. [Google Scholar] [CrossRef]
- Kagan, O.; Sciasci, N.G.; Koszalinski, R.S.; Kagan, D.H.; Leary, M.; Nadel, H. Nurses’ confidence in starting a new venture, startup or project in the context of nurse-led hackathons: Results of prehackathon survey. Nurs. Outlook 2023, 71, 101961. [Google Scholar] [CrossRef] [PubMed]
- Nurse.org. This Is the State of Nursing. 2022. Available online: https://media.nurse.org/docs/State+of+Nursing+-+2023.pdf (accessed on 17 March 2023).
Disclaimer/Publisher’s Note: The statements, opinions and data contained in all publications are solely those of the individual author(s) and contributor(s) and not of MDPI and/or the editor(s). MDPI and/or the editor(s) disclaim responsibility for any injury to people or property resulting from any ideas, methods, instructions or products referred to in the content. |
© 2024 by the authors. Licensee MDPI, Basel, Switzerland. This article is an open access article distributed under the terms and conditions of the Creative Commons Attribution (CC BY) license (https://creativecommons.org/licenses/by/4.0/).