
Floristic Diversity, Indicator and Suitable Species for Andean Livestock in the Sillapata Micro-Watershed, Acopalca


Abstract
1. Introduction
2. Materials and Methods
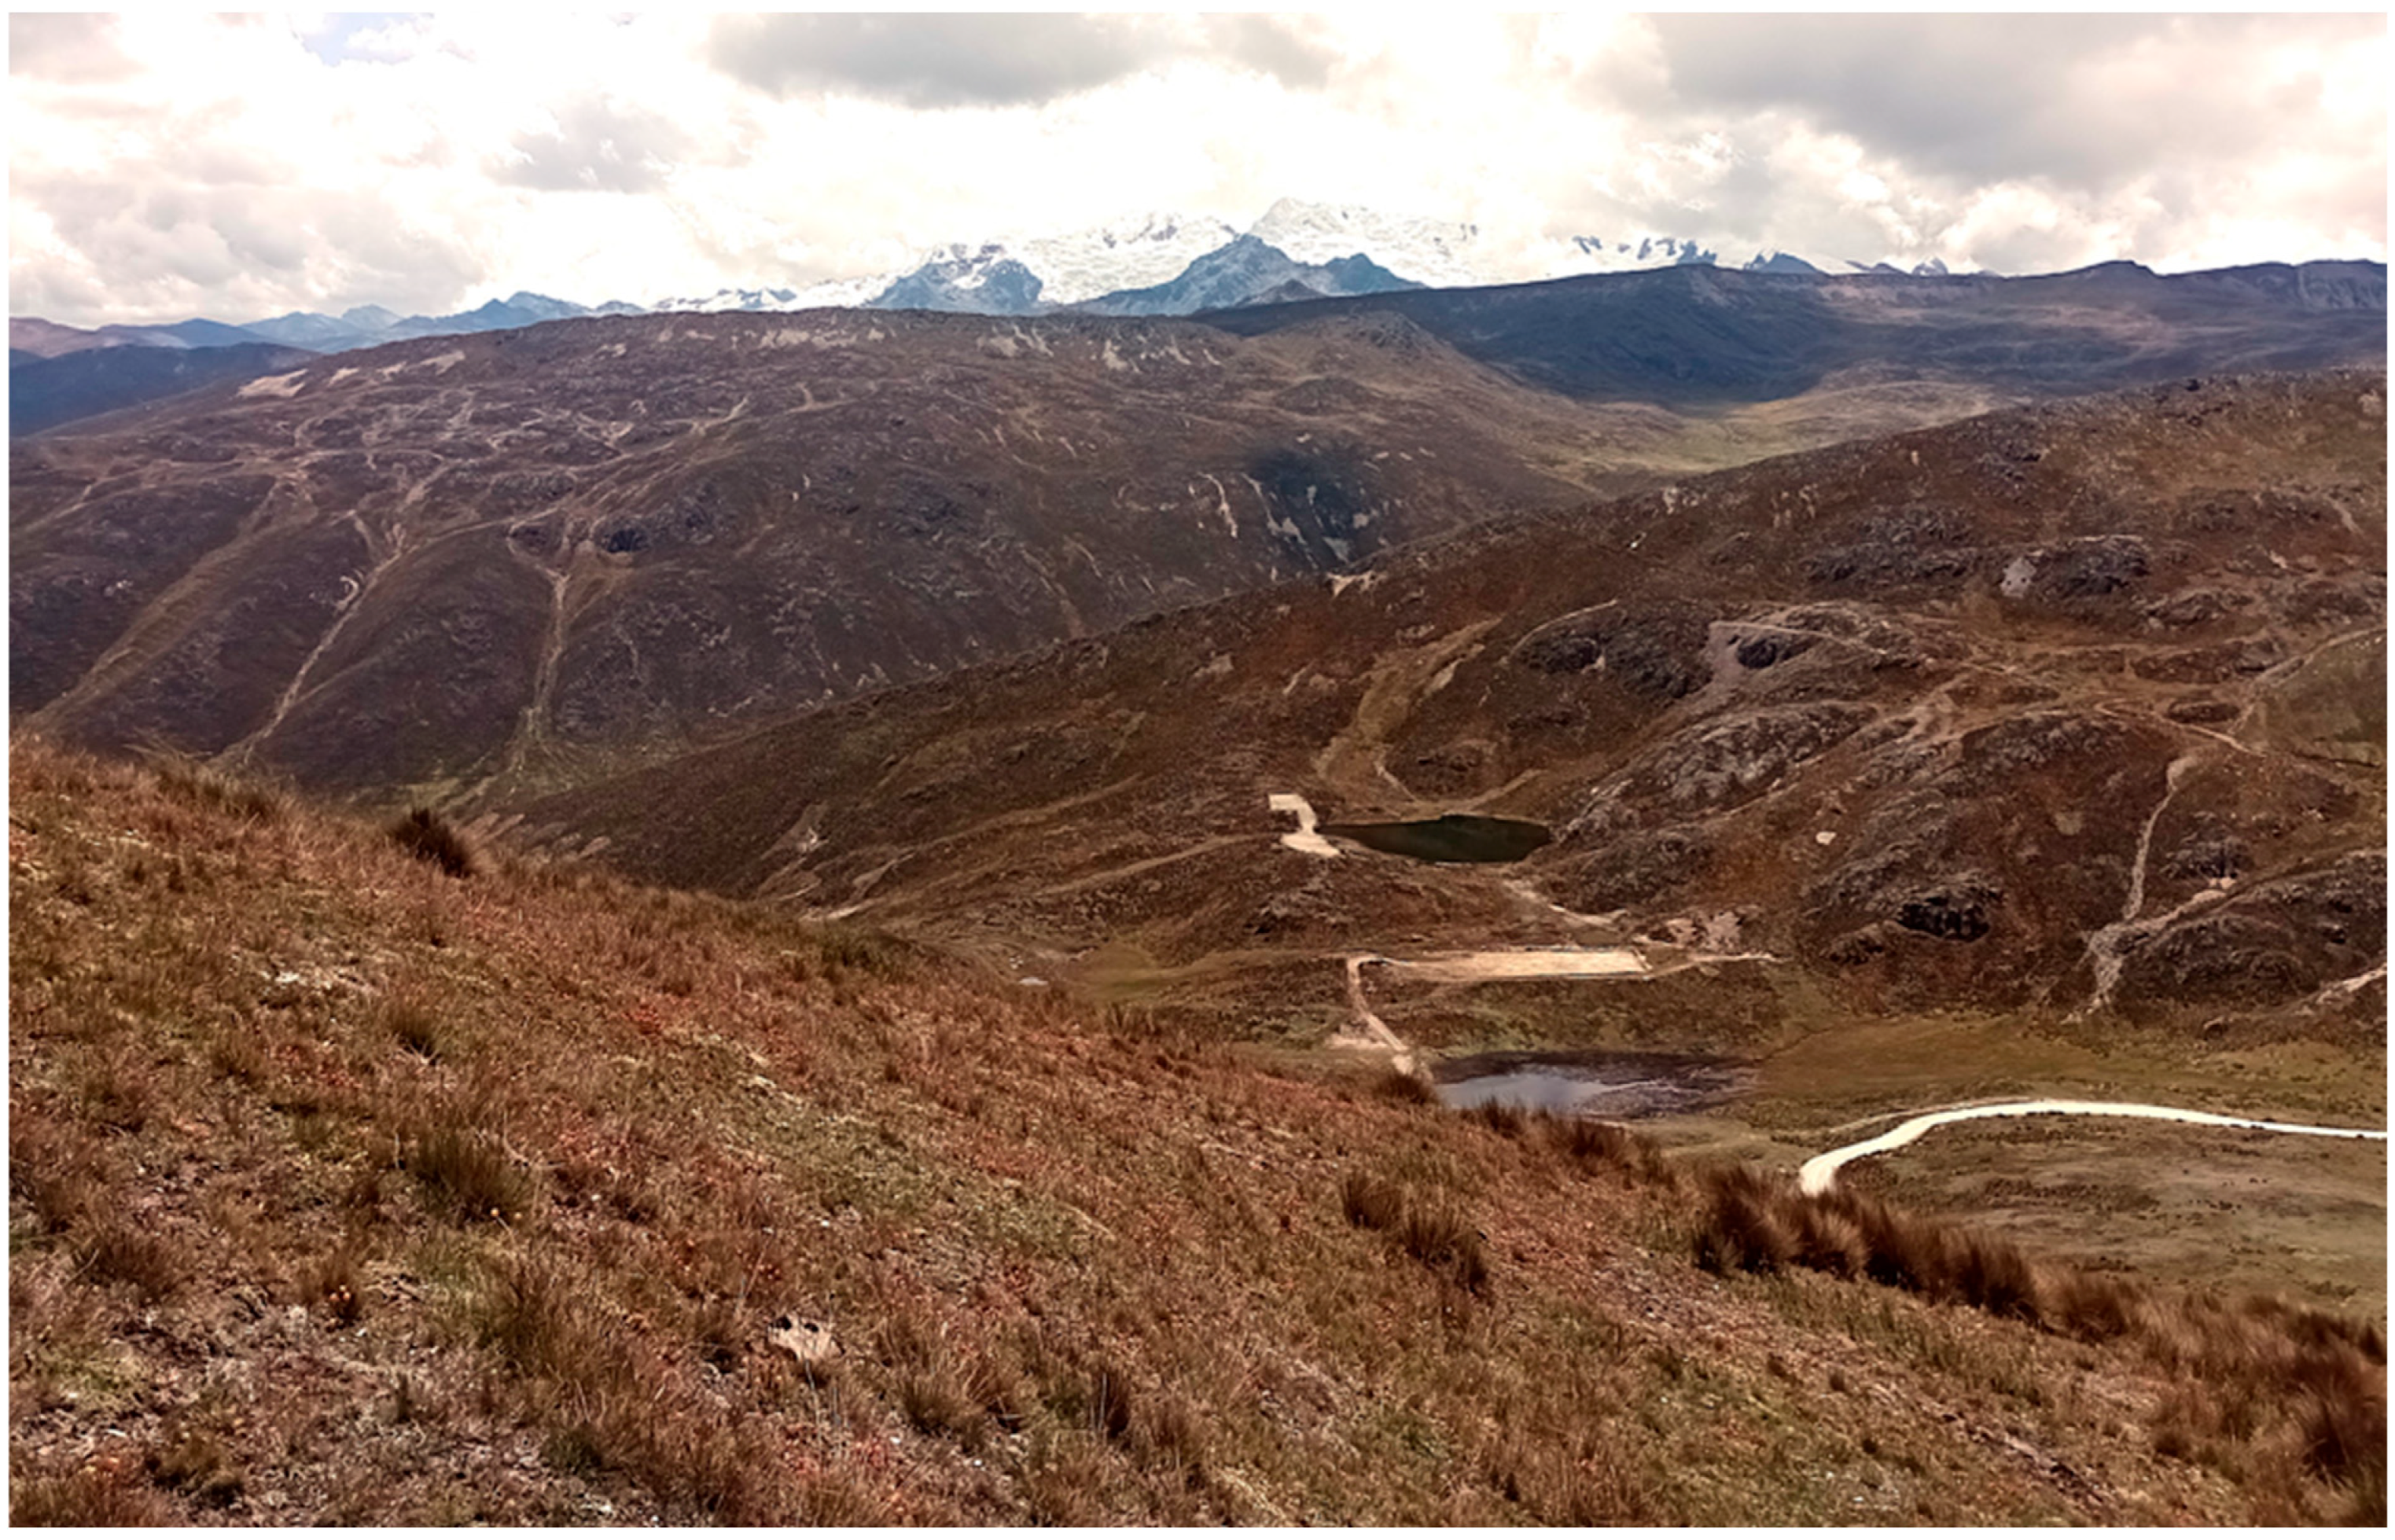
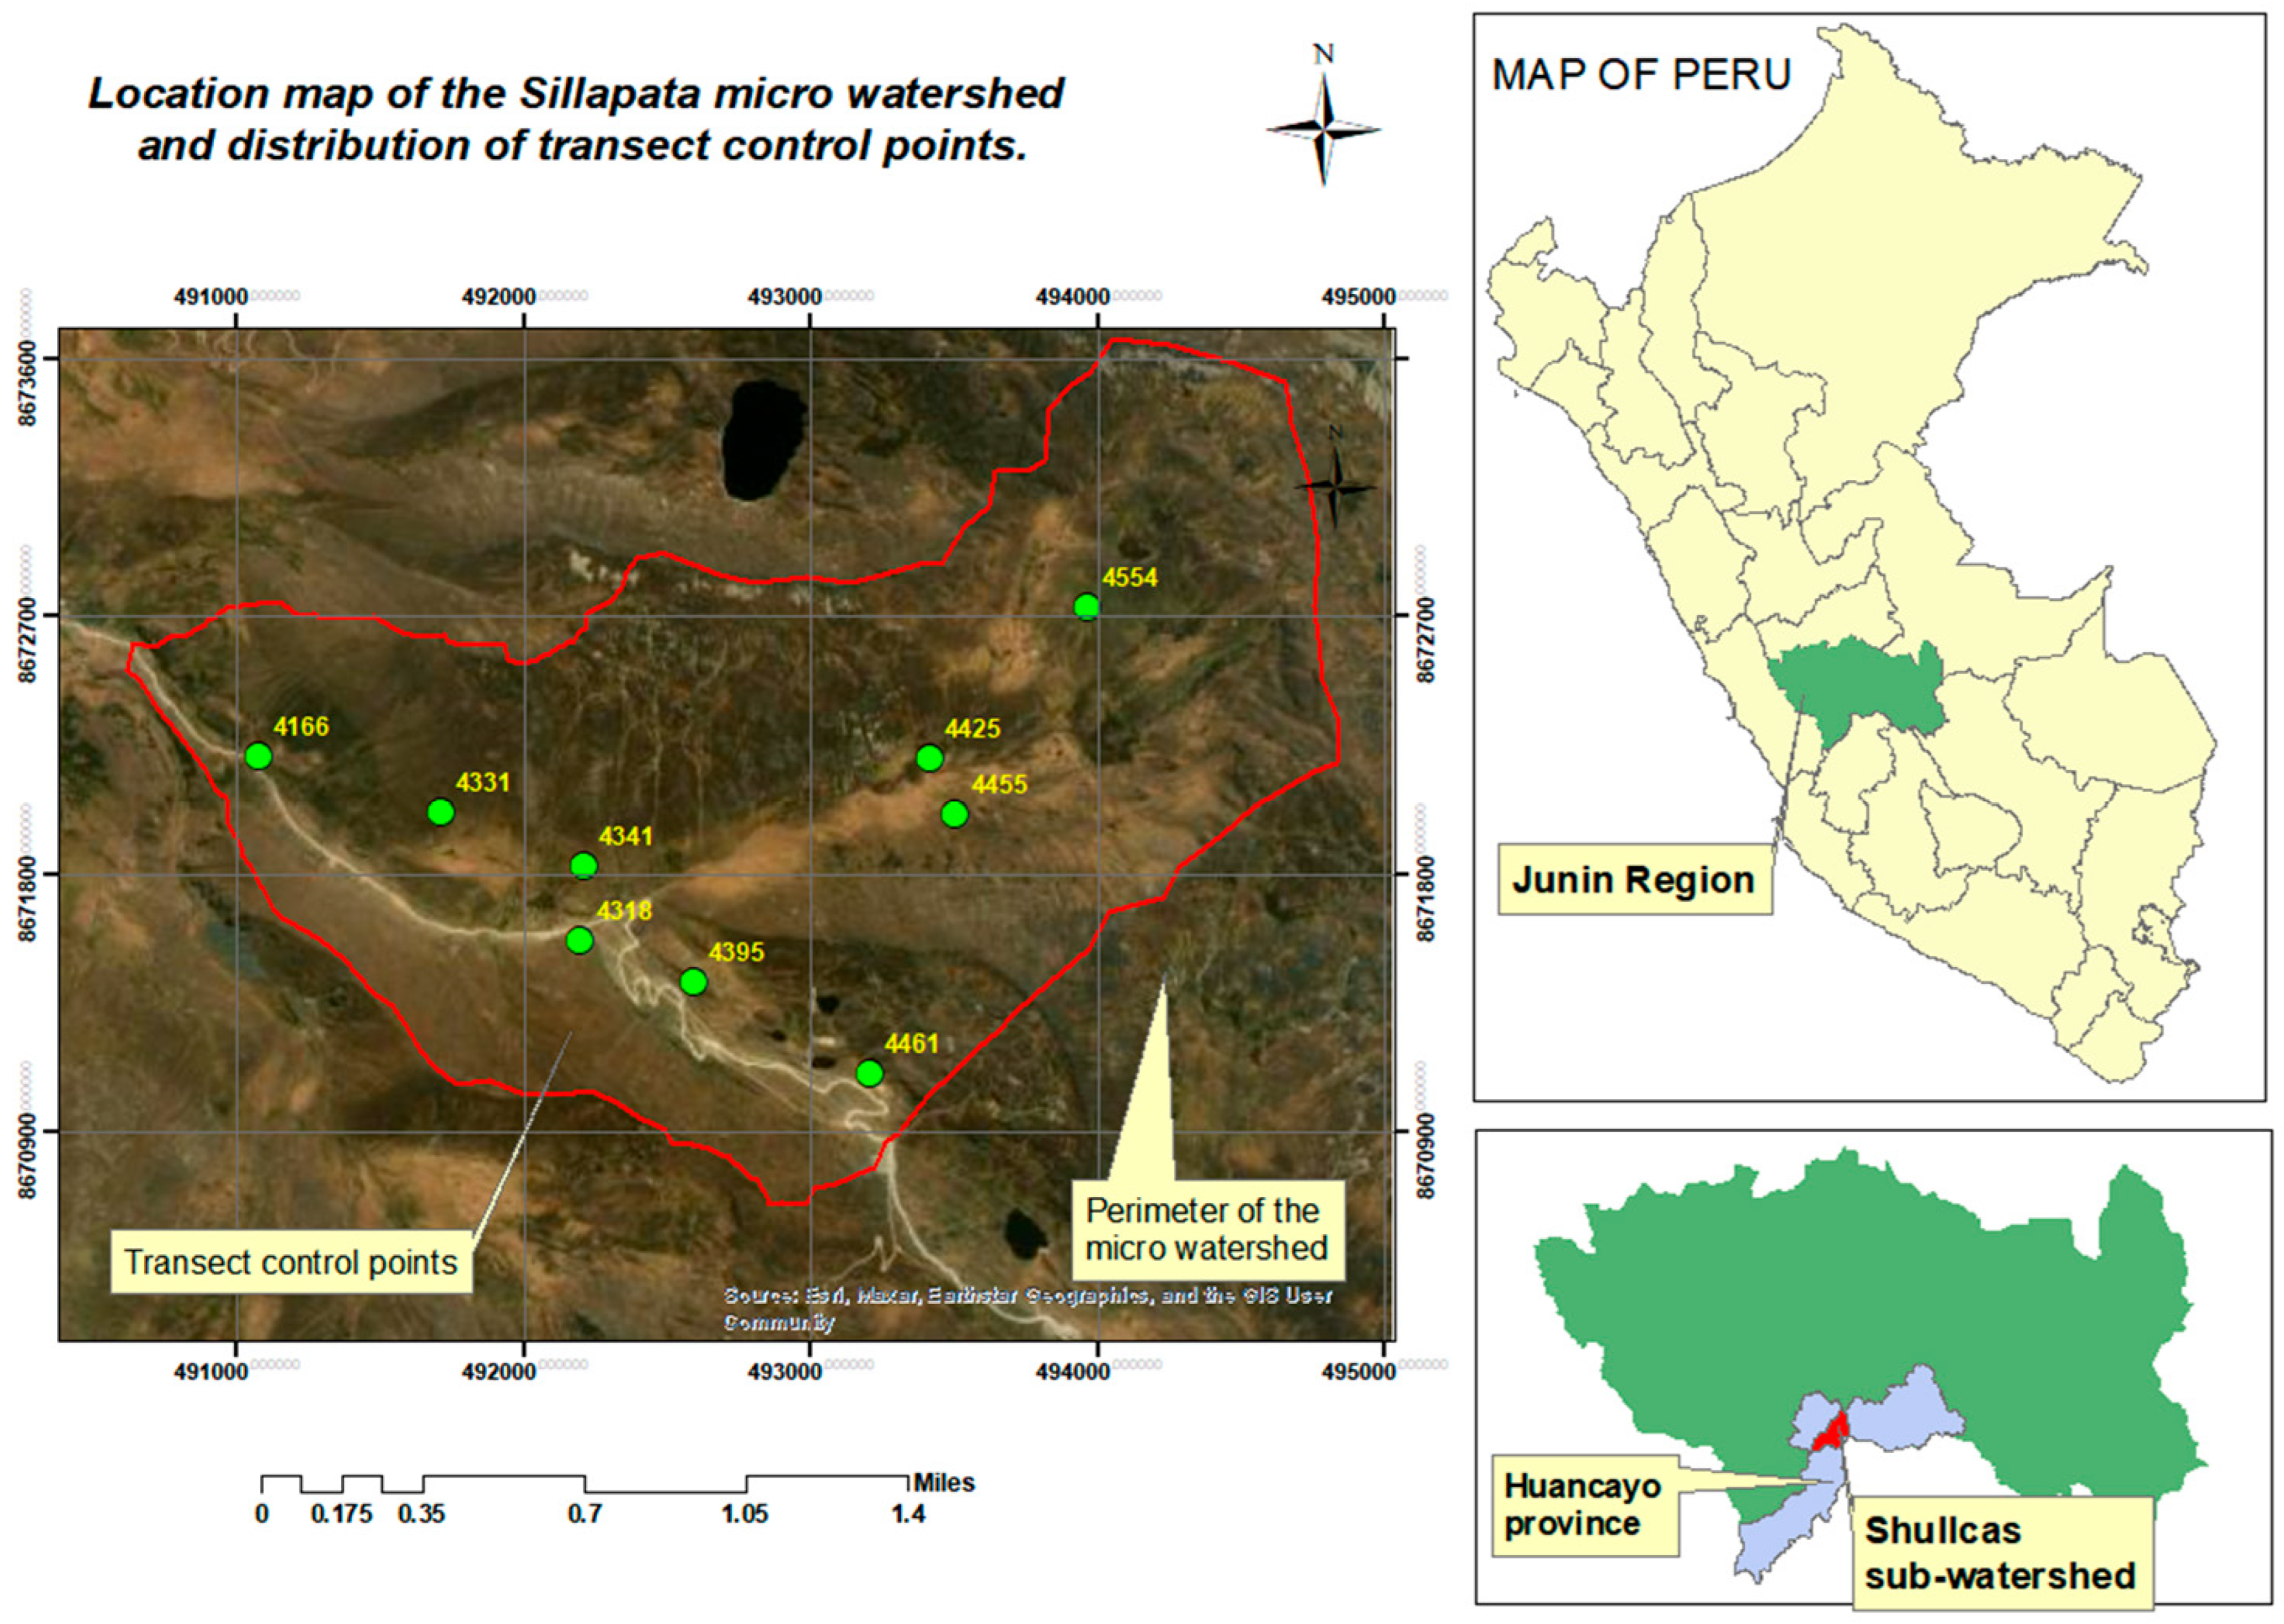
2.1. Study Location
2.2. Data Collection Techniques
2.3. Data Processing Techniques
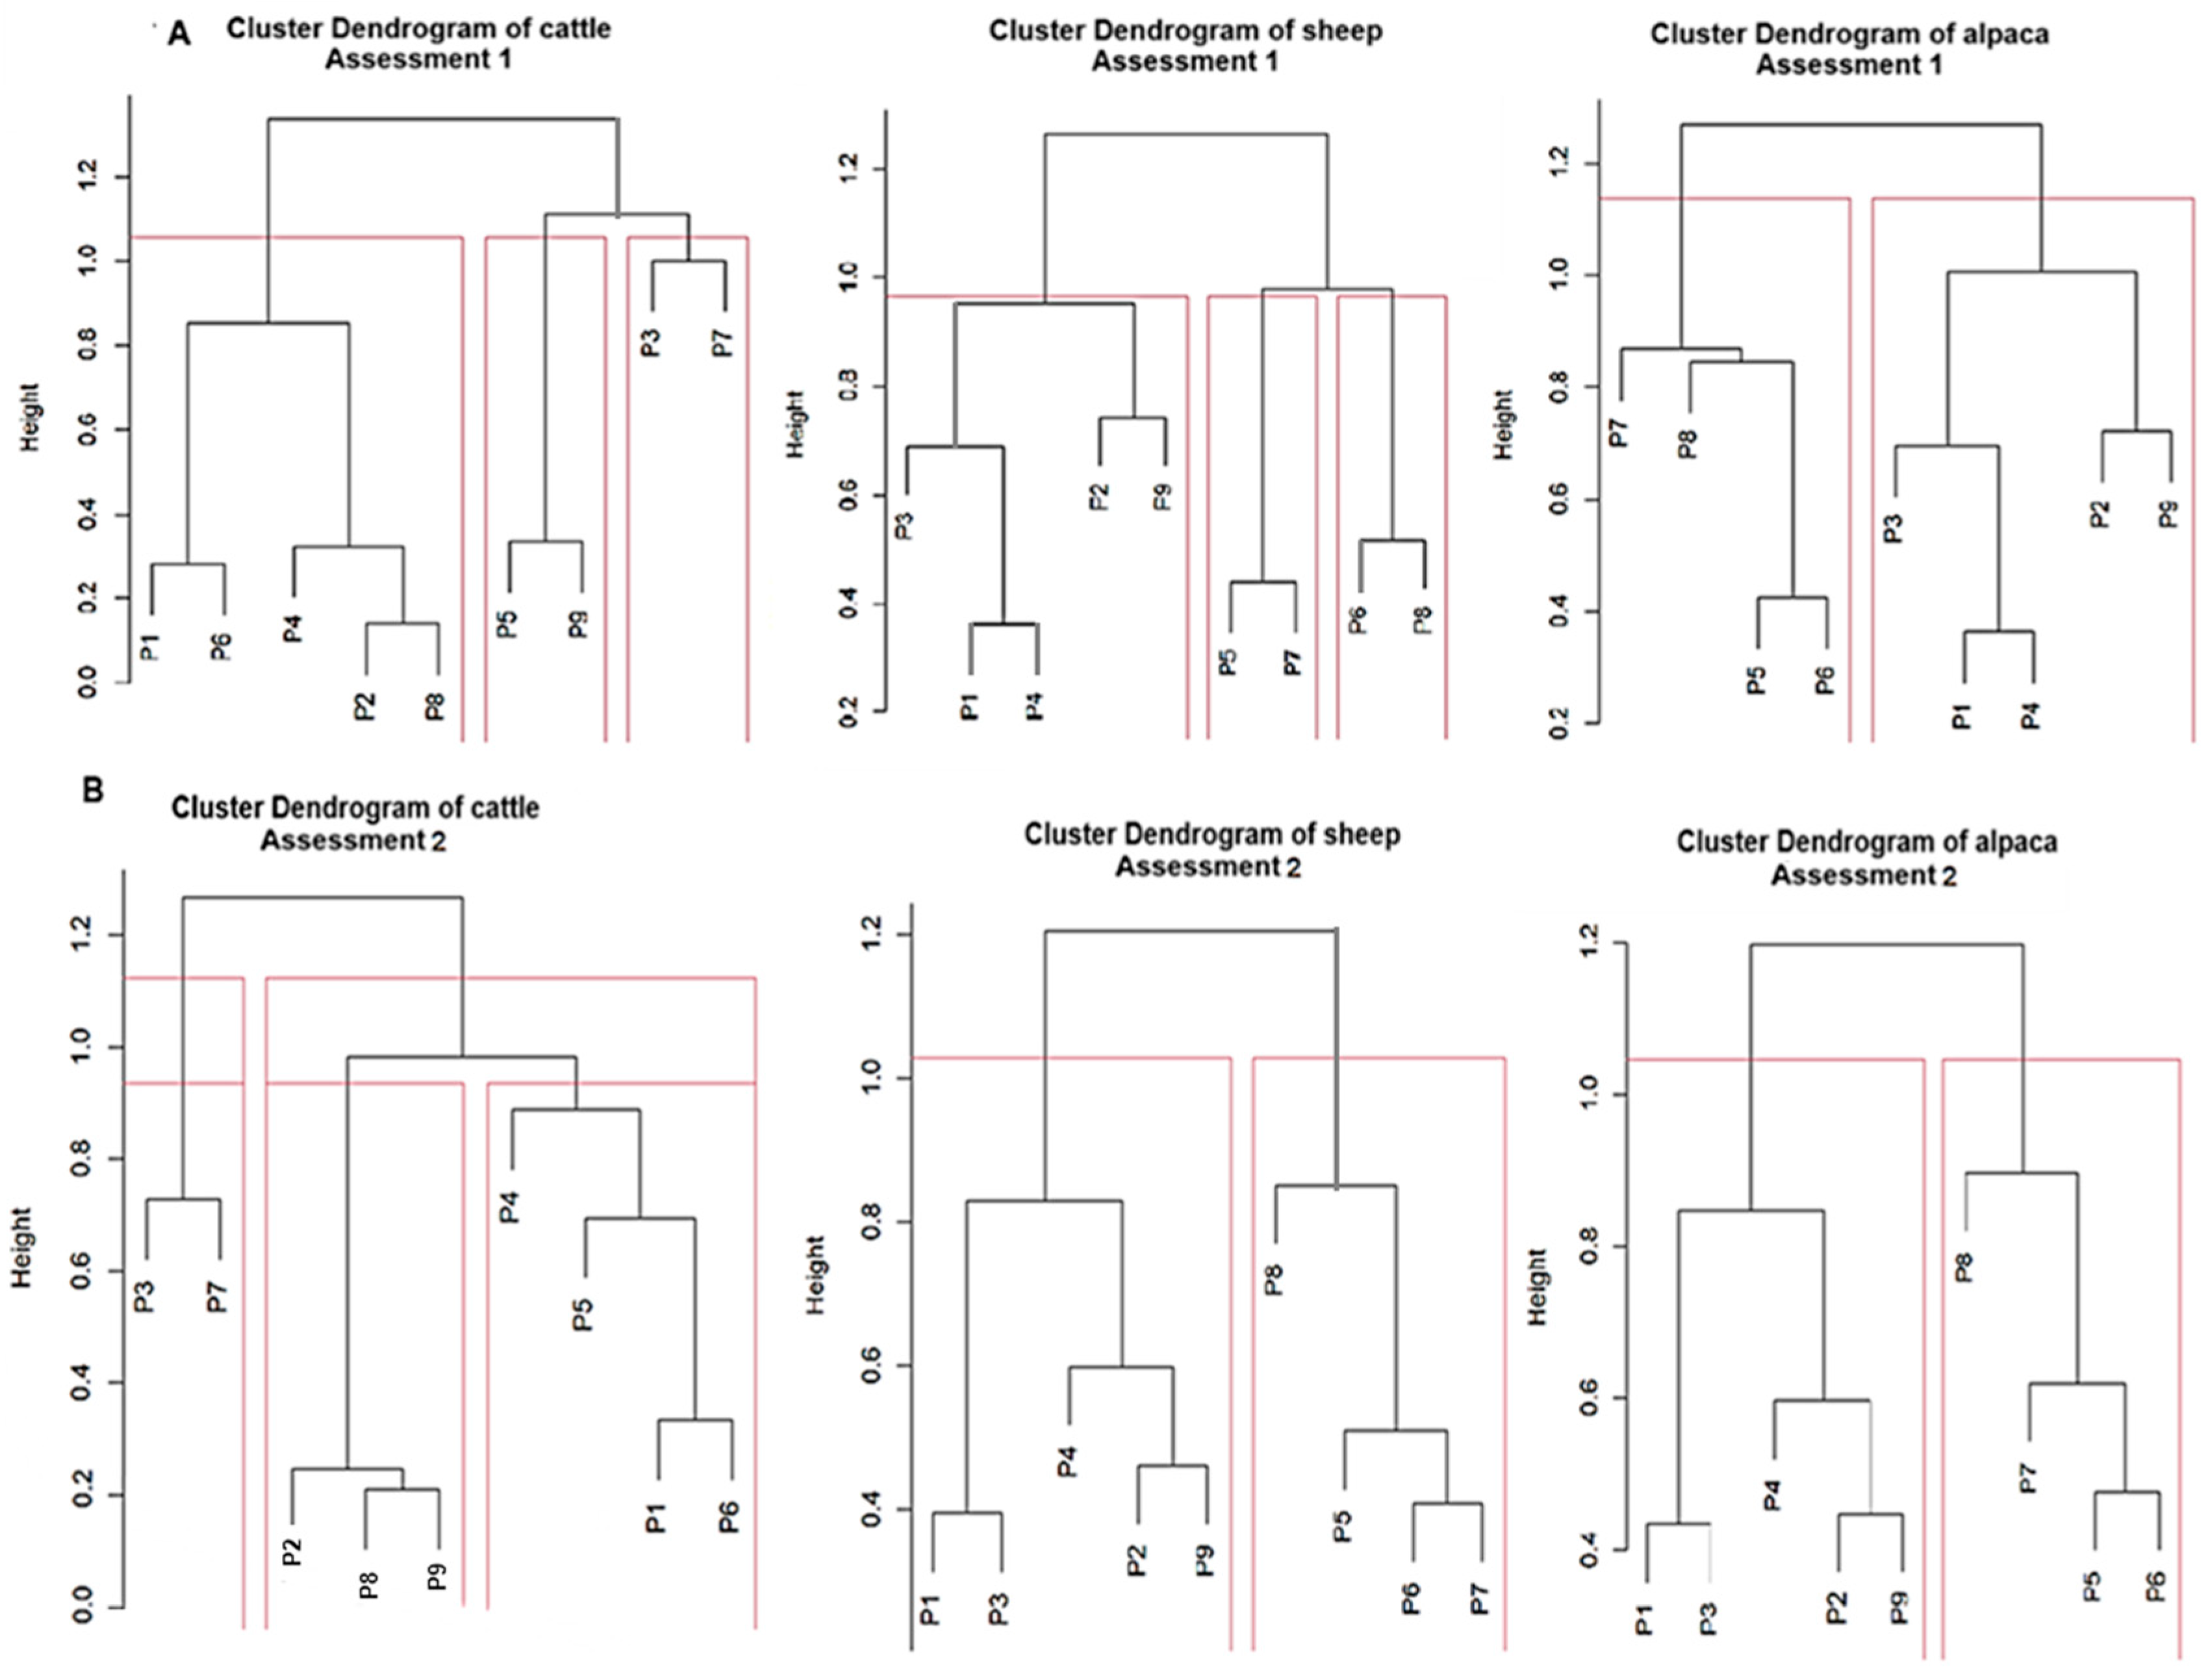
3. Results
3.1. Variation Dynamics of Floristic Diversity According to Altitudinal Gradient in the Sillapata Micro-Watershed in the Community of Acopalca
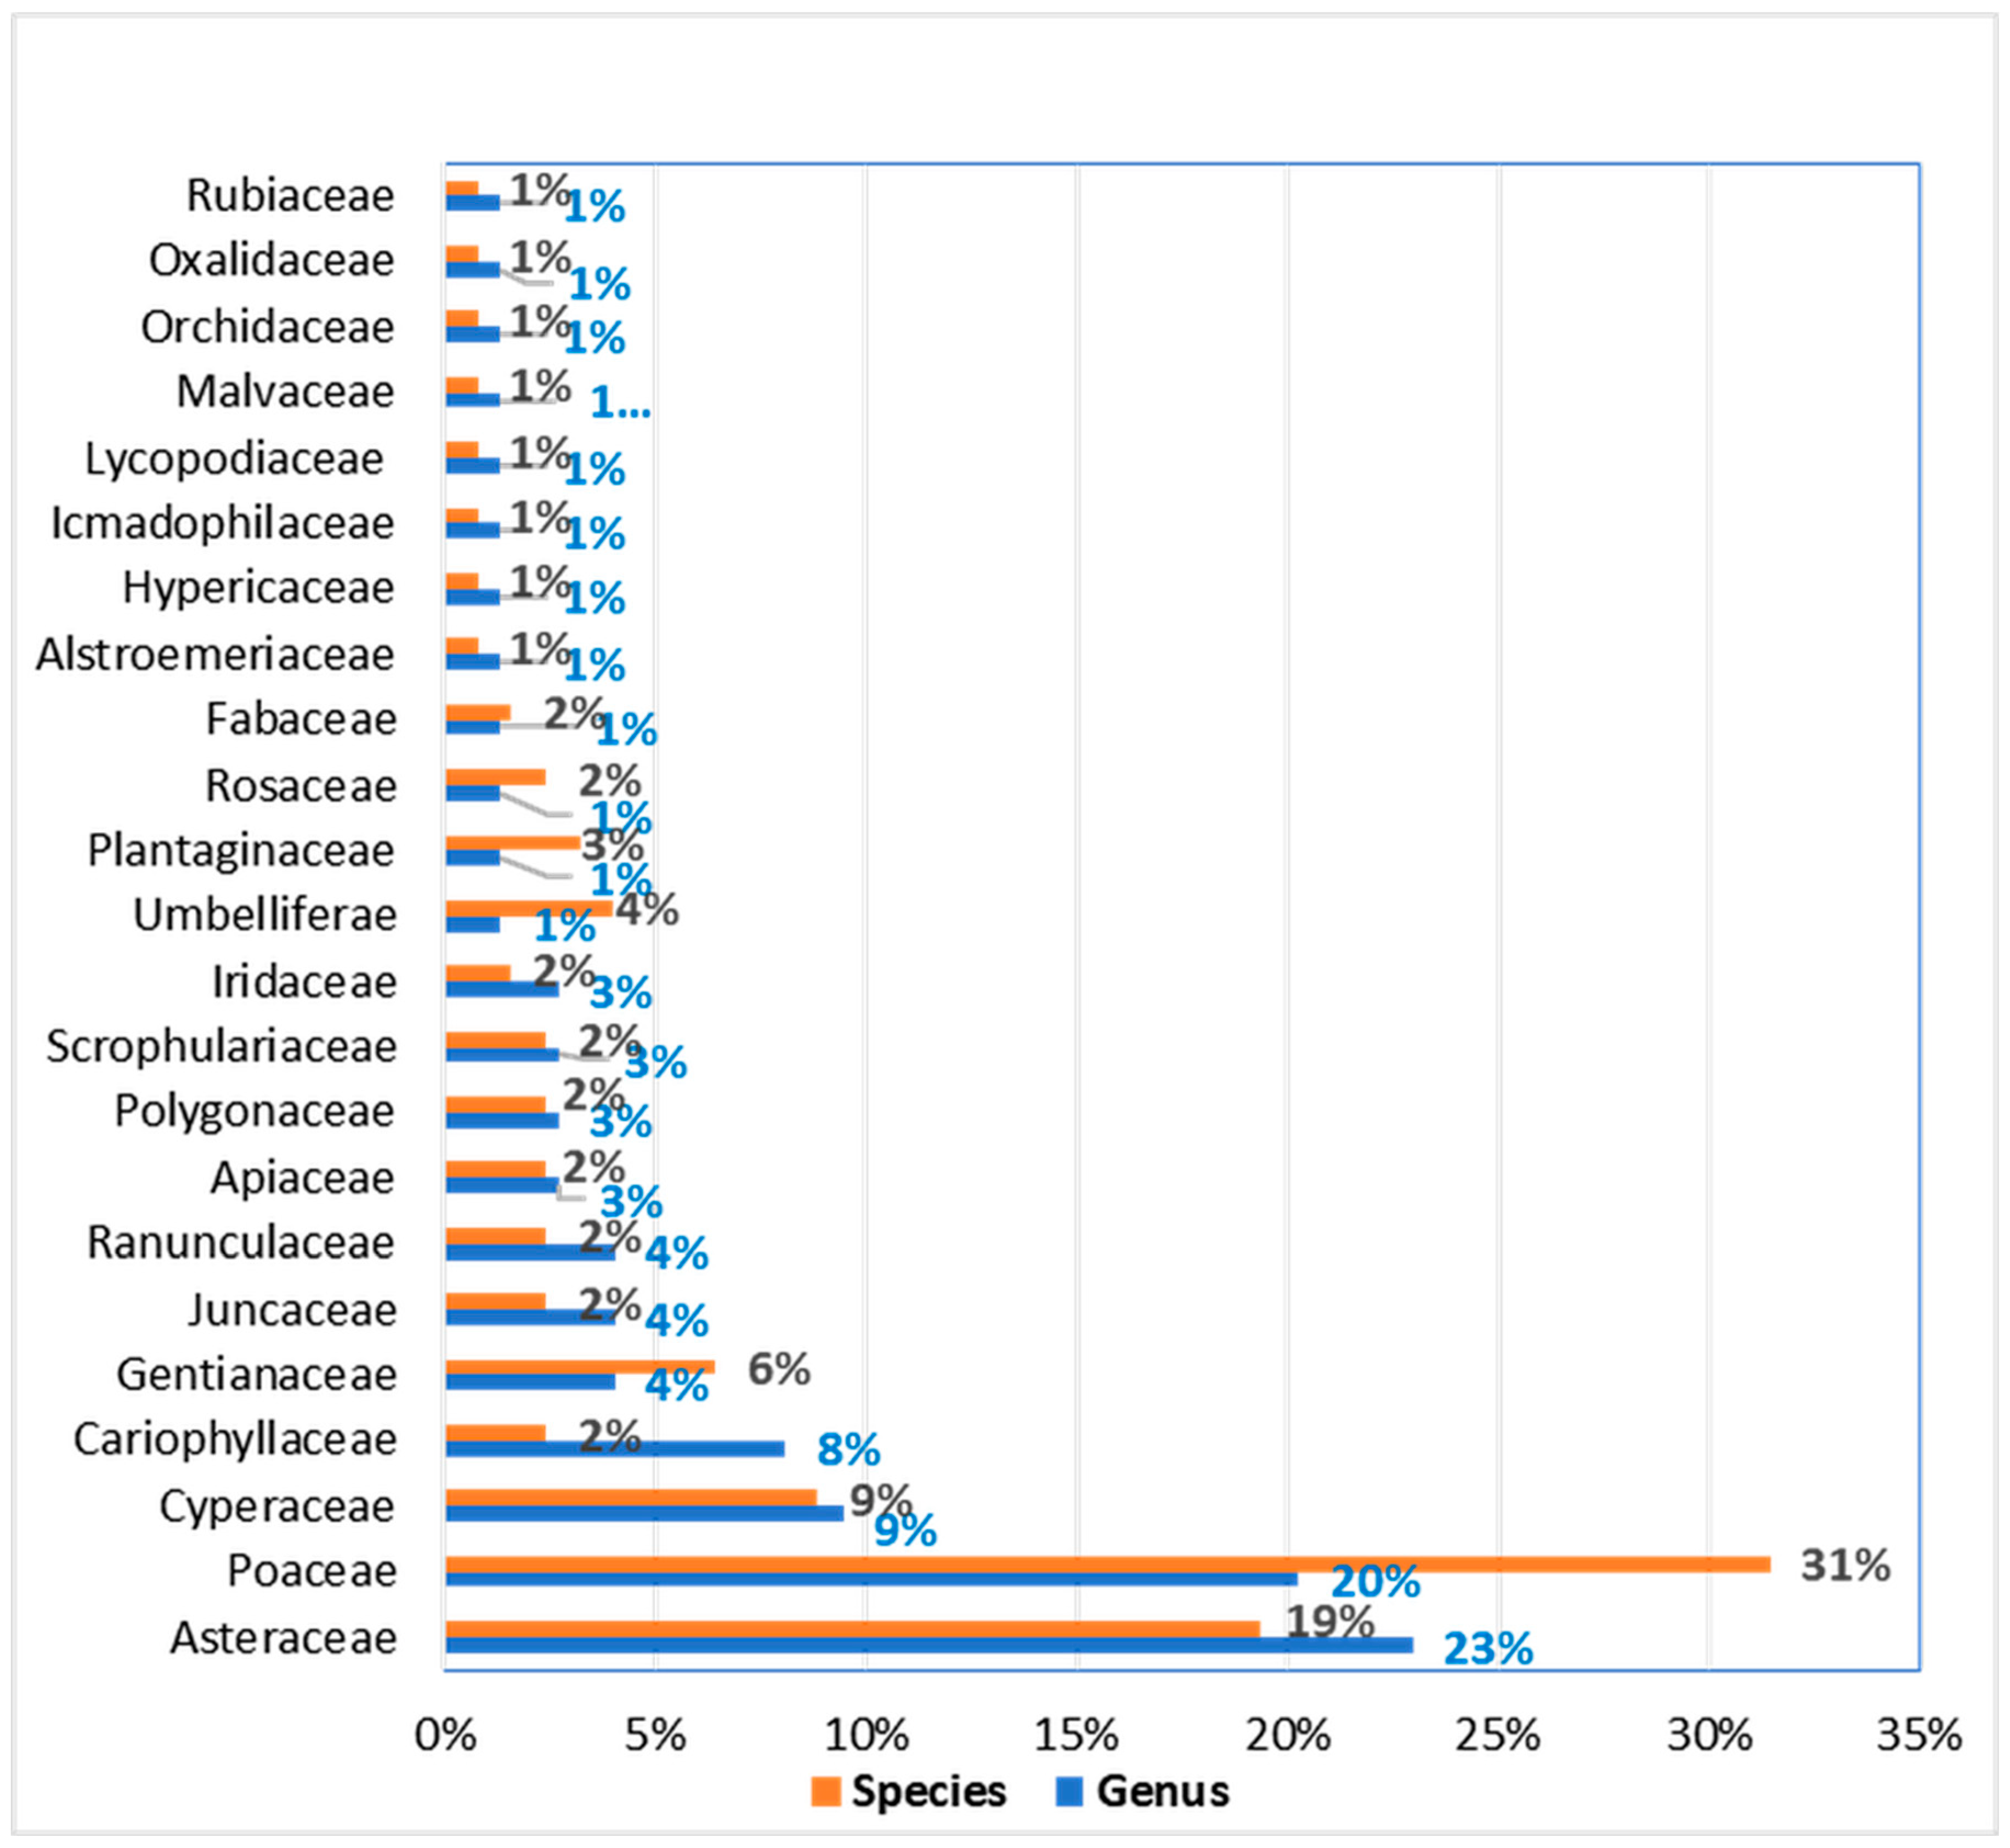
3.1.1. Species Richness and Composition
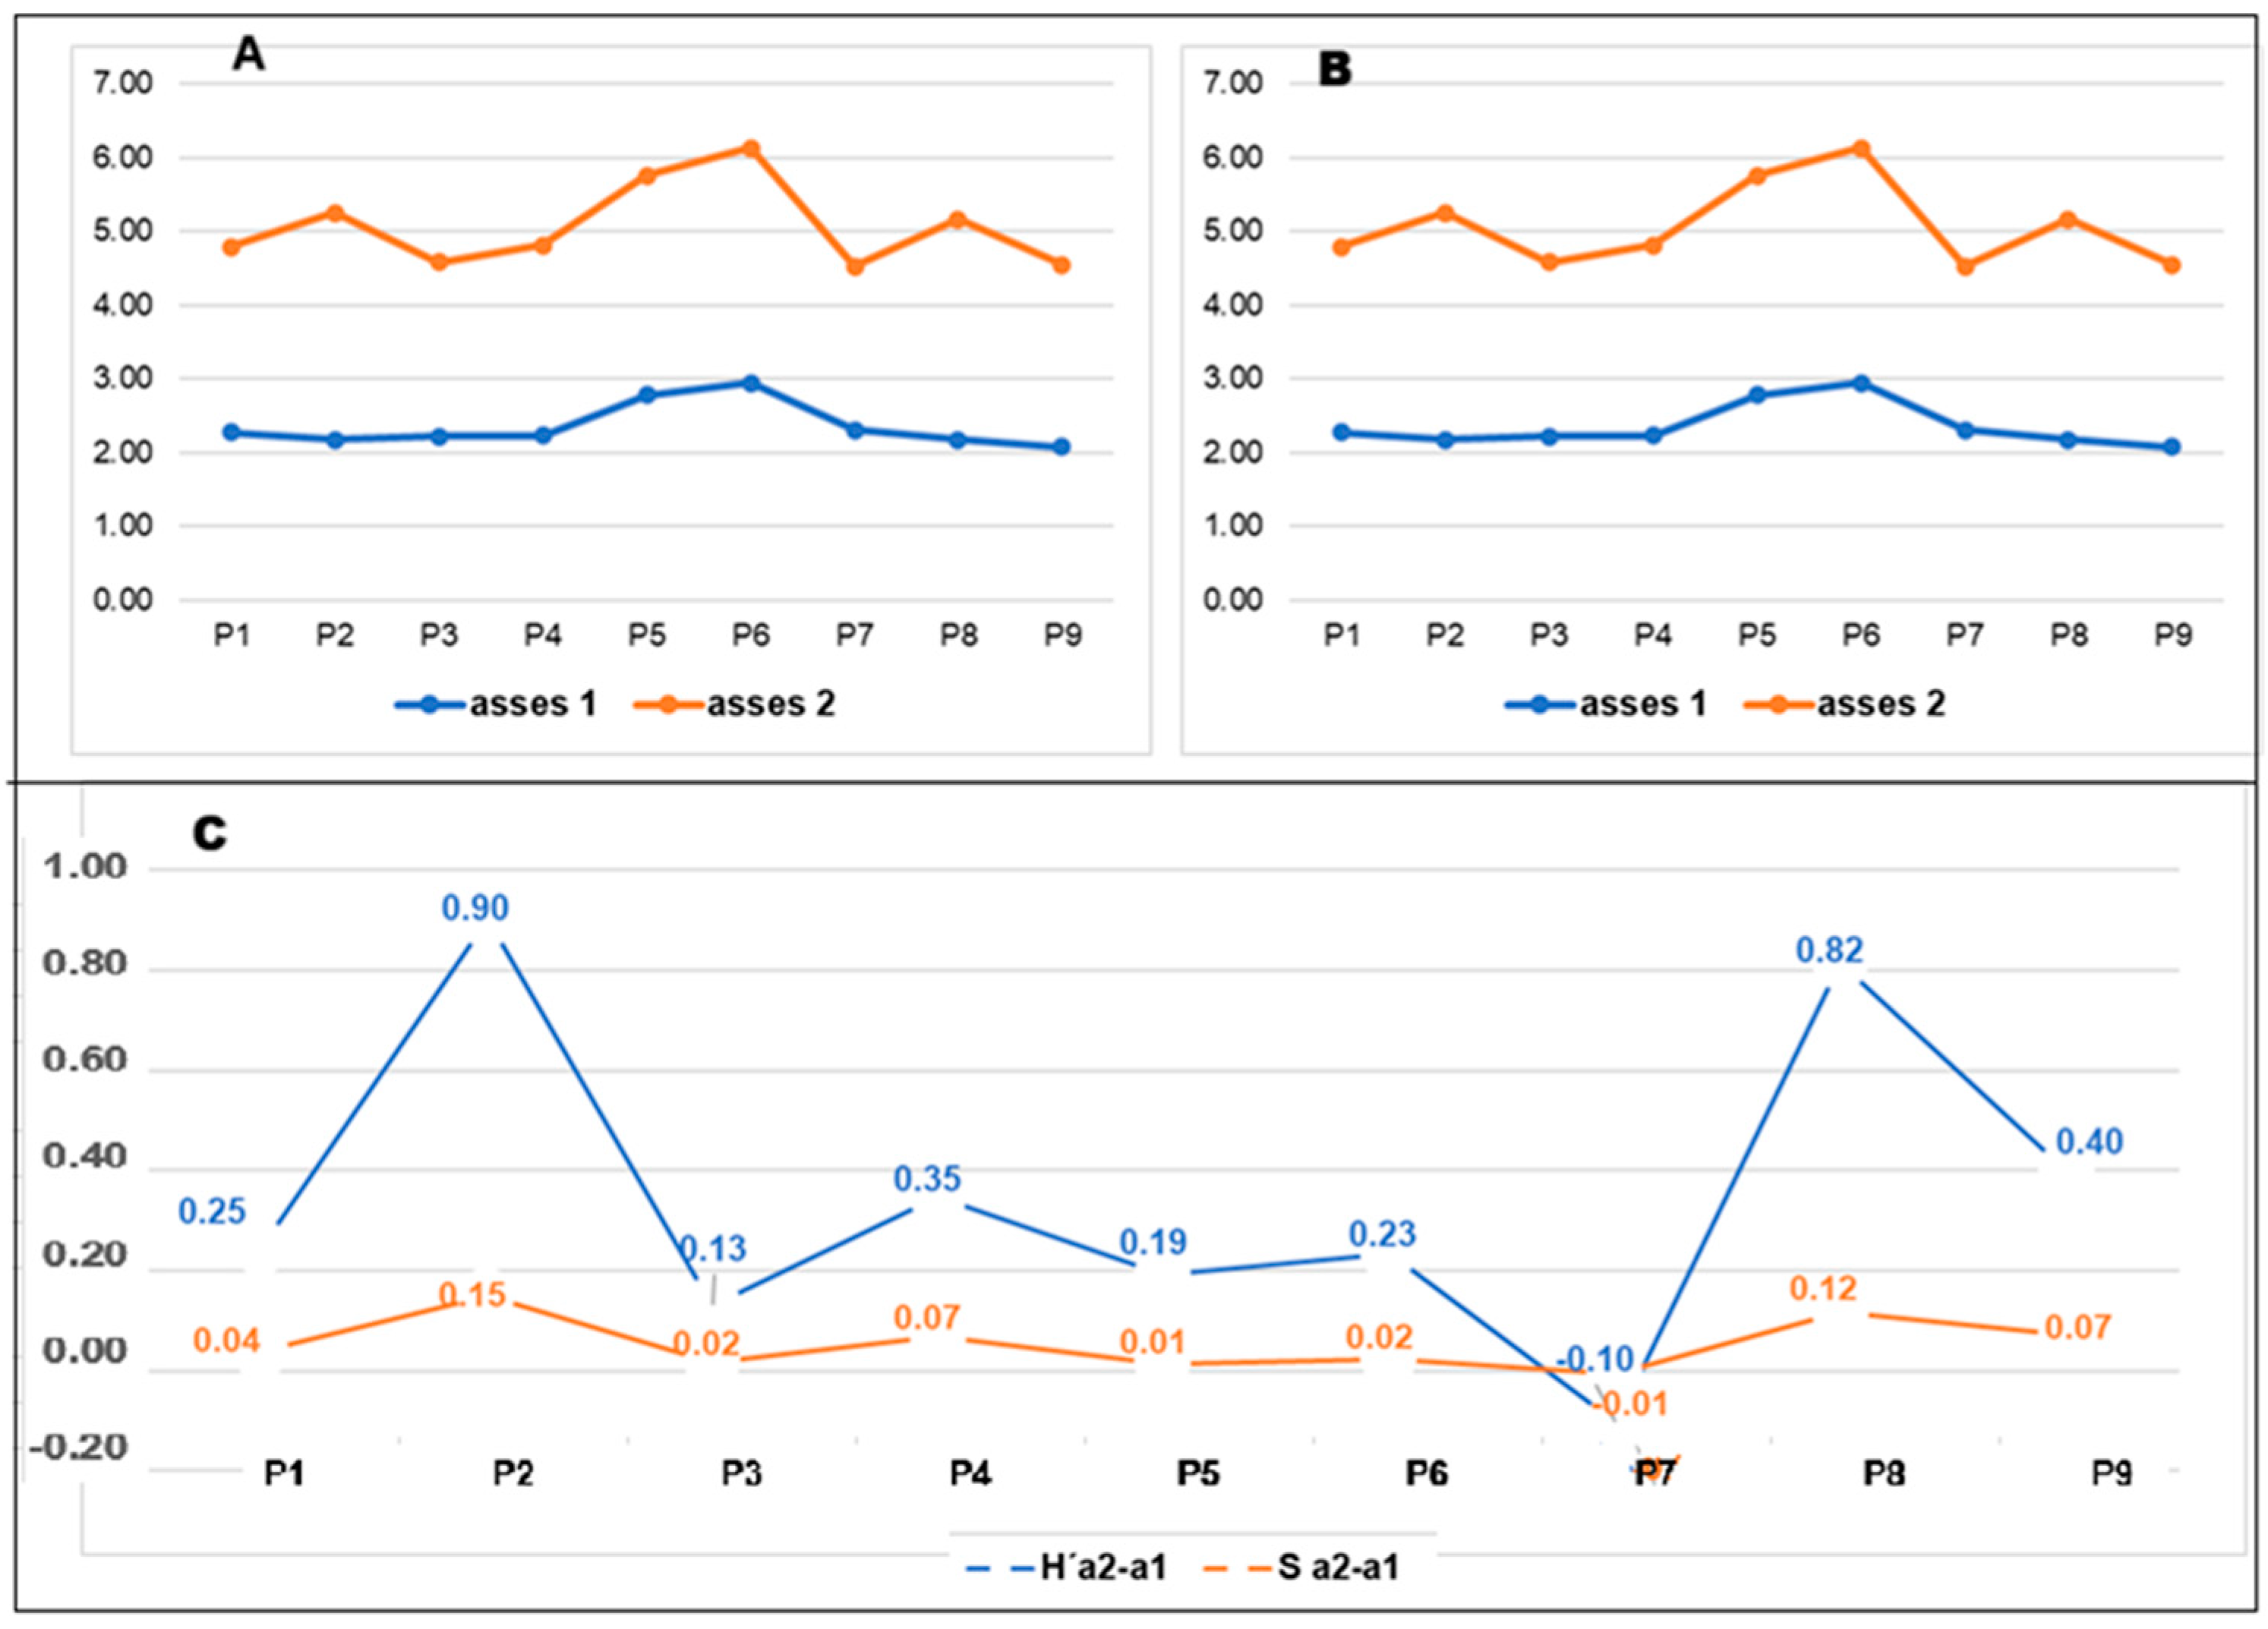
3.1.2. Shannon-Wiener (H′) and Simpson Diversity Index (D)
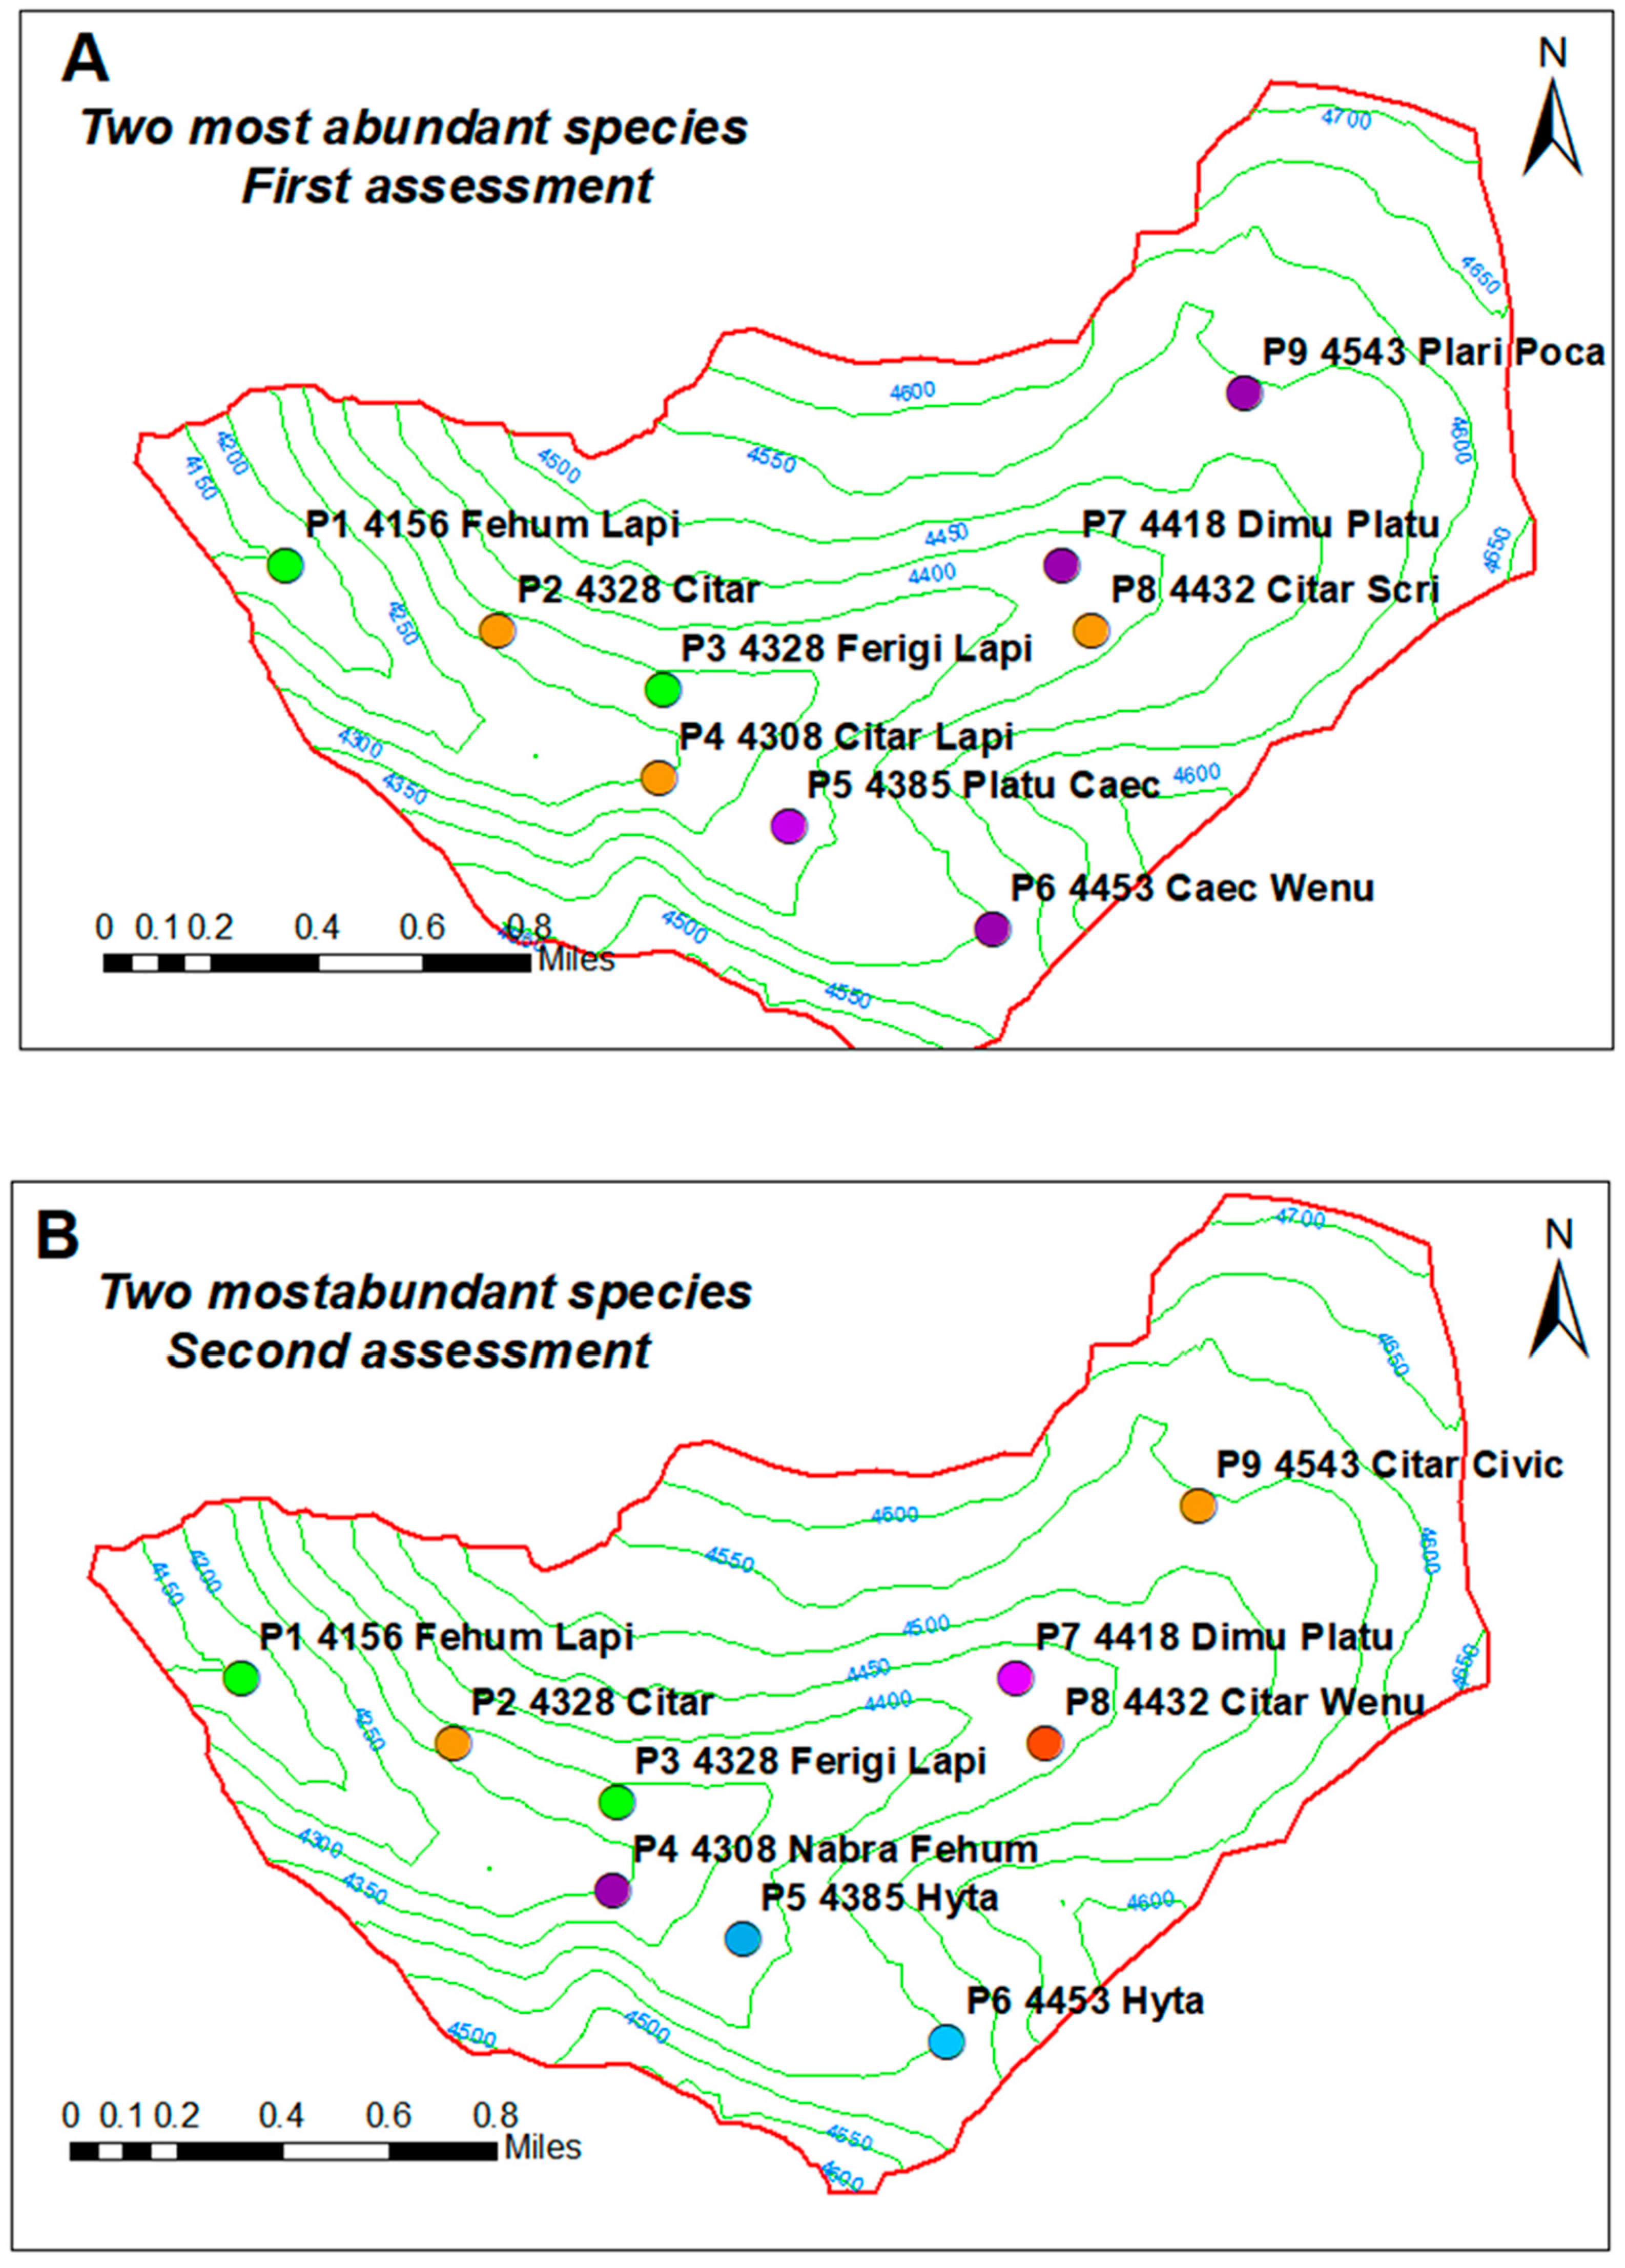
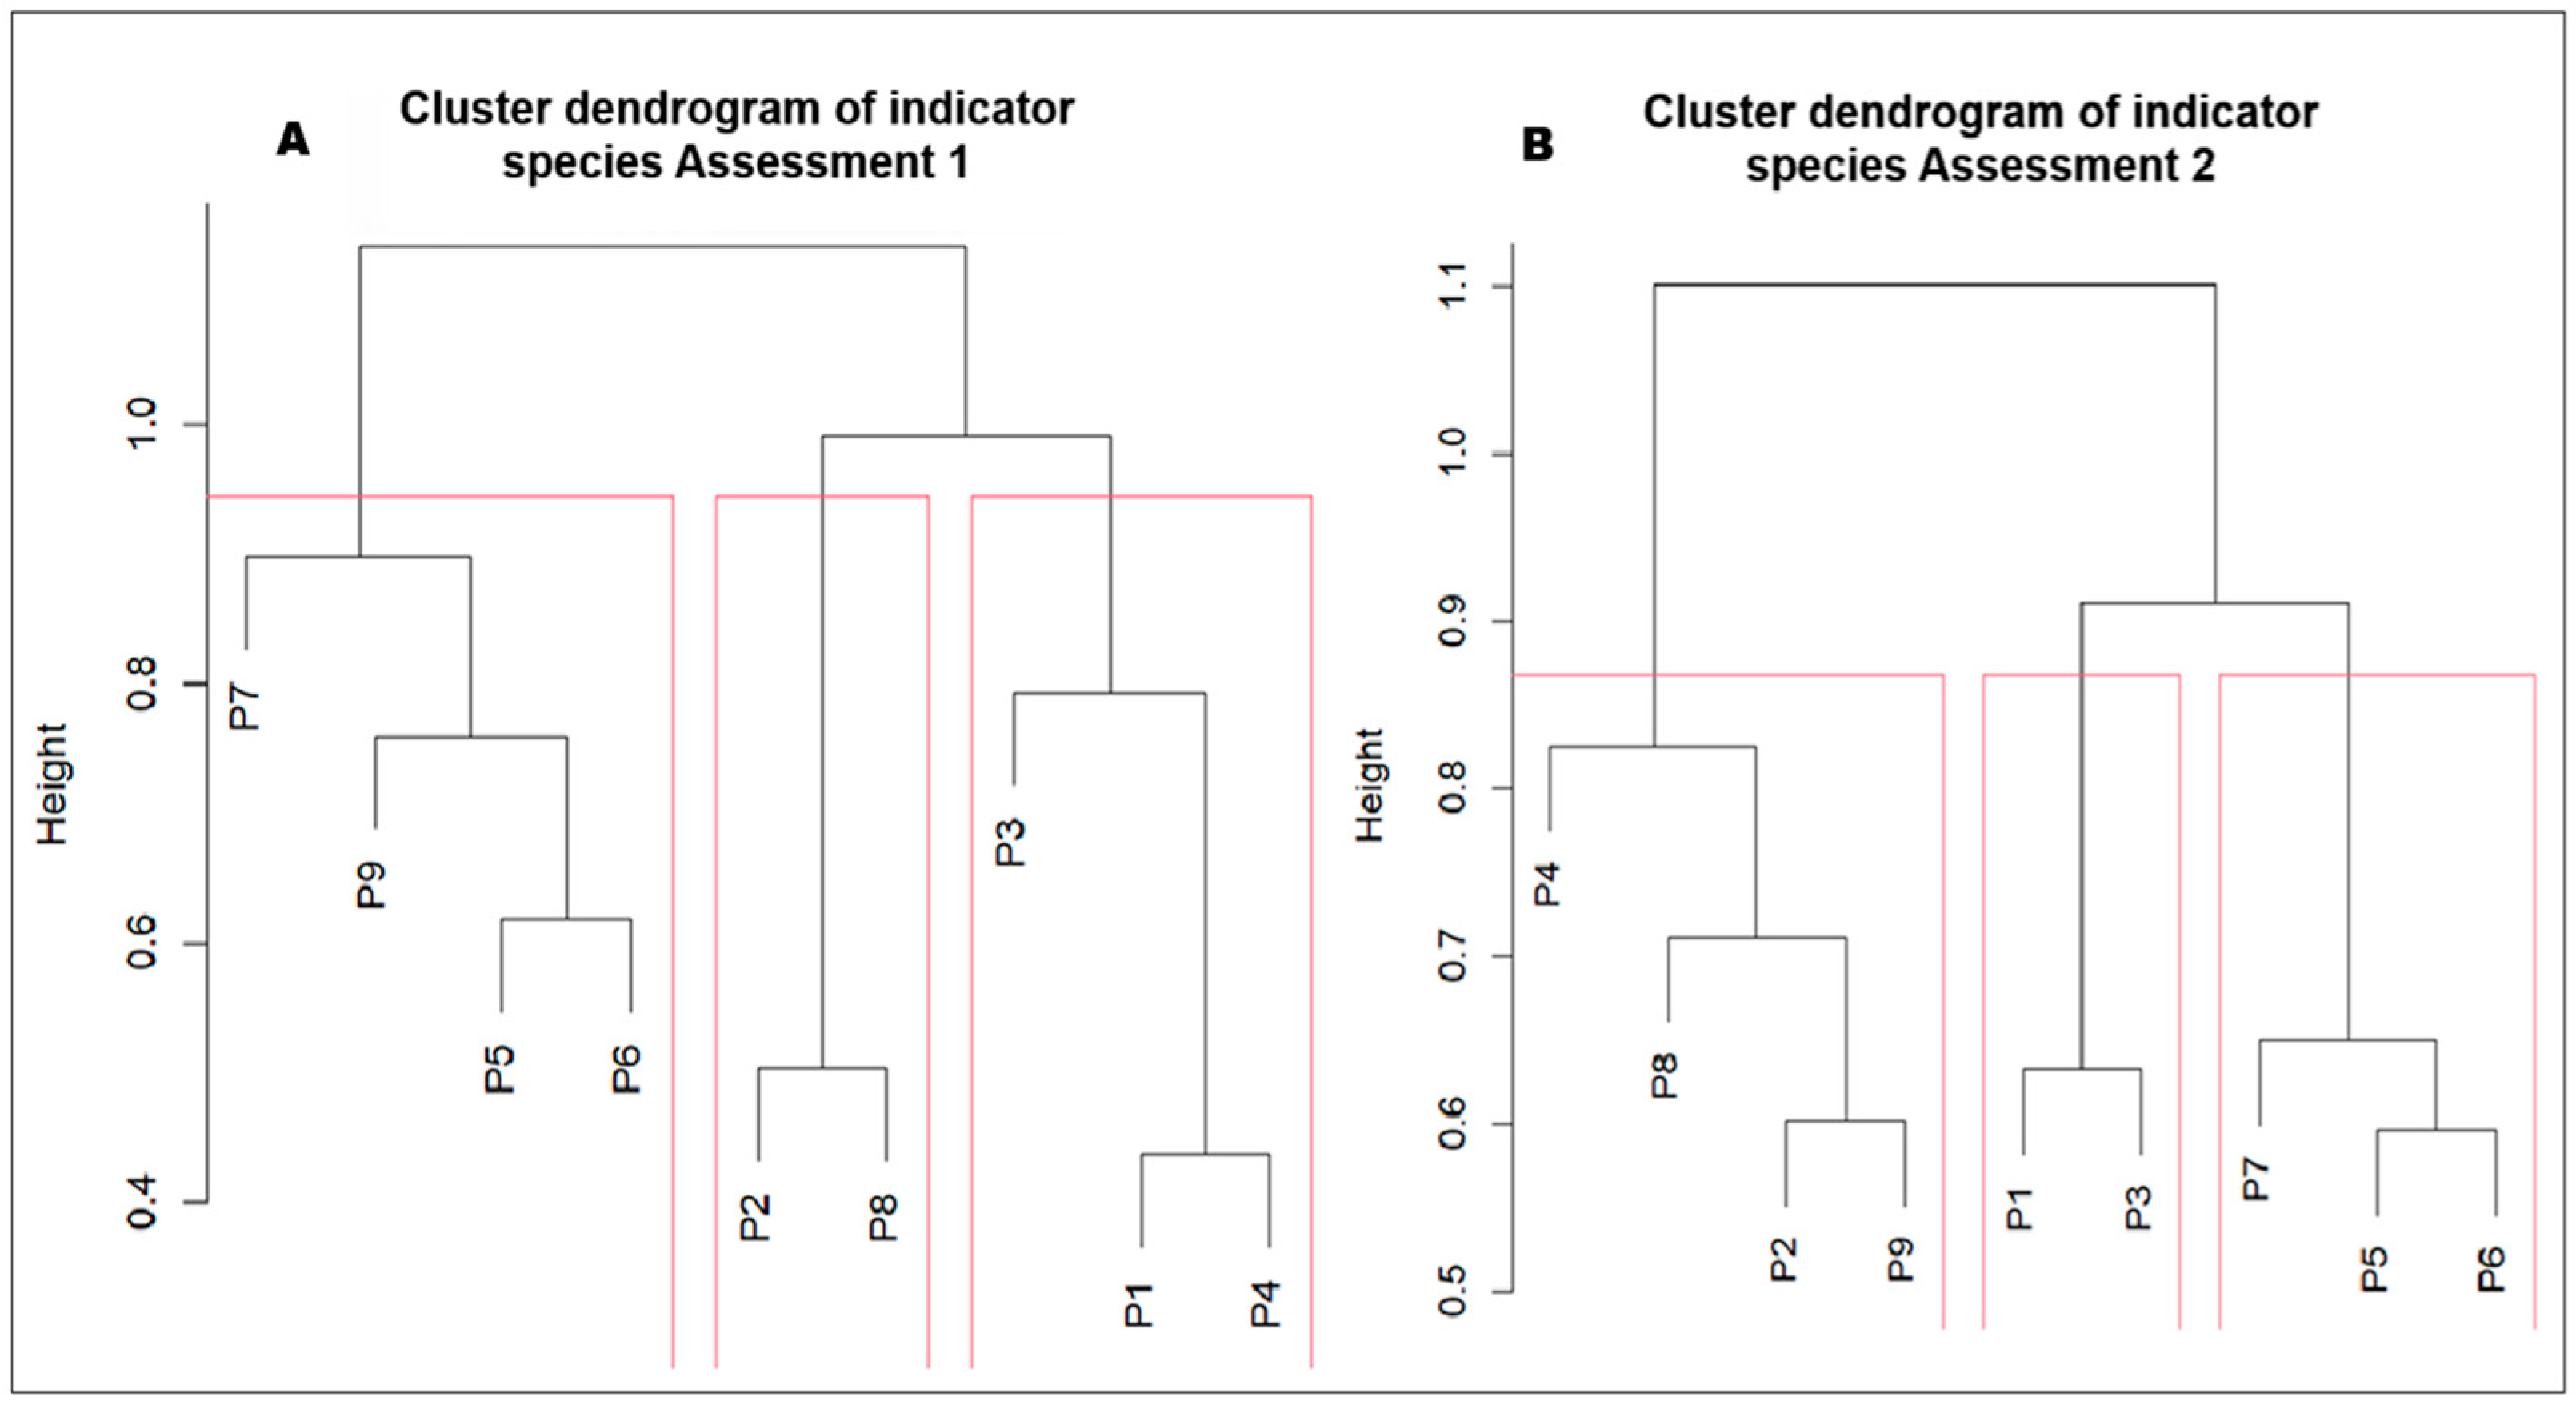
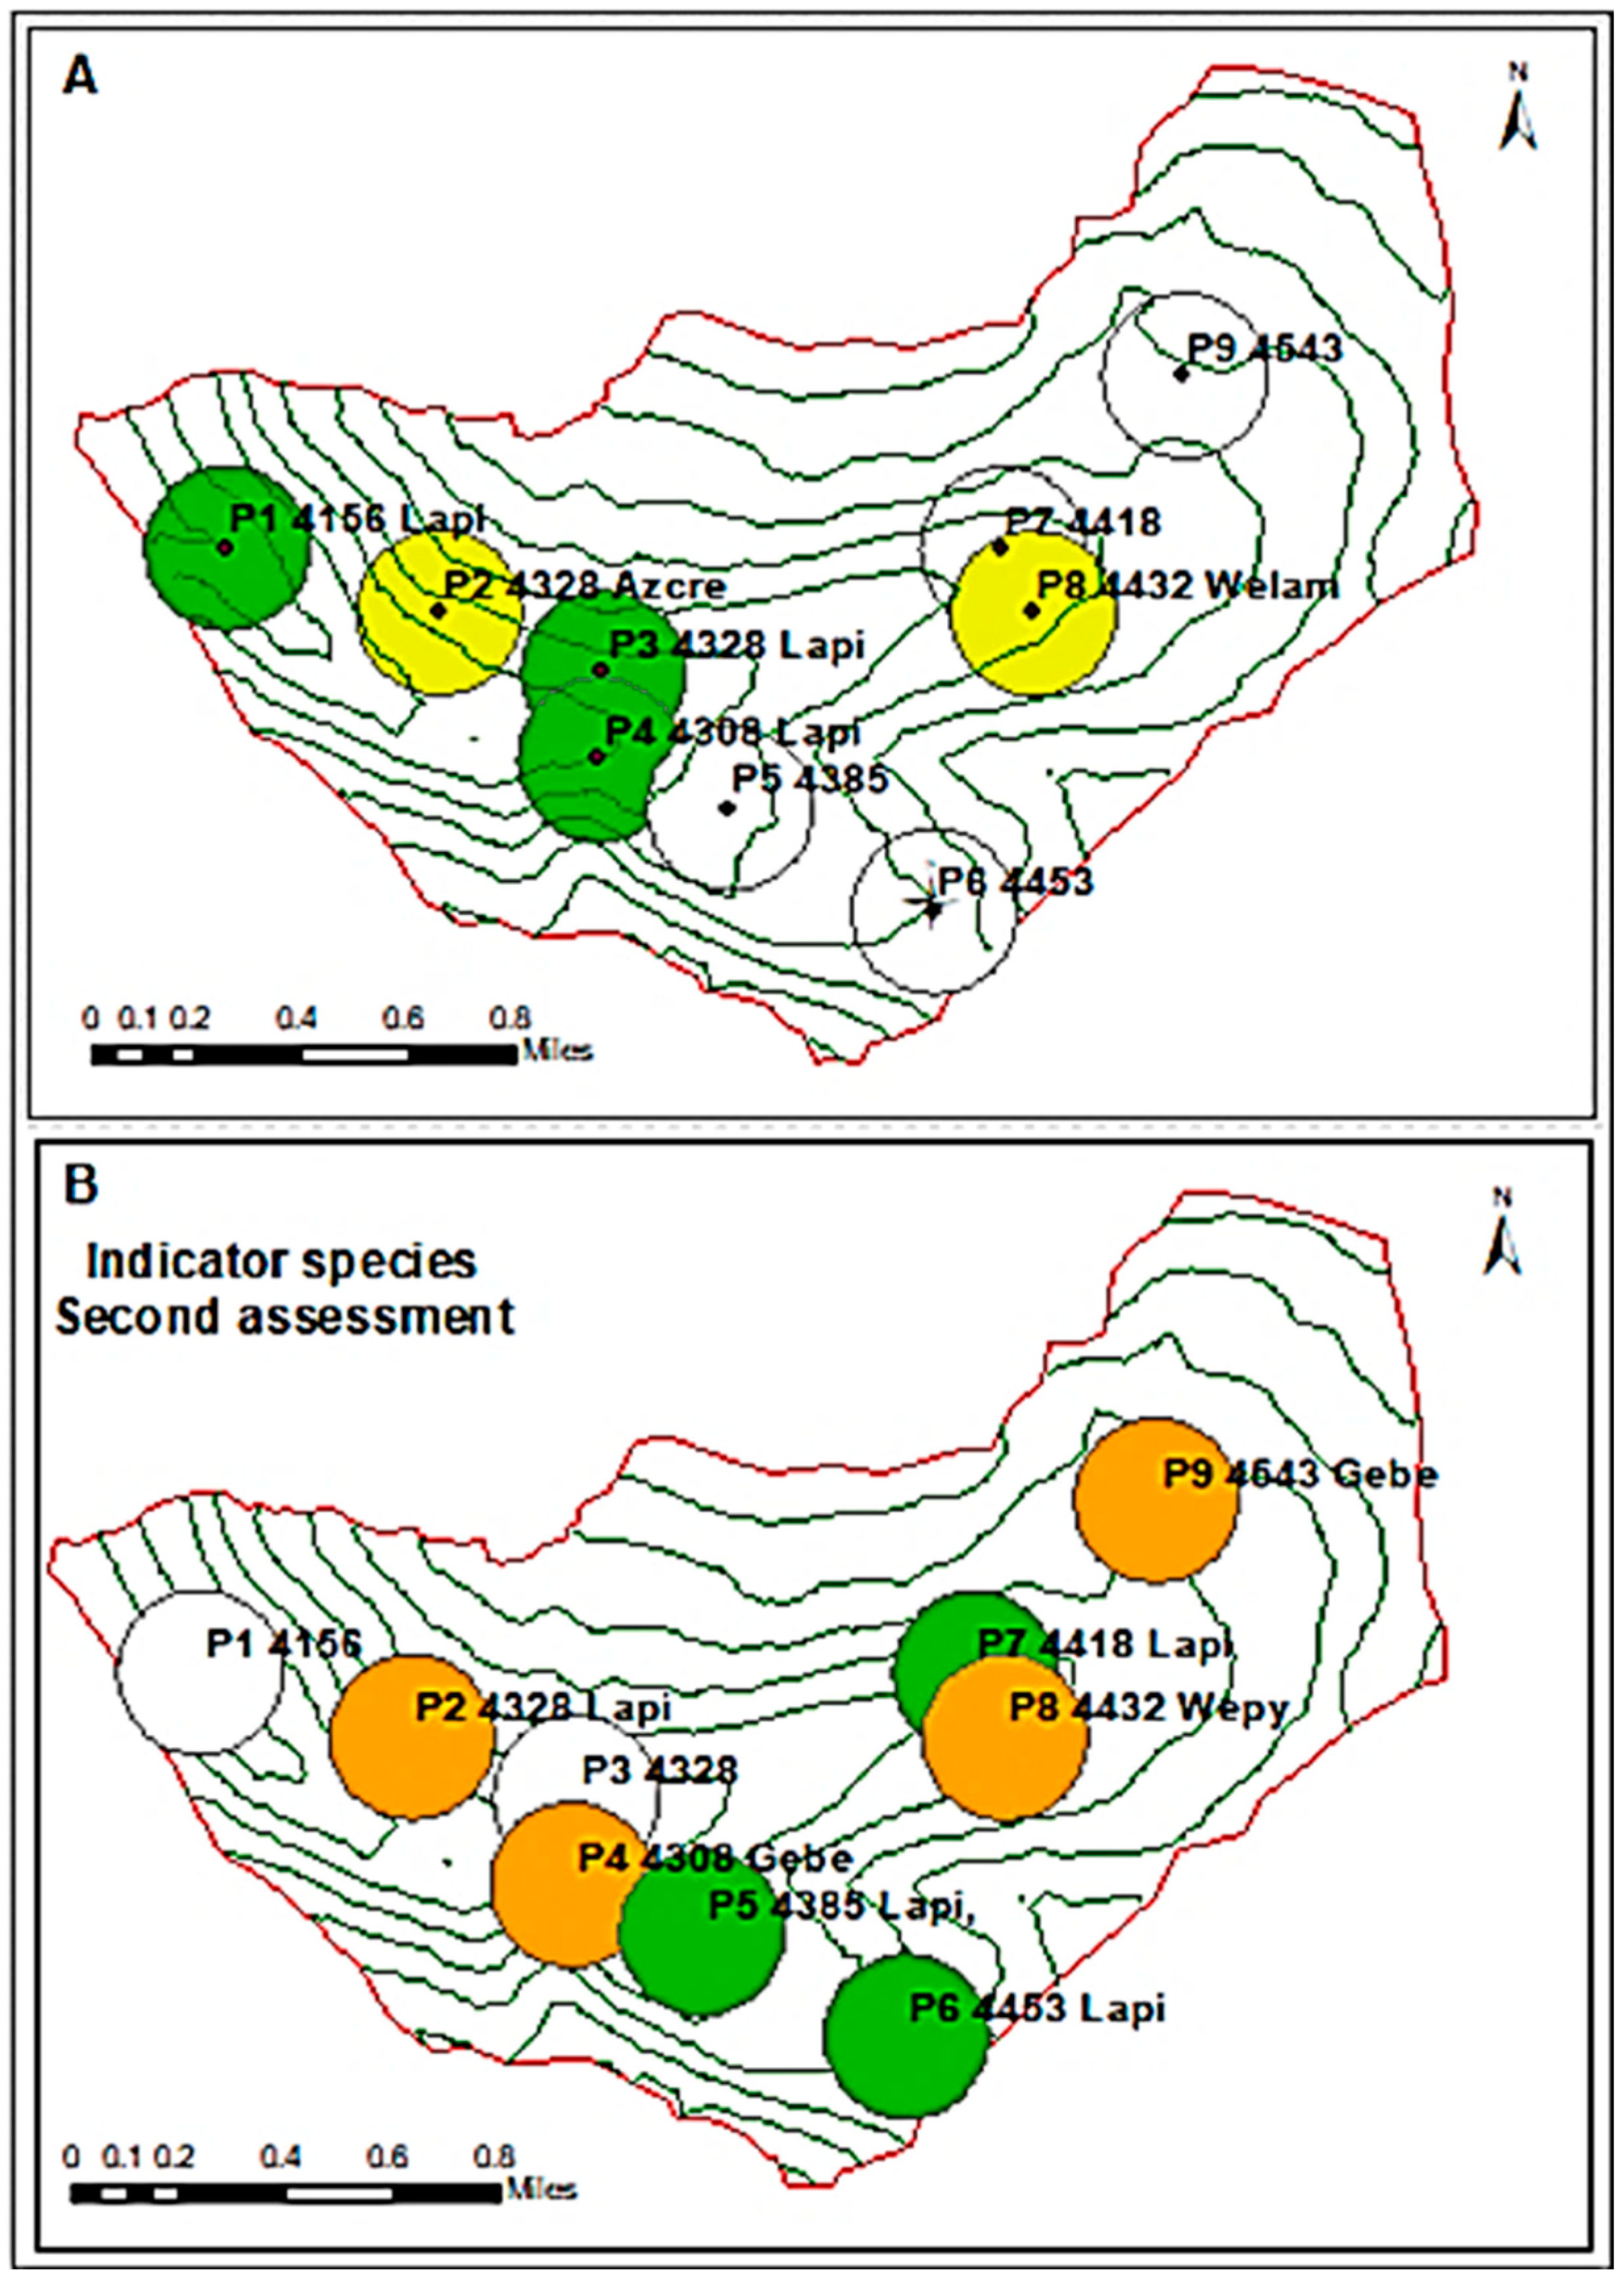
3.2. Presence of Indicator Species of the Grassland Ecosystem According to Altitudinal Gradient in the Sillapata Micro-Watershed in the Community of Acopalca
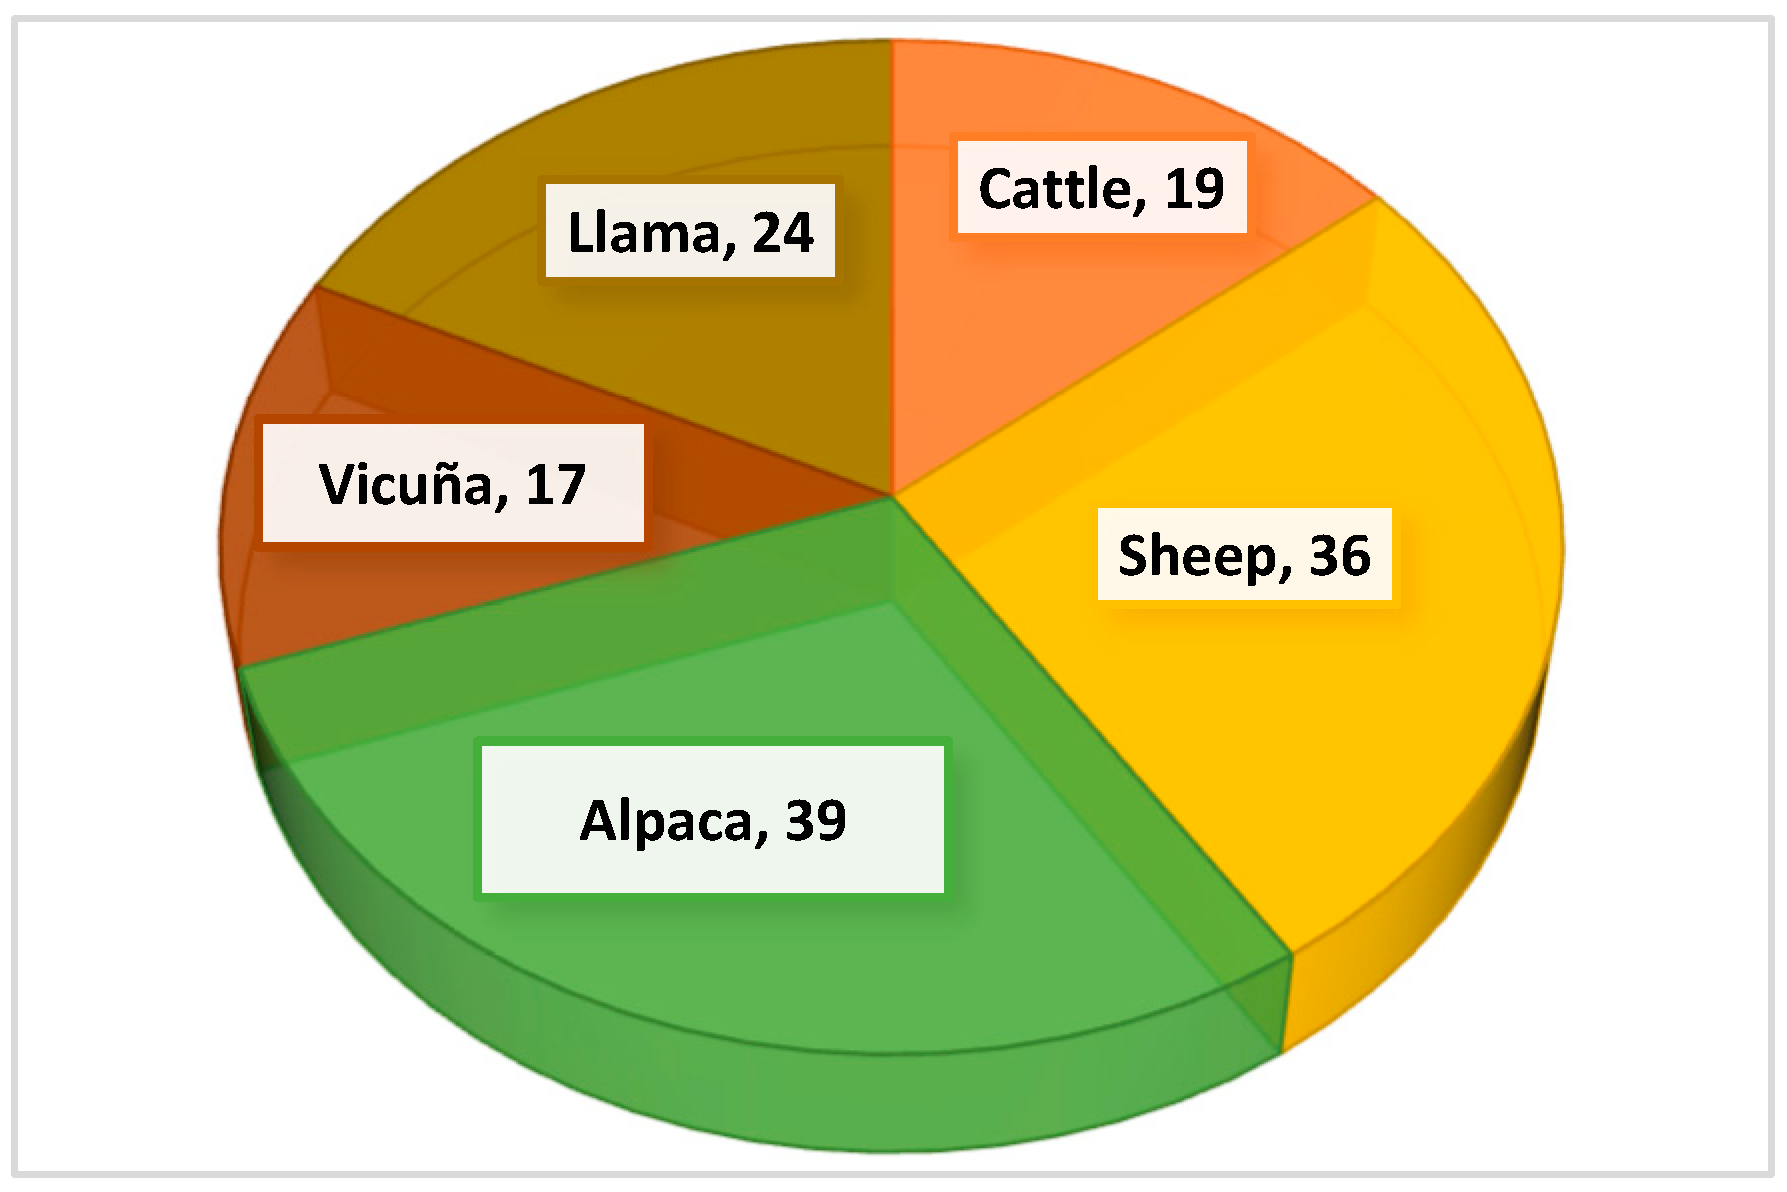
3.3. Variation Dynamics of Suitable Species for Andean Livestock According to Altitudinal Gradient in the Sillapata Micro-Watershed in the Community of Acopalca
4. Discussion
5. Conclusions
Author Contributions
Funding
Institutional Review Board Statement
Data Availability Statement
Acknowledgments
Conflicts of Interest
Appendix A

| Clave | Especie |
|---|---|
| Acacre | Acaulimalva crenata (A.W.Hill) Krapov |
| Acaen | Acaulimalva engleriana (Ulbr.) Krapov. |
| Acpu | Aciachne pulvinata Benth. |
| Agbre | Agrostis breviculmis Hitchc. |
| Agtol | Agrostis tolucensis Kunth. |
| Alpig | Alstroemeria pygmaea Herb. |
| Anhans | Anatherostipa hans-meyeri (Pilg.) Peñail. |
| Anodo | Anthoxanthum odoratum L. |
| Arac | Arenaria acaulis Montesinos & Kool |
| Aredi | Arenaria digyma Willd. ex D.F.K.Schltdl |
| Arad | Aristida adscensionis L. |
| Aren | Aristida enodis Hack. |
| Azbi | Azorella biloba (Schltdl.) Wedd. LC. |
| Azcom | Azorella compacta Phil. |
| Azcre | Azorella crenata (Ruiz & Pav.) Pers. |
| Azma | Azorella madreporica Clos. |
| Azmul | Azorella multifida (Ruiz & Pav.) Pers |
| Bacae | Baccharis caespitosa (Lam.) Pers |
| Badi | Bartsia diffusa Benth. |
| Bape | Bartsia pedicularoides Benth. |
| Bepip | Belloa piptolepis (Wedd.) S.E.Freire, Chemisquy, Anderb. & Urtubey by Asteraceae |
| Brola | Bromus catarthicus Vahl. |
| Brola | Bromus lanatus Kunth. |
| Casag | Caltha sagittata Cav. |
| Caram | Cardionema ramosissimum (Weinm.) A.Nelson & J.F.Macbr., 1913 |
| Caec | Carex ecuadorica Kük. |
| Caheb | Carex hebetata Boott |
| Caman | Carex mandoniana Boeck. |
| Cedan | Cerastium danguyi J.F. |
| Ceimb | Cerastium imbricatum Kunth vel aff. |
| Cicur | Cinnagrostis curvula Wedd. |
| Ciden | Cinnagrostis densiflora (J. Presl) P.M. Peterson, Soreng, Romasch. & Barberá |
| Cifus | Cinnagrostis fuscata (J. Presl) P.M. Peterson, Soreng, Romasch. & Barberá |
| Cijam | Cinnagrostis jamesonii (Steud.) P.M. Peterson, Soreng, Romasch. & Barberá vel aff. |
| Cirig | Cinnagrostis rigesens (J.Presl) P.M.Peterson, Soreng, Romasch. & Barbe |
| Ciri | Cinnagrostis rigida (Kunth) P.M.Peterson, Soreng, Romasch. & Barberá |
| Cispi | Cinnagrostis spicigera (J. Presl) P.M. Peterson, Soreng, Romasch. & Barberá |
| Citar | Cinnagrostis tarmensis (Pilg.) P.M.Peterson, Soreng, Romasch. & Barberá |
| Civic | Cinnagrostis vicunarum (Wedd.) P.M. Peterson, Soreng, Romasch. & Barberá |
| Codes | Conyza deserticola Phil. |
| Cuaise | Cuatrecasasiella isernii (Cuatrec.) H.Rob. |
| Cyses | Cyperus seslerioides Kunth. |
| Desem | Deschampsia eminens (J. Presl) Saarela |
| Dimu | Distichia muscoides Nees & Meyen. |
| Elal | Eleocharis albibracteata Nees & Meyen ex Kunth vel aff. |
| Fehua | Festuca huamachucensis Infantes |
| Fehum | Festuca humilior Nees & Meyen |
| Ferige | Festuca rigescens (J. Presl) Kunth |
| Ferigi | Festuca rigidifolia Tovar |
| Gacor | Galium corymbosum Ruiz & Pav. |
| Gapur | Gamochaeta purpurea (L.) Cabrera |
| Gaspi | Gamochaeta spicata (Klatt) Cabrera. |
| Gecas | Gentiana aff. Casapaltensis Ball. |
| Gehir | Gentiana hirculus (Griseb.) Fabris |
| Gepo | Gentiana potamophylla L. |
| Gebe | Gentianella bellidifolia (Hook.fil.) Holub |
| Gencar | Gentianella carneorubra (Gilg) |
| Gein | Gentianella incurva (Hook.) Fabris. |
| Gesan | Gentianella sandien (@luanasandien) |
| Geses | Geranium sessiliflorum Cav. |
| Gnado | Gnapahalium dombeyanum DC. |
| Gnapur | Gnaphaliium purpurium L. |
| Gnaspi | Gnaphalium spicatum Mill. |
| Halum | Halenia umbellata (Ruiz & Pav.) Gilg |
| Homut | Hordeum muticum J. Presl |
| Hysil | Hypericum silenoides Juss |
| Hyta | Hypochaeris taraxacoides Ball. |
| Isset | Isolepis setacea (L.) R. Br. |
| Justi | Juncus stipulatus Nees & Meyen |
| Kospi | Koeleria spicata (L.) Barberá, Quintanar, Soreng & P.M. Peterson |
| Ladi | Lachemilla diplophylla (Diels) Rothm. |
| Lapi | Lachemilla pinnata Ruiz & Pav |
| Laaph | Lachenilla aphanoides (Mutis ex L.fil.) Rothm |
| Lian | Lilaeopsis andina A.W.Hill. |
| Lilma | Lilaeopsis macloviana (Gand.) A.W. Hill |
| Lusub | Luciliocline subspicata (Wedd.) Hieron |
| Lulon | Luciocline longifolia (Cuatrec. & Aristeg.) M.O.Dillon & Sagást |
| Luan | Lupinus ananeanus Ulbr. |
| Luch | Lupinus chlorolepis C.P. Sm. |
| Lura | Luzula racemosa Desv. |
| Lycra | Lycopodium crassum Humb. & Bonpl |
| Mistri | Misbrookea strigosissima (A.Gray) V.A.Funk |
| Mnlon | Mniodes longifolia (Cuatrec. & Aristeg.) S.E.Freire |
| Muvo | Muehlenbeckia volcanica (Benth.) Endl.(Mullaka, Machi machi) |
| Muli | Muhlenbergia ligularis (Hack.) Hitchc |
| Mygym | Myrosmodes gymnandra Rchb.f. |
| Nabra | Nassella brachyphylla (Hitchc.) Barkworth |
| Name | Nassella meyeniana (Trin. & Rupr.) Parodi |
| Namu | Nassella mucronata (Kunth) R.W.Pohl |
| Nesp | Neobartsia sp. (Cabrera & Botta) Uribe-Convers & Tank |
| Nopin | Nototriche pinnata (Cav.) Hill. Hill, |
| Oltri | Olsynium trinerve (Baker) R.A. Rodr. & Martic. |
| Orein | Oreithales integrifolia (DC.) Schltdl. |
| Orean | Oreomyrrhis andicola (Kunth) Hook |
| Orlim | Oritrophium limnophilum (Sch.Bip.) Cuatrec |
| Oxde | Oxalis debilis corymbosa Kunth. |
| Paov | Paranephelius ovatus Wedd. |
| Paan | Paronychia andina A. Gray |
| Papil | Paspalum pilgerianum Chase. |
| Papy | Paspalum pygmaeum Hack. |
| Phyac | Phylloscirpus acaulis (Phil.) Goetgh. & D.A.Simpson |
| Phybo | Phylloscirpus boliviensis (Barros) Dhooge & Goetgh. |
| Phyri | Phylloscirpus rigidus (Phil.) |
| Plalam | Plantago lamprophylla Pilg. |
| Plari | Plantago rigida Kunth. |
| Plase | Plantago sericea Ruiz & Pav |
| Platu | Plantago tubulosa Decne. |
| Poae | Poa aequigluma Tovar |
| Poan | Poa annua L. |
| Poca | Poa candamoana Pilg. |
| Pogym | Poa gymnantha Pilg. |
| Pokur | Poa kurtzii R.E. Fr. vel aff. |
| Pomar | Poa marshallii Tovar |
| Poper | Poa perligulata Pilg. |
| Pospi | Poa spicigera Tovar vel aff. |
| Psevi | Pseudognaphalium viravira (Molina) Anderb. |
| Pymo | Pycnophyllum molle J. Rémy |
| Rapra | Ranunculus praemorsus Kunth |
| Ronu | Rockhausenia nubigena (Kunth) D.J.N. Hind |
| Ruac | Rumex acetocella L. |
| Ruma | Rumex maritimus. |
| Scri | Scirpus rigidus (Steud.) Boeckeler |
| Siman | Silene mandonii (Rohrb.) Bocquet |
| Sismi | Sisyrinchium micranthum Cav. |
| Tamve | Thamnolia vermicularis (Sw.) Ach. ex Schaer) |
| Wenu | Werneria nubigena Kunth. |
| Wepi | Werneria pinnatifida J.Rémy |
| Wepy | Werneria pygmaea Gillies ex Hook |
| Wevi | Werneria villosa A.Gray |
| Zamut | Zameioscirpus muticus Dhooge & Goetgh. |
| Family | Genus | No Species | Familia | Genero | No Species |
|---|---|---|---|---|---|
| Alstroemeriaceae | Alstroemeria | 1 | Geraniaceae | Geranium | 1 |
| Apiaceae | Lilaeopsis | 2 | Hypericaeae | Hypericum | 1 |
| Oreomyrrhis | 1 | Icmadophilaceae | Thamnolia | 1 | |
| Asteraceae | Werneria | 4 | Iridaceae | Olsynium | 1 |
| Plantago | 4 | Sisyrinchium | 1 | ||
| Gnaphalium | 3 | Juncaceae | Distichia | 1 | |
| Acaulimalva | 2 | Juncus | 1 | ||
| Gamochaeta | 2 | Luzula | 1 | ||
| Luciliocline | 2 | Lycopodiaceae | Lycopodium | 1 | |
| Baccharis | 1 | Malvaceae | Nototriche | 1 | |
| Belloa | 1 | Ochidaceae | Myrosmodes | 1 | |
| Conyza | 1 | Oxalidaceae | Oxalis | 1 | |
| Cuatrecasasiella | 1 | Poaceae | Cinnagrostis | 11 | |
| Hypochaeris | 1 | Poa | 8 | ||
| Misbrookea | 1 | Festuca | 3 | ||
| Mniodes | 1 | Nassella | 3 | ||
| Oritrophium | 1 | Agrostis | 2 | ||
| Paranephelius | 1 | Aristida | 2 | ||
| Pseudognaphalium | 1 | Bromus | 2 | ||
| Rockhausenia | 1 | Paspalum | 2 | ||
| Caryophyllaceae | Arenaria | 2 | Aciachne | 1 | |
| Cerastium | 2 | Anatherostipa | 1 | ||
| Cardionema | 1 | Anthoxantum | 1 | ||
| Paronychia | 1 | Deschampsia | 1 | ||
| Pycnophyllum | 1 | Hordeum | 1 | ||
| Silene | 1 | Koeleria | 1 | ||
| Cyperaceae | Carex | 3 | Muhlenbergia | 1 | |
| Phylloscirpus | 3 | Polygonaceae | Rumex | 2 | |
| Cyperus | 1 | Muehlenbeckia | 1 | ||
| Elocharis | 1 | Ranunculaceae | Caltha | 1 | |
| Isolepis | 1 | Oreithales | 1 | ||
| Scirpus | 1 | Ranunculus | 1 | ||
| Zameioscirpus | 1 | Rosaceae | Lachemilla | 3 | |
| Fabaceae | Lupinus | 2 | Rubiaceae | Galium | 1 |
| Gentianaceae | Gentianella | 4 | Scrophulariaceae | Bartsia | 2 |
| Gentiana | 3 | Neobartsia | 1 | ||
| Halenia | 1 | Umbelliferae | Azorella | 5 |
| Control Points | P1 | P2 | P3 | P4 | P5 | P6 | P7 | P8 | P9 |
|---|---|---|---|---|---|---|---|---|---|
| First assessment | |||||||||
| Shanon | 2.272 | 2.177 | 2.223 | 2.230 | 2.784 | 2.950 | 2.314 | 2.174 | 2.076 |
| Simpson | 0.841 | 0.764 | 0.845 | 0.833 | 0.915 | 0.923 | 0.842 | 0.802 | 0.825 |
| Second assessment | |||||||||
| Shanon | 2.519 | 3.079 | 2.353 | 2.576 | 2.976 | 3.184 | 2.210 | 2.990 | 2.477 |
| Simpson | 0.881 | 0.931 | 0.861 | 0.902 | 0.928 | 0.947 | 0.835 | 0.920 | 0.896 |
| A | Point | Ord. | E | N | Z | de1 | de1n | de2 | de2n | Ind_sp |
|---|---|---|---|---|---|---|---|---|---|---|
| P1 | 1 | 491,069 | 8,672,207 | 4156 | Fehum | 27 | Lapi | 21 | Lapi | |
| P2 | 2 | 491,709 | 8,672,011 | 4328 | Citar | 42 | 0 | Azcre | ||
| P3 | 1 | 492,206 | 8,671,828 | 4328 | Ferigi | 28 | Lapi | 18 | Lapi | |
| P4 | 1 | 492,195 | 8,671,565 | 4308 | Citar | 26 | Lapi | 23 | Lapi | |
| P5 | 3 | 492,588 | 8,671,419 | 4385 | Platu | 15 | Caec | 14 | ||
| P6 | 3 | 493,206 | 8,671,106 | 4453 | Caec | 15 | Wenu | 13 | ||
| P7 | 3 | 493,415 | 8,672,203 | 4418 | Dimu | 29 | Platu | 17 | ||
| P8 | 2 | 493,505 | 8,672,010 | 4432 | Citar | 39 | Scri | 13 | Welam | |
| P9 | 3 | 493,964 | 8,672,728 | 4543 | Plari | 34 | Poca | 13 | ||
| B | Point | Ord. | E * | N * | Z | de1 | de1n | de2 | de2n | Ind_sp |
| P1 | 2 | 491,069 | 8,672,207 | 4156 | Fehum | 23 | Lapi | 17 | ||
| P2 | 3 | 491,709 | 8,672,011 | 4328 | Citar | 18 | 0 | Lapi | ||
| P3 | 2 | 492,206 | 8,671,828 | 4328 | Ferigi | 27 | Lapi | 18 | ||
| P4 | 3 | 492,195 | 8,671,565 | 4308 | Nabra | 14 | Fehum | 13 | Gebe | |
| P5 | 1 | 492,588 | 8,671,419 | 4385 | Hyta | 18 | 0 | Lapi, | ||
| P6 | 1 | 493,206 | 8,671,106 | 4453 | Hyta | 10 | 0 | Lapi | ||
| P7 | 1 | 493,415 | 8,672,203 | 4418 | Dimu | 29 | Platu | 14 | Lapi | |
| P8 | 3 | 493,505 | 8,672,010 | 4432 | Citar | 18 | Wenu | 11 | Wepy | |
| P9 | 3 | 493,964 | 8,672,728 | 4543 | Citar | 17 | Civic | 16 | Gebe |
References
- Török, P.; Helm, A.; Kiehl, K.; Buisson, E.; Valkó, O. Beyond the species pool: Modification of species dispersal, establishment, and assembly by habitat restoration. Restor. Ecol. 2018, 26, S65–S72. [Google Scholar] [CrossRef]
- Torchelsen, F.P.; Cordero, R.L.; Overbeck, G.E. Conservation of species-rich subtropical grasslands: Traditional management vs. legal conservation requirements in primary and secondary grasslands. Acta Bot. Bras. 2020, 34, 342–351. [Google Scholar] [CrossRef]
- Chu, T.J.; Shih, Y.J.; Shih, C.H.; Wang, J.Q.; Huang, L.M.; Tsai, S.C. Developing a Model to Select Indicator Species Based on Individual Species’ Contributions to Biodiversity. Appl. Sci. 2022, 12, 6748. [Google Scholar] [CrossRef]
- Scotton, M. Mountain grassland restoration: Effects of sowing rate, climate and soil on plant density and cover. Sci. Total Environ. 2019, 651, 3090–3098. [Google Scholar] [CrossRef] [PubMed]
- Bartha, S.; Házi, J.; Purger, D.; Zimmermann, Z.; Szabó, G.; Guller, Z.E.; Csathó, A.I.; Csete, S. Beta Diversity Is Better—Microhabitat Diversity and Multiplet Diversity Offer Novel Insights into Plant Coexistence in Grassland Restoration. Diversity 2024, 16, 769. [Google Scholar] [CrossRef]
- Yu, J.; Wan, L.; Liu, G.; Ma Ke Cheng, H.; Shen, Y.; Liu, Y.; Su, X. Managing grassland systems to optimise livestock Production. In Improving Grassland and Pasture Management in Temperate Agriculture; Burleigh Dodds Science Publishing: Cambridge, UK, 2019; pp. 209–238. [Google Scholar] [CrossRef]
- Tiscornia, G.; Jaurena, M.; Baethgen, W. Factores impulsores, procesos y consecuencias de la degradación de pastizales nativos: Perspectivas a partir de una revisión bibliográfica y una encuesta en pastizales del Río de la Plata. Agronomía 2019, 9, 239. [Google Scholar] [CrossRef]
- Yaranga, R.M.; Pizarro, E.S.; Cano, D.; Chanamé, F.C.; Orellana, J.A. Composition, Diversity, and Value of Ecological Importance in Andean Grassland Ecosystems according to the Altitudinal Gradient in the Huacracocha Micro-Watershed, Peru. Ann. Res. Rev. Biol. 2023, 38, 43–56. [Google Scholar] [CrossRef]
- Basavegowda, D.H.; Schleip, I.; Mosebach, P.; Weltzien, C. Deep learning-based detection of indicator species for monitoring biodiversity in semi-natural grasslands. Environ. Sci. Ecotechnol. 2024, 21, 100419. [Google Scholar] [CrossRef]
- Gao, X. Interactive Effects of Grazing and Climate on Grassland Vegetation Diversity in Arid and Semi-Arid Regions; Authorea, Inc.: Hoboken, NJ, USA, 2022. [Google Scholar] [CrossRef]
- Milberg, P.; Bergman, K.-O.; Glimskär, A.; Nilsson, S.; Tälle, M. Site factors are more important than management for indicator species in semi-natural grasslands in southern Sweden. Plant Ecol. 2020, 221, 577–594. [Google Scholar] [CrossRef]
- Legendre, P. Indicator Species: Computation. In Encyclopedia of Biodiversity; Elsevier: Amsterdam, The Netherlands, 2024; pp. 533–538. [Google Scholar] [CrossRef]
- Descombes, P.; Walthert, L.; Baltensweiler, A.; Meuli, R.G.; Karger, D.N.; Ginzler, C.; Zurell, D.; Zimmermann, N.E. Spatial modelling of ecological indicator values improves predictions of plant distributions in complex landscapes. Ecography 2020, 43, 1448–1463. [Google Scholar] [CrossRef]
- Flores, E. Cambio climático: Pastizales altoandinos y seguridad alimentaria. Revista de Glaciares y Ecosistemas de Montaña. 2016. Available online: https://scholar.google.es/scholar?hl=es&as_sdt=0%2C5&q=Pastizales+altoandinos+y+seguridad+alimentaria&btnG= (accessed on 12 March 2024).
- Carla, J.C. Restauración Ecológica de Praderas Altoandinas para la Mejora de las Pasturas Naturales en el Sector Apas, Huancaya, Yauyos. Bachelor’s Thesis, Facultad de Ingeniería Ambiental, Universidad Católica Sedes Sapianteae, Lima, Peru, 2020; p. 154. Available online: https://hdl.handle.net/20.500.14095/807 (accessed on 12 March 2024).
- Onofre, C.I. Diagnóstico de la Condición Ambiental del Bofedal Moyobamba a Través de un Estudio Agrostológico, Distrito de Canchayllo, Provincia de Jauja. Bachelor’s Thesis, Facultad de Ingeniería Agraria, Universidad Católica Sedes Sapianteae, Lima, Peru, 2020; p. 117. Available online: https://hdl.handle.net/20.500.14095/859 (accessed on 12 March 2024).
- Trillo, S.F. Autoecología de Festuca Dolichophylla-Festuca Humilior, y Repuesta a la Adición de NPK en la Puna Peruana. Ph.D. Thesis, UNALM, Lima, Peru, 2021; 108p. [Google Scholar]
- Jorge, J.B.; Galarza, P.V. Evaluación del Estado de Conservación del Bofedal Sector Moya en el Santuario Histórico de Chacamarca, Junín. Bachelor’s Thesis, Universidad Católica Sedes Sapientiae, Facultad de Ingeniería Agraria, Lima, Peru, 2020; 59p. Available online: https://hdl.handle.net/20.500.14095/989 (accessed on 5 February 2024).
- Fernandes, G.W.; Bahia, T.d.O.; Almeida, H.A.; Conceição, A.A.; Loureiro, C.G.; Luz, G.R.; Neves, A.C.; Oki, Y.; Pereira, G.C.; Pirani, J.R.; et al. Floristic and functional identity of rupestrian grasslands as a subsidy for environmental restoration and policy. Ecol. Complex. 2020, 43, 100833. Available online: https://www.sciencedirect.com/science/article/pii/S1476945X19300807 (accessed on 18 January 2024). [CrossRef]
- Capuñay, K. Composición de la Dieta de las Vicuñas (Vicugna vicugna) Usando Técnicas de Microhistología en Heces. repositorio.lamolina.edu.pe. 2022. Available online: https://repositorio.lamolina.edu.pe/handle/20.500.12996/5588 (accessed on 5 December 2023).
- Lan, D.; Eldridge, D.J.; Morgan, J.W.; Witt, G.B. Un marco para predecir los efectos del pastoreo de ganado y la exclusión del pastoreo sobre los valores de conservación en los ecosistemas naturales de Australia. Rev. Aust. Botánica 2007, 55, 401–415. [Google Scholar] [CrossRef]
- Al-Bakre, D.A. Diversity of Indicator and Dominant Plant Species along Elevation Gradients in Prince Mohammad Bin Salman Nature Reserve, KSA. Diversity 2023, 15, 1081. [Google Scholar] [CrossRef]
- Ati, G.; Shucad, J.; Vaca, M.; Chamorro, H.; Guallpa, M.; Horna, S.; Lara, N.; Cushquicullma, D. Classification, composition and floristic diversity in natural grasslands to different strata in the protected area ichubamba yasepan, through geostatistical analysis. J. Namib. Stud. Hist. Politics Cult. 2023, 33, 2006–2025. [Google Scholar] [CrossRef]
- Bai, X.; Zhao, W.; Wang, J.; Ferreira, C.S.S. Precipitation drives the floristic composition and diversity of temperate grasslands in China. Glob. Ecol. Conserv. 2021, 32, e01933. [Google Scholar] [CrossRef]
- Yaranga, R.; Orellana, J.; Pizarro, S. Species of the Poaceae family suitable for Andean livestock farming in the Peruvian Andes reported in GBIF and local studies. Glob. J. Ecol. 2024, 9, 057–065. [Google Scholar] [CrossRef]
- Jaurena, M.; Bentancur, O.; Ayala, W.; Rivas, M. Especies indicadoras y estructura de praderas naturales de basalto con cargas contrastantes de ovinos. Agrociencia 2011, 15, 103–114. [Google Scholar] [CrossRef]
- Okxanen, J. Multivariate Análisis of Ecologycal Communities in R: Vegan Tutorial. Community Disimilarities. 2015. Available online: https://john-quensen.com/wp-content/uploads/2018/10/Oksanen-Jari-vegantutor.pdf (accessed on 13 June 2024).
- Manzanilla, G.; Mata, J.; Treviño, E.; Aguirre, A.; Alanís, E.; Yerena, J. Diversidad, estructura y composición florística de bosques templados del sur de Nuevo León. Revista Mexicana de Ciencias Forestales 2020, 11, 94–123. [Google Scholar] [CrossRef]
- Moreno, E.C. Métodos para medirla biodiversidad. In M&T—Manuales y Tesis; SEA: Zaragoza, Spain, 2001; Volume 1, 84p. [Google Scholar]
- De Cáceres, M.; Legendre, P.; Moretti, P. Improving indicator species analysis by combining groups of sites. Oikos 2010, 119, 1674–1684. [Google Scholar] [CrossRef]
- Renzo, A.; Erika, R. Diversidad Florística de los Bofedales en el Distrito de Tanta—Yauyos—Lima. Facultad de Ing. Forestal y del Ambiente, Universidad Nacional del Centro del Perú, Huancayo, Peru, 2022. Available online: http://hdl.handle.net/20.500.12894/9448 (accessed on 8 December 2023).
- Montesinos-Tubée, D.B.; Cleef, A.M.; Sýkora, K.V. The subnival vegetation of Moquegua, South Peru: Chasmophytes, grasslands and cushion communities. Ecologies 2021, 2, 71–111. [Google Scholar] [CrossRef]
- Yaranga, R. High-Andean wetland of Peru: Floristic diversity, primary net aerial productivity, ecological condition, and carrying capacity. Sci. Agropecu. 2020, 11, 213–221. [Google Scholar] [CrossRef]
- Palomino, F.P.E. Insights of Andean High Plains (Altiplano) tussock Grasslands of Cummo Huacullani, Puno, Peru. opensiuc.lib.siu.edu. 2022. Available online: https://opensiuc.lib.siu.edu/dissertations/2070/ (accessed on 8 December 2023).
- Intagri, S.C. (sf) Clasificación del Suelo: WRB y Soil Taxonomy. Available online: https://www.intagri.com/articulos/suelos/clasificacion-del-suelo-WRB-y-soil-taxonomy (accessed on 15 January 2024).
- Oscar, T. Las Gramíneas (Poaceae) del Perú. Monografías del Real Jardín Botánico. In RUIZIA; Real Jardín Botánico, Consejo Superior de Investigaciones Científicas: Madrid, Spain, 1993; Volume 13, p. 481. [Google Scholar]
- Dicovskiy Riobóo, L.M.; Pedroza Pacheco, M.E. Éxito académico en los universitarios. Caso de estudio: Ingeniería Agroindustrial de la UNI Sede regional del norte, Nicaragua. Rev. Ciencia Tecnol. Higo 2018, 8, 33–42. [Google Scholar] [CrossRef]
- Liang, M.W.; Liang, C.; Hautier, Y.; Wilcox, K.R.; Wang, S. Review for “Grazing-induced biodiversity loss impairs grassland ecosystem stability at multiple scales”. Ecol. Lett. 2021, 24, 2054–2064. [Google Scholar] [CrossRef] [PubMed]
- Peñaloza, R. Evaluación de la diversidad florística y restauración dirigida en pastizales abandonados luego del cultivo de Lepidium meyenii—Junín. Ingenieer Thesis, Facultad de Zootecnia, Universidad de Nacional del Centro del Perú, Huancayo, Peru, 2018; 124p. Available online: https://repositorio.uncp.edu.pe/handle/20.500.12894/4396 (accessed on 12 March 2024).
- Servicio Nacional Forestal y de Fauna Silvestre—SERFOR. Guía para la Identificación de Especies de pastos con Palatabilidad para Vicuñas. 2022. Available online: https://repositorio.serfor.gob.pe/handle/SERFOR/932 (accessed on 10 March 2024).
- Zapana Landaeta, J.C. Evaluación de pastizales naturales y determinación de la carga animal actual en la comunidad chila, puno. Perú. Rev. Investig. 2020, 8, 1286–1296. [Google Scholar] [CrossRef]
- Quinteros-Gómez, Y.; Macedo-Bedoya, J.; Santos-Linares, V.; Angeles-Alvarez, F.; Gómez-Ticerán, D.; Campos-De la Cruz, J.; Solis Sarmiento, J.; Salinas-Inga, A.; Valencia-Saavedra, Z. Floristic Diversity and Distribution Pattern along an Altitudinal Gradient in the Central Andes: A Case Study of Cajatambo, Peru. Plants 2024, 13, 3328. [Google Scholar] [CrossRef]
- Yaranga, R.; Custodio, M.; Chanamé, F.; Pantoja, R. Diversidad florística de pastizales según formación vegetal en la subcuenca del río Shullcas, Junín, Perú. Sci. Agropecu. 2018, 9, 511–517. [Google Scholar] [CrossRef]
- Peso, G. Evaluación de la diversidad florística y generación de estrategias de conservación de los pastizales en la Reserva de Salinas de Aguada Blanca, Departamento de Arequipa. Bachelor’s Thesis, Universidad Católica de Santa María, Arequipa, Peru, 2024; p. 110. [Google Scholar]
| Control Points: P1 to P9 Sites | ||||||||
|---|---|---|---|---|---|---|---|---|
| Assessment 1 | ||||||||
| P1 | P2 | P3 | P4 | P5 | P6 | P7 | P8 | P9 |
| P2 | 0.7305699 | |||||||
| P3 | 0.7025641 | 0.9285714 | ||||||
| P4 | 0.4358974 | 0.5408163 | 0.7373737 | |||||
| P5 | 0.7435897 | 0.8571429 | 0.8888889 | 0.8484848 | ||||
| P6 | 0.7142857 | 0.7664975 | 0.7889447 | 0.7386935 | 0.6180905 | |||
| P7 | 0.7978723 | 0.978836 | 0.9581152 | 0.947644 | 0.6230366 | 0.875 | ||
| P8 | 0.8367347 | 0.5025381 | 0.919598 | 0.6482412 | 0.8592965 | 0.63 | 0.94791 | |
| P9 | 0.8877551 | 0.9187817 | 0.8894472 | 0.9095477 | 0.8190955 | 0.62 | 0.96875 | 0.77 |
| Assessment 2 | ||||||||
| P1 | P2 | P3 | P4 | P5 | P6 | P7 | P8 | P9 |
| P2 | 0.6701031 | |||||||
| P3 | 0.6326531 | 0.744898 | ||||||
| P4 | 0.7860963 | 0.7860963 | 0.8941799 | |||||
| P5 | 0.7040816 | 0.744898 | 0.8383838 | 0.9153439 | ||||
| P6 | 0.6020942 | 0.7172775 | 0.8134715 | 0.9021739 | 0.5958549 | |||
| P7 | 0.6432432 | 0.8594595 | 0.9037433 | 0.9550562 | 0.657754 | 0.61538 | ||
| P8 | 0.8162162 | 0.6216216 | 0.8823529 | 0.8764045 | 0.9037433 | 0.67032 | 0.90912 | |
| P9 | 0.6938776 | 0.6020408 | 0.7676768 | 0.6402116 | 0.8080808 | 0.76165 | 0.83957 | 0.74332 |
| First Assessment | Second Assessment | ||||||||
|---|---|---|---|---|---|---|---|---|---|
| Species | group | indval | p value | freq | Species | group | indval | p value | freq |
| Lachemilla pinnata | 1 | 0.942 | 0.017 | 5 | Deschampsia eminens | 1 | 1.000 | 0.027 | 2 |
| Azorella crenata | 2 | 1.000 | 0.024 | 2 | Cinnagrostis densiflora | 1 | 1.000 | 0.036 | 2 |
| Phylloscirpus rigidus | 2 | 1.000 | 0.035 | 2 | Eleocharis albibracteata | 1 | 1.000 | 0.024 | 2 |
| Wernera lamprophylla | 2 | 1.000 | 0.033 | 2 | Lachemilla pinnata | 1 | 0.627 | 0.043 | 8 |
| Gentianella bellidofolia | 3 | 1.000 | 0.011 | 3 | |||||
| Wernera pygmaea | 3 | 1.000 | 0.006 | 3 | |||||
| Family | Species | Cattle | Sheep | Alpaca | Vicuña | Llama |
|---|---|---|---|---|---|---|
| Apiaceae | Lilaoepsis andina A.W. Hill | SS | SS | SS | ||
| Apiaceae | Lilaoepsis macloviana (Gand) A.W. Hill | SS | ||||
| Asteraceae | Hypochaeris taraxacum (Meyen & Walp) Ball. | SS | SS | |||
| Asteraceae | Wernera nubigena Kunth. | SS | SS | |||
| Asteraceae | Werneria pygmaea Gillies ex Hook. | SS | SS | |||
| Cariophyllaceae | Cerastium imbricatum Kunth vel aff. | SS | ||||
| Cyperaceae | Carex ecuadorica Kük. | SS | SS | |||
| Cyperaceae | Carex hebetata Boott. | SS | ||||
| Cyperaceae | Carex mandoniana Boeck. | SS | ||||
| Cyperaceae | Eleocharis albibracteata Nees & Meyen ex Kunth. | SS | SS | SS | ||
| Cyperaceae | Isolepis setacea (L.) R. Br. (Steud.) Boeckeler | SS | SS | SS | ||
| Cyperaceae | Scirpus rigidus (Steud.) Boeckeler | SS | SS | SS | ||
| Fabaceae | Lupinus chlorolepis C.P. Sm. | SS | SS | |||
| Gentianaceae | Halenia umbellata (Ruiz & Pav.) Gilg. | SS | SS | SS | ||
| Geraniaceae | Geraniium sessiliflorum Cav. | SS | SS | |||
| Juncaceae | Distichia muscoides Nees & Meyen. | SS | ||||
| Juncaceae | Juncus stipulatus Nees & Meyen. | SS | ||||
| Juncaceae | Luzula racemosa Desv. | SS | ||||
| Plantaginaceae | Plantago tubulosa Decne. | SS | ||||
| Poaceae | Agrostis breviculmis Hitchc. | SS | SS | SS | ||
| Poaceae | Agrostis tolucensis Kunth | SS | SS | SS | ||
| Poaceae | Anaterostipa hans-meyeri (Pilg.) Peñail | SS | SS | SS | SS | |
| Poaceae | Anthoxanthum odoratum L. | SS | SS | |||
| Poaceae | Aristida adscensionis L. | SS | SS | SS | ||
| Poaceae | Aristida enodis Hack. | SS | SS | SS | SS | |
| Poaceae | Bromus catharticus Vahl. | SS | SS | SS | SS | SS |
| Poaceae | Bromus lanatus Kunth. | SS | SS | SS | SS | SS |
| Poaceae | Cinnagrostis rigida Kunth. | SS | SS | |||
| Poaceae | Cinnagrostis densiflora (J. Presl) | SS | ||||
| Poaceae | Cinnagrostis fuscata (J. Presl) | SS | ||||
| Poaceae | Cinnagrostis jamesonii (Steud.) | SS | SS | |||
| Poaceae | Cinnagrostis rigescens (J. Presl) | SS | SS | |||
| Poaceae | Cinnagrostis spicigera (J. Presl) | SS | SS | SS | SS | |
| Poaceae | Cinnagrostis tarmensis (Pilg. | SS | SS | SS | ||
| Poaceae | Cinnagrostis vicunarum (Wedd.) | SS | SS | |||
| Poaceae | Festuca huamachucensis Infantes | SS | SS | |||
| Poaceae | Festuca humilior Nees & Meyen. | SS | SS | SS | ||
| Poaceae | Festuca rigescens (J. Presl) Kunth. | SS | SS | SS | SS | |
| Poaceae | Festuca rigidifolia Tovar. | SS | SS | SS | SS | |
| Poaceae | Hordeum muticum J. Presl. | SS | SS | SS | SS | SS |
| Poaceae | Koeleria spicata (L.) Barberá. | SS | SS | SS | ||
| Poaceae | Nassella brachyphylla (Hitchc.) Barkworth | SS | SS | SS | ||
| Poaceae | Nassella meyeniana (Trin. & Rupr.) Parodi. | SS | SS | SS | ||
| Poaceae | Nassella mucronata (Kunth) R.W.Pohl. | SS | SS | |||
| Poaceae | Paspalum pygmaeum Hack. | SS | SS | |||
| Poaceae | Paspalum pilgerianum Chase. | SS | SS | |||
| Poaceae | Poa aequigluma Tovar | SS | ||||
| Poaceae | Poa annua L. | SS | ||||
| Poaceae | Poa gymnantha Pilg. | SS | SS | SS | SS | SS |
| Poaceae | Poa kurtzii R.E. Fr. vel aff. | SS | SS | SS | SS | |
| Poaceae | Poa marshallii Tovar | SS | SS | |||
| Poaceae | Poa perligulata Pilg. | SS | SS | |||
| Poaceae | Poa spicigera Tovar vel aff. | SS | SS | |||
| Rosaceae | Lachemilla diplophylla (Diels) Rothm | SS | SS | SS | SS | |
| Rosaceae | Lachemilla pinnata (Ruiz & Pav.) Rothm. | SS | SS | SS | ||
| TOTAL SPECIES SS | 19 | 36 | 39 | 17 | 24 |
Disclaimer/Publisher’s Note: The statements, opinions and data contained in all publications are solely those of the individual author(s) and contributor(s) and not of MDPI and/or the editor(s). MDPI and/or the editor(s) disclaim responsibility for any injury to people or property resulting from any ideas, methods, instructions or products referred to in the content. |
© 2025 by the authors. Licensee MDPI, Basel, Switzerland. This article is an open access article distributed under the terms and conditions of the Creative Commons Attribution (CC BY) license (https://creativecommons.org/licenses/by/4.0/).
Share and Cite
Yaranga, R.M.; Chanamé, F.C.; Maldonado, E.M.; Orellana, J.A. Floristic Diversity, Indicator and Suitable Species for Andean Livestock in the Sillapata Micro-Watershed, Acopalca. Int. J. Plant Biol. 2025, 16, 77. https://doi.org/10.3390/ijpb16030077
Yaranga RM, Chanamé FC, Maldonado EM, Orellana JA. Floristic Diversity, Indicator and Suitable Species for Andean Livestock in the Sillapata Micro-Watershed, Acopalca. International Journal of Plant Biology. 2025; 16(3):77. https://doi.org/10.3390/ijpb16030077
Chicago/Turabian StyleYaranga, Raúl M., Fernan C. Chanamé, Edith M. Maldonado, and Javier A. Orellana. 2025. "Floristic Diversity, Indicator and Suitable Species for Andean Livestock in the Sillapata Micro-Watershed, Acopalca" International Journal of Plant Biology 16, no. 3: 77. https://doi.org/10.3390/ijpb16030077
APA StyleYaranga, R. M., Chanamé, F. C., Maldonado, E. M., & Orellana, J. A. (2025). Floristic Diversity, Indicator and Suitable Species for Andean Livestock in the Sillapata Micro-Watershed, Acopalca. International Journal of Plant Biology, 16(3), 77. https://doi.org/10.3390/ijpb16030077