Article

Assessment of Rice Amylose Content and Grain Quality Through Marker-Assisted Selection

by
Iris Pérez-Almeida
1,*,
Oscar Navia-Pesantes
1 and
Roberto Celi-Herán
2
1
Center of Studies for Sustainable Development (CEDS), Ecotec University, Km 13.5 Samborondón, Samborondón 092301, Ecuador
2
Rice Program, Instituto Nacional de Investigaciones Agropecuarias INIAP, Estación Experimental Litoral Sur, Guayaquil 092406, Ecuador
*
Author to whom correspondence should be addressed.
Int. J. Plant Biol. 2025, 16(2), 52; https://doi.org/10.3390/ijpb16020052
Submission received: 17 March 2025 / Revised: 9 May 2025 / Accepted: 16 May 2025 / Published: 20 May 2025
(This article belongs to the Section Plant Biochemistry and Genetics)

Abstract

:
Rice (Oryza sativa L.) is essential for global food security and sustains billions worldwide, emphasizing the need to improve production and quality. One key challenge in rice breeding is the inheritance and environmental sensitivity of amylose content, a starch component that influences the texture, water absorption, and firmness after cooking, which are crucial for market acceptance. While international markets prefer low-amylose varieties for their softness, intermediate- and high-amylose varieties are favored in Latin America for their firmness. The objective of this study was to develop a molecular quality assessment methodology that, combined with morphological and culinary evaluations, helps in the selection of rice varieties during the breeding process. First, ten Ecuadorian rice materials were evaluated for milling and culinary quality characteristics, revealing significant grain size, sterility, milling yield, cooking time, and texture variations. Amylose content (AC) is genetically regulated by the waxy gene and its allelic variants, affecting granule-bound starch synthase (GBSS) enzyme expression. Secondly, to classify rice varieties molecularly based on AC, the testing ten genotypes plus nine control varieties were analyzed using microsatellite (SSR) markers. The waxy molecular marker, combined with metaphor agarose gel electrophoresis (MAGE), proved effective for early-stage AC analysis, reducing variety selection costs and improving breeding efficiency. Additionally, a restriction enzyme protocol assay facilitated variety differentiation by selectively cleaving the waxy gene sequence at a specific single-nucleotide polymorphism (SNP) site, allowing for precise AC genetic classification. By integrating molecular techniques with traditional assessments, this study reveals that using marker-assisted selection in breeding programs, as well as supporting the identification and development of high-quality local rice varieties to meet market demands, improves production efficiency and optimizes the assessment of developing varieties under diverse environmental conditions.

Graphical Abstract

1. Introduction

Rice (Oryza sativa L.) is a staple food for billions worldwide and is crucial to global food security. In 2021, developing countries produced approximately 787 million tons of paddy rice, with Asia leading as the primary producer [1]. Efforts to enhance its production and quality have driven the development of new varieties and innovative technologies to meet market demands and ensure an adequate nutrient supply [2,3,4,5].
Although brown rice is healthier due to its higher protein and nutrient content, polished grains dominate the market because of their superior appearance, texture, and digestibility [6]. The preference for milled rice is also attributed to its easier digestion and modifications to culinary characteristics, which enhance its sensory acceptance [7]. However, milling removes essential nutrients, such as vitamins and minerals, complicating efforts to balance nutritional quality with consumer demand [8,9].
Rice quality depends on multiple factors, including its physicochemical properties, cultivation techniques, post-harvest management, and market preferences [10]. This quality varies between local and international markets, and it is influenced by grain appearance, milling efficiency, and culinary properties [11,12].
Among culinary characteristics, amylose content (AC), influencing properties such as texture, water absorption, and firmness after cooking, is critical. AC is categorized into five levels: waxy (0–2%), very low (3–9%), low (10–19%), intermediate (20–24%), and high (>24%) [13,14,15]. Japonica varieties with low AC are preferred in Asia for their softness. In contrast, intermediate and high-AC varieties dominate Latin America due to their firmness and specific textural changes after cooking [16].
Genetically, AC is regulated by the waxy (wx) gene, which is located on chromosome 6. Its allelic variants (wxa and wxb) control the expression of granule-bound starch synthase (GBSS), a key enzyme in amylose synthesis [17,18]. Several single-nucleotide polymorphisms (SNPs) within this gene, such as the G → T polymorphism in the 5’ leader intron, significantly influence the amylose content and rice properties [19]. Additional polymorphisms have been identified in exons 6 and 10, affecting cooking properties and rice texture [20,21].
AC is also influenced by environmental factors, such as temperature during grain development, which can cause significant variations [17]. The environmental factor, combined with the genetic complexity of AC due to epistasis, cytoplasmic effects, and the triploid nature of the endosperm, poses a significant challenge for traditional rice breeding programs [22,23]. Molecular markers offer substantial advantages over conventional methods by enabling early and accurate selection regardless of environmental conditions or the crop’s phenological stage; when applied to breeding, they could make the identification of traits, such as the wx gene, more cost-effective, reliable, and less dependent on chance.
To overcome these limitations, molecular methodologies, such as microsatellites and SNPs, have been developed to classify varieties based on their AC and to facilitate marker-assisted selection (MAS) [24,25]. These tools offer a significant advantage by addressing the variability and inconsistencies associated with traditional phenotypic methods, such as near-infrared spectroscopy and size-exclusion chromatography [26].
New varieties must meet market demands, comply with food safety regulations, and reduce production challenges. The primary objective of this study was to develop a molecular quality assessment methodology that, together with morphological and culinary evaluations, constitutes a reliable tool for classifying and selecting rice lines during and after the breeding process.

2. Materials and Methods

2.1. Morphological Evaluation

Ten rice (Oryza sativa L.) cultivars (nursery lines GO-04209, GO-04304, GO-04361, and GO-04429, and commercial varieties (Arenillas, Cristalino, Elite, Hangang-Chal, Impacto, and SFL-011) were selected to study their morphology, grain milling, and culinary quality at the Instituto Nacional de Investigaciones Agropecuarias (INIAP) rice quality laboratory.
One hundred rice grains from each variety were randomly selected to determine the sterility percentage (%S). The grains were placed horizontally on a dark glass surface, and their length, width, and thickness were measured under natural light using a digital Vernier caliper.

2.2. Milling Quality

One hundred grams of paddy rice from each variety was processed using an experimental milling machine (ZACCARIA PAZ/1-DTA, Limeria, Brazil) to obtain brown, polished, and graded rice. Before processing, the samples were cleaned and homogenized, and their moisture content was measured. During milling, residues were manually removed and weighed before and after each stage to calculate the losses and milling efficiency. A cylinder was used to classify, selecting whole and three-quarter grains while discarding the rest, the grains into japonica and indica groups.
The following weights were recorded: husked weight (HW), polished weight (PW), and graded weight (GW). The grain dimensions, including polished grain width (PGW) and polished grain length (PGL), were also measured.

2.3. Culinary Quality

The culinary analysis followed the protocol of the International Center for Tropical Agriculture (CIAT) using a 1:1 ratio (250 g of rice and 250 mL of water) in a rice cooker (Zojirushi NLBB05C, Osaka, Japan). Water evaporation and absorption times were measured with a stopwatch and continuously monitored without interrupting the rice cooker’s operation. Additionally, disintegration time was evaluated using a standard container (8.5 cm in diameter and 10 cm in depth) to compare the consistency and serving time across varieties.
Therefore, the parameters assessed included water evaporation (WE), cooking time (CT), disintegration (D), and amylose content percentage (AC) with an infrared component analyzer AN-900. Calibration for AC determination utilized the Japonica WR rice variety, with an AC value of 21.50%, as a control.

2.4. Plant Material for Molecular Analysis

The molecular evaluation was conducted on 19 rice genotypes, including the 10 provided by INIAP and the 9 control varieties whose AC reports were already established in the literature [17,19,27]. Furthermore, 5 were donated by the Danac Foundation from Venezuela (Cimarrón, Fonaiap 1, D-Sativa, Fedearroz 50, and Fedearroz 2000), and 4 were donated by the International Rice Research Institute (IRRI) Genebank (Lemont, Mahsuri, Pulut Hitam 9, and Ria).

2.5. DNA Extraction

To obtain fresh material for DNA extraction, 15 rice seeds per variety were cultivated in 20 cm3 containers filled with moistened soil under partial shade at the Ecotec University nursery. Leaf samples were collected 10 days after sowing and dehydrated using silica gel. DNA extraction was performed using the Wizard® Genomic DNA Purification Kit (Promega®, Madison, WI, USA). DNA quantity was determined with a Qubit 4 fluorometer (Promega®), and the DNA quality and integrity were verified through 1% agarose gel electrophoresis in a 0.5X TBE buffer.

2.6. Molecular Analysis

To observe the presence of polymorphisms in the wx gene, specific sequences were amplified using PCR. Each 25 µL reaction mixture contained 2.5 µL of GoTaq Green Master Mix 2X (Promega®), 0.5 µL of primers forward and reverse, 3 µL of template DNA (60 ng·µL−1), and 9.5 µL of sterile molecular-grade distilled water. Selected PCR primer pairs were 484F—485R (484F 5’-CTTTGTCTATCTCAACACAC -3’, 485R 5’- TTGCAGATGTTCTTCCTGATG 3’, and 484F—W2R 5’-TTTCCAGCCCAACACCTTAC 3’). The PCR was performed in a Thermo MiniAmp Plus (Thermo Fisher Scientific, Waltham, MA, USA) thermocycler with the following temperature profile: initial denaturation at 94 °C for 5 min; followed by 35 cycles of 94 °C for 45 s, 52 °C for 30 s, and 72 °C for 1 min; and final elongation at 72 °C for 5 min. All reactions were replicated three times.
The amplified products were subjected to electrophoresis in 4% MetaPhor® (Menlo Park, CA, USA) gels, which were prepared with a mixture of MetaPhor® agarose (2.5%) and Invitrogen (Waltham, MA, USA) standard agarose (1.5%) in a TE buffer. The gels were stained with Diamond dye® (Mumbai, India), solidified at 4 °C for 20 min, and electrophoresed for 2 h and 30 min at 70 V. The gels were then visualized under UV light using a Viber e-box transilluminator.

2.7. SNP Polymorphism

DNA purity is essential for the practical application of restriction enzymes and the accurate visualization of wx gene categorization, so the DNA quality was evaluated before digestion. The presence of the G → T SNP at the 5’ leader intron splice site was assessed through enzymatic digestion. Four µL of the 484F-W2R PCR amplified products were digested with 0.5 U of AccI (New England Biolabs, Ipswich, MA, USA) at 37 °C for 2 h in a 15 µL total volume reaction. All reactions were performed three times. The digested fragments were analyzed via electrophoresis in a 1.5% agarose gel for 1.5 h at 80 V.

2.8. Statistical Analysis

The data values of the 10 traits (morphological, milling quality, and culinary quality) of the INIAP rice cultivars were used to perform descriptive statistical analysis.
Pearson’s correlation coefficients (r) were calculated using Statistix v9 to assess the linear relationships among variables. Principal component analysis (PCA) was then performed with PAST v4.03 [28].
Furthermore, molecular analysis was conducted on the 19 rice genotypes, focusing on the allele data for each SSR marker (484-485 and 484-W2R). Amplified bands were visualized using an E-Box CX5 transilluminator (Vilber Lourmat, Marne-la-Vallée, France), and the BioVision software version 7.7.1 to analyze and determine the amplicons’ size and to edit the photos captured by the equipment. The obtained data were used to calculate the allele frequencies by dividing the number of times an allele was observed at a locus by the total number of alleles studied (F = number of observed alleles/total number of alleles studied) [29].
Subsequently, an association analysis was performed between the alleles of each SSR and the amylose content (AC) of the rice grain. A generalized randomized block design was used, where treatments were grouped based on the allele identified for each SSR. The number of treatments corresponded to the number of distinct alleles (n) identified, and the genotypes within each treatment served as the sample for that treatment. The independent variable was the percentage of apparent amylose content (AC).
This design was chosen because the alleles generated by the SSRs were repeated an unequal number of times within each block. In cases where significant differences were detected between treatments (alleles) and the molecular marker, a Tukey multiple comparison test was performed with a significance level of p < 0.05 using Statistix Version 9.0.
The analysis aimed to determine the correspondence between the alleles generated by the SSRs (linked to the wx gene) and the apparent amylose content. In this way, the classification of the evaluated materials resulted in five categories: waxy- (0–2%), very low- (2–10%), low- (10–20%), intermediate- (20–25%), and high- (>25%) amylose content [30,31,32]. The analysis sought to establish the associations between the obtained information to assist in rice breeding programs.

3. Results

3.1. Correlations Between Different Milling, Culinary, and Rice Quality Characteristics

Assessment of the milling quality variables (Table 1) revealed a wide range of variation among the studied rice varieties, as evidenced by the dispersion measures and intervals corresponding to each attribute. The coefficient of variation (CV) was less than 14% for 83.33% of the quantitative variables analyzed. Notably, the sterility percentage (%S) and disintegration (D) exhibited the highest CV values (71.26% and 149.84%, respectively), effectively distinguishing the ten rice varieties. In contrast, the variables with the lowest variability were husked weight (HW) and polished weight (PW), with CV values of 1.02% and 1.68%, respectively.
As expected, straightforward and positive linear correlations were detected between HW and PW using Pearson’s correlation coefficient (Table 2). As the HW (g) increased, higher PW values were observed. A strong positive correlation was also observed between the water evaporation (WE) and cooking time (CT). The correlations were the highest and statistically significant (Table 2).
Negative linear correlations were detected between the polished grain length (PGL), polished grain width (PGW), and %S, with highly significant values of r = −0.87 and r = −0.75, respectively (Table 2). Additionally, positive correlations were observed between the PGW and %S, with substantial values of r = 0.69.
On the other hand, negative linear correlations were observed between the PGL and PGW, indicating that, as the grain length increases, the width of the polished grains decreases (Table 2). A negative correlation was also observed between PGL and WE, with r = −0.65.
The correlation indices between the graded weight (GW) and disintegration (D) did not show significant values, possibly due to the high phenotypic variability observed in the analyzed rice materials. In contrast, the amylose content percentage (AC) exhibited a moderate and significant negative correlation with WE, with r = −0.58 (Table 2). This indicates that a higher WE is associated with a lower AC.
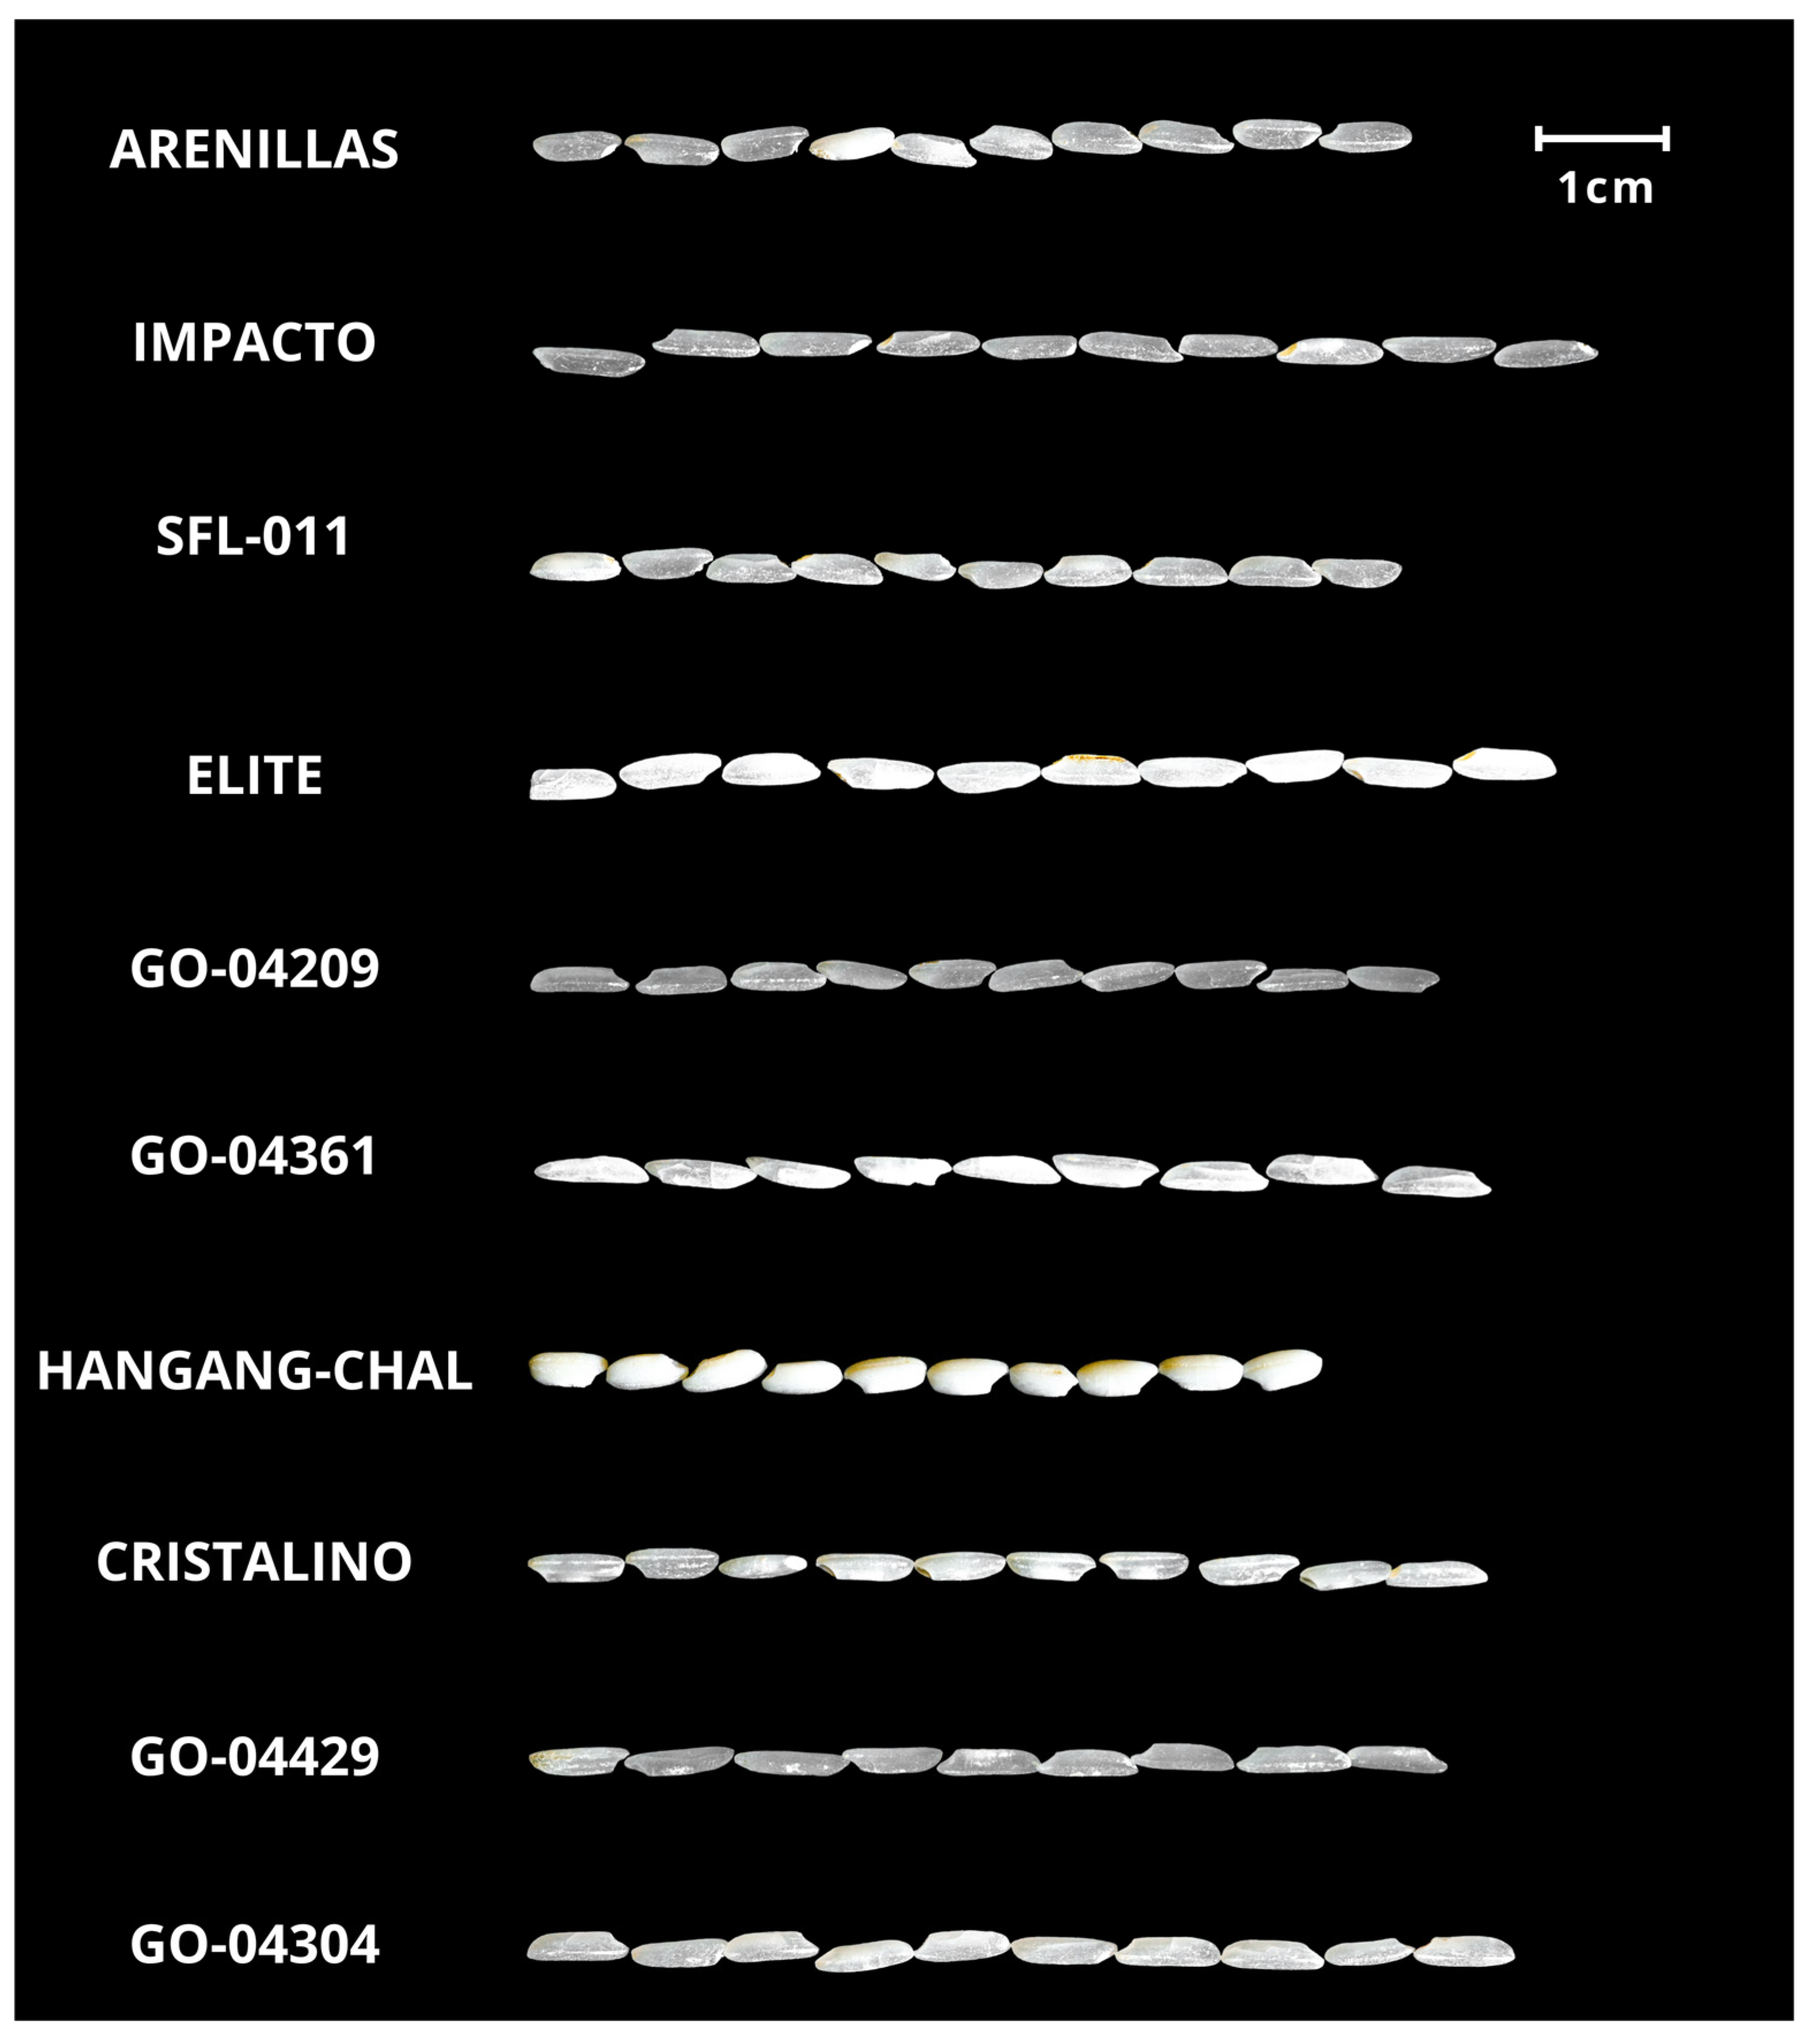
Figure 1 illustrates the variation in the grain size among the different rice varieties and the translucency observed in certain types. Notably, Hangang-Chal (a japonica type variety) stood out for its uniformly white grains and shorter length than other varieties. This highlights the distinctive traits of each cultivar and emphasizes the differences between the indica and japonica varieties, which vary in genetic composition and nutrient content [33].

3.2. Principal Component Analysis (PCA) of the Spatial Distribution of Groups

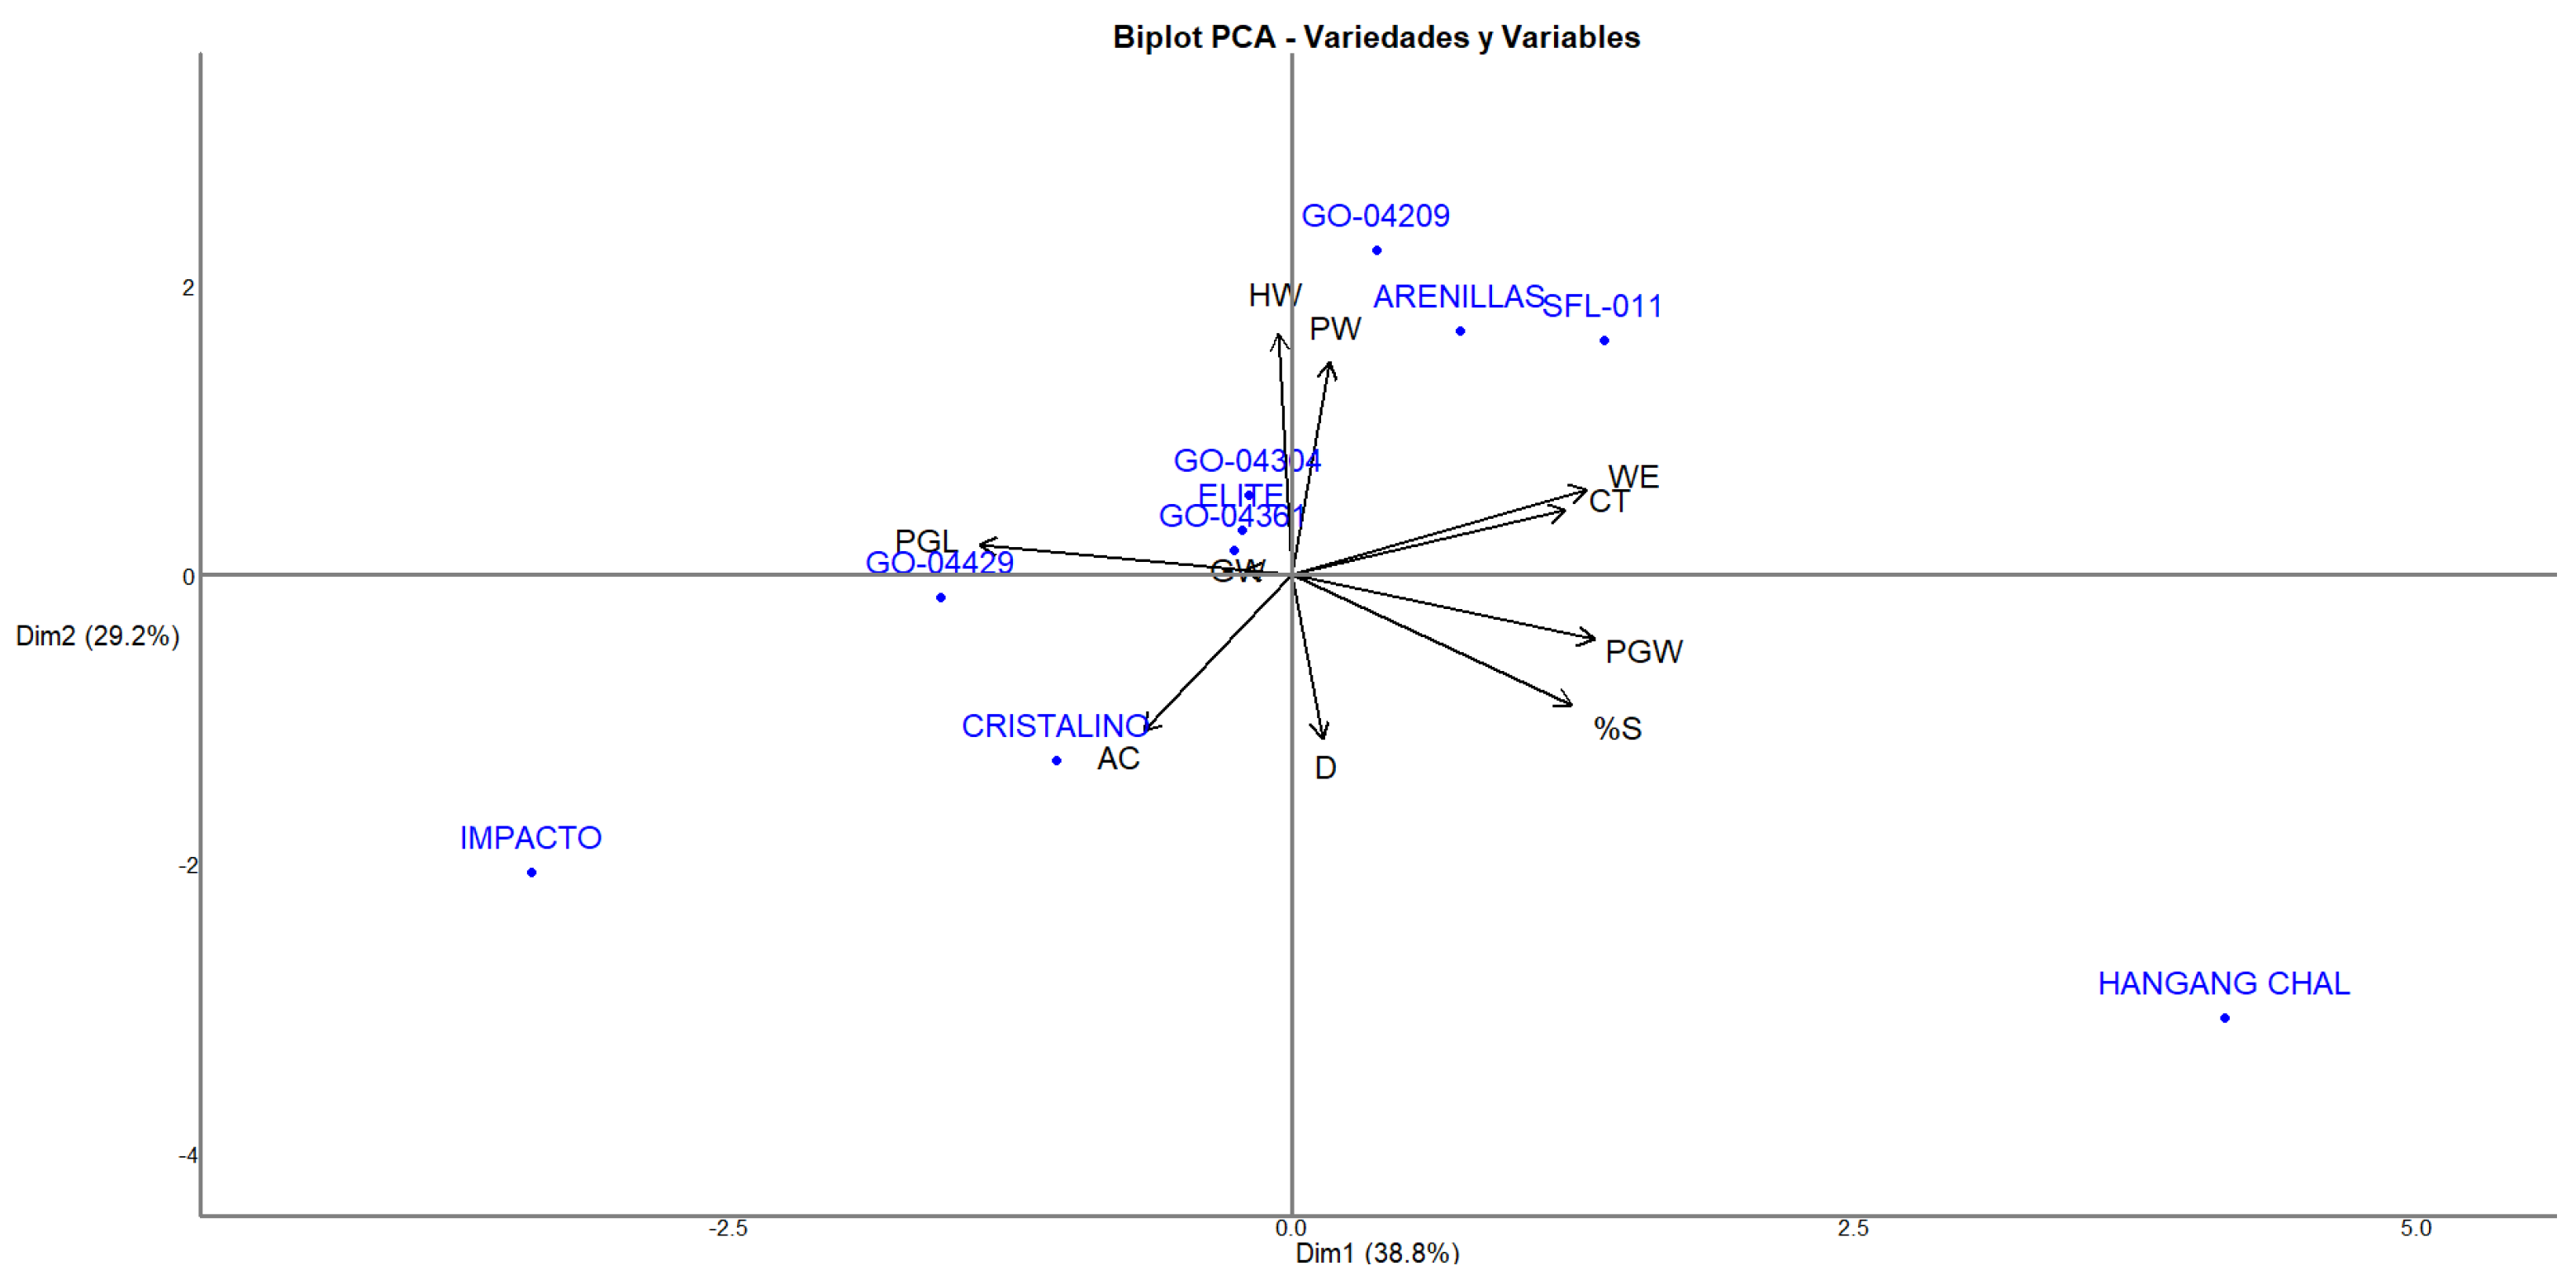
Principal component analysis (PCA) allowed for the identification of the multivariate patterns of variation among the genotypes evaluated, explaining 68.0% of the total variability in the first two dimensions (Figure 2). The distribution of the genotypes in the different quadrants of the biplot and their relationship with the variables evaluated provides a comprehensive view of their phenotypic profiles of milling and culinary quality.
The distribution observed in the quadrants highlights the usefulness of PCA in identifying extreme or intermediate genotypes. The vector corresponding to amylose content (AC) was oriented toward quadrant II (Dim1 negative and Dim2 positive), indicating that the genotypes projected in that direction had high-amylose content. The vector length suggested a moderate contribution of this variable to genotype differentiation. This was the case for materials such as GO-04209 and GO-04205, which could be considered valuable sources of this trait, and they are relevant for functional properties of the grain and industrial applications. In contrast, the Hangang-Chal genotype in quadrant IV showed a clear separation in the opposite direction, suggesting a low-amylose content, which is a characteristic congruent with its waxy rice profile and is known for its high-amylopectin content.
Principal component analysis (PCA) was performed to reduce the dimensionality of the quantitative variables measured across the ten rice (Oryza sativa L.) varieties. As shown in Table 3, the first three principal components (PCs) accounted for 80.92% of the total variance, with eigenvalues of 3.88, 2.92, and 1.29, respectively. PC1 alone explained 38.83% of the variation, followed by PC2 (29.16%) and PC3 (12.94%), indicating that these components capture most of the variability present in the dataset. The inclusion of PC4 and PC5 increased the cumulative variance to 95.95%, although their individual contributions were considerably lower. These results justify the use of the first three components for subsequent multivariate analyses, such as biplot interpretation and clustering, as they retain the most informative patterns within the data.
The first component (PC1) was primarily defined by variables related to weight and size, particularly the water evaporation (WE), total classified grain (CT), and reproductive stage, such as sterility percentage (%S). These variables had strong positive loadings on PC1 and are represented by large vectors. Therefore, varieties located in the rightmost region of the biplot, such as Hangang-Chal, were found to be associated with higher values for these descriptors.
The second principal component (PC2) was influenced by grain weight (HW), paddy weight (PW), and, to a lesser extent, polished grain width (PGW). The vectors for these traits pointed upward, indicating that varieties situated higher on the plot, such as Arenillas and SFL-011, exhibited relatively higher values in these variables.
In contrast, Impacto was located at the bottom left of the biplot, opposite the direction of the contributing vectors, suggesting low values across most of the influential variables. Impacto was found to be associated with the polished grain length (PGL) vector, indicating a contrasting phenotypic profile concerning genotypes such as Hangang-Chal.
Similarly, Cristalino appeared in the lower-left quadrant, aligning with negative contributions in both PC1 and PC2. This placement reflects its association with traits such as disintegration (D) and amylose content (AC), which pointed toward the left and slightly downward.
On the other hand, the vector corresponding to the percentage of sterility (%S) was oriented towards quadrant IV, coinciding with the position of Hangang-Chal, which indicated a higher proportion of floral sterility in this genotype. This behavior could be related to its environmental sensitivity or genetic background, influencing the reproductive stability under the conditions evaluated.
The opposite direction between the AC and %S vectors suggested a negative correlation between both variables. A higher amylose content tends to be associated with lower levels of floral sterility. This finding has implications for both the industrial quality and reproductive efficiency of the materials, which are the key aspects of breeding programs.
The clustering pattern observed among the varieties (Table 4) in the central region, such as GO-04304, GO-04361, GO-04209, and Élite, suggested more balanced or average values across the descriptors, with minimal influence from the extreme values in any single variable. These varieties were aligned near the origin, indicating lower overall variation relative to the main contributing traits, which position them as materials of interest for breeding programs seeking stability.
The PCA effectively distinguished between the rice genotypes based on four significant traits: disintegration, sterility percentage, grain width, and amylose content. PC1 primarily explained the variation associated with the weight- and size-related variables, while PC2 captured the variance driven by the physical grain structure. The PCA biplot confirms that genotypes such as Hangang-Chal and Arenillas occupy opposite regions of the phenotypic space, which is consistent with their distinct performance in the evaluated traits. These findings reinforce using PCA as a robust genotype characterization and selection tool in rice breeding programs [30,34].

3.3. Molecular Analysis

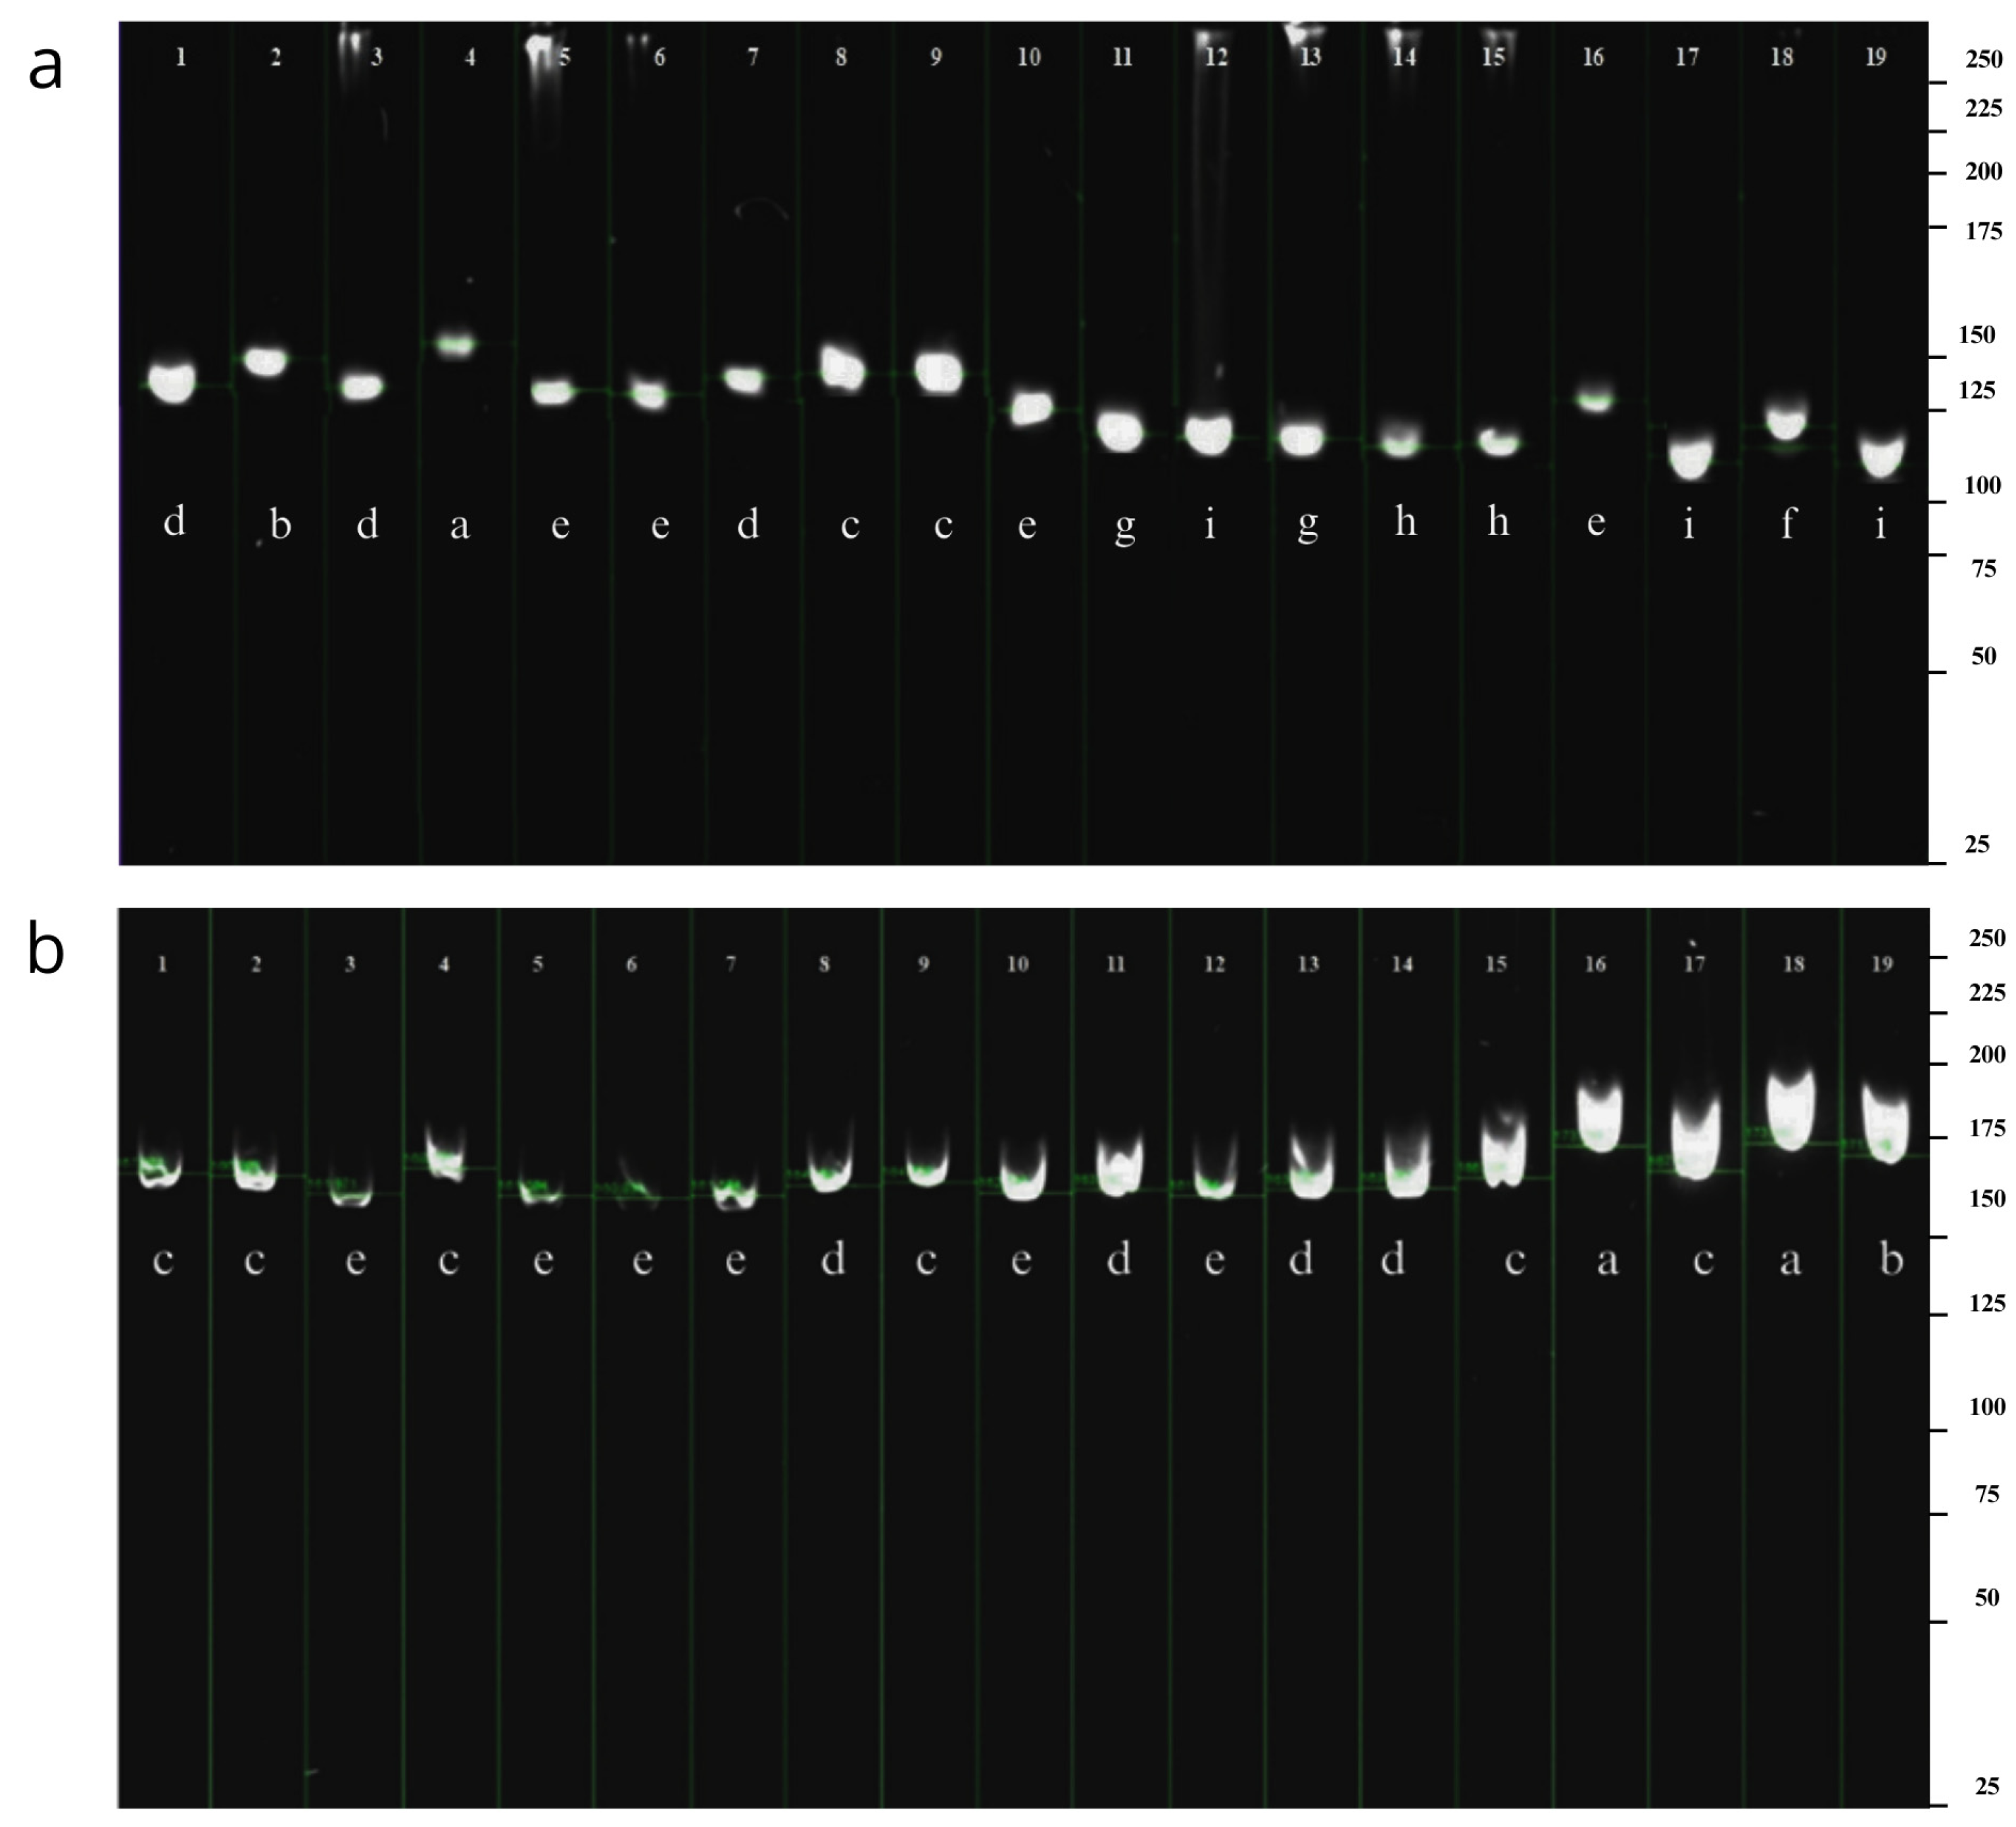
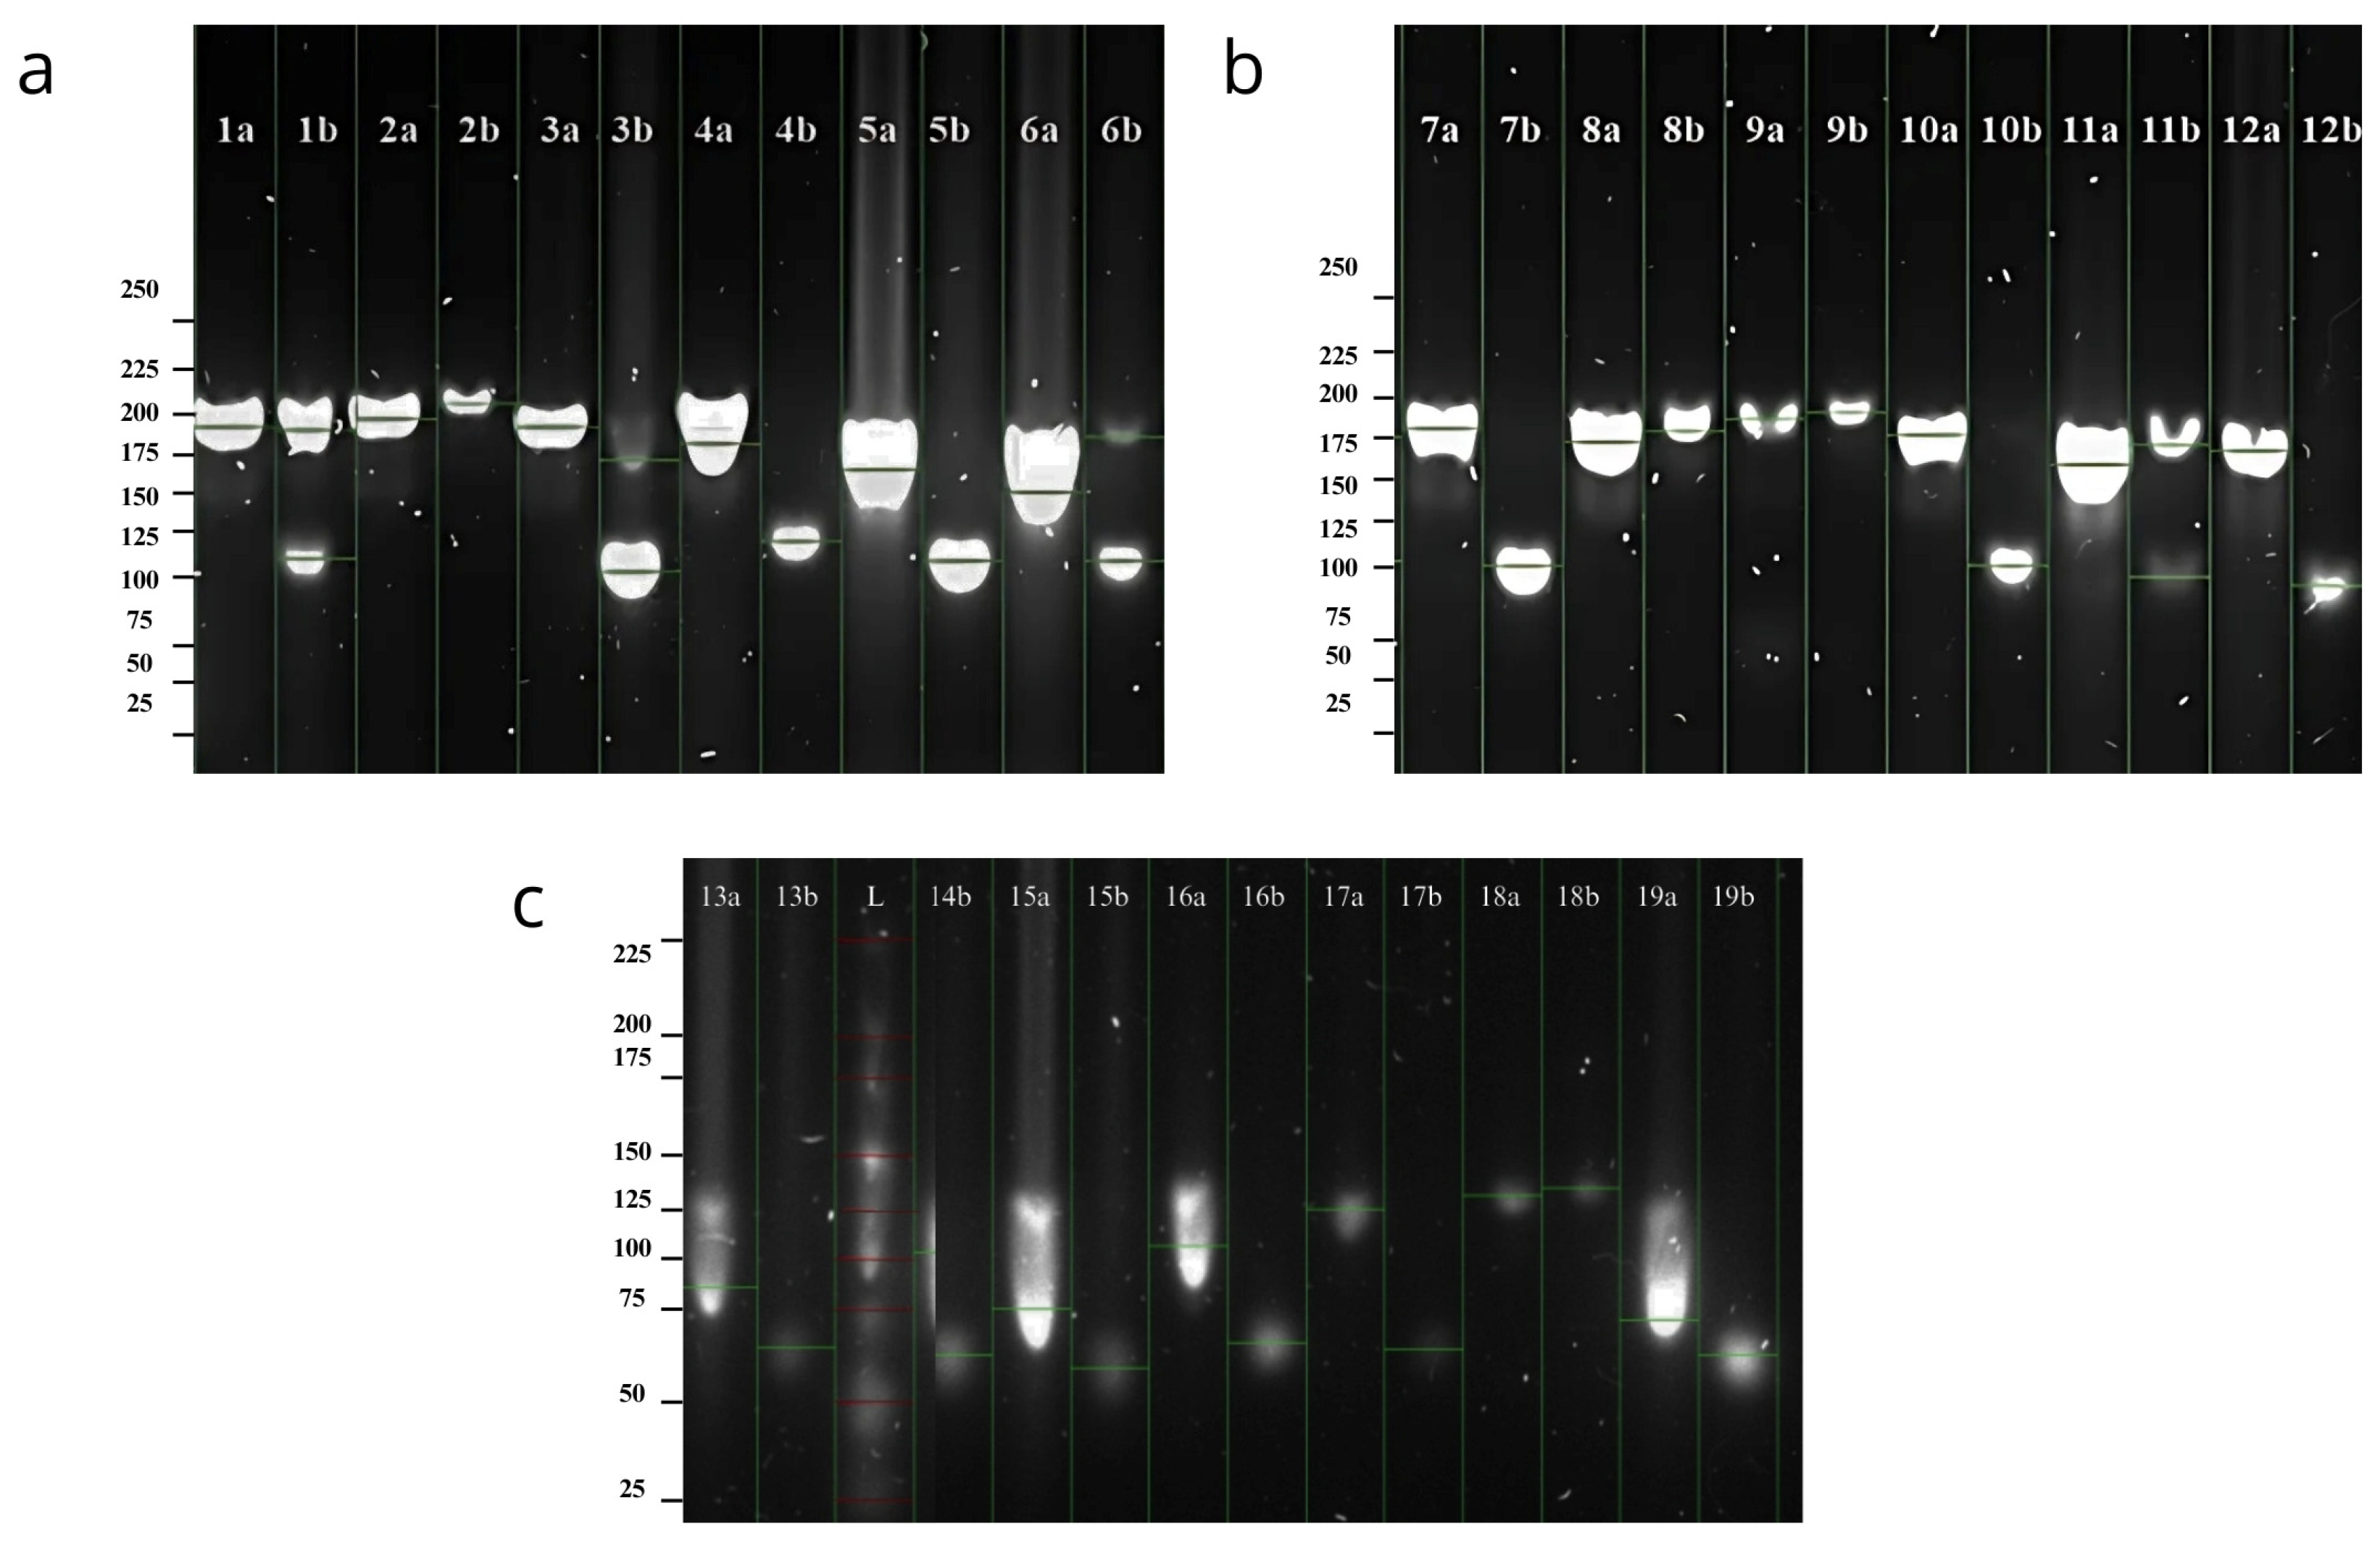
The molecular marker 484-485 exhibited the highest number of alleles, with nine alleles observed and a base pair range of 114–154 bp (Figure 3). In contrast, the SSR marker 484-W2R displayed fewer waalleles, with five alleles detected on the gel (Figure 4) and minimum and maximum frequencies ranging from 0.05 to 0.32 (Table 5).
In the association analysis between the AC in the rice grains and the alleles of each SSR marker, the treatments were grouped into nine alleles for SSR 484-485 and five alleles for SSR 484-W2R using the apparent amylose content percentage as the independent variable in the variance analysis (Table 6 and Table 7).
Significant differences were detected between the AC and the molecular marker 484-485 alleles. The coefficient of determination (R2), explaining 86% of the phenotypic variance in AC percentage, was 0.86 (Table 6). This result suggests that AC could be considered for potential inclusion in a marker-assisted breeding program using the molecular marker 484-485 to optimize material selection. In contrast, no significant association was observed (Table 7), between the marker 484-W2R and AC, with an R2 value of 0.27.
A Tukey multiple comparison test was conducted to determine the correspondence between the 9 alleles of the 484-485 marker (associated with the waxy gene) and the apparent AC, allowing for the classification of the 19 evaluated materials into their respective AC categories (Table 8).
Pulut Hitam 9, one of the control varieties, was classified as waxy, while the nursery variety GO-04304 had low-amylose content. Fourteen varieties (73.68%) were classified as having intermediate-amylose percentage (Fedearroz 2000, D-Sativa, GO-04209, GO-04361, Élite, Arenillas, Cristalino, SFL-011, Lemont, GO-04429, Cimarrón, Fedearroz 50, Hangang-Chal, and Impacto). Fonaiap 1, Mahsuri, and Ria were categorized as high-amylose class lines.
They were also associated with alleles 1, 4, 3, 5, 8, and 7 (154, 154, 142, 134, 118, and 110 bp, respectively). Meanwhile, three varieties were classified as high amylose, corresponding to the allele 9 (114 bp).

3.4. Genotyping Using PCR-AccI Restriction Digestion

Figure 4 shows the results of the digestion assay with the enzyme AccI when the amplification products of the oligos 484 and W2R were evaluated. The figure displays the undigested genotypes (lane a) and those after digestion (lane b), showing one or two fragments depending on the case.
The amplified products containing the sequence AGGTATA were cleaved, while those with the AGTTATA remained intact.
The varieties that showed the sequence AGGTATA can be associated with low-amylose content. Pulut Hitam 9, GO-04304, Hangang-Chal, and Impacto were the only varieties in which the amplification product remained intact.

4. Discussion

4.1. Rice Quality

As stated before, the milling quality of the rice is significantly influenced by various factors affecting the grain yield and appearance, playing a crucial role in product acceptance in local and international markets. Key variables evaluated include sterility percentage, husked weight, polished weight, and graded weight, which collectively reflect the efficiency of the milling process. Additionally, the presence of chalky grains, along with grain length and width, is a fundamental characteristic for assessing processed rice’s visual and functional quality.
The visual characteristics revealed that each variety exhibits distinctive traits, including varying levels of translucency (Figure 1). This attribute is closely related to the percentage of chalkiness (%S), as observed in the Hangang-Chal variety, whose grains display more excellent opacity or a uniformly dull white color. This visual trait can be associated with the negative loading in the PCA results regarding grain weight loss, suggesting that a higher %S indicates greater fragility. Consequently, grains with elevated chalkiness are more prone to breakage and weight loss during milling.
Regarding efficiency, the observational germplasm line GO-04209 excelled, with only a 39% weight loss during milling, followed by Impacto, with a 43% reduction. Conversely, the Cristalino variety exhibited nearly a 50% weight loss, making it less efficient than other varieties. These findings align with Sandhu et al. (2018), who reported that grain shape significantly influences milling efficiency [8]. Moreover, the polishing and grading stages contribute to considerable weight loss, impacting aesthetic properties, such as the translucency and thickness, which are critical consumer preference factors.
Additionally, the results obtained from the PCA (Figure 2) show that the variables PGL and PGW were inversely related, indicating that, in shorter varieties, it is common for the grain to exhibit greater thickness. On the other hand, in terms of grain efficiency traits, the varieties GO-04209, Arenillas, and SFL-011 were positively associated, forming a group closely related to the variables HW and PW. However, Élite, GO-04361, and GO-04304 were more strongly associated with GW. These results confirm that GO-04209 is the most efficient variety, showing the lowest weight loss compared to the other varieties, in the milling process.
According to Kaminski et al. (2013), these losses are influenced by pre-processing storage and handling conditions, emphasizing the need to optimize these post-harvesting stages to minimize waste. Improvements in storage and processing practices could enhance both the yield and quality of milled rice, ensuring better market competitiveness and consumer satisfaction [35].
On the other hand, rice culinary quality includes key aspects, such as the water evaporation (WE), disintegration (D), cooking time (CT), and amylose content (AC), which determine the product acceptance in terms of texture, flavor, and ease of preparation. A positive and highly significant correlation was confirmed between WE and CT, suggesting these variables are interrelated and influenced by grain length and width, which are often inversely proportional. According to Li et al. (2021), grain opacity and chalkiness also play a significant role in culinary quality, influencing properties like adhesiveness and the visual appearance of cooked rice [36]. These characteristics were observed in Ecuadorian varieties with intermediate-to-low-amylose content, directly impacting properties such as grain gelatinization and consistency during cooking.
For example, the varieties Cristalino and Hangang-Chal, due to their reduced amylose content, exhibited shorter disintegration times and unique adhesive properties, as Zhao et al. (2023) described, which is one of the characteristics of low-amylose content varieties [37]. Additionally, Naik et al. (2023) reported significant differences in cooking time among rice varieties, emphasizing the influence of environmental and genetic factors on this trait [38]. These characteristics reflect not only genetic influence, but also the impact of environmental and storage conditions before consumption.
This agrees with findings by Fresther (2002), who evaluated the amylose content of Lemont, reporting a low-amylose value [39]. However, this contrasts with the values obtained in the present study, classifying Lemont as an intermediate-amylose variety, as corroborated globally by Ayres et al. (1997) using near-infrared reflectance spectroscopy, and by Arnao et al. (2012) through colorimetric evaluation [19,27]. These findings highlight the importance of using precise methodologies to account for the variability in environmental and genetic factors affecting amylose content and related culinary traits.

4.2. Molecular Evaluation of the Amylose Content

An exhaustive evaluation of the amylose content was conducted using molecular techniques based on microsatellite markers, which can provide greater precision in classifying rice varieties (Han et al., 2004), and a restriction enzyme assay. Marker-assisted breeding strategies are a crucial step toward sustainable rice improvement, fulfilling specific demands from both global and local markets while facilitating the selection of varieties suitable for the diverse altitudes found in Ecuador [40].
The molecular marker 484-485 exhibited a significant association with the apparent amylose content (AC), explaining up to 86% of the observed phenotypic variance. This association level contrasts with the findings Arnao et al. (2012) reported, where the same marker accounted for only 49% (R2 = 0.49) of the variation in AC. The divergence between studies may be attributed to the differences in the number and genetic origin of germplasm analyzed; Arnao et al. (2012) evaluated two separate populations comprising 334 and 247 accessions, respectively, with distinct genetic backgrounds. The influence of the varietal origin on the degree of marker association is relevant, as genetic heterogeneity can significantly impact linkage strength. Furthermore, the R² value reported by Arnao et al. (2012) was lower than the documented values in other studies [19,34], which suggests that similar markers can explain over 80% of the phenotypic variation in AC. The present study classified the varieties into two primary categories based on AC: approximately 90% of the genotypes displayed intermediate AC, while 10% were characterized as low-amylose varieties (Table 8). These findings agree with those of Arnao et al. (2012), who identified specific allelic variants associated with AC in Venezuelan rice germplasm [19], providing a valuable reference point for comparative analyses and applications in marker-assisted selection strategies within rice improvement programs.
Finally, gel analysis confirmed that varieties such as Ria and Mahsuri, known for their high-amylose content (28.7% and 26.9%, respectively, according to Cheng et al., 2012), contrast sharply with Pulut Hitam 9, which is classified as a waxy material [17]. The findings highlight the need to apply molecular tools for more precise classification. These differences in genetic and phenotypic characteristics underscore the importance of integrating molecular with traditional methodologies to optimize rice quality evaluations.
This outcome is consistent with Ong et al. (2012), who demonstrated the utility of molecular markers in identifying and characterizing amylose content, thereby establishing a critical link between the genetic profiles and functional properties of rice [41]. Additionally, these results emphasize the value of molecular markers as strategic tools to enhance efficiency and precision in marker-assisted selection programs, contributing to the sustainable development of this essential crop.
On the other hand, based on the results obtained, the Ecuadorian varieties can generally be classified as having intermediate-amylose content (AC). However, the findings for Impacto and Élite varieties differ from those reported by CIAT, which documented AC values of 26% and 31.6%, respectively [42,43]. This discrepancy may be attributed to the methodology employed by CIAT, which was based solely on phenotypic evaluation, whereas the present study incorporated molecular analysis. Our findings revealed that all the evaluated varieties exhibited lower amylose content than expected, suggesting a divergence between the phenotypic expression and underlying genetic markers. These findings underscore the value of combining molecular techniques with conventional evaluation methods to strengthen the precision and impact of rice breeding efforts.

4.3. PCR-AccI Genotyping

These results align with those reported by Ayres et al. (1997) and Cheng et al. (2012), where the combination of the oligos 484-W2R and the enzyme AccI was used [27]. This approach revealed that the enzyme performed cuts that differentiate an SNP G → T (AGGTATA/AGTTATA), enabling precise categorization and a more accurate determination of the amylose content as high, intermediate, or low with the aid of enzyme digestion or the use of a CAPS marker [17].
Varieties with the expected fragment size after digestion exhibited two bands, or a single band, below the initial amplified sample size (Figure 4), being classified as intermediate-to-high-amylose varieties and hence containing the G allele. Conversely, samples that remain uncut, showing a unique single band corresponding to the original amplified size, are classified as waxy or low-amylose varieties, inferring the potential presence of the T allele. This precise differentiation underscores the utility of combining molecular tools and enzymatic digestion to classify rice varieties properly.
According to Cheng et al. (2012), the variety Ria exhibits high-amylose content (AC), Mahsuri exhibits intermediate AC, and Pulut Hitam 9 exhibits low AC, aligning with the digestion results obtained in this study [17]. Similarly, Lemont, another control variety, was reported by Ayres et al. (1997) and Arnao et al. (2012) to have intermediate AC, which is consistent with the results from both the digestion and amplification analyses using the waxy molecular marker in this study. Additionally, the three Venezuelan control varieties (Cimarrón, Fonaiap 1, and D-Sativa) and the two Colombian varieties (Fedearroz 50 and Fedearroz 2000) were classified as intermediate AC according to the data reported by Ayres et al. (1997) [19,27]. This classification was confirmed in this study through allele identification.
Most Ecuadorian varieties were categorized as having intermediate-amylose content (AC), except for GO-04304, which exhibited low AC (Table 8). These observations suggest an incongruence between the phenotypic and genotypic classification in specific genotypes, which merits further exploration. The following section provides a more detailed discussion of these discrepancies.
Nonetheless, the critical G → T polymorphism demonstrated its putative effectiveness in distinguishing the amylose content levels without the need for sequencing the products or employing polyacrylamide gels, offering a reliable and efficient tool for classifying most rice varieties.

4.4. Molecular and Phenotypic Classification

Although most rice varieties in this study showed concordance between the molecular marker data and phenotypic evaluation of amylose content, specific inconsistencies were observed. For example, Impacto was classified phenotypically as high amylose (26.5%) based on colorimetric evaluation, while molecular analysis, using the 484-485 SSR marker and the PCR-AccI assay, associated it with the T allele, which is typically linked to low-amylose or waxy types. Similarly, Hangang-Chal, phenotypically characterized by a low-to-intermediate-amylose percentage (20.6%), was also related to the T allele in the digestion assay, despite its known waxy profile. These divergences between molecular and phenotypic classification suggest underlying complexities that cannot be captured by a single method.
Several hypotheses may explain these discrepancies. First, sequence-level variation, such as SNPs at the AccI recognition site (AGGTATA), could prevent enzymatic cleavage. Second, epigenetic factors, including DNA methylation, may inhibit enzyme activity despite the presence of the target sequence. Environmental conditions and post-harvest handling can also influence amylose biosynthesis, potentially masking the genetic expression in phenotypic assays.
To support this discussion, we included Table 8, which contrasts the phenotypic amylose content classification with the SSR allele identification and PCR digestion results. This table highlights the genotypes with conflicting results and was added in response to the reviewer’s recommendation.
These findings reinforce the limitations of relying solely on phenotypic or molecular data for varietal classification. While molecular markers offer stability and reproducibility, phenotypic evaluations are subject to environmental variation. Integrating both approaches provides a more comprehensive and accurate understanding of genotype performance.
Further studies involving sequence-based validation and functional assays are recommended to resolve such inconsistencies. Ultimately, these cases underscore the importance of multidimensional selection criteria in rice breeding programs.
In summary, integrating phenotypic, culinary, and molecular analyses in this study provided a comprehensive understanding of the factors influencing Ecuadorian rice grain quality. Key traits, such as the graded weight, sterility percentage, disintegration, and amylose content, were shown to be highly variable among the studied varieties and closely associated with their genetic background. The use of molecular markers, particularly the 484-485 SSR, proved effective in differentiating the amylose content categories, offering greater precision than the phenotypic assessments alone. The critical G → T polymorphism demonstrated by the PCR-AccI assay showed putative effectiveness in distinguishing the amylose content levels without employing polyacrylamide gels, offering a reliable and efficient tool for classifying most rice varieties.
Our findings underscore the value of combining traditional and molecular approaches for varietal classification, and they also highlight the potential of marker-assisted selection to enhance breeding programs to improve rice quality and adaptation to diverse environments, which is of practical relevance to seed companies and agricultural stakeholders as a tool to address existing challenges and guide decision making in developing new varieties.
This strengthens our research’s applied significance in breeding and commercialization strategies. Furthermore, while SSR markers and enzyme-based assays offer high precision and reproducibility, promoting the adoption of technology in the breeding processes in developing countries is essential. Efforts must be made to overcome barriers, such as high implementation costs, limited laboratory infrastructure, and the need for trained personnel, to ensure the broader applicability and sustainability of molecular tools in crop improvement programs. As the first study conducted in Ecuador, this research provides a foundational framework that can support more precise and efficient selection of rice varieties, contributing to developing locally adapted and high-quality germplasm.

5. Conclusions

Ecuadorian rice varieties exhibit minimal differences in cooking qualities, mainly attributable to their intermediate- and low-amylose content. The tested rice varieties displayed significant variability in graded weight, disintegration, sterility percentage, and amylose content percentage, which are all crucial for rice breeding programs.
Phenotypic results can vary drastically due to external factors, making genetic analysis a more reliable approach. The genetic makeup of the varieties remains largely stable, and genetic screening is more consistent and less cumbersome than phenotypic evaluation.
Applying molecular markers to detect the waxy gene alleles further refined the classification and evaluation of rice varieties. Also, using a restriction enzyme digestion protocol to visualize a single-nucleotide polymorphism (SNP) provided a simplified and effective method to classify most rice varieties, further streamlining the detection process. Metaphor® gels allowed for precise visualization of small-sized bands, improving the efficiency of determining the amylose content.
These findings highlight the importance of integrating molecular tools with traditional quality assessments to enhance the efficiency of rice genetic improvement programs.

Author Contributions

Experimental work, data collection, data curation, statistical analysis, writing—original draft preparation, O.N.-P.; conceptualization, formal analysis, investigation, writing, review, and editing—final draft preparation, I.P.-A.; research resources, methodology, R.C.-H. All authors have read and agreed to the published version of the manuscript.

Funding

This research was funded by Ecotec University, Project 2024000004 “Bioversity characterization”, Samborondon, Ecuador.

Data Availability Statement

The data are contained within the article.

Acknowledgments

The authors would like to thank the International Rice Research Institute Genbank (Philippines) for the donation of Lemont, RIA, Pulut Hitam 9, and Mahsuri, as well as to Fundación Danac (Venezuela), who contributed D-Sativa, Cimarrón, Fonaiap 1, Fedearroz 50, and Fedearroz 2000 seeds.

Conflicts of Interest

The authors declare no conflicts of interest.

Abbreviations

The following abbreviations are used in this manuscript:
CVCoefficient of variation
HWHusked weight
PWPolished weight
GWGraded weight
PGLPolished grain length
PGWPolished grain width
%SSterility percentage
WEWater evaporation
CTCooking time
DDisintegration
ACAmylose content
PCAPrincipal component analysis
SDStandard deviation

References

  1. Liu, Q.; Qu, Y.; Liu, J.; Wang, S. Effects of Radio Frequency Heating on Mortality of Lesser Grain Borer, Quality and Storage Stability of Packaged Milled Rice. LWT 2021, 140, 110813. [Google Scholar] [CrossRef]
  2. Ahmad, U.; Alfaro, L.; Yeboah-Awudzi, M.; Kyereh, E.; Dzandu, B.; Bonilla, F.; Chouljenko, A.; Sathivel, S. Influence of Milling Intensity and Storage Temperature on the Quality of Catahoula Rice (Oryza sativa L.). LWT 2017, 75, 386–392. [Google Scholar] [CrossRef]
  3. Cao, Y.; Zhao, J.; Jin, Z.; Tian, Y.; Zhou, X.; Long, J. Improvement of Rice Bran Modified by Extrusion Combined with Ball Milling on the Quality of Steamed Brown Rice Cake. J. Cereal Sci. 2021, 99, 103229. [Google Scholar] [CrossRef]
  4. Maldaner, V.; Coradi, P.C.; Nunes, M.T.; Müller, A.; Carneiro, L.O.; Teodoro, P.E.; Ribeiro Teodoro, L.P.; Bressiani, J.; Anschau, K.F.; Müller, E.I. Effects of Intermittent Drying on Physicochemical and Morphological Quality of Rice and Endosperm of Milled Brown Rice. LWT 2021, 152, 112334. [Google Scholar] [CrossRef]
  5. Alhaj Hamoud, Y.; Shaghaleh, H.; Chang, T.; Zhang, K.; Al-Rejaie, S.S. Physio-Biochemical Responses of Rice to Smart Nitrogen Fertilizer Nano-Hydrogel under Drought Stress and Flooding Alternation: An Eco-Friendly Innovative Approach to Enhance the Grain Quality. S. Afr. J. Bot. 2024, 168, 270–285. [Google Scholar] [CrossRef]
  6. Yi, Z.; Zhuohua, Z.; Likui, F.; Yunjun, Z.; Geng, Z. Impact of Milling on the Sensory Quality and Flavor Profile of an Aromatic Rice Variety Produced in Chongqing. J. Cereal Sci. 2024, 116, 103844. [Google Scholar] [CrossRef]
  7. Ávila, M.; Uribe, J.; Jayaro, Y.; Alezones, J.; Romero, M.; Alejos, Y.; Clisanchez, N.; López, W. Comparación de Variables Físicas, Culinarias y Amilográficas Del cultivar de Arroz (Oryza sativa L.) MD248 Con Dos Cultivares Comerciales de Arroz Venezuela. Rev. Venez. De Cienc. Y Tecnol. de Alimentos 2014, 5, 70–88. [Google Scholar]
  8. Sandhu, R.S.; Singh, N.; Kaler, R.S.S.; Kaur, A.; Shevkani, K. Effect of Degree of Milling on Physicochemical, Structural, Pasting and Cooking Properties of Short and Long Grain Indica Rice Cultivars. Food Chem. 2018, 260, 231–238. [Google Scholar] [CrossRef]
  9. Zhang, W.; Yang, Y.; Zhang, J.; Zheng, W.; Du, Y.; Dang, B. Study of the Effect of Milling on Nutritional and Sensory Quality and Volatile Flavor Compounds of Cooked Highland Barley Rice. LWT 2024, 198, 115972. [Google Scholar] [CrossRef]
  10. Lu, Z.; Fang, Z.; Liu, W.; Lu, D.; Wang, X.; Wang, S.; Xue, J.; He, X. Grain Quality Characteristics Analysis and Application on Breeding of Yuenongsimiao, a High-Yielding and Disease-Resistant Rice Variety. Sci. Rep. 2023, 13. [Google Scholar] [CrossRef]
  11. León, J.L.; Carreres, R. Calidad Del Arroz: Criterios Para Una Adecuada Valoración. Vida Rural 2002, 145, 38–40. [Google Scholar]
  12. Aprilia, S.; Rosnelly, C.M.; Zuhra; Fitriani, F.; Haffiz Akbar, E.; Raqib, M.; Rahmah, K.; Amin, A.; Baity, R.A. Synthesis of Amorphous Silica from Rice Husk Ash Using the Sol–Gel Method: Effect of Alkaline and Alkaline Concentration. Mater. Today Proc. 2023, 87, 225–229. [Google Scholar] [CrossRef]
  13. Ferdous, N.; Elias, S.M.; Howlader, Z.H.; Biswas, S.K.; Rahman, M.S.; Habiba, K.K.; Seraj, Z.I. Profiling Bangladeshi Rice Diversity Based on Grain Size and Amylose Content Using Molecular Markers. Curr. Plant Biol. 2018, 14, 56–65. [Google Scholar] [CrossRef]
  14. Yaling, C.; Yuehan, P.; Jinsong, B. Expression Profiles and Protein Complexes of Starch Biosynthetic Enzymes from White-Core and Waxy Mutants Induced from High Amylose Indica Rice. Rice Sci. 2020, 27, 152–161. [Google Scholar] [CrossRef]
  15. Huang, M.; Xiao, Z.; Hu, L.; Chen, J.; Cao, F. Amylopectin Content Rather than Amylose or Protein Content Is Critical to Determining the Starch Digestion Rate in High-Amylose Rice. Food Chem. Adv. 2024, 5, 100758. [Google Scholar] [CrossRef]
  16. Tamura, M.; Shinohe-Oshima, M.; Saito, T. Performance of Non-Waxy Japonica Rice in the Post-Cooking Storage Process and with a Varying Water-to-Rice Ratio. Appl. Food Res. 2024, 4, 100366. [Google Scholar] [CrossRef]
  17. Cheng, A.; Ismail, I.; Osman, M.; Hashim, H. Simple and Rapid Molecular Techniques for Identification of Amylose Levels in Rice Varieties. Int. J. Mol. Sci. 2012, 13, 6156–6166. [Google Scholar] [CrossRef]
  18. Fu, Y.; Hua, Y.; Luo, T.; Liu, C.; Zhang, B.; Zhang, X.; Liu, Y.; Zhu, Z.; Tao, Y.; Zhu, Z.; et al. Generating Waxy Rice Starch with Target Type of Amylopectin Fine Structure and Gelatinization Temperature by Waxy Gene Editing. Carbohydr. Polym. 2023, 306, 120595. [Google Scholar] [CrossRef]
  19. Arnao, E.; Labrín, N.; Ávila, M.; Sanz, S.; Jayaro, Y.; Graterol, E.; Galindo Castro, I. Validacion de Un Marcador Microsatelite Asociado al Gen Waxy Para La Evaluacion Del Contenido de Amilosa En Accesiones de Un Banco de Germoplasma Venezolano. Interciencia 2012, 37, 684–688. [Google Scholar]
  20. Jeng, T.L.; Wang, C.S.; Tseng, T.H.; Wu, M.T.; Sung, J.M. Nucleotide Polymorphisms in the Waxy Gene of NaN3-Induced Waxy Rice Mutants. J. Cereal Sci. 2009, 49, 112–116. [Google Scholar] [CrossRef]
  21. Xiao-yang, W.; Wen-jie, L.; Dan, C.; Guo-yan, Z.; Juan, D.; Shao-yun, W.; Qing, C. Waxy Allele Diversity in Waxy Maize Landraces of Yunnan Province, China. J. Integr. Agric. 2022, 21, 578–585. [Google Scholar] [CrossRef]
  22. Jannasch, A.; Wang, Y.-J.; Thallapuranam, S.; Alraawi, Z.; McClung, A.M. Elucidating the Effect of Polyphenol-Protein Interactions on Rheological Properties of Purple Waxy Rice. J. Cereal Sci. 2024, 116, 103877. [Google Scholar] [CrossRef]
  23. Nithya, A.; Vishwakarma, S.; Dalbhagat, C.G.; Mishra, H.N. Apparent Amylose Content Positively Influences the Quality of Extruded Fortified Rice Kernels. Carbohydr. Polym. 2024, 338, 122213. [Google Scholar] [CrossRef] [PubMed]
  24. Zhang, C.; Yang, Y.; Chen, S.; Liu, X.; Zhu, J.; Zhou, L.; Lu, Y.; Li, Q.; Fan, X.; Tang, S.; et al. A Rare Waxy Allele Coordinately Improves Rice Eating and Cooking Quality and Grain Transparency. J. Integr. Plant Biol. 2021, 63, 889–901. [Google Scholar] [CrossRef] [PubMed]
  25. Grazina, L.; Costa, J.; Amaral, J.S.; Garino, C.; Arlorio, M.; Mafra, I. Authentication of Carnaroli Rice by HRM Analysis Targeting Nucleotide Polymorphisms in the Alk and Waxy Genes. Food Control 2022, 135, 108829. [Google Scholar] [CrossRef]
  26. Lu, K.; Zhang, Y.; He, L.; Li, C.; Liang, W.; Chen, T.; Zhao, Q.; Zhu, Z.; Zhao, L.; Zhao, C.; et al. Adjusting the Amylose Content of Semi-Glutinous Japonica Rice by Genome Editing of UORF6 in the wx Gene. Crop J. 2024, 12, 1806–1811. [Google Scholar] [CrossRef]
  27. Ayres, N.M.; Mcclung, A.M.; Larkin, P.D.; Bligh, H.F.J.; Jones, C.A.; Park, W.D.; Mcclung, A.M. Microsatellites and a Single-Nucleotide Polymorphism Differentiate Apparent Amylose Classes in an Extended Pedigree of US Rice Germ Plasm; Springer: Berlin/Heidelberg, Germany, 1997; Volume 94. [Google Scholar]
  28. Hammer, D.; Harper, D.; Ryan, P. PAST: Palaeontological Statistics Software Package for Education and Data Analysis. Palaeontol. Electron. 2001, 4, 1–9. [Google Scholar]
  29. Hernández-Rodríguez, A.W.; TrejoMedinilla, F. de M. Estudio Genético Poblacional de Frecuencias Alélicas Para 15 Marcadores STR Presentes En La Población Del Estado de Zacatecas Aplicado a La Práctica Forense. Archivos de Medicina 2014, 10, 1–24. [Google Scholar]
  30. Juliano, B. Structure, Chemistry, and Function of the Rice Grain and Its Fractions. Cereal Foods World 1992, 37, 772–779. [Google Scholar]
  31. Bergman, C.J.; Delgado, J.T.; Mcclung, A.M.; Fjellstrom, R.G. An Improved Method for Using a Microsatellite in the Rice Waxy Gene to Determine Amylose Class. Cereal Chem. 2001, 78, 257–260. [Google Scholar] [CrossRef]
  32. Fashat, P.; Rahman, S.; Ratnam, W. Genetic Controls on Starch Amylose Content in Wheat and Rice Grains. J. Genet. 2014, 93, 279–292. [Google Scholar] [CrossRef]
  33. Rivero Meza, S.L.; Cañizares, L.; Dannenberg, B.; Peres, B.B.; Rodrigues, L.A.; Mardade, C.; de Leon, M.A.; Gaioso, C.A.; Egea, I.; de Oliveira, M. Sustainable Rice Bran Protein: Composition, Extraction, Quality Properties and Applications. Trends Food Sci. Technol. 2024, 145, 104355. [Google Scholar] [CrossRef]
  34. Ilarraza, D. Efectos Del Genotipo y Tiempos de Almacenamiento Sobre La Calidad Culinaria de Líneas Experimentales de Arroz (Oryza sativa L.); Trabajo de Grado de Pregrado, Universidad Central de Venezuela: Maracay, Venezuela, 2002. [Google Scholar]
  35. Kaminski, T.A.; Brackmann, A.; da Silva, L.P.; Nicoletti, A.M.; Roberto, B.S. Changes in Culinary, Viscoamylographic and Sensory Characteristics during Rice Storage at Different Temperatures. J. Stored Prod. Res. 2013, 53, 37–42. [Google Scholar] [CrossRef]
  36. Li, H.; Xu, M.; Chen, Z.; Li, J.; Wen, Y.; Liu, Y.; Wang, J. Effects of the Degree of Milling on Starch Leaching Characteristics and Its Relation to Rice Stickiness. J. Cereal Sci. 2021, 98, 103163. [Google Scholar] [CrossRef]
  37. Zhao, S.; Shi, J.; Cai, S.; Xiong, T.; Cai, F.; Li, S.; Chen, X.; Fan, C.; Mei, X.; Sui, Y. Effects of Milling Degree on Nutritional, Sensory, Gelatinization and Taste Quality of Different Rice Varieties. LWT 2023, 186, 115244. [Google Scholar] [CrossRef]
  38. Naik, M.V.K.; Pillai, M.A.; Saravanan, S. Assessment of Physicochemical Properties and Cooking Quality of Promising Rice Varieties. Int. J. Bio-Resour. Stress. Manag. 2023, 14, 353–361. [Google Scholar] [CrossRef]
  39. Fresther, R. Efectos Del Genotipo y Tiempo de Almacenamiento Sobre La Calidad Culinaria de Variedades Comerciales de Arroz (Oryza sativa L.); Tesis de grado, Universidad Central de Venezuela: Caracas, Venezuela, 2002. [Google Scholar]
  40. Han, Y.; Xu, M.; Liu, X.; Yan, C.; Korban, S.S.; Chen, X.; Gu, M. Genes Coding for Starch Branching Enzymes Are Major Contributors to Starch Viscosity Characteristics in Waxy Rice (Oryza sativa L.). Plant Sci. 2004, 166, 357–364. [Google Scholar] [CrossRef]
  41. Ong, Y.; Ngu, M.S.; Parviz, F.; Tilakavati, K.; Wickneswari, R. 1 Study on Waxy Gene Polymorphism and Amylose Content of Breeding Lines Derived from Oryza Rufipogon x Oryza sativa CV. MR219. Trop. Agric. Sci. 2012, 35, 845–854. [Google Scholar]
  42. Celi Herán, R.E. Variedad INIAP-Élite. 2020. Available online: https://repositorio.iniap.gob.ec/handle/41000/5764 (accessed on 20 April 2025).
  43. Celi Herán, R.E. Variedad INIAP-Impacto. 2020. Available online: https://repositorio.iniap.gob.ec/bitstream/41000/5763/5/VARIEDAD%20IMPACTO.pdf (accessed on 20 April 2025).
Figure 1. The general appearance and reference size of the rice varieties used in this research.
Ijpb 16 00052 g001
Figure 2. The principal components and biplots of the quantitative variables of the ten rice (Oryza sativa L.) varieties studied.
Ijpb 16 00052 g002
Figure 3. MetaPhor® 4% gel showing the different alleles amplified by the microsatellite marker at 70 V for 2 h and 30 min: (a) Marker 484-485 associated with the waxy gene. Lane assignments: 1, GO-04209; 2, GO-04304; 3, GO-04361; 4, GO-04429; 5, Arenillas; 6, Cristalino; 7, Elite; 8, Hangang-Chal; 9, Impacto; 10, SFL-011; 11, Cimarrón; 12, Fonaiap 1; 13, Fedearroz 50; 14, Fedearroz 2000; 15, D-Sativa; 16, Lemont; 17, Mahsuri; 18, Pulut Hitam 9; and 19, RIA. Ladder: Gene ruler 25 bp. (b) 484-W2R associated with the waxy gene. Lane assignments: 1, GO-04209; 2, GO-04304; 3, GO-04361; 4, GO-04429; 5, Arenillas; 6, Cristalino; 7, Elite; 8, Hangang-Chal; 9, Impacto; 10, SFL-011; 11, Cimarrón; 12, Fonaiap 1; 13, Fedearroz 50; 14, Fedearroz 2000; 15, D-Sativa; 16, Lemont; 17, Mahsuri; 18, Pulut Hitam 9; and 19, RIA. Ladder: Gene ruler 25 bp.
Ijpb 16 00052 g003
Figure 4. The amplification products 484-W2R of the screened varieties: (a) Lanes 1–6 before and after digestion by AccI restriction enzyme (PCR-AccI). (a) Undigested amplicon. (b) PCR product digested by AccI. Size marker Gene ruler 25 bp (L); (1) GO-04209; (2) GO-04304; (3) GO-04361; (4) GO-04429; (5) Arenillas; and (6) Cristalino. (b) Lanes 7–12 before and after digestion by the AccI restriction enzyme (PCR-AccI). Gene ruler 25 bp (L). (7) Élite; (8) Hangang-Chal; (9) Impacto; (10) SFL-011; (11) Cimarrón; and (12) Fonaiap 1. (c) Lanes 13–19 before and after digestion by the AccI restriction enzyme (PCR-AccI). (a) Undigested PCR product. (b) PCR product after digestion with AccI. Gene ruler 25 bp (L). (13) Fedearroz 50; (14) Fedearroz 2000; (15) D-Sativa; (16) Lemont; (17) Mahsuri; (18) Pulut Hitam 9; and (19) Ria.
Ijpb 16 00052 g004
Table 1. Descriptive statistics for the ten quantitative characteristics of the ten rice (Oryza sativa L.) varieties.
VariableMeanMinimumMaximumS.D.%C.V.
HW79.3878.0081.000.811.02
PW72.4370.0076.001.221.68
GW59.7849.0072.007.0311.75
PGL7.195.908.180.567.84
PGW2.081.782.570.199.05
%S11.883.0034.008.4671.26
WE30.7127.2834.311.976.43
CT15.0713.0017.241.5610.36
D59.402.00310.0089.01149.84
AC19.8216.4026.502.6313.28
The husked weight (HW), polished weight (PW), graded weight (GW), polished grain length (PGL), polished grain width (PGW), sterility percentage (%S), water evaporation (WE), cooking time (CT), disintegration (D), amylose content percentage (AC), standard deviation (S.D.), and coefficient of variation (C.V.).
Table 2. Matrix of the Pearson’s correlation coefficients (r) between the ten quantitative variables of the ten rice varieties (Oryza sativa L.).
HWPWGWPGLPGW%SWECTDAC
HW1
PW0.94 **1
GW−0.070.021
PGL0.06−0.200.031
PGW−0.22−0.05−0.17−0.87 **1
%S0.250.43−0.21−0.75 **0.69 *1
WE0.190.23−0.14−0.65 *0.570.421
CT0.100.10−0.02−0.560.490.330.90 **1
D−0.50−0.34−0.32−0.250.23−0.03−0.25−0.261
AC−0.51−0.430.170.21−0.25−0.02−0.58 *−0.460.121
Probability significance levels at 0.05 (*) and 0.01 (**). The husked weight (HW), polished weight (PW), graded weight (GW), polished grain length (PGL), polished grain width (PGW), sterility percentage (%S), water evaporation (WE), cooking time (CT), disintegration (D), and amylose content percentage (AC).
Table 3. Principal component analysis (PCA) for the quantitative variables of the ten rice (Oryza sativa L.) varieties studied.
NumberOwn Value% VariationCumulative Percentage
13.8838.8338.83
22.9229.1667.98
31.2912.9480.92
40.959.4790.39
50.565.5695.95
60.303.0398.98
Table 4. Average values of the morphological, milling, and culinary quality variables* of the ten rice varieties (Oryza sativa L.) used in the biplot analysis.
Rice VarietiesGW%SDAC%Amylose Class
GO-0420971.255.2517.2517.30Low
GO-0430456.505.7545.7516.40Low
GO-0436151.256.7520.5020.50Low 1/Intermediate 2
GO-0442964.756.5058.0020.08Low 1/Intermediate 2
Arenillas61.5027.505.0019.50Low
Cristalino50.0010.00238.7520.08Low 1/Intermediate 2
Elite61.257.5020.5018.03Low
Hangang-Chal62.0020.75142.7520.60Low 1/Intermediate 2
Impacto67.505.7539.5026.50High
SFL-01151.7523.006.0019.30Low
* The graded weight (GW), sterility percentage (%S), disintegration (D), and amylose content percentage (AC%) (1 Juliano, 1985; 2 Bergman et al., 2001 [30,31]).
Table 5. Allelic frequencies observed in 19 rice (Oryza sativa L.) varieties.
SSRRange (bp)AnFrequency of the Minor AlleleFrequency of the Major Allele
484-485114-15490.050.21
484-W2R161-17450.050.32
Base pair (bp). Allele number (An).
Table 6. Analysis of variance for the rice (Oryza sativa L.) grain amylose content (AC) and molecular marker 484-485 alleles.
Source of VariationDfMean Square
Alleles SSR 484-485861.28 **
Error107.98
Total18
R2 = 0.86C.V. = 9.13
Statistically high significant differences (**); probability value (p ≤ 0.01); and percent coefficient of variation (C.V.).
Table 7. The analysis of variance for the rice (Oryza sativa L.) grain amylose content (AC) and molecular marker 484-W2R alleles.
Source of VariationDfMean Square
Alleles SSR 484-W2R438.17 ns
Error1429.81
Total18
R2 = 0.27C.V. = 21.83
No significance (ns); probability value (p ≤ 0.01); and percent coefficient of variation (C.V.).
Table 8. The genotype profile information for the amylose content of the 19 rice (Oryza sativa L.) varieties screened with the molecular marker 484-485 and PCR-AccI assay.
ACAllelebpnVarietiesAmylose ClassG-T *
1.80 a61221Pulut Hitam 9Waxy 1T
16.40 b21481GO-04304LowT
17.27 bc81182Fedearroz 2000, D-SativaIntermediate 2G
18.60 bc41543GO-04209, GO-04361, EliteIntermediateG
19.33 bc51344Arenillas, Cristalino, SFL-011, LemontIntermediate 2,3G
20.10 bc11541GO-04429IntermediateG
21.02 bc71102Cimarrón, Fedearroz 50IntermediateG
23.55 c31422Hangang-Chal, ImpactoIntermediateT
23.64 c91143Fonaiap 1, Mahsuri, RiaHigh 1,2G
The mean values of the percentage of the amylose content (AC) in the Tukey’s mean comparison test. Base pairs (bp). Number of individuals or rice varieties (n). Different letters indicate significant differences at p ≤ 0.05. Amylose class following 1 Cheng et al. (2012), 2 Arnao et al. (2012), and 3 Ayres (1997) [17,19,27]. * G or T SNP presence.
Disclaimer/Publisher’s Note: The statements, opinions and data contained in all publications are solely those of the individual author(s) and contributor(s) and not of MDPI and/or the editor(s). MDPI and/or the editor(s) disclaim responsibility for any injury to people or property resulting from any ideas, methods, instructions or products referred to in the content.

