Article

Real-Time Partitioning of Diurnal Stem CO2 Efflux into Local Stem Respiration and Xylem Transport Processes

1
Lawrence Berkeley National Laboratory, 1 Cyclotron Road, Berkeley, CA 94720, USA
2
Forest Management Laboratory, National Institute of Amazonian Research (INPA), Av. Andre Araújo, Manaus 69060-082, AM, Brazil
3
Department of Geography, University of California—Berkeley (UCB), 507 McCone Hall #4740, Berkeley, CA 94720, USA
4
Oak Ridge National Laboratory, Climate Change Science Institute and Environmental Sciences Division, Oak Ridge, TN 37831, USA
5
Pacific Northwest National Laboratory, Atmospheric Sciences and Global Change Division, Richland, WA 99354, USA
6
School of Biological Sciences, Washington State University, Pullman, WA 99163, USA
7
Research School of Biology, Division of Plant Sciences, Australian National University, Canberra, ACT 2601, Australia
8
Institut de Recherche en Horticulture et Semences, INRAE, Université d’Angers, 49070 Beaucouzé, France
*
Author to whom correspondence should be addressed.
Int. J. Plant Biol. 2025, 16(2), 46; https://doi.org/10.3390/ijpb16020046
Submission received: 25 March 2025 / Revised: 20 April 2025 / Accepted: 24 April 2025 / Published: 30 April 2025
(This article belongs to the Section Plant Physiology)

Abstract

:
The apparent respiratory quotient (ARQ) of tree stems, defined as the ratio of net stem CO2 efflux (ES_CO2) to net stem O2 influx (ES_O2), offers insights into the balance between local respiratory CO2 production and CO2 transported via the xylem. Traditional static chamber methods for measuring ARQ can introduce artifacts and obscure natural diurnal variations. Here, we employed an open flow-through stem chamber with ambient air coupled with cavity ring-down spectrometry, which uses the molecular properties of CO2 and O2 molecules to continuously measure ES_CO2, ES_O2, and ARQ, at the base of a California cherry tree (Prunus ilicifolia) during the 2024 growing season. Measurements across three stem chambers over 3–11-day periods revealed strong correlations between ES_CO2 and ES_O2 and mean ARQ values ranging from 1.3 to 2.9, far exceeding previous reports. Two distinct diurnal ARQ patterns were observed: daytime suppression with nighttime recovery, and a morning peak followed by gradual decline. Partitioning ES_CO2 into local respiration and xylem-transported CO2 indicated that the latter can dominate when ARQ exceeds 2.0. Furthermore, transported CO2 exhibited a higher temperature sensitivity than local respiration, with both processes showing declining temperature sensitivity above 20 °C. These findings underscore the need to differentiate stem CO2 flux components to improve our understanding of whole-tree carbon cycling.

1. Introduction

A large but highly uncertain fraction of carbon assimilated by photosynthesis is returned to the atmosphere as CO2 during aerobic respiration in plant tissues [1], with estimates suggesting up to 70% in tropical forests [2]. Stem respiration contributes approximately a quarter of the global above-ground auto-trophic respiration, with an estimated annual emission of around 11.20 ± 5.88 Pg C, comparable to total anthropogenic emissions [3]. In trees, respiratory CO2 produced in stem tissues during maintenance and growth processes can be emitted directly to the atmosphere via radial diffusion, measured as net stem CO2 efflux (ES_CO2, µmol m−2 s−1) [4,5,6,7,8,9,10,11]. However, field observations of diurnal ES_CO2 dynamics remain scarce due to the lack of open-flow chamber systems, with most studies relying on static chambers that recirculate air in a closed loop and estimate fluxes from accumulation rates [12]. These static systems often create artificial gas gradients, suffer from condensation and leakage, and can underestimate fluxes, obscuring natural diel variation [13,14]. This stands in contrast to common practice in leaf respiration studies, where open-flow systems continuously refresh headspace air, enabling real-time measurements. The absence of such capabilities for stems has limited our ability to assess how stem respiration responds to environmental and physiological drivers.
Beyond radial emission, respiratory CO2 from stem tissues may also be transported upward in the transpiration stream due to its solubility, forming water-soluble carbon species (H2CO3, HCO3, CO32−) in dynamic equilibrium. Stable isotope studies have shown that transported CO2 can be re-assimilated by leaves, potentially mitigating photosynthetic limitation under high temperature and transpiration [15,16,17,18,19,20,21,22,23,24,25,26,27]. For instance, one study found that up to 17% of 13CO2 infused into tree stems was re-assimilated, with the remainder emitted via ES_CO2 [16]. Although the magnitude of this recycling effect is still debated, internal transport of CO2 from roots, stems, and soils to the canopy may influence stem CO2 efflux and contribute to the whole-tree carbon balance [17,18]. When stem ES_CO2 was partitioned in Pinus sylvestris, the authors found that transport-related fluxes accounted for up to 40% of the total stem CO2 efflux during the peak growing season [28]. They employed a combination of stem chamber measurements, sap flow monitoring, and modeling to distinguish between locally respired CO2, bark photosynthesis, and CO2 transported via the xylem. Models like TreSpire attempt to simulate these interactions, but field validation remains limited [29,30].
A promising method to separate local respiration from transported CO2 is by quantifying the apparent respiratory quotient (ARQ), defined as the ratio of net CO2 efflux to net O2 influx (ARQ = ES_CO2/ES_O2). This ratio provides insights into respiratory substrate use, CO2 re-assimilation, and transport processes [27]. In principle, complete oxidation of non-structural carbohydrates yields an RQ of 1.0, meaning one molecule of CO2 is released per molecule of O2 consumed [31]. Thus, ARQ values greater than 1.0 imply that CO2 efflux exceeds local respiratory production—likely due to additional transported CO2—while values below 1.0 suggest that CO2 is either retained within tissues, re-assimilated, or transported away (Figure 1).
Most previous ARQ studies using static chambers have reported values below 1.0, across diverse ecosystems including Mediterranean, tropical, and temperate forests (see Table 1) [28,32,33,34,35,36,37,38,39,40,41,42,43,44]. These findings support the idea that local stem-respired CO2 may be derive from substrates with low cellular respiratory quotients (RQs) such as organic acids (RQ 0.7–0.9) and lipids (RQ ∼0.7), transported away in the transpiration stream, or refixed before emission. Proposed mechanisms include carboxylation by phosphoenolpyruvate carboxylase (PEPC), which fixes bicarbonate into C4 acids like oxaloacetate or malate [45,46]. Although the extent of refixation in woody stems remains uncertain, these processes may contribute to low ARQ values in non-photosynthetic tissues. In green stems, additional light-dependent re-assimilation via RuBisCO has also been proposed [47,48,49].
Compounding these biological explanations, technical limitations of static chambers likely exacerbate underestimations of ARQ. Sealed environments quickly develop CO2 concentration gradients, reduce diffusion rates, and often produce ARQ values 20–40% lower than true cellular RQ [50]. For example, ARQ values from static chambers decreased markedly with elevated CO2 levels, from ∼1.0 at 300 ppm to <0.1 at 2000 ppm [43,44]. Similar findings in soil respiration studies confirm that dynamic open-flow chambers, which maintain ambient-like conditions, often yield higher and more accurate CO2 efflux rates than static counterparts [51].
To address these challenges, we developed an open flow-through stem chamber system using ambient air and high-precision cavity ring-down spectroscopy (CRDS) for CO2 and O2 detection. This system enables continuous, real-time measurements of ES_CO2, ES_O2, and ARQ under field conditions with minimal disturbance to natural gas gradients. In this study, we deployed this system on a California cherry tree (Prunus ilicifolia), quantifying the diurnal dynamics and temperature sensitivities of stem CO2 efflux, O2 influx, and ARQ. By assuming a cellular RQ of 1.0, we partitioned ES_CO2 into contributions from local respiration and transported CO2, providing a methodological framework for dissecting the drivers of stem CO2 fluxes and their implications for carbon cycling in trees.
Table 1. Summary of stem respiratory quotient (RQ) measurements reported in the literature using static enclosed stem chambers under field conditions, compared to the current study on diurnal RQ observations obtained using an open flow-through stem chamber system with ambient air as the reference.
ReferenceMethod UsedField/Lab, Intact/CutRange of ARQ ValuesSpeciesEcosystemDiurnal Patterns?
Smart, 2004 [27]Sealed static chamberCut branches vs. [CO2]Branch: 0.088–0.99Vitis rupestris × V. riparia cv. 3309 CoudercCultivated vineyardsNo
Hilman et al., 2019 [17]Sealed static chamberIntact stems in the fieldStem: 0.23–0.90Pinus halepensis, Quercus calliprinosMediterraneanNo
Helm et al., 2023 [18]Sealed static chamberIntact stems in the fieldStem: 0.7European beech (Fagus sylvatica)TemperateNo
Helm et al., 2023 [52]Sealed static chamberIntact stems in the fieldStem: 0.7- 1.0Populus tremula hybridsTemperateNo
Hilman et al., 2022 [21]Sealed static chamberStem coresStem: Cores: 0.19–0.70Quercus calliprinosMediterraneanNo
Hilman et al., 2019 [22]Sealed static chamberIntact stemsStem: 0.39–0.78Cedrela odorata, Swietenia macrophylla, Quercus ilex, Pinus halepensis.Tropical, temperate, MediterraneanNo
Hilman and Angert, 2016 [23]Sealed static chamberIntact stemsStem: 0.23–0.90Quercus calliprinos, Pinus halepensis, Tetragastris panamensis (Engl.) KuntzeMediterraneanNo
Patterson et al., 2018 [25]Sealed static chamberIntact stems in the fieldStem: 0.7–1.316 co-occurring temperate tree species, conifers and broadleafTemperateNo
Angert and Sherer, 2011 [38]Sealed static chamberIntact stems in the fieldStem: 0.61–0.84Malus domestica, Pinus pinea L., Pinus halepensis Mill.MediterraneanNo
Angert et al., 2012 [24]Sealed static chamberIntact stems in the fieldStem: 0.48–0.84Hymenaea courbaril, Bertholletia excelsa, Cedrela odorata, Swietenia macrophyllaTropicalNo
Current studyOpen flow chamberIntact stems in the fieldStem: 0.9–2.9Prunus ilicifoliaTemperateYes

2. Materials and Methods

This study was conducted on a California cherry tree (Prunus ilicifolia) located in Berkeley, CA, USA, during the 2024 growing season. The tree was growing approximately 1 m from the analytical laboratory building and accessed via ¼″ Bev-a-line tubing extended out of the laboratory window to reach the base of the tree. During the first experiment, three stem chambers were installed at heights between 0.5 and 1.5 m on the stem with gas exchange measured in parallel. Two additional replicates using a chamber installed at a single location on the stem (0.5–1.5 m height) were also conducted. Continuous stem gas exchange measurements were conducted in three different periods over the summer, lasting 3–9 days, to capture diurnal and weekly patterns (29 June–1 July 2024, 13–19 August 2024, 22–30 August 2024). Air temperature was measured continuously at 1.5 m height near the tree using an Onset Mx100 (HOBO) (https://www.onsetcomp.com/, Cooperation: Onset, Bourne, MA, USA).
Following a light cleaning of the stem surface to remove debris, a 3D-printed opaque stem chamber (∼300 mL internal volume) was secured to the stem using two nylon straps [45]. After installation, a small sheet of reflective insulation was placed over the chamber and secured with two large zip ties to prevent artificial heating by sunlight. An ambient air reservoir (4 L) filled with small packs of silica gel to remove humidity was used to dampen rapid variations in CO2 and O2 concentrations and supplied ambient air via ¼″ Bev-a-line tubing to both the stem chamber inlets and ambient air inlets on a continuous air flow controller array. The outlets of the three stem chambers were also connected to the air flow controller array. The continuous flow system comprised six mass-flow controllers (FMA-A2103, 0–100 mL min−1, Omega Engineering, Norwalk, CT, USA), a small vacuum pump, and a 6-port continuous-flow selector valve (EUTB-VLSF6MWE2, Valco-Vici, Houston, TX, USA). This system maintained a constant air flow of 100 mL min−1 through three ambient air sample lines and three stem chambers, independent of the specific air sample being measured by the CRDS analyzers (Figure 2). The output of the continuous-flow valve was connected to two cavity ring-down spectrometers (CRDSs) and cycled between ambient air (10 min) and stem air (10 min). When analyzing three stem chambers sequentially, the valve cycle proceeded as follows: ambient air → stem air 1 → ambient air → stem air 2 → ambient air → stem air 3, completing one full measurement cycle every hour. This setup ensured continuous buffered ambient air flow through both the ambient reference and stem air sample gas lines.
Sample air on the output side of the gas selector valve was diverted to two CRDS systems including an O2 and isotopic 18O2 CRDS (G2207-i, Picarro Inc., Santa Clara, CA, USA) and isotopic 12CO2 and 13CO2 (G2101-i) at a total flow of 100 mL min−1. The O2 CRDS was placed in the high-precision O2 concentration mode (instead of 18O isotope mode). Given the high sensitivity of ARQ to errors in either ES_CO2 or ES_O2 fluxes [16], calibration of both sensors was performed over the range of O2 and CO2 concentrations encountered in the dynamic stem chambers using the dilution method using two high-precision mass-flow controllers with low (0–10 mL min−1) and high (0–1000 mL min−1) flow ranges. For O2 calibration, a high-purity air cylinder (21% or 210,000 ppm O2, UHP 5.0, Linde Gas) flowing at 1000 mL min−1 was diluted with 0.0–10.0 mL min−1 of high-purity nitrogen (N2) to generate the following O2 concentrations (210,000, 209,790, 209,581, 209,372, 209,163, 208,955, 208,748, 208,540, 208,333, 208,126, and 207,920 ppm O2). 12CO2 measurements were calibrated by dynamic dilution of pure CO2 gas standard (0–10 mL min−1) with ultra-high-purity CO2-free air flowing at 1000 mL min−1 to generate CO2 concentrations of 0, 999, 1996, 2991, 3984, 4975, and 5964 ppm. Linear regression slopes of actual CO2 and O2 concentrations generated by dynamic dilution were plotted versus CRDS reported concentrations for CO2 (Cal_CO2 = 0.89447) and O2 (Cal_O2 = 1.0442).
For each measurement period of ambient and stem chamber air, the last three minutes of O2 and CO2 concentrations were averaged and the difference between ambient and stem concentrations was calculated, with calibration corrections, to estimate net stem CO2 efflux (ES_CO2, µmol m−2 s−1), O2 influx (ES_O2, µmol m−2 s−1), and the apparent respiratory quotient (ARQ) using the following equations, where F is the ambient air flow rate (100 mL min−1 or 0.00167 L s−1), ΔCO2 and ΔO2 are the concentration differences between the stem chamber and ambient air for each measurement period (1 ppm = 1 µL/L), 1 µmole/22.4 µL is a conversion factor based on the ideal gas law used to convert the volume (µL) to moles, and Astem is the enclosed stem surface area (15.3 cm × 6.5 cm or 0.0099 m2). Note that no flow correction for humidity was performed due to the use of dried ambient air.
ES_CO2 = F × ΔCO2 × Cal_CO2 × (1 µmole/22.4 µL)/Astem
ES_O2 = F × ΔO2 × Cal_O2 × (1 µmole/22.4 µL)/Astem
ARQ = ES_CO2/ES_O2
Assuming a cellular RQ of 1.0 for complete oxidation of non-structural carbohydrates during aerobic mitochondrial respiration, ES_CO2 was partitioned into contributions from local respiratory production and transported CO2 using the relationships in Equations (4) and (5).
ES_CO2 = ES_CO2_local + ES_CO2_transport
ES_CO2_local = −ES_O2
Diurnal patterns and temperature sensitivities of stem gas exchange variables were evaluated using time-series plots. Linear statistical analyses were performed to assess correlations between ES_CO2 and ES_O2, allowing the determination of average stem ARQ values during each measurement period.

3. Results

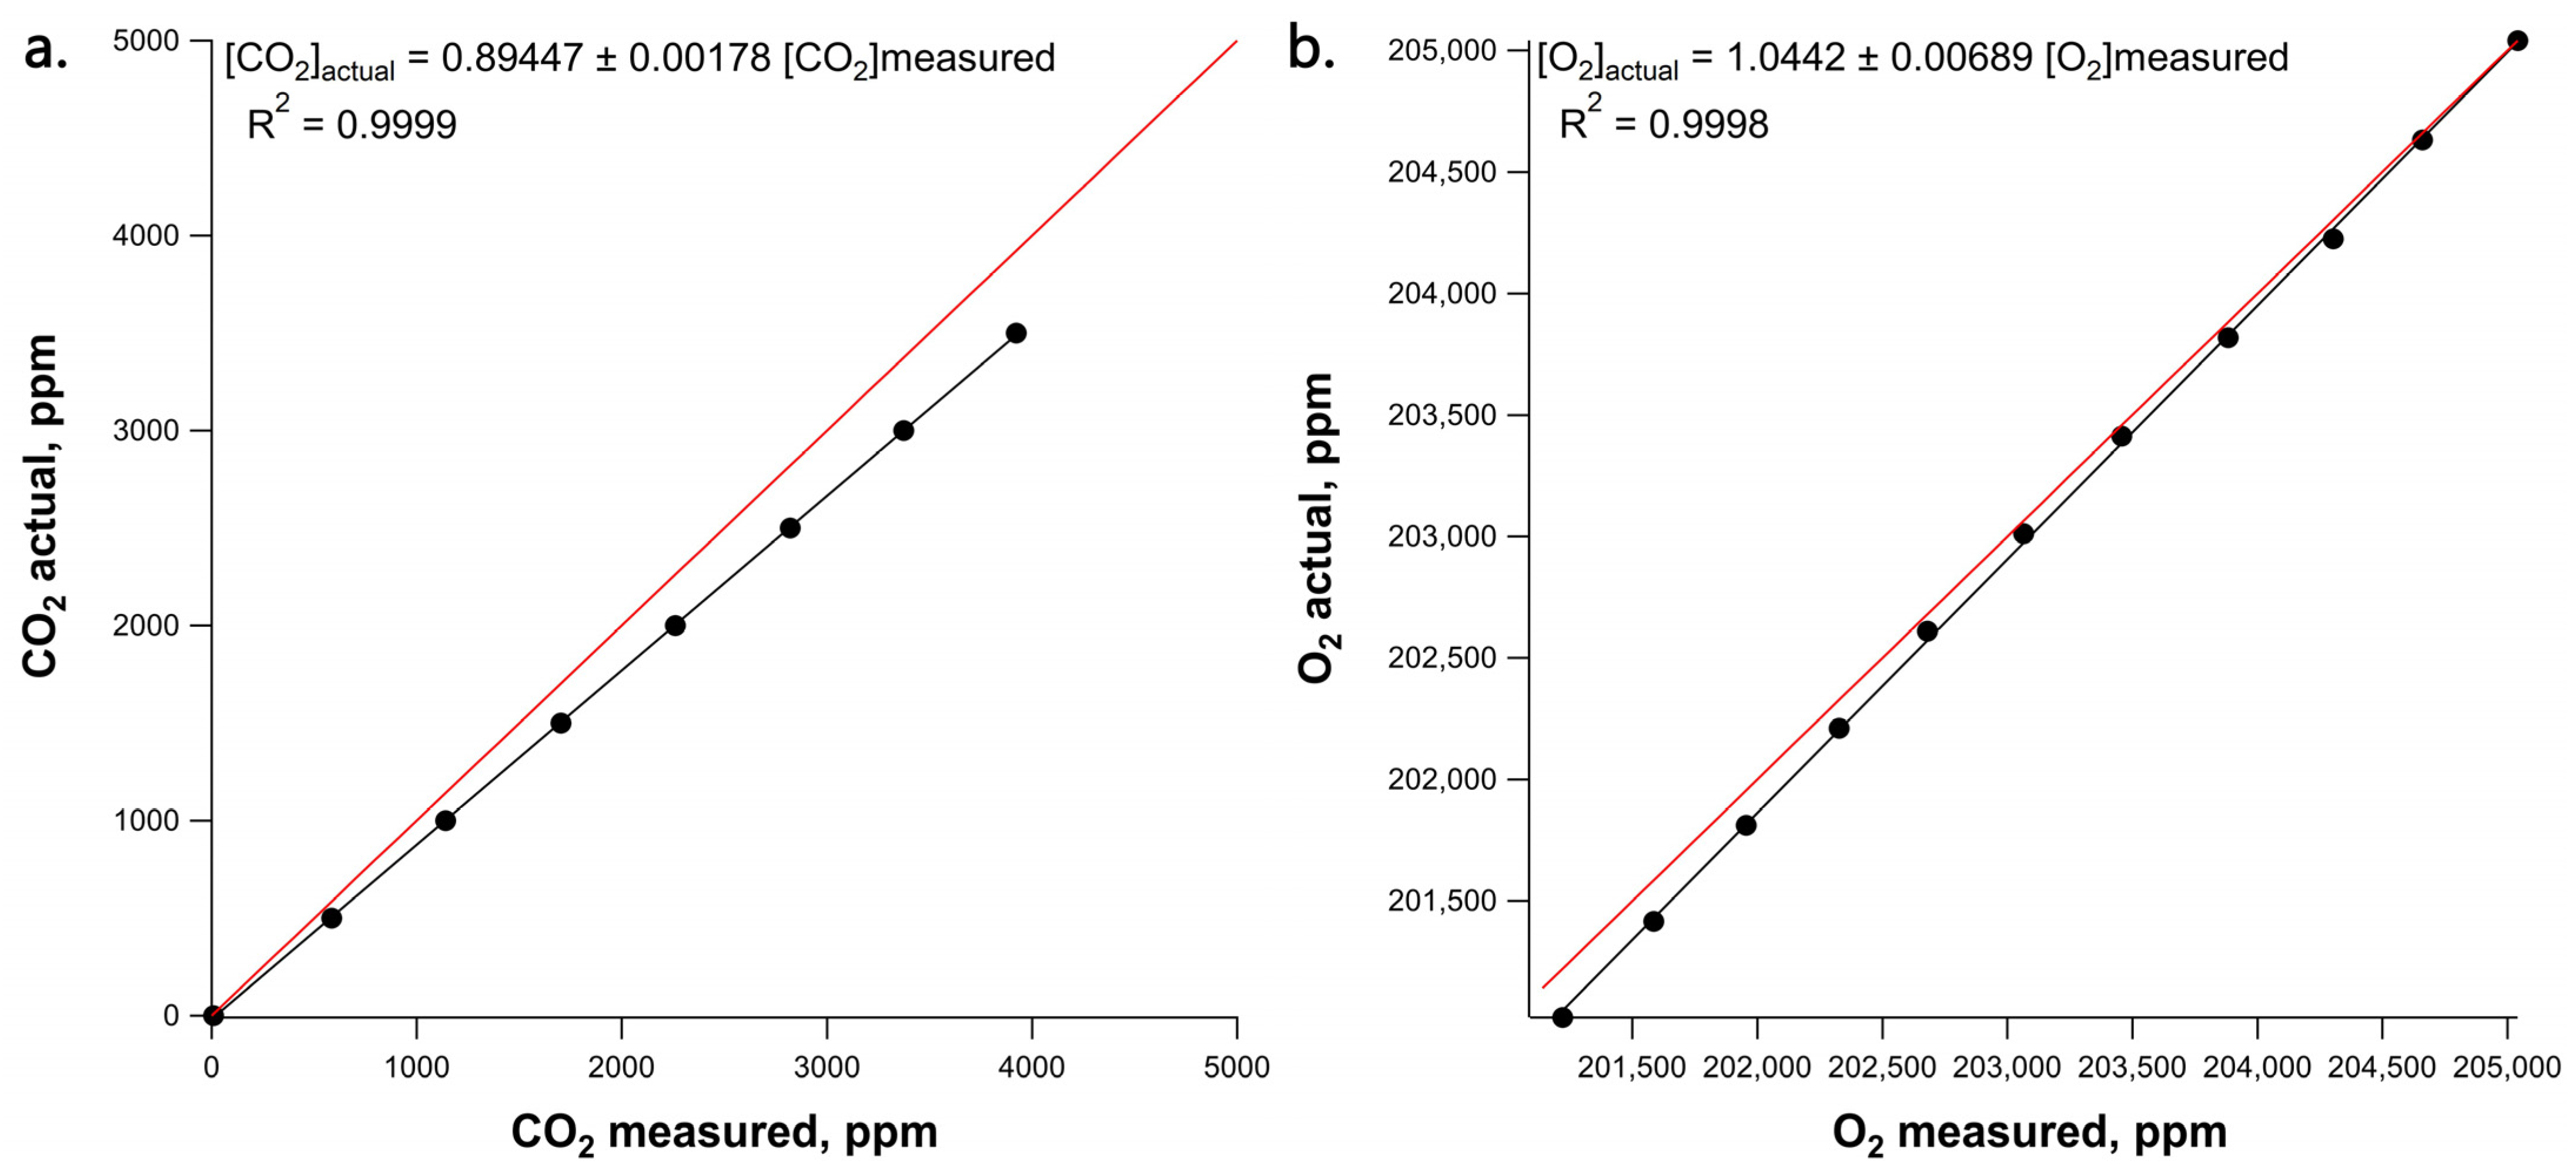
3.1. Calibration of CO2 and O2 CRDS Sensors

The calibration of the CO2 and O2 cavity ring-down spectroscopy (CRDS) sensors demonstrated high linearity and precision. Figure 3a shows the relationship between actual and measured CO2 concentrations. For CO2, the linear regression analysis yielded a calibration slope (CO2_actual/CO2_measured) of 0.89447 ± 0.00178, with an R2 value of 0.9999 across the range (0–5000 ppm). Similarly, the O2 calibration (Figure 3b) also exhibited strong linearity, with a calibration slope (O2_actual/O2_measured) of 1.0442 ± 0.00689, and with an R2 value of 0.9998, across the range (201,021–205,041 ppm O2 or 20.1–20.5%). These results confirm that the CRDS sensors provide accurate and reliable measurements of CO2 and O2 concentration differences between ambient air and stem air, supporting their use in continuous gas exchange monitoring in stem respiration studies.

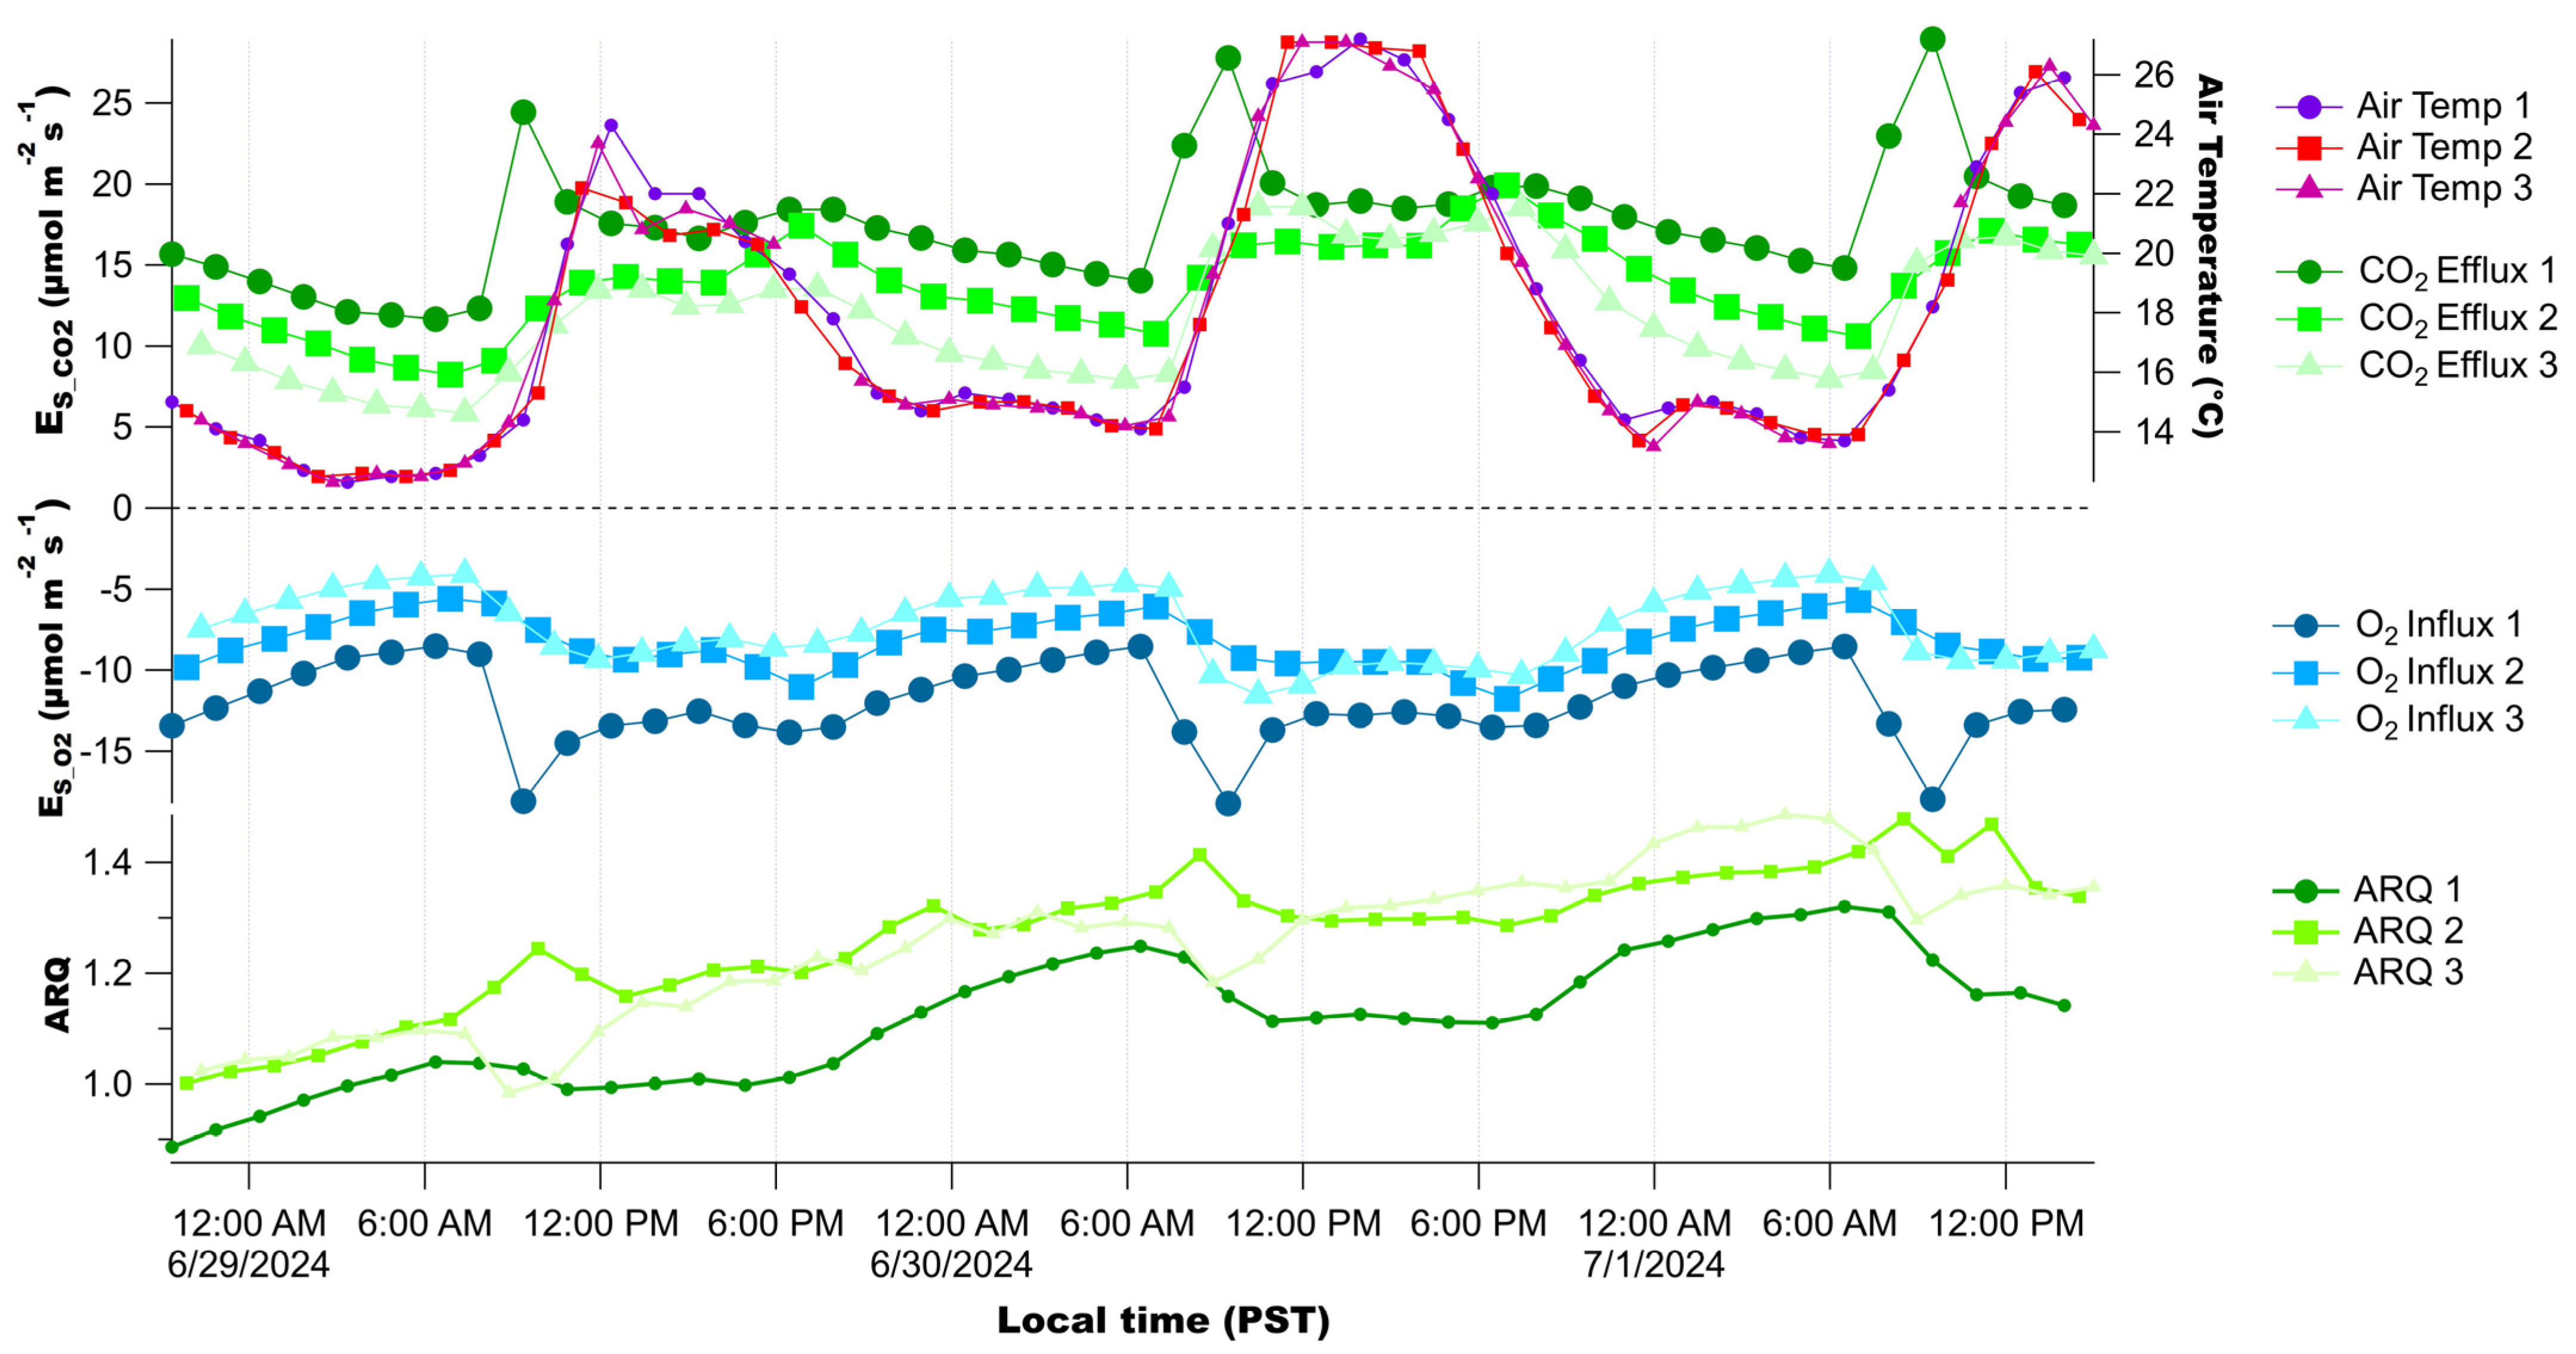
3.2. Diurnal Patterns of Raw Stem CO2 and O2 Concentrations

Figure 4 illustrates raw CO2 and O2 gas concentrations (ppm) of ambient air and stem air exiting three open path flow-through stem chambers installed on the cherry tree outside the analytical laboratory during a continuous 3-day measurement period from 28 June to 1 July 2024. As expected from active aerobic stem respiration in local stem tissues, ambient O2 concentrations (indicated by the arrow on the top right) were higher in the ambient air (inlet) compared with all three stem chambers (outlet), with a maximum concentration difference of approximately 2430 ppm observed during the measurement period. In contrast, ambient CO2 concentrations (indicated by the arrow on the bottom left) were lower than the air exiting all three stem chambers, with a maximum concentration difference of 4405 ppm. This observation suggests that more CO2 is emitted than O2 consumed within the stem chambers.
Figure 5 illustrates the diurnal patterns of stem CO2 efflux (ES_CO2), O2 influx (ES_O2), and ARQ calculated from the raw data across three stem chambers during the continuous 3-day period. Stem ES_CO2 effluxes and ES_O2 influxes exhibited clear diurnal cycles, with minimum values occurring in the early morning at around 7:00 when air temperature was the lowest. This was followed by an increase in these fluxes as temperature warmed in the early morning. Stem chamber 1 fluxes showed dramatic increases in both ES_CO2 and ES_O2 fluxes, with a peak between 9:00 and 10:00. ES_CO2 and ES_O2 fluxes generally stabilized or were slightly suppressed by noon, followed by a slight increase again as temperatures began to cool in the early evening, reaching a maximum around 19:00. ARQ values also showed distinct diurnal patterns, with a range between 0.9 and 1.5, and showed a general increase in all three stem chambers over the 2.5-day experiment. All three stem chambers tended to display elevated ARQ values at night, often reaching a maximum at 7:00 A.M, when air temperatures reached a minimum. ARQ values declined slightly during the daytime (Figure 5), potentially related to a differential effect of temperature, diurnal cycles of photosynthesis and transpiration, and metabolism of respiratory substrates (via phloem loading and transport) on CO2 and O2 fluxes.
Regression analysis of ES_CO2 versus ES_O2 flux data over the 3-day experiment was performed, revealing strong linear relationships for all three stem chambers (Figure 6). Average ARQ values obtained from the linear regression were 1.3, 1.6, and 1.7, and therefore remained well above 1.0 on average. When ES_CO2 was partitioned into ES_CO2_local and ES_CO2_transport (Figure 7), clear differences could be found for local versus transported respiratory CO2 and their influences on net CO2 efflux. While the contribution of local sources of stem respiration to stem ES_CO2 remained higher than transported sources of CO2, the magnitude of ES_CO2_transport in all three stem chambers showed an increase over the 3-day experiment, possible due to the trend of increasing temperatures. When the temperature sensitivity of ES_CO2_local was evaluated via regression with air temperature (Figure 7d), an exponential pattern was not observed, as expected from a Q10 model (see Section 4). Instead, the temperature sensitivity of ES_CO2 continuously decreased with temperature, such that ES_CO2 reached a plateau. These patterns underscore the strong coupling between CO2 efflux and O2 influx in stems and their dependence on diurnal physiological processes such as CO2 transport in the transpiration stream, plant hydraulics like transpiration and cellular turgor pressure, and environmental conditions like temperature.
The measurements were repeated later in the growing season two times over longer measurement periods, but with only one stem chamber installed on the stem, allowing higher temporal resolution of the stem gas exchange fluxes (three sequential stem gas exchange observations per hour rather than one). While minimum ES_CO2 and ES_O2 fluxes were still observed in the early morning, associated with the lowest air temperatures, both CO2 and O2 fluxes (including local and transported components of ES_CO2) increased with temperature, showing a maximum in the late afternoon (Figure 8). However, in contrast to the first experiment earlier in the growing season, ARQ showed a peak around noon, reaching values over 3.2, followed by a gradual decline throughout the afternoon. Average ARQ values determined from linear regression analysis showed a mean ARQ of 2.89 ± 0.05, again demonstrating values far exceeding unity (Figure 9a). Thus, stem net CO2 efflux was dominated by transported CO2 contributions. While ES_CO2_local and ES_CO2_transport showed decreased temperature sensitivity at temperatures above 20 °C, ES_CO2_transport showed higher temperature sensitivity than ES_CO2_local (Figure 9b). When this experiment was repeated towards the end of the growing season, but at a different location on the stem, net CO2 efflux was again dominated by transported CO2 contributions (Figure 10). ARQ generally showed a midday suppression and a maximum value of up to 3.2 during the night. Regression analysis showed an average ARQ of 2.45, and analysis versus air temperature generally showed ES_CO2_transport fluxes higher than ES_CO2_local (Figure 11). As in the other replicates, the apparent temperature sensitivity of the local and transported ES_CO2 stem effluxes decreased with temperatures above 20 °C, below which the apparent temperature sensitivity of ES_CO2_tranport was higher than ES_CO2_local.

4. Discussion

4.1. Advantages of Real-Time, Continuous Measurements of CO2 Efflux

In this article, we present the first system capable of continuous observations of stem ES_CO2 and ES_O2 fluxes under ambient air conditions, allowing for real-time observations of ARQ, and potentially avoiding issues related to sealed static stem chambers. The apparent respiratory quotient (ARQ), the ratio of net CO2 efflux to net O2 influx, provides additional insights into respiratory and transport processes in stems and soils and has the potential to constrain CO2 transport processes independently of local respiratory production. However, observations from static chamber studies consistently reported ARQ values often much lower than 1.0 (Table 1). This deviates from hypotheses predicting ARQ values greater than 1.0 due to CO2 transport in the transpiration stream (Figure 1). Static chamber methods are prone to artifacts, and their inability to resolve real-time changes has limited the interpretation of ARQ observations from intact stems in the field. While processes such as re-fixation by PEPC and preferential utilization of different respiratory substrates have been discussed as potential causes of low ARQ values below theoretical expectations for aerobic respiration of carbohydrates (i.e., 1.0), the underestimation of ARQ by the static method should also be considered. In addition, the transport of CO2 in the transpiration stream has also been discussed as a potential cause of an ARQ below 1.0. The ARQ could decline due to CO2 transport if more CO2 is carried away in the transpiration stream than is entering from below. This could then lead to the net CO2 efflux measured at the stem surface being lower than the true respiratory production. This could occur under conditions of high transpiration rates or when the CO2 source strength from lower stem segments, roots, and/or soils is weak, leading to a reduction in measured ARQ. In such cases, the discrepancy would indicate that a portion of the respired CO2 is being internally transported rather than escaping to the atmosphere via diffusion. As a result, the ARQ derived from gas exchange in a stem segment may decline. Conversely, if there is a large respiratory CO2 source from the soil, roots, and lower stem segments, more CO2 may enter the segment than is transported away, leading to an increased ARQ above 1.0. In this case, the stem acts as a conduit for significant CO2 movement from below, amplifying the measured efflux at the segment’s surface. This scenario might be more likely in trees with high soil, root, and stem respiration rates. This indeed appeared to be the case in the current study on a single California cherry tree, with maximum daytime ES_CO2 reaching high values between 6 and 25 µmol m−2 s−1. This is higher than many reports of stem CO2 efflux, such as from juniper woodlands (up 5 µmol m−2 s−1) [46], Norway spruce (up to 2.3 µmol m−2 s−1) [32], loblolly pine (up to 3.3 at 25 °C) [28], and tropical trees (up to 2.1 µmol m−2 s−1) [33], and more comparable to stem ES_CO2 studies of Eastern cottonwood (up to 25.2 µmol m−2 s−1) [9], Arizona walnut (up to 22.0 µmol m−2 s−1) [9], Tulip tree (15.9 µmol m−2 s−1) [9], Douglas fir (up to 8.4 µmol m−2 s−1) [34] and Japanese cypress (up to 10 µmol m−2 s−1) [35]. In addition to variations in cellular respiration and growth rates, ES_CO2 is also potentially dependent on CO2 conductance of bark to allow CO2 diffusion to the atmosphere. Thus, presumably, we can expect strong differences in ES_CO2 fluxes between species due to differences in wood anatomy, including wood density, lenticel density, bark thickness, etc.

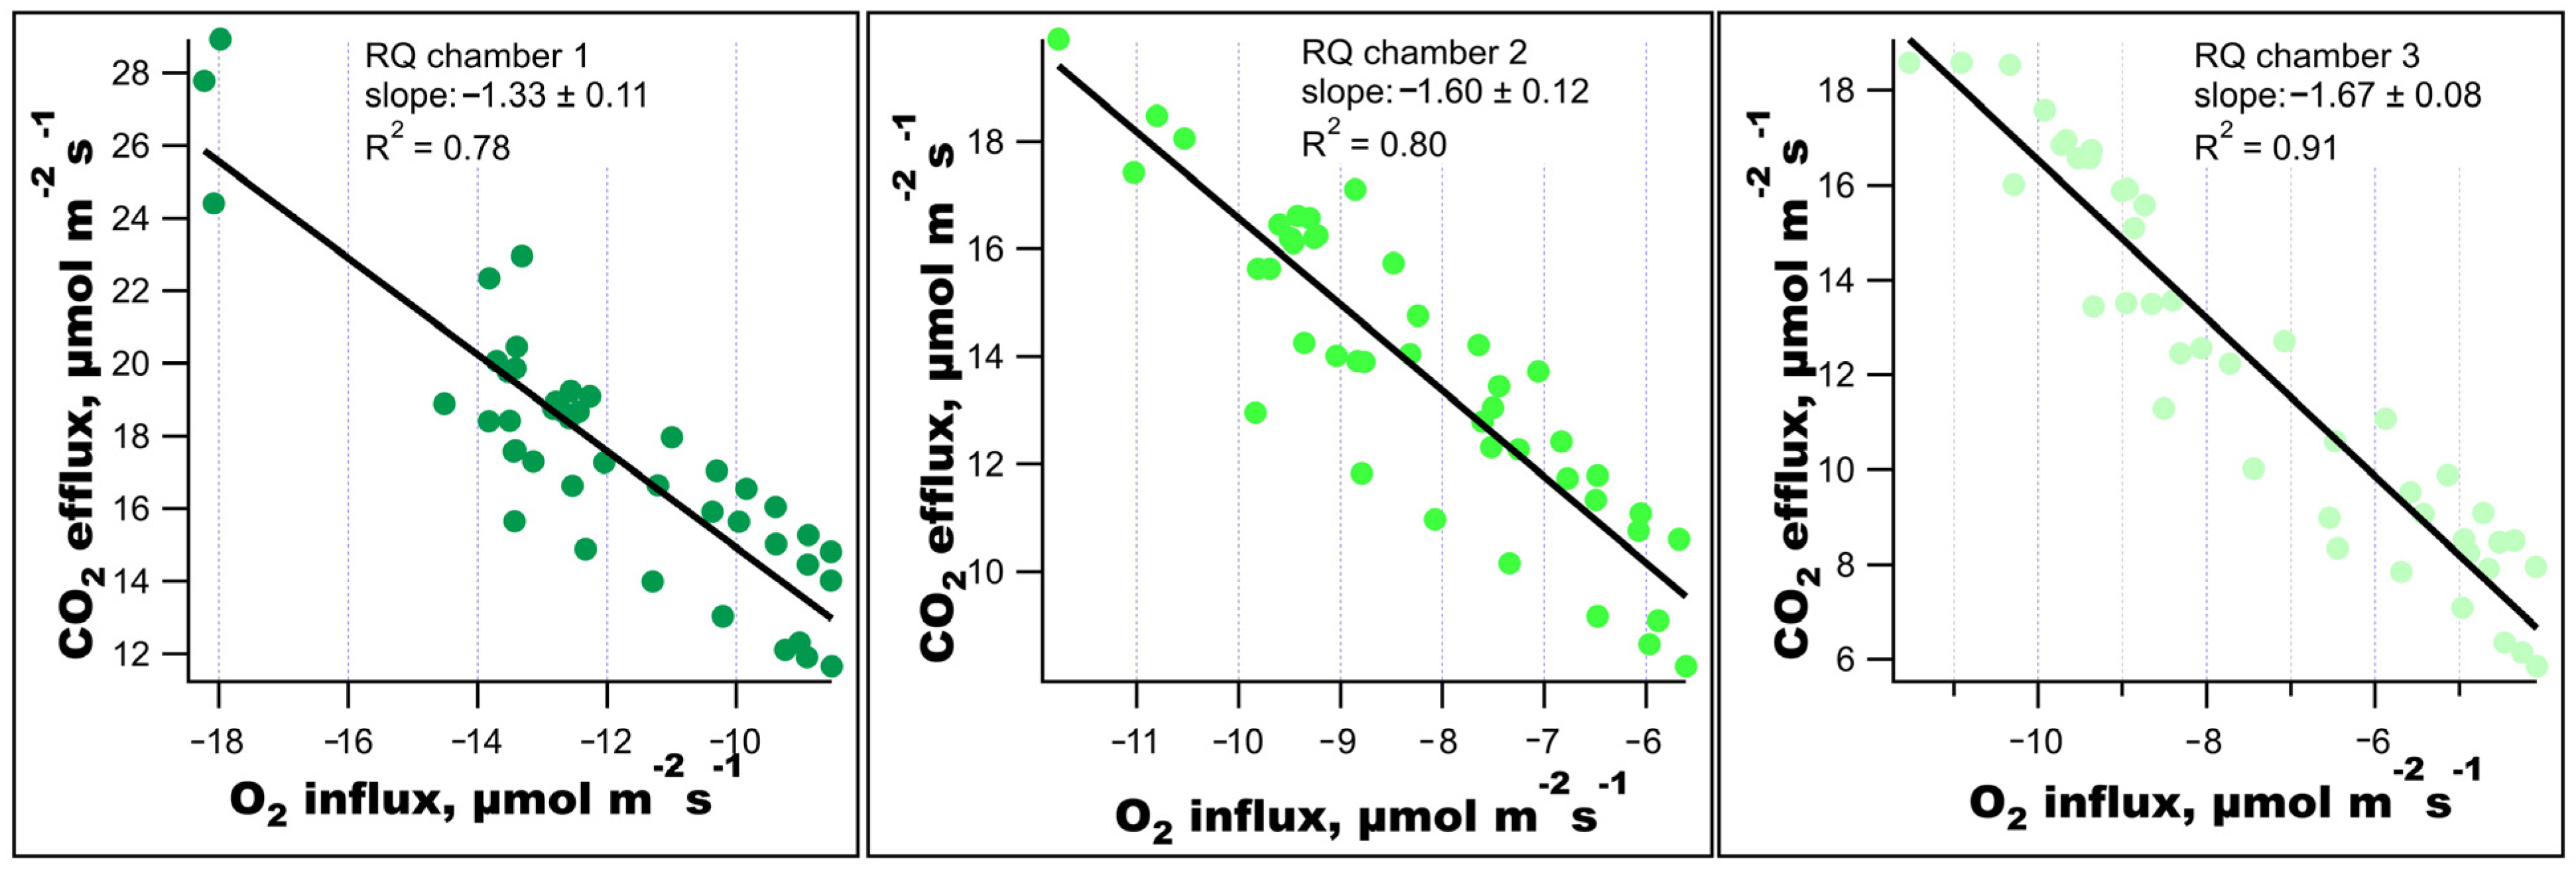
4.2. Significance of Observed Respiratory Quotient

In this study, continuous observations affirmed that there was an ARQ routinely above 1.0 on multiple time scales (sub-hour to week), as determined using two independently calibrated CRDS systems for CO2 and O2 concentrations, a 3D-printed stem chamber with ambient air continuously flowing through, and a mass-flow controller array and continuous flow valve system that maintains air flow through both ambient air and stem air sample gas lines at all times while cycling through each of the samples for online CO2 and O2 concentration determination by CRDS. Based on a tree growing outside the laboratory, we show for the first time that stem ARQ values greatly exceeding unity are common, potentially indicating that transported CO2 contributions to ES_CO2 can dominate local respiratory contributions. However, it should be acknowledged that very high values of ARQ observed here at up to 3.2 may involve other processes such as aerobic and anaerobic fermentation in roots and stems, which could generate CO2 with little O2 consumption [36]. It should be acknowledged that a key limitation of our approach is the assumption that the cellular respiratory quotient (RQ) is 1.0, which corresponds to the complete oxidation of sugars. In reality, tree stem tissues may respire a variety of substrates that exhibit different RQ values: lipids typically yield an RQ around 0.7, proteins yield RQ values around 0.8, and organic acids often have RQ values in the range of 1.3 to 1.4. This variability implies that using a fixed RQ of 1.0 for partitioning ES_CO2 into local and transported components could lead to errors. If substrates with lower RQ values (such as lipids with an RQ around 0.7 or proteins around 0.8) are predominantly respired, then the actual local CO2 production will be lower than what is assumed by an RQ of 1.0. In this scenario, our method would subtract too large a local component, leading to an underestimation of the transported CO2. Conversely, if organic acids (with RQ values typically in the range of 1.3–1.4) dominate, local respiration produces more CO2 than assumed. This extra CO2, not accounted for in the assumed local production, would be erroneously attributed to transport, thus overestimating the contribution of transported CO2. However, the primary substrates used for respiration in stems are carbohydrates, such as sucrose and starch, and phloem sap is mainly composed of sucrose, supporting the assumption of an RQ near 1.0 for carbohydrate oxidation. Although alternative substrates like proteins or lipids can be utilized under specific stress or developmental conditions, they typically represent a minor fraction of the respiratory substrate pool. This means that, under normal conditions, the assumption of an RQ of 1.0 may be reasonable for partitioning stem CO2 fluxes between local respiration and transported components. Future studies could address this issue of variable substrate utilization (and therefore cellular RQ) by employing techniques such as stable isotope labeling, metabolomic profiling, and mass spectrometry analyses of phloem exudates. These methods would help quantify which substrates are being delivered via the phloem and used in respiration, thereby enabling a more accurate assessment of substrate-specific RQ values and improving the partitioning between local respiratory production and CO2 transported via the transpiration stream.

4.3. Physiological Processes and Modeling of CO2 Efflux

Utilizing the methods presented here, future research could explore the opportunities for collecting continuous vertical profiles of stem ES_CO2, ES_O2, and ARQ and couple these observations to biochemical (Table 2), hydraulic (soil moisture, sap velocity, stem water potential), stem diameter change (using point dendrometry), and temperature observations (air and stem). By integrating these measurements across the height of the stem, observations would enable ES_CO2 partitioning as a function of height as well as an overall partitioning of whole stem CO2 efflux into above- versus below-ground contributions. These vertical gradients and diurnal stem-atmosphere gas exchange patterns could lead to more robust field data useful for model inter-comparisons, such as those incorporating detailed physiological processes, including hydraulic impacts, CO2 transport, and environmental sensitivities. In addition, gas exchange measurements at the leaf level would provide valuable context, particularly for quantifying canopy re-assimilation and stem respiratory substrate supply. Future studies could also consider complementing real-time ARQ measurements with stable isotope techniques, such as 13CO2 or 13C-labeled substrate tracing, to directly quantify the sources, transport, and fate of respiratory CO2 within the plant. Isotopic labeling would provide a powerful means of validating the partitioning of CO2 between local emission, xylem transport, and potential re-assimilation by canopy tissues, thereby strengthening the mechanistic interpretation of ARQ dynamics.
Interestingly, in a series of greenhouse experiments, Salomón and colleagues highlighted the phenomenon of daytime depression in temperature-normalized stem CO2 efflux in young poplar trees, linking it to suppressed mitochondrial respiration under hydraulic stress and CO2 transport in the transpiration stream [37]. Their study demonstrated the difficulty in separating these processes due to their simultaneous influence by transpiration dynamics. Experimental manipulation and mechanistic modeling indicated that reductions in turgor pressure rather than CO2 transport dominated the observed depression, underscoring the need for novel approaches like dynamic stem ARQ measurements to help quantify these components. Consistent with these observations, a recent study investigating the effects of reduced water availability on stem CO2 efflux in oak (Quercus petraea) and hornbeam (Carpinus betulus) coppices. They found that severe summer drought led to a significant decrease in stem CO2 efflux, with reductions ranging from 43% to 81% during July and August [53]. This decline was closely associated with a concurrent reduction in stem growth, suggesting that drought-induced limitations on growth processes were a primary factor in the observed decrease in stem respiration [53]. While the study did not directly measure turgor pressure, the authors discussed how the suppression of stem CO2 efflux under drought conditions could be attributed to hydraulic constraints affecting cell expansion and metabolic activity, potentially linked to reduced turgor pressure. These findings highlight the complex interplay between water availability, stem growth, and respiration, emphasizing the sensitivity of stem CO2 efflux to hydraulic stress.
Daytime suppression of cellular growth and aerobic respiration associated with a drop in turgor pressure and high transpiration rates is expected to result in a measurable decrease in the temperature sensitivity of local tissue respiration determined from ES_O2 measurements. In contrast, if transport of respiratory CO2 in the transpiration stream is the main cause of the daytime temperature-normalized ES_CO2 suppression, then stem ES_O2 fluxes would be expected to increase with temperature exponentially, as predicted from Q10 modeling approaches [38]. However, our results suggest that the temperature sensitivity of local stem respiratory processes is suppressed above 20 °C (e.g., Figure 7d, Figure 9b and Figure 11b), potentially due to reductions in turgor pressure constraining growth respiration [37]. This is consistent with the lower apparent temperature sensitivity of ES_CO2_local versus ES_CO2_transport (e.g., Figure 9b and Figure 11b) as well as studies demonstrating that the respiratory Q10 of plant tissues is not constant, but often decreases with temperature [39]. Nonetheless, the results suggest that elevated ES_CO2_transport fluxes at high temperatures are driven by both higher respiration and transpiration rates.
In addition to the more biophysical model TreSpire, stem CO2 efflux measurements that distinguish between localized and transported respiration would be invaluable for benchmarking and calibrating terrestrial biosphere models (TBMs). Some of these models, such as the Functionally Assembled Terrestrial Ecosystem Simulator (FATES) [40,41,42], estimate respiration rates of independent plant organs including stems, coarse roots, fine-roots, and leaves, typically using relationships that scale a base respiration rate (defined by total nitrogen content of the tissues) by a temperature response function. While some TEBs may represent mechanisms such as dissolved CO2 transport and re-fixation, these processes are typically not represented in TEBs used in earth system modeling applications. As such, TEBs such as FATES could benefit from representing these aspects of the carbon balance in plants.

4.4. Consequences for Molecular Signaling Pathways

Our method to assess CO2 efflux partitioning (stem respiration vs. xylem sap transport) will be extremely useful to monitor root-to-shoot signaling via xylem sap composition. In effect, the xylem sap bicarbonate concentration and thus the propensity to liberate CO2 are directly related to sap pH [43,44], which in turn plays a role in water relations. It has been shown that under water deficit or a high soil CO2 concentration, there is a change in sap pH [47,48,49]. This stimulates starch degradation via the trehalose 6-phosphate signaling pathway (for a recent study, see Gao et al. 2022 [54]), thereby facilitating acidic invertase activity and soluble sugar accumulation to adjust the apoplastic osmotic potential and facilitate embolism repair [55]. Also, the sap pH affects abscisic acid (ABA) signaling via tissular compartmentalization [50]. In the field, it has also been shown that there is a co-variation between xylem sap pH and ABA content, leading to stomatal closure during the dry season in evergreen and semi-deciduous woody species [51]. It is also worth noting that a low pH and bicarbonate concentration have an effect on phenolic peroxidases and Zn-Cu superoxide dismutase (SOD), two enzymes that have been found repeatedly in the xylem sap proteome [56]. In fact, phenolic peroxidases have higher activity at a low pH [57], while bicarbonate enhances the peroxidase activity of SOD [58].
In other words, there is likely an interaction between CO2 efflux and drought signaling pathways involving reactive oxygen species (ROS). CO2 efflux from non-photosynthetic plant tissues—such as stems, roots, and xylem parenchyma—is likely intricately linked to salt, temperature, and drought stress responses through ROS signaling pathways [59]. Under these abiotic stresses, ROS accumulate in organelles like mitochondria and peroxisomes, modulating respiration by altering mitochondrial electron transport and activating alternative oxidase pathways. This directly affects the rate and pattern of CO2 release from these tissues [60]. As a result, CO2 efflux may reflect both local respiratory activity and broader oxidative stress signaling under challenging environmental conditions. Collectively, monitoring ARQ and thus estimates of xylem sap transport of CO2 using our method might be used to follow root-to-shoot molecular signaling processes. Given that stem CO2 efflux and O2 influx measurements provide real-time, integrative indicators of respiratory activity in woody tissues, mechanistic interpretation in future studies will be enhanced through targeted biochemical assays. Among the most directly comparable methods are mitochondrial O2 consumption assays using Clark-type electrodes, isothermal calorimetry to quantify total respiratory heat output, and enzymatic activity measurements of the alternative oxidase (AOX) and cytochrome oxidase (COX) pathways. These methods, along with metabolic profiling of sugars, organic acids, and amino acids, may enable a mechanistic interpretation of gas exchange patterns in relation to respiratory substrate use and pathway activity under varying environmental conditions. These comparisons, summarized in Table 2, are expected to enable a systems-level understanding of how respiration responds to environmental conditions such as drought, high temperature, and salinity.
Table 2. Biochemical measurements that can be quantitatively compared with in vivo stem CO2 efflux and O2 influx. The table lists recommended assays for assessing mitochondrial respiration, substrate availability, and redox status, along with the required instruments, measured outputs, and how each measurement links mechanistically and quantitatively to observed gas fluxes. These biochemical metrics provide a framework for integrating physiological gas exchange data with underlying metabolic processes under varying environmental conditions.
MeasurementInstrument NeededWhat It ReflectsUnits/OutputQuantitative Link to Gas Fluxes
Mitochondrial O2 Consumption Rate [61]Clark-type O2 electrode or Seahorse XF AnalyzerTotal respiratory activity (cytochrome + AOX pathways)µmol O2 mg−1 protein h−1 or µmol O2 g−1 FW h−1Directly comparable to stem O2 influx (Es_O2)
CO2 Production in Isolated Tissues or Mitochondria [62] Infrared gas analyzer (IRGA), GC, or CRDSNet decarboxylation rate from respirationµmol CO2 g−1 FW h−1Directly comparable to stem CO2 efflux (Es_CO2)
AOX and COX Enzyme Activities [63]Spectrophotometer or O2 electrode with inhibitors (e.g., SHAM, KCN)Partitioning of O2 consumption across ETC pathwaysnmol O2 min−1 mg−1 proteinExplains variation in RQ and O2 uptake efficiency
TCA Cycle Enzyme Activities [64]Enzymatic activity assay kits with spectrophotometryRespiratory flux capacitynmol min−1 mg−1 proteinHigh activity aligns with elevated CO2 production
ROS Production Rates (H2O2, O2) [65]Fluorometric ROS assays (e.g., Amplex Red, MitoSOX) or microplate readerRedox state and mitochondrial efficiencynmol g−1 FW h−1High ROS can suppress respiration and may influence RQ
Antioxidant Enzyme Activities (SOD, CAT, APX) [66]Spectrophotometer or plate readerROS detoxification capacitynmol min−1 mg−1 proteinReflects ability to maintain respiration under oxidative stress
Metabolic Profiling: Sugars, Organic Acids, and Amino Acids [67]GC-MS, LC-MS, or HPLCPrimary carbon substratesµmol g−1 FWCorrelate with respiratory fluxes and CO2 efflux with composition shifts potentially impacting RQ
ATP/ADP and NADH/NAD⁺ Ratios [68]Bioluminescence assay kits, HPLC, or LC-MSEnergetic/redox statusMolar ratiosLow ratios often coincide with reduced gas exchange
Calorimetry of Stem Segments [69]Isothermal microcalorimeter (e.g., TAM (Thermal Activity Monitor))Total respiratory heat production from all pathwaysµW g−1 FW or J h−1Quantitatively related to O2 consumption (∼470 kJ/mol O2) and CO2 production

5. Conclusions

This study provides key insights into the dynamic partitioning of stem-respired CO2 between local emission and upward transport via the transpiration stream, with important implications for understanding whole-tree carbon cycling and improving terrestrial carbon flux models. The observation of ARQ values consistently greater than 1.0 demonstrates that transported CO2 can be a significant component and even dominate stem efflux, challenging the common assumption that stem CO2 emissions primarily reflect local respiration and re-assimilation. Diurnal patterns revealed that high temperatures can suppress ARQ, likely due to an increase in local respiration relative to transported CO2, whereas midday ARQ peaks suggest enhanced CO2 transport during periods of high transpiration. Notably, the apparent temperature sensitivity of transported CO2 was greater than that of local mitochondrial respiration, indicating that transpiration-driven transport is more responsive to temperature fluctuations. These findings highlight the role of hydraulic processes in modulating respiratory activity and stem CO2 transport dynamics, and they suggest that transported CO2, if re-assimilated by canopy leaves, may help buffer photosynthesis during periods of reduced stomatal conductance, such as warm afternoons with a high vapor pressure deficit. While the results are based on detailed measurements from a single tree near the laboratory, this study introduces a novel, real-time method for quantifying the apparent respiratory quotient (ARQ). When coupled with biochemical, hydraulic, and environmental sensors, this approach can be extended to larger spatial scales and diverse ecosystems to improve our mechanistic understanding of the coupling between plant carbon cycling and water use. Integrating ARQ measurements into carbon and water flux models offers a new framework for capturing the physiological complexity of plant–atmosphere exchange. Further research across forest types and climates will be essential to evaluate the generality of these findings and refine predictions of the global carbon budget.

Author Contributions

Conceptualization, K.J.J.; methodology, K.J.J.; calibration and validation, K.J.J. and P.A.; data collection, K.J.J., P.A., R.O., B.G., G.S., R.K. and C.K.; formal analysis, K.J.J. and P.A.; resources, K.J.J. and J.C.; data curation, J.W. and N.M.; writing—original draft preparation, K.J.J.; writing—review and editing, N.M., J.W., J.C., G.T., R.K. and C.K.; visualization, K.J.J.; supervision, J.C., N.M., C.K. and G.T.; project administration, C.K. and J.C.; funding acquisition, N.M., J.C. and C.K. All authors have read and agreed to the published version of the manuscript.

Funding

This research was supported by the U.S. Department of Energy, Office of Science, Office of Biological and Environmental Research, through the Next-Generation Ecosystem Experiments–Tropics (NGEE-Tropics) project under Contract No. DE-AC02-05CH11231.

Data Availability Statement

The original contributions presented in this study are included in the article. Further inquiries can be directed to the corresponding author(s).

Conflicts of Interest

The authors declare no conflicts of interest. The funders had no role in the design of this study; in the collection, analyses, or interpretation of data; in the writing of the manuscript; or in the decision to publish the results.

Abbreviations

The following abbreviations are used in this manuscript:
ARQApparent Respiratory Quotient (the ratio of net stem CO2 efflux to net stem O2 influx)
ES_CO2Net Stem CO2 Efflux (measured in µmol m−2 s−1)
ES_O2Net Stem O2 Influx (measured in µmol m−2 s−1)
Cellular RQRespiratory Quotient (ratio of CO2 produced to O2 consumed during cellular respiration)
CRDSCavity Ring-Down Spectrometry
PEPCPhosphoenolpyruvate Carboxylase
TreSpireA biophysical model for simulating stem respiration and associated CO2 transport processes
TBMsTerrestrial Biosphere Models
FATESFunctionally Assembled Terrestrial Ecosystem Simulator
Q10A coefficient that quantifies the temperature sensitivity of a biological process
DOEU.S. Department of Energy
BERBiological and Environmental Research
NGEE-TropicsNext Generation Ecosystem Experiments—Tropics
H2CO3Carbonic Acid
HCO3Bicarbonate
CO32−Carbonate
ppmParts per Million
UHPUltra-High Purity

References

  1. Keightley, A.T.; Field, C.D.; Rowson, J.G.; Caporn, S.J. Comparative photosynthetic capacity, respiration rates, and nutrient content of micropropagated and wild-sourced Sphagnum. Int. J. Plant Biol. 2024, 15, 959–978. [Google Scholar] [CrossRef]
  2. Chambers, J.Q.; Tribuzy, E.S.; Toledo, L.C.; Crispim, B.F.; Higuchi, N.; Santos, J.d.; Araújo, A.C.; Kruijt, B.; Nobre, A.D.; Trumbore, S.E. Respiration from a tropical forest ecosystem: Partitioning of sources and low carbon use efficiency. Ecol. Appl. 2004, 14, 72–88. [Google Scholar] [CrossRef]
  3. Zhang, H.; Wang, H.; Wright, I.J.; Prentice, I.C.; Harrison, S.P.; Smith, N.G.; Westerband, A.; Rowland, L.; Plavcova, L.; Morris, H. Thermal acclimation of stem respiration reduces global carbon burden. bioRxiv 2024. [Google Scholar] [CrossRef]
  4. Tcherkez, G.; Ghashghaie, J. Plant Respiration: Metabolic Fluxes and Carbon Balance; Springer: Berlin/Heidelberg, Germany, 2017. [Google Scholar]
  5. Jardine, K.J.; Cobello, L.O.; Teixeira, L.M.; East, M.-M.S.; Levine, S.; Gimenez, B.O.; Robles, E.; Spanner, G.; Koven, C.; Xu, C. Stem respiration and growth in a central Amazon rainforest. Trees 2022, 36, 991–1004. [Google Scholar] [CrossRef]
  6. Gielen, B.; Scarascia-Mugnozza, G.; Ceulemans, R. Stem respiration of Populus species in the third year of free-air CO2 enrichment. Physiol. Plant. 2003, 117, 500–507. [Google Scholar] [CrossRef]
  7. Teskey, R.O.; McGuire, M.A.; Bloemen, J.; Aubrey, D.P.; Steppe, K. Respiration and CO2 fluxes in trees. In Plant Respiration: Metabolic Fluxes and Carbon Balance; Springer: Berlin/Heidelberg, Germany, 2017; pp. 181–207. [Google Scholar]
  8. Salomón, R.L.; Helm, J.; Gessler, A.; Grams, T.E.; Hilman, B.; Muhr, J.; Steppe, K.; Wittmann, C.; Hartmann, H. The quandary of sources and sinks of CO2 efflux in tree stems—New insights and future directions. Tree Physiol. 2024, 44, tpad157. [Google Scholar] [CrossRef]
  9. Mills, M.B.; Both, S.; Jotan, P.; Huaraca Huasco, W.; Cruz, R.; Pillco, M.M.; Burslem, D.F.; Maycock, C.; Malhi, Y.; Ewers, R.M. From tree to plot: Investigating stem CO2 efflux and its drivers along a logging gradient in Sabah, Malaysian Borneo. New Phytol. 2024, 244, 91–103. [Google Scholar] [CrossRef]
  10. Teskey, R.O.; Saveyn, A.; Steppe, K.; McGuire, M.A. Origin, fate and significance of CO2 in tree stems. New Phytol. 2008, 177, 17–32. [Google Scholar] [CrossRef]
  11. Salomón, R.L.; De Roo, L.; Bodé, S.; Boeckx, P.; Steppe, K. Efflux and assimilation of xylem-transported CO2 in stems and leaves of tree species with different wood anatomy. Plant Cell Environ. 2021, 44, 3494–3508. [Google Scholar] [CrossRef]
  12. Stutz, S.S.; Hanson, D.T. Contribution and consequences of xylem-transported CO2 assimilation for C3 plants. New Phytol. 2019, 223, 1230–1240. [Google Scholar] [CrossRef]
  13. Bloemen, J.; Teskey, R.; McGuire, M.; Aubrey, D.; Steppe, K. Root xylem CO2 flux: An important but unaccounted-for component of root respiration. Trees 2016, 30, 343–352. [Google Scholar] [CrossRef]
  14. Salomaón, R.L.; De Roo, L.; Oleksyn, J.; De Pauw, D.J.; Steppe, K. TReSpire–a biophysical TRee Stem respiration model. New Phytol. 2020, 225, 2214–2230. [Google Scholar] [CrossRef]
  15. Salomón, R.L.; De Roo, L.; Oleksyn, J.; Steppe, K. Mechanistic drivers of stem respiration: A modelling exercise across species and seasons. Plant Cell Environ. 2022, 45, 1270–1285. [Google Scholar] [CrossRef]
  16. Tcherkez, G.; Gauthier, P.; Buckley, T.N.; Busch, F.A.; Barbour, M.M.; Bruhn, D.; Heskel, M.A.; Gong, X.Y.; Crous, K.Y.; Griffin, K. Leaf day respiration: Low CO2 flux but high significance for metabolism and carbon balance. New Phytol. 2017, 216, 986–1001. [Google Scholar] [CrossRef]
  17. Jardine, K.J.; Som, S.; Gallo, L.B.; Demus, J.; Domingues, T.F.; Wistrom, C.M.; Gu, L.; Tcherkez, G.; Niinemets, Ü. Concurrent Measurement of O2 Production and Isoprene Emission During Photosynthesis: Pros, Cons and Metabolic Implications of Responses to Light, CO2 and Temperature. Plant Cell Environ. 2024; Online ahead of print. [Google Scholar] [CrossRef]
  18. Hilman, B.; Weiner, T.; Haran, T.; Angert, A. Using Coupled CO2/O2 Measurements to Study Respiration in Tree Stems, Soil, and Carbon Fluxes Between Them. Geophys. Res. Abstr. 2019, 21, 1. [Google Scholar]
  19. Helm, J.; Salomón, R.L.; Hilman, B.; Muhr, J.; Knohl, A.; Steppe, K.; Gibon, Y.; Cassan, C.; Hartmann, H. Differences between tree stem CO2 efflux and O2 influx rates cannot be explained by internal CO2 transport or storage in large beech trees. Plant Cell Environ. 2023, 46, 2680–2693. [Google Scholar] [CrossRef]
  20. Helm, J. From Theory to Methods and Applications–for a Better Understanding of Stem Respiration and Carbon Dynamics in Mature Trees. Ph.D. Thesis, University of Basel, Basel, Switzerland, 2023. [Google Scholar]
  21. Helm, J.; Hartmann, H.; Göbel, M.; Hilman, B.; Herrera Ramírez, D.; Muhr, J. Low-cost chamber design for simultaneous CO2 and O2 flux measurements between tree stems and the atmosphere. Tree Physiol. 2021, 41, 1767–1780. [Google Scholar] [CrossRef]
  22. Hilman, B.; Weiner, T.; Haran, T.; Angert, A. Studying Soil and Tree Stem Respiration in Mediterranean oak forest using the Respiratory Quotient. J. Geophys. Res. Biogeosciences, 2022; submitted. [Google Scholar]
  23. Hilman, B.; Muhr, J.; Trumbore, S.E.; Kunert, N.; Carbone, M.S.; Yuval, P.; Wright, S.J.; Moreno, G.; Pérez-Priego, O.; Migliavacca, M. Comparison of CO2 and O2 fluxes demonstrate retention of respired CO2 in tree stems from a range of tree species. Biogeosciences 2019, 16, 177–191. [Google Scholar] [CrossRef]
  24. Hilman, B.; Angert, A. Measuring the ratio of CO2 efflux to O2 influx in tree stem respiration. Tree Physiol. 2016, 36, 1422–1431. [Google Scholar]
  25. Angert, A.; Muhr, J.; Negron Juarez, R.; Alegria Muñoz, W.; Kraemer, G.; Ramirez Santillan, J.; Barkan, E.; Mazeh, S.; Chambers, J.; Trumbore, S.E. Internal respiration of Amazon tree stems greatly exceeds external CO2 efflux. Biogeosciences 2012, 9, 4979–4991. [Google Scholar] [CrossRef]
  26. Patterson, A.E.; Arkebauer, R.; Quallo, C.; Heskel, M.A.; Li, X.; Boelman, N.; Griffin, K.L. Temperature response of respiration and respiratory quotients of 16 co-occurring temperate tree species. Tree Physiol. 2018, 38, 1319–1332. [Google Scholar] [CrossRef]
  27. Hilman, B.; Weiner, T.; Haran, T.; Masiello, C.A.; Gao, X.; Angert, A. The apparent respiratory quotient of soils and tree stems and the processes that control it. J. Geophys. Res. Biogeosciences 2022, 127, e2021JG006676. [Google Scholar] [CrossRef]
  28. Smart, D.R. Exposure to elevated carbon dioxide concentration in the dark lowers the respiration quotient of Vitis cane wood. Tree Physiol. 2004, 24, 115–120. [Google Scholar] [CrossRef]
  29. Dukat, P.; Hölttä, T.; Oren, R.; Salmon, Y.; Urbaniak, M.; Vesala, T.; Aalto, J.; Lintunen, A. Partitioning seasonal stem carbon dioxide efflux into stem respiration, bark photosynthesis, and transport-related flux in Scots pine. J. Exp. Bot. 2024, 75, 4944–4959. [Google Scholar] [CrossRef]
  30. Berveiller, D.; Kierzkowski, D.; Damesin, C. Interspecific variability of stem photosynthesis among tree species. Tree Physiol. 2007, 27, 53–61. [Google Scholar] [CrossRef]
  31. Bessemans, N.; Verboven, P.; Verlinden, B.; Janssens, M.; Hertog, M.; Nicolaï, B. Apparent respiratory quotient observed in headspace of static respirometers underestimates cellular respiratory quotient of pear fruit. Postharvest Biol. Technol. 2020, 162, 111104. [Google Scholar] [CrossRef]
  32. Heinemeyer, A.; McNamara, N.P. Comparing the closed static versus the closed dynamic chamber flux methodology: Implications for soil respiration studies. Plant Soil 2011, 346, 145–151. [Google Scholar] [CrossRef]
  33. Acosta, M.; Pavelka, M.; Pokorný, R.; Janouš, D.; Marek, M.V. Seasonal variation in CO2 efflux of stems and branches of Norway spruce trees. Ann. Bot. 2008, 101, 469–477. [Google Scholar] [CrossRef]
  34. Ubierna, N.; Kumar, A.S.; Cernusak, L.A.; Pangle, R.E.; Gag, P.J.; Marshall, J.D. Storage and transpiration have negligible effects on δ13C of stem CO2 efflux in large conifer trees. Tree Physiol. 2009, 29, 1563–1574. [Google Scholar] [CrossRef] [PubMed]
  35. Araki, M.G.; Utsugi, H.; Kajimoto, T.; Han, Q.; Kawasaki, T.; Chiba, Y. Estimation of whole-stem respiration, incorporating vertical and seasonal variations in stem CO2 efflux rate, of Chamaecyparis obtusa trees. J. For. Res. 2010, 15, 115–122. [Google Scholar] [CrossRef]
  36. Jardine, K.J.; McDowell, N. Fermentation-mediated growth, signaling, and defense in plants. New Phytol. 2023, 239, 839–851. [Google Scholar] [CrossRef] [PubMed]
  37. Salomón, R.L.; De Schepper, V.; Valbuena-Carabaña, M.; Gil, L.; Steppe, K. Daytime depression in temperature-normalised stem CO2 efflux in young poplar trees is dominated by low turgor pressure rather than by internal transport of respired CO2. New Phytol. 2018, 217, 586–598. [Google Scholar] [CrossRef]
  38. Angert, A.; Sherer, Y. Determining the relationship between tree-stem respiration and CO2 efflux by δO2/Ar measurements. Rapid Commun. Mass Spectrom. 2011, 25, 1752–1756. [Google Scholar] [CrossRef]
  39. Tjoelker, M.G.; Oleksyn, J.; Reich, P.B. Modelling respiration of vegetation: Evidence for a general temperature-dependent Q10. Glob. Change Biol. 2001, 7, 223–230. [Google Scholar] [CrossRef]
  40. Moorcroft, P.R.; Hurtt, G.C.; Pacala, S.W. A method for scaling vegetation dynamics: The ecosystem demography model (ED). Ecol. Monogr. 2001, 71, 557–586. [Google Scholar] [CrossRef]
  41. Koven, C.D.; Knox, R.G.; Fisher, R.A.; Chambers, J.Q.; Christoffersen, B.O.; Davies, S.J.; Detto, M.; Dietze, M.C.; Faybishenko, B.; Holm, J. Benchmarking and parameter sensitivity of physiological and vegetation dynamics using the Functionally Assembled Terrestrial Ecosystem Simulator (FATES) at Barro Colorado Island, Panama. Biogeosciences 2020, 17, 3017–3044. [Google Scholar] [CrossRef]
  42. Fisher, R.A.; Muszala, S.; Verteinstein, M.; Lawrence, P.; Xu, C.; McDowell, N.G.; Knox, R.G.; Koven, C.; Holm, J.; Rogers, B.M. Taking off the training wheels: The properties of a dynamic vegetation model without climate envelopes, CLM4.5 (ED). Geosci. Model Dev. 2015, 8, 3593–3619. [Google Scholar] [CrossRef]
  43. Levy, P.; Meir, P.; Allen, S.; Jarvis, P. The effect of aqueous transport of CO2 in xylem sap on gas exchange in woody plants. Tree Physiol. 1999, 19, 53–58. [Google Scholar] [CrossRef]
  44. Tarvainen, L.; Henriksson, N.; Näsholm, T.; Marshall, J.D. Among-species variation in sap pH affects the xylem CO2 transport potential in trees. New Phytol. 2023, 238, 926–931. [Google Scholar] [CrossRef] [PubMed]
  45. Jardine, K.; Augusto, E.; Levine, S.D.; Sunder, A.; Som, S.; Chambers, J. Development of a lightweight, portable, waterproof, and low power stem respiration system for trees. MethodsX 2023, 10, 101986. [Google Scholar] [CrossRef] [PubMed]
  46. Morote, F.; Abellán, M.; Rubio, E.; Anta, I.; Serrano, F. Stem CO2 efflux as an indicator of forests’ productivity in Relict Juniper Woodlands (Juniperus thurifera L.) of southern Spain. Forests 2021, 12, 1340. [Google Scholar] [CrossRef]
  47. Goodger, J.Q.; Sharp, R.E.; Marsh, E.L.; Schachtman, D.P. Relationships between xylem sap constituents and leaf conductance of well-watered and water-stressed maize across three xylem sap sampling techniques. J. Exp. Bot. 2005, 56, 2389–2400. [Google Scholar] [CrossRef]
  48. Lake, J.A.; Walker, H.J.; Cameron, D.D.; Lomax, B.H. A novel root-to-shoot stomatal response to very high CO2 levels in the soil: Electrical, hydraulic and biochemical signalling. Physiol. Plant. 2017, 159, 433–444. [Google Scholar] [CrossRef]
  49. Gloser, V.; Korovetska, H.; Martín-Vertedor, A.I.; Hájíčková, M.; Prokop, Z.; Wilkinson, S.; Davies, W. The dynamics of xylem sap pH under drought: A universal response in herbs? Plant Soil 2016, 409, 259–272. [Google Scholar] [CrossRef]
  50. Wilkinson, S.; Davies, W.J. Xylem sap pH increase: A drought signal received at the apoplastic face of the guard cell that involves the suppression of saturable abscisic acid uptake by the epidermal symplast. Plant Physiol. 1997, 113, 559–573. [Google Scholar] [CrossRef]
  51. Thomas, D.S.; Eamus, D. Seasonal patterns of xylem sap pH, xylem abscisic acid concentration, leaf water potential and stomatal conductance of six evergreen and deciduous Australian savanna tree species. Aust. J. Bot. 2002, 50, 229–236. [Google Scholar] [CrossRef]
  52. Helm, J.; Muhr, J.; Hilman, B.; Kahmen, A.; Schulze, E.-D.; Trumbore, S.; Herrera-Ramírez, D.; Hartmann, H. Carbon dynamics in long-term starving poplar trees—The importance of older carbohydrates and a shift to lipids during survival. Tree Physiol. 2023, 44, 173–185. [Google Scholar] [CrossRef]
  53. Darenova, E.; Knott, R.; Vichta, T. Does lower water availability limit stem CO2 efflux of oak and hornbeam coppices? AoB Plants 2024, 16, plae023. [Google Scholar] [CrossRef]
  54. Gao, L.; Wang, W.; Xu, C.; Han, X.; Li, Y.; Liu, Y.; Qi, H. Physiological and transcriptomic analyses reveal the effects of elevated root-zone CO2 on the metabolism of sugars and starch in the roots of oriental melon seedlings. Int. J. Mol. Sci. 2022, 23, 12537. [Google Scholar] [CrossRef] [PubMed]
  55. Pagliarani, C.; Casolo, V.; Ashofteh Beiragi, M.; Cavalletto, S.; Siciliano, I.; Schubert, A.; Gullino, M.L.; Zwieniecki, M.A.; Secchi, F. Priming xylem for stress recovery depends on coordinated activity of sugar metabolic pathways and changes in xylem sap pH. Plant Cell Environ. 2019, 42, 1775–1787. [Google Scholar] [CrossRef]
  56. Rodríguez-Celma, J.; Ceballos-Laita, L.; Grusak, M.A.; Abadía, J.; López-Millán, A.-F. Plant fluid proteomics: Delving into the xylem sap, phloem sap and apoplastic fluid proteomes. Biochim. Biophys. Acta Proteins Proteom. 2016, 1864, 991–1002. [Google Scholar] [CrossRef]
  57. Munoz, J.; Garcia-Molina, F.; Varon, R.; Rodriguez-Lopez, J.; Garcia-Ruiz, P.; Garcia-Canovas, F.; Tudela, J. Kinetic characterization of the oxidation of chlorogenic acid by polyphenol oxidase and peroxidase. Characteristics of the o-quinone. J. Agric. Food Chem. 2007, 55, 920–928. [Google Scholar] [CrossRef]
  58. Zhang, H.; Joseph, J.; Gurney, M.; Becker, D.; Kalyanaraman, B. Bicarbonate enhances peroxidase activity of Cu, Zn-superoxide dismutase: Role of carbonate anion radical and scavenging of carbonate anion radical by metalloporphyrin antioxidant enzyme mimetics. J. Biol. Chem. 2002, 277, 1013–1020. [Google Scholar] [CrossRef]
  59. Jarin, A.S.; Islam, M.M.; Rahat, A.; Ahmed, S.; Ghosh, P.; Murata, Y. Drought stress tolerance in rice: Physiological and biochemical insights. Int. J. Plant Biol. 2024, 15, 692–718. [Google Scholar] [CrossRef]
  60. Sachdev, S.; Ansari, S.A.; Ansari, M.I. Generation and Fate of ROS in Mitochondria. In Reactive Oxygen Species in Plants: The Right Balance; Springer: Berlin/Heidelberg, Germany, 2023; pp. 93–106. [Google Scholar]
  61. Jacoby, R.P.; Millar, A.H.; Taylor, N.L. Assessment of respiration in isolated plant mitochondria using Clark-type electrodes. In Plant Mitochondria: Methods and Protocols; Humana Press: New York, NY, USA, 2015; pp. 165–185. [Google Scholar]
  62. Bruhn, D.; Wiskich, J.T.; Atkin, O.K. Contrasting responses by respiration to elevated CO2 in intact tissue and isolated mitochondria. Funct. Plant Biol. 2007, 34, 112–117. [Google Scholar] [CrossRef]
  63. Huang, S.; Lee, C.P.; Millar, A.H. Activity assay for plant mitochondrial enzymes. In Plant Mitochondria: Methods and Protocols; Humana Press: New York, NY, USA, 2015; pp. 139–149. [Google Scholar]
  64. Omena-Garcia, R.P.; Araújo, W.L.; Gibon, Y.; Fernie, A.R.; Nunes-Nesi, A. Measurement of tricarboxylic acid cycle enzyme activities in plants. In Plant Respiration and Internal Oxygen: Methods and Protocols; Humana Press: New York, NY, USA, 2017; pp. 167–182. [Google Scholar]
  65. Akter, S.; Khan, M.S.; Smith, E.N.; Flashman, E. Measuring ROS and redox markers in plant cells. RSC Chem. Biol. 2021, 2, 1384–1401. [Google Scholar] [CrossRef]
  66. Elavarthi, S.; Martin, B. Spectrophotometric assays for antioxidant enzymes in plants. In Plant Stress Tolerance: Methods and Protocols; Humana Press: Totowa, NJ, USA, 2010; pp. 273–280. [Google Scholar]
  67. Adeeyo, A.O.; Amao, I.O.; Ngandjui, Y.A.; Alabi, M.A.; Msagati, T.A. Metabolic profiling of plant and other natural products: Platforms, applications and quality evaluation. Microchem. J. 2024, 207, 111779. [Google Scholar] [CrossRef]
  68. Steinbeck, J.; Fuchs, P.; Negroni, Y.L.; Elsässer, M.; Lichtenauer, S.; Stockdreher, Y.; Feitosa-Araujo, E.; Kroll, J.B.; Niemeier, J.-O.; Humberg, C. In vivo NADH/NAD+ biosensing reveals the dynamics of cytosolic redox metabolism in plants. Plant Cell 2020, 32, 3324–3345. [Google Scholar] [CrossRef]
  69. Hansen, L.D.; Hopkin, M.S.; Rank, D.R.; Anekonda, T.S.; Breidenbach, R.W.; Criddle, R.S. The relation between plant growth and respiration: A thermodynamic model. Planta 1994, 194, 77–85. [Google Scholar] [CrossRef]
Figure 1. Graphical illustration depicting stem ARQ values determined using a dynamic flowthrough stem chamber with values less than 1.0 ((left) panel) and greater than 1.0 ((right) panel) due to variations in respiratory and transport processes. Two sources of stem CO2 efflux entering the chamber include local respiratory CO2 (red) and stem CO2 efflux deriving from transport in the transpiration stream (purple) with a respiratory origin in lower stem segments, roots, and/or soil. In the first scenario, more CO2 produced locally is transported away in the transpiration stream than is delivered from the transpiration stream below, resulting in ARQ < 1. In the second scenario with higher rates of soil, root, and stem respiration, more CO2 is delivered from below than local CO2 transported away in the transpiration stream, leading to ARQ > 1. Note that only locally respired CO2 is coupled with stem O2 influx, whereas upstream sources of CO2, including stem respiration occurring at lower heights on the stem, root respiration, and microbial respiration in the rhizosphere, are associated with O2 consumption in distant locations followed by CO2 transport via the transpiration stream.
Ijpb 16 00046 g001
Figure 2. Experimental setup for ARQ measurements with 3 stem chambers illustrating the open flow-through configuration for continuous ARQ measurements with ambient air replenishment. Briefly, an ambient air buffer volume, 3D-printed stem chambers, and 6-way continuous flow valve were interfaced with a CO2 CRDS and high-precision O2 CRDS operating in parallel. The system uses mass flow controllers to maintain an ambient air flow of 100 mL min−1 through each of the ambient air reference lines (3) and stem chambers (3) which are connected to ports 1–6 of the selector valve. The 6-way selector valve cycles between ambient air and stem chambers in the following sequence: ambient air → stem 1 → ambient air → stem 2 → ambient air → stem 3. CO2 and O2 concentrations from ambient air and stem air samples were sequentially measured to calculate diurnal patterns of stem CO2 efflux and O2 influx as well as the ARQ.
Ijpb 16 00046 g002
Figure 3. Calibration of (a) CRDS CO2 concentration measurements by dynamic dilution of a CO2 standard with CO2-free air, and (b) CRDS O2 concentration measurements by dynamic dilution of air with nitrogen. Note, gas sources are high-purity compressed gas cylinders blended with mass flow controllers (see Section 2). The black dots represent individual calibration points, and the red line represents the 1:1 relationship (y = x).
Ijpb 16 00046 g003
Figure 4. Raw CO2 and O2 gas concentrations (ppm) exiting three open path flow-through stem chambers measured sequentially as a function of time during a continuous 3-day (28 June–1 July 2024) stem gas exchange measurement period. Just prior to each stem chamber measurement period, the reference ambient CO2 and O2 concentrations entering the stem chamber were determined, and the concentration difference was used to determine ES_CO2 and ES_O2 surface area-based fluxes.
Ijpb 16 00046 g004
Figure 5. Stem CO2 efflux (µmol m−2 s−1) and O2 influx (µmol m−2 s−1) patterns determined from three different open flow stem chambers installed at different heights (0.5–1.5 m) on a California cherry tree stem during three diurnal cycles. Also shown are air temperature next to the chambers and stem ARQ values versus time calculated from the three different open flow stem chambers. Note the general increasing pattern in ARQ from ∼0.9 to over 1.4 throughout the 3-day period.
Ijpb 16 00046 g005
Figure 6. Average ARQ values determined from linear regression of ES_CO2 versus ES_O2 (negative of the slope) for each of the three chambers during the 3-day stem gas exchange experiment shown in Figure 5. Note the average ARQ values ranging between 1.3 and 1.7. The color scheme for the three stem chambers matches that used in Figure 5.
Ijpb 16 00046 g006
Figure 7. Diurnal patterns of ES_CO2 (total) partitioned into contributions from local tissue respiration (Local) and transported CO2 for (a) stem chamber 1, (b) stem chamber 2, and (c) stem chamber 3 on the California cherry tree. Also shown are (d) ES_CO2 local flux dependencies on air temperature. Data from Figure 5.
Ijpb 16 00046 g007
Figure 8. Seven days (13–19 August 2024) of continuous net stem CO2 efflux (µmol m−2 s−1) partitioned into Total, Local, and Transport, net O2 influx (µmol m−2 s−1), and ARQ patterns together with air temperature from a single stem chamber installed on a California cherry tree.
Ijpb 16 00046 g008
Figure 9. Average stem ARQ value determined from (a) linear regression of ES_CO2 versus ES_O2 during the 7-day stem gas exchange experiment shown in Figure 8. (b) Scatter plot of the CO2 transport and local CO2 production components of net stem CO2 efflux plotted as a function of air temperature.
Ijpb 16 00046 g009
Figure 10. Nine days (22–30 August 2024) of continuous net stem CO2 efflux (µmol m−2 s−1) partitioned into Total, Local, and Transport, net O2 influx (µmol m−2 s−1), and ARQ patterns together with air temperature from a single stem chamber installed on a California cherry tree.
Ijpb 16 00046 g010
Figure 11. Average stem ARQ value determined from (a) linear regression of ES_CO2 versus ES_O2 (negative of the slope) during the 9-day stem gas exchange experiment shown in Figure 10. (b) Scatter plot of the CO2 transport and local CO2 production components of net stem CO2 efflux plotted as a function of air temperature.
Ijpb 16 00046 g011
Disclaimer/Publisher’s Note: The statements, opinions and data contained in all publications are solely those of the individual author(s) and contributor(s) and not of MDPI and/or the editor(s). MDPI and/or the editor(s) disclaim responsibility for any injury to people or property resulting from any ideas, methods, instructions or products referred to in the content.

