Article

Allometric Models to Estimate Aboveground Biomass of Individual Trees of Eucalyptus saligna Sm in Young Plantations in Ecuador

by
Raúl Ramos-Veintimilla
1,*,
Hernán J. Andrade
2,
Roy Vera-Velez
3,
José Esparza-Parra
1,
Pedro Panama-Perugachi
4,
Milena Segura
5 and
Jorge Grijalva-Olmedo
6
1
Facultad de Recursos Naturales, Escuela Superior Politécnica de Chimborazo, Panamericana sur km 1 ½, Riobamba C.P. 060155, Ecuador
2
Grupo de Investigación PROECUT, Facultad de Ingeniería Agronómica, Universidad del Tolima, Dirección, Ibagué C.P. 730005, Colombia
3
Department of Plant Sciences, University of Saskatchewan, 51 Campus Drive, Saskatoon, SK S7N 5A8, Canada
4
Independent Researcher, Otavalo C.P. 100208, Ecuador
5
Grupo de Investigación PROECUT, Facultad de Ingeniería Forestal, Universidad del Tolima, Dirección, Ibagué C.P. 730005, Colombia
6
Facultad de Medicina Veterinaria y Zootecnia, Universidad Central del Ecuador, Jerónimo Leyton y Gato Sobral, Quito C.P. 170521, Ecuador
*
Author to whom correspondence should be addressed.
Int. J. Plant Biol. 2025, 16(2), 39; https://doi.org/10.3390/ijpb16020039
Submission received: 4 February 2025 / Revised: 9 March 2025 / Accepted: 20 March 2025 / Published: 24 March 2025
(This article belongs to the Section Plant Ecology and Biodiversity)

Abstract

:
(1) Background: Nature-based solutions (NbS), particularly through forest biomass, are crucial in mitigating climate change. While forest plantations play a critical role in carbon capture, the absence of species-specific biomass estimation models presents a significant challenge. This research focuses on developing allometric models to accurately estimate the aboveground biomass of Eucalyptus saligna Sm in Ecuador’s Lower Montane thorny steppe. (2) Methods: Conducted at the Tunshi Experimental Station of ESPOCH in Chimborazo, Ecuador, the research involved 46 trees to formulate biomass predictive models using both destructive and non-destructive methods. Sixteen generic models were tested using the ordinary least squares method. (3) Results: The most effective allometric equation for estimating six-year-old E. saligna biomass was Ln(B) = −0.952 + 1.97∗Ln(dbh), where B = biomass in kg/tree, and dbh = diameter at breast height in cm. This model represents a valuable contribution to improve biomass and carbon estimates in mitigation projects in Ecuador. (4) Conclusions: The tested models stand out for their simplicity, requiring only dbh as input, and demonstrate high accuracy and fit to contribute to the field of climate change mitigation.

1. Introduction

The human population is currently confronting a triple environmental crisis: climate change, pollution, and biodiversity loss [1], all of which are interconnected and threaten important ecosystem services, endangering the well-being of billions of people [2,3,4,5]. The last century has seen a significant rise in Earth’s mean temperature, likely over 2 °C above pre-industrial levels. Models predict even greater increases, particularly in higher latitude regions, such as northern Canada, Greenland, and Siberia [3,6].
Carbon dioxide (CO2), a major greenhouse gas, reached levels of 413.2 ppm in 2020 [7], contributing significantly to climate change. Industrial CO2 emissions are projected to increase from 13 Gt CO2/year in 2010 to 20–24 Gt CO2/year in 2050 [8], making carbon capture a critical, complex, and expensive challenging task. However, nature-based solutions (NBS), such as reforestation and afforestation, have proven to be critical strategies for climate change mitigation, restoring natural heritage, and potentially offering cost-effective means towards the decarbonization of economies [9,10]. Ecuadorian policy promotes a sustainable development model that is environmentally balanced and respectful of cultural diversity, conserving biodiversity and the natural regenerative capacity of ecosystems. These policies ensure the satisfaction of the needs of present and future generations [11], which is congruent with NbS. The promotion of restoration and climate change mitigation are fundamental in Ecuador’s forestry policies [12]. In the long run, these NBS approaches can enhance global well-being, create jobs, and recover and sustain ecosystem services [13,14,15].
Globally, commercial forest plantations have expanded rapidly in recent decades, with an average yearly increase of 3.6 million hectares from 1990, accounting for about 10% of the world’s total forest area. These plantations significantly contribute to the global timber supply, providing one-third of the roundwood used in industries [16,17]. In Ecuador, the forest coverage extends to approximately 12.5 million hectares, with nearly 220,000 hectares being afforested over the last two decades [18,19]. The species distribution within these plantations is diverse, with teak (Tectona grandis L. f.) making up 37.8%; melina (Gmelina arborea Roxb) 21.9%, balsa (Ochroma pyramidale Cav. Ex Lam. Urb) 19%; pines (Pinus radiata D. Don and P. patula Schltdl. & Cham) 9.8%; and other species comprising 11.5%, including Eucaliptus saligna Sm. The Ecuadorian coastal provinces of Esmeraldas, Guayas, and Los Ríos have the largest planted areas [19].
Eucalyptus L’ Hér is one of the forest genera utilized in short-rotation plantations across tropical and subtropical regions [20,21,22]. Its rapid growth is one of its greatest advantages in the forest industry, in addition to its versatility for a number of uses, including production of cellulose pulp for the paper industry, timber, and biomass energy [23]. Additionally, it holds value in the pharmaceutical sector, contributing to creating products with anti-inflammatory, antiseptic, antispasmodic, and antidiabetic properties. Further, E. saligna is beneficial for honey production through its flowers and plays a key role in soil erosion control [24]. According to Boland et al. [25], optimal growth conditions for E. saligna include latitudes of 21 to 36° S, elevations up to 1100 m, well-drained soils with adequate moisture retention, annual rainfall ranging from 700 to 2300 mm, and mean annual temperatures between 10 and 28 °C [26].
Estimating tree biomass is essential for understanding carbon sequestration and nutrient cycling within ecosystems. This can be achieved through either direct or indirect methodologies [27]. Tree biomass estimation is also for evaluating natural forest and plantation ecosystems in terms of organic matter accumulation [28,29]. It is commonly conducted using allometric biomass or volume models, which are developed through regression analysis that correlates biomass or volume data (gathered through destructive methods) with allometric variables recorded during forest inventories [30]. These biomass models are typically tailored to individual species and, occasionally, specific tree components to ensure accuracy [29,31,32]. The principle of tree allometry involves establishing a quantitative relationship between easily measurable tree attributes and those that are more challenging to measure [33], facilitating a more efficient and less invasive estimation process.
The biomass expansion factor (BEF) and the partitioning of this variable are confident tools to estimate biomass in native forests, commercial forestry plantations, and agroforestry systems [34,35]. These variables are estimated destructively [36]. These tools are widely used because most of the forestry inventories estimate trunk volume, which can be converted to total aboveground biomass with BEF and biomass partitioning [37].
Numerous studies have utilized biomass models to estimate carbon stocks in E. saligna [38,39,40], highlighting the genus’s significance in carbon sequestration efforts. Despite this, the reliability for such equations can vary, often resulting in considerable estimation inaccuracies due to the diverse nature of biomass across sites [41]. Hence, the development of localized biomass models is essential to enhance the estimation process [29,42,43,44]. Notably, there are no allometric models tailored for E. saligna in the bioclimatic conditions of the Ecuadorian highlands. Addressing this gap, our study aimed to develop specific allometric models through the application of the destructive method and the BEF. This approach will facilitate the estimation of total aboveground biomass and its component in E. saligna trees, aged up to six years, within the subtropical climate of Ecuador’s Lower Montane thorny steppe.
This paper hypothesized that biomass models for E. saligna developed in other regions estimates total and by-component biomass with higher bias than those constructed locally. There is a lack of total aboveground biomass models for this species in the Lower Montano thorny steppe. The primary objective of this study was to develop total and component biomass models for this species in this area. In the same way, biomass allocation was studied and BEF was estimated as another tool for estimating aboveground biomass. These local tools are important for other regions’ previous validation.

2. Materials and Methods

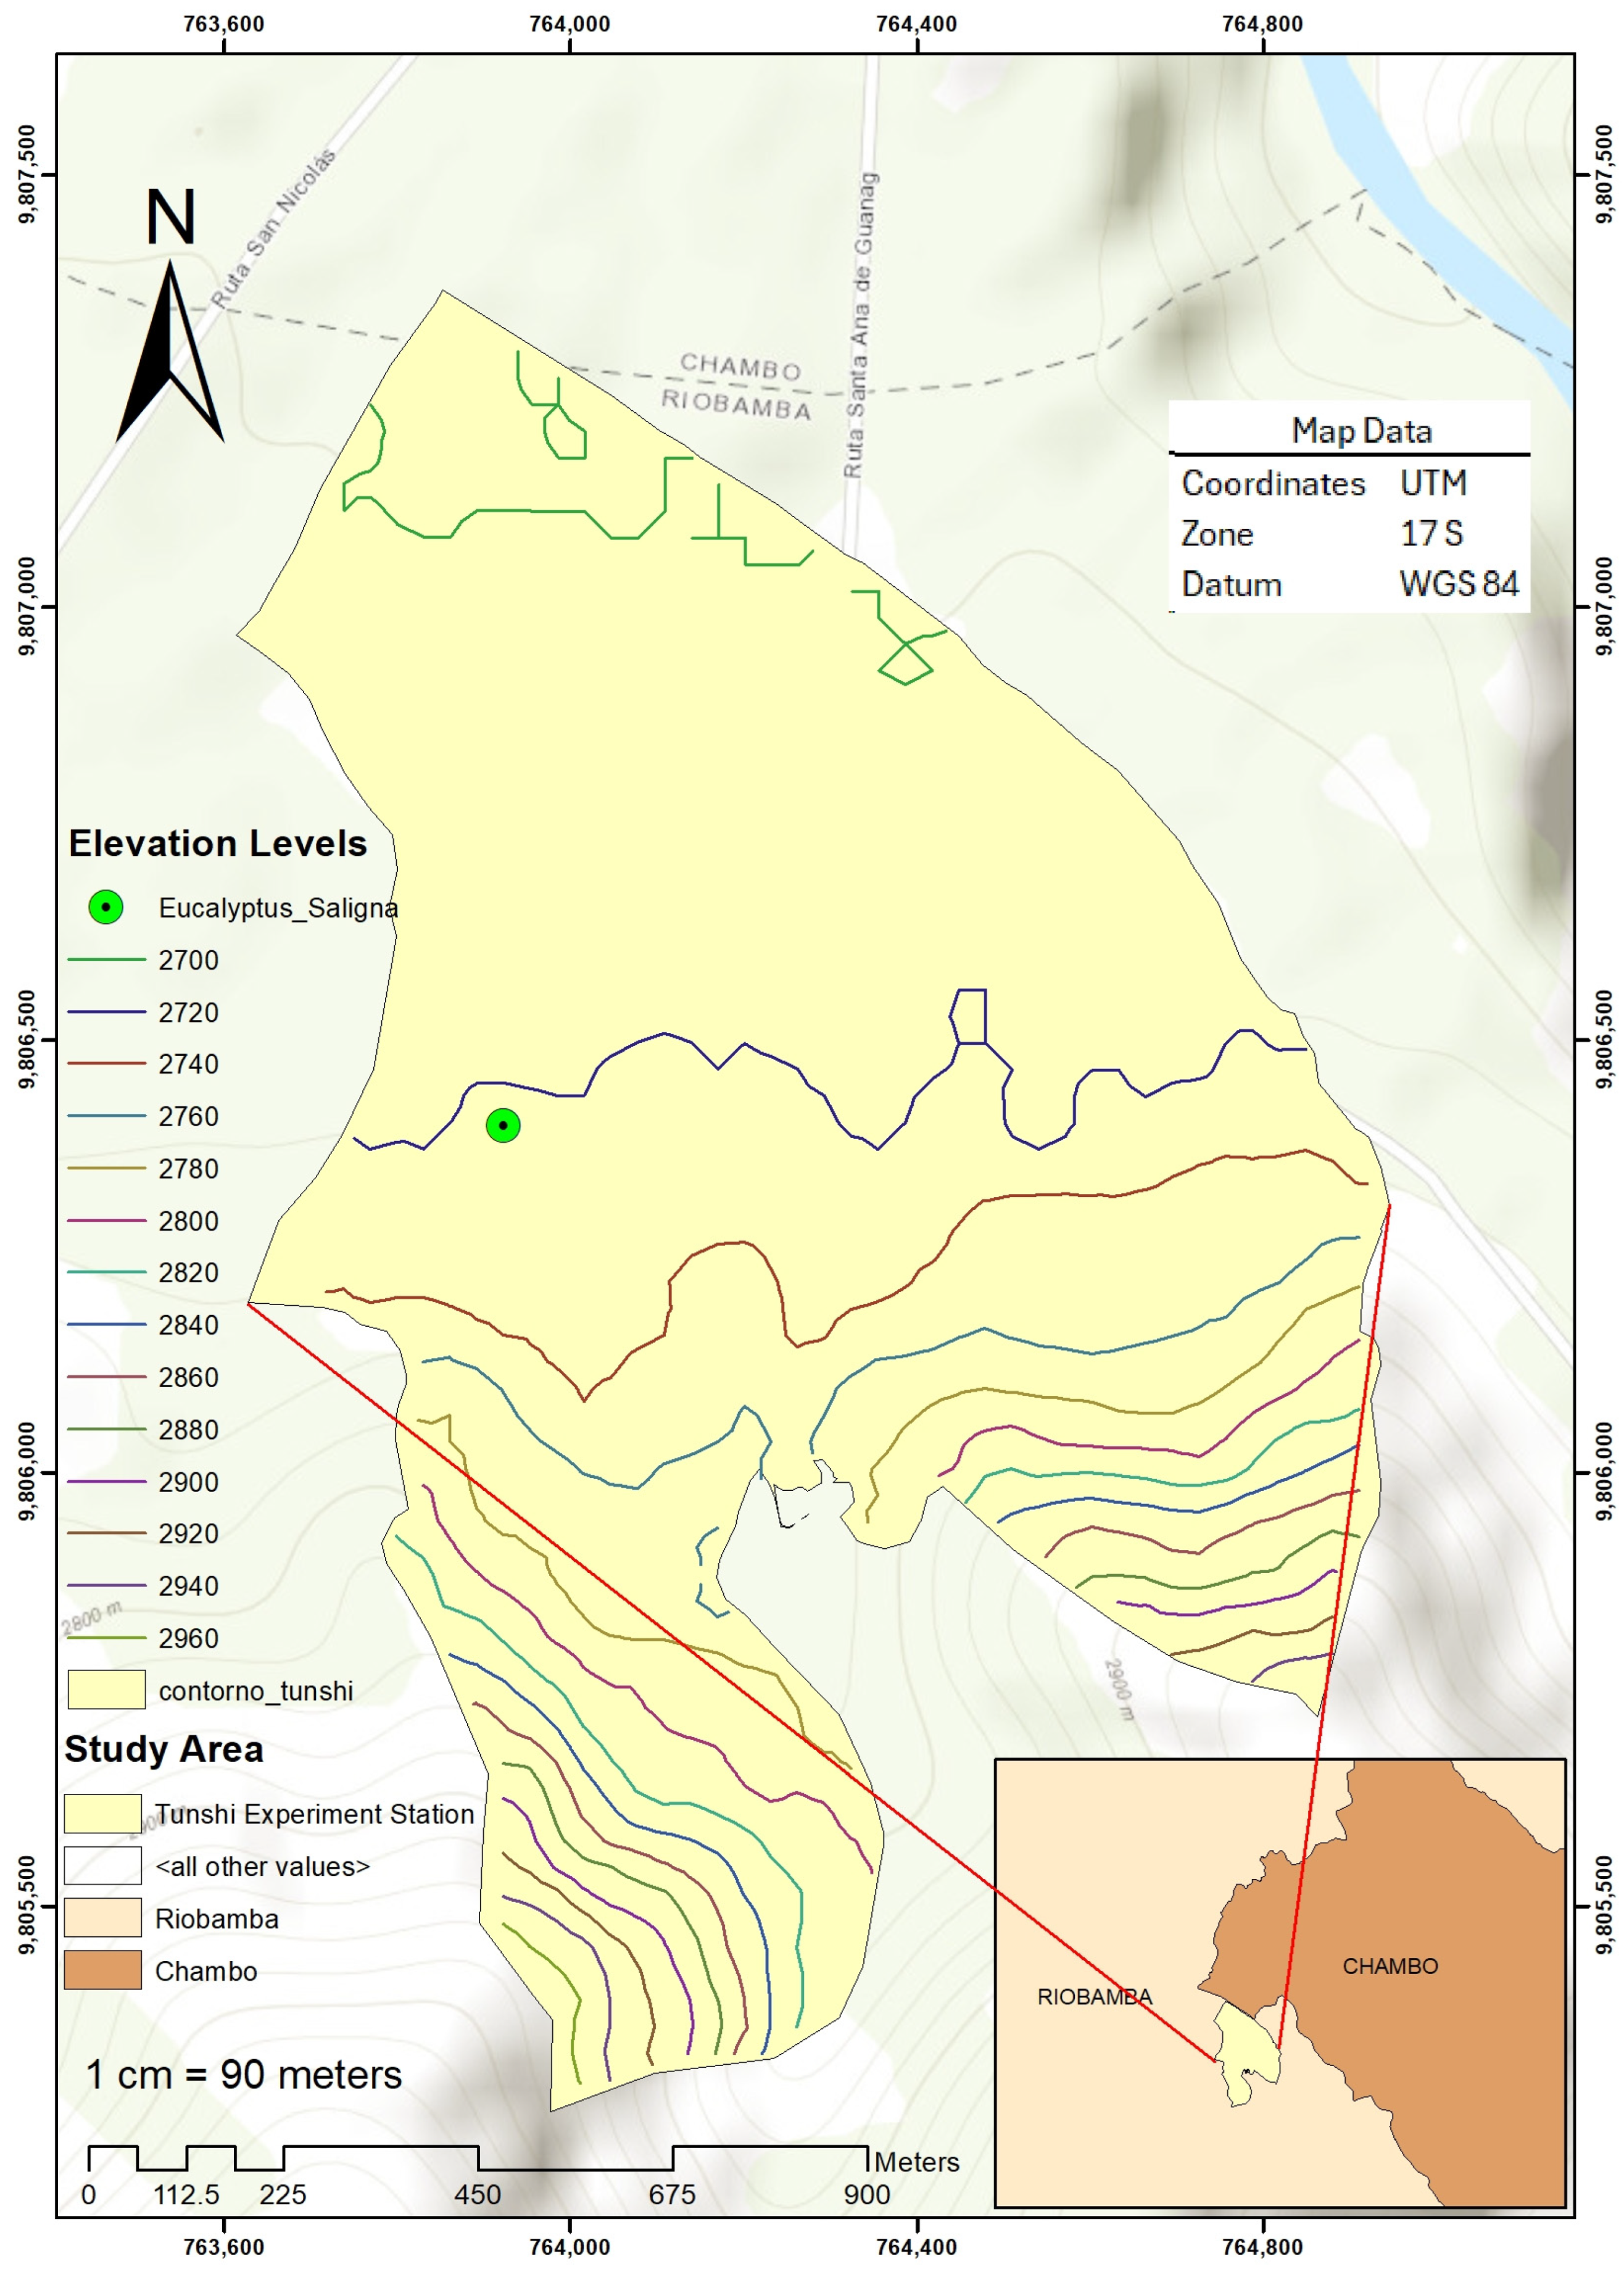
2.1. Site Description

The study was conducted at the ESPOCH Tunshi Experimental Station, situated along the Riobamba-Licto highway at the 4 km mark. The station is located at the geographical coordinates of 01°45′0.13″ S and −78°37′40″ W, within the Chimborazo province in Ecuador, at an elevation of 2700 m above sea level (Figure 1). The specific area of investigation falls within the ecological zone classified as the Lower Montane thorny steppe [45]. This region is a good representation of the central Andean climatic conditions in Ecuador characterized with an average annual temperature of 13.8 °C and an average annual rainfall of 835.6 mm, providing an excellent site for the study of ecological dynamics.
In November 2013, E. saligna was planted as a control species alongside an experimental trial to assess the adaptability of the introduced Paulownia species to the mountainous regions of Ecuador. This experiment, detailed by Vera-Velez et al. [46], utilized a split-plot design with a completely randomized block framework to methodically evaluate the performance of three Paulownia species and E. saligna. The experimental setup consisted of three blocks, each testing different planting densities (2 × 3, 3 × 3, and 4 × 4 m) to optimize plant materials and land use. This design also mitigated the potential impact of terrain slope on the experiment. Randomization was applied at multiple levels: the arrangement of blocks, the distribution of planting frames within each block, and the assignment of species within each frame. To minimize border effects, each plot included nine specimens of a given species, supplemented by an additional borderline of the same species. At the time of planting, all saplings were three months old and approximately 30 cm in height. One month before planting, soil analysis conducted in October 2013 revealed a silty loam texture with a neutral pH of 7.72. Soil fertility was characterized by organic matter content of 1.5%; ammonium levels of 34 ppm; and concentrations of phosphorus, potassium, calcium, and magnesium of 39 ppm, 1.18 ppm, 15.2 ppm, and 5.6 ppm, respectively. These values indicated generally high fertility, except for organic matter and ammonium, which were in the low to medium range [47].

2.2. Selection of Individual Trees

In November 2018, the stem diameter at breast height (dbh) was measured for every tree within the experimental plots of the trial. Regardless of the specific planting frame used, a comprehensive selection process was employed to randomly select 46 trees of E. saligna from 180 trees that composed the whole distance trial. The selected trees were taken from the three planting densities, considering all the microsites that were found. These trees had a dbh between 5.9 and 21.0 cm and 5.4 to 14.8 m of total height (ht). This selection process, outlined in Segura and Andrade [48], was strategically designed to ensure a representative sample across the various diametric classes present within the plots. Additionally, careful attention was given to excluding any trees located on the periphery of each plot, thereby mitigating potential edge effects and enhancing the accuracy and reliability of the data collected.

2.3. Cutting, Measurement, and Estimation of Total Aboveground Biomass

A detailed measurement of dendrometric variables was conducted for each tree selected and subsequently harvested. This included the diameter at breast height (dbh), the height to live crown (hlc), and the total height (ht) of the tree. Furthermore, the basal area (ba) for each tree was calculated.
The process involved cutting the trees at a standard height of 15 cm above ground, after which the biomass was systematically categorized into distinct components: the stump (t), defined as the section from ground level to the cutting point; the stem (s), extending from the base of the tree to the topmost part with a diameter of 2 cm; large branches (lb) with diameters equal to or greater than 8 cm; medium branches (mb) with diameters greater than 2 cm but less than 8 cm; small branches (sb) with diameters up to 2 cm; and leaves (l), as per the methodology recommended by Picard et al. [30].
In the field, the fresh biomass for each component was quantified by weighing the material using a hook scale with a capacity of 300 kg and a precision of 100 g. To ensure accuracy and minimize moisture loss-related errors, stem slices approximately 3 cm thick were taken from the base and at every 2.20 m interval along the stem. Additionally, a sample comprising about 500 g of slices from branches of varying diameters and types (large, medium, and small) was collected and weighed on-site. Each sample was meticulously labelled and weighed using a precision balance with a sensitivity of 0.01 g.
These samples were then transported to the soil laboratory of the Faculty of Natural Resources of ESPOCH for further analysis. Here, they were dried in an oven at 70 °C until a constant weight was achieved, and the dry weight of each sample was recorded [49]. The biomass for each component was then estimated based on the ratio of the total fresh weight to the dry matter content. Specifically for the stem, the biomass was calculated for each log or section.
The total aboveground biomass (Bt) of each tree was determined by the sum of the dry weights of all components (t, s, lb, mb, sb, and l) [30,50]. The distribution of aboveground biomass across these components for each tree was then calculated as a percentage by dividing each component’s biomass by the tree’s total aboveground biomass. Additionally, the Biomass Expansion Factor (BEF), which is the ratio of total aboveground biomass (Bt) to the biomass of the stems (B), was also estimated, providing a comprehensive understanding of biomass distribution within each tree.

2.4. Statistical Analysis

The assumptions of normality (Shapiro–Wilk test) and the homoscedasticity of the data were verified for all the variables recorded and calculated in the field. A Pearson correlation analysis was carried out, with the objective of identifying the dendrometric tree variables that best explained the total biomass above ground and per component. To develop simple and practical allometric models, as well as to find the best predictor variable of tree biomass, 16 linear models were fitted (Table 1) [51] using the ordinary least squares method.
The best fitting models were selected based on (a) the highest R2 and adjusted R2 (AdjR2) and (b) the lowest root mean square error (RMSE), Furnival Index (FI), Akaike Information Criterion (AIC), and Bayesian Information Criterion (BIC); (c) statistical significance of the models and their parameters (p < 0.05); and (d) residual analyses (estimated values versus observed values) without systematic bias used to evaluate the range of tree sizes at which the models perform adequately [30,48,52,53,54]. An index was used that integrates all these statistics and indicators, ranking each model according to each of them (one for the best model, two for the second best, and so on). Subsequently, the scores of the evaluated indicators are summed and the model with the lowest sum is likely to be the best selection. The best-fitting models were tested for heteroscedasticity with the Breusch–Pagan test. Statistical analyzes were performed with Past 4.11 software [55].
The selected models were used to estimate extremes and were projected beyond the range of observed values in order to explore the consistency of their biological behavior [30,48,53,54,56,57]. The prediction ability of the best-fitting models was compared to models for the same species developed elsewhere using the model prediction error (MPE) or mean relative error (MRE) and model efficiency (ME) [58]. In logarithmic models, a correction factor (CF = exp(MSE2/2)) was estimated [59,60,61] to test its performance in avoiding or reducing bias using MRE and ME in models with and without CF.
The best fitting model for E. saligna was compared with the one proposed by Senelwa and Sims [38]: Bt = 0.00014∗(dbh∗10)2∗h and with the one developed by Momolli et al. [40]: Bt = 12.442 + 0.000567∗(dbh∗h)2, where B: aboveground biomass (kg/tree), dbh: breast height diameter (cm), h: total height (m). In the same way, the estimates were compared with those derived from the model of MacFarlane et al. [39], which was built to estimate the biomass of woody components (bole and branches) of E. saligna and E. grandis in Kenya: Bw = 0.035∗dbh2.739; where Bw: biomass of woody components (kg/tree). In this case, the ratio between the biomass of non-woody components (leaves) (Bnw) and woody components (Bw), calculated in this study, was used to estimate the total aboveground biomass. This process measures the uncertainty of the model developed in this study compared to those general models, which were generated in other regions, that are usually used [35,50,51].

3. Results

3.1. Normality of Variables and Correlation Between Aboveground Biomass and Dendrometric Tree Variables

The Shapiro–Wilk test found normality in the data of dbh, Bs, and Bt (p = 0.31, 0.10, and 0.20, respectively). No normality was found in Bb and Bl (p < 0.05). From the independent variables, dbh was the one that best correlated positively and significantly (p < 0.01), with B of branches, B of leaves, and Bt, yielding Pearson correlation coefficients of 0.57, 0.56, and 0.89, respectively (Figure 2). The variables of ht and hb did not correlate well with the biomass of the components, presenting r values between −0.15 and 0.61 (Figure 2). These results suggest that the total aboveground biomass per tree and its components should be estimated based on dbh.

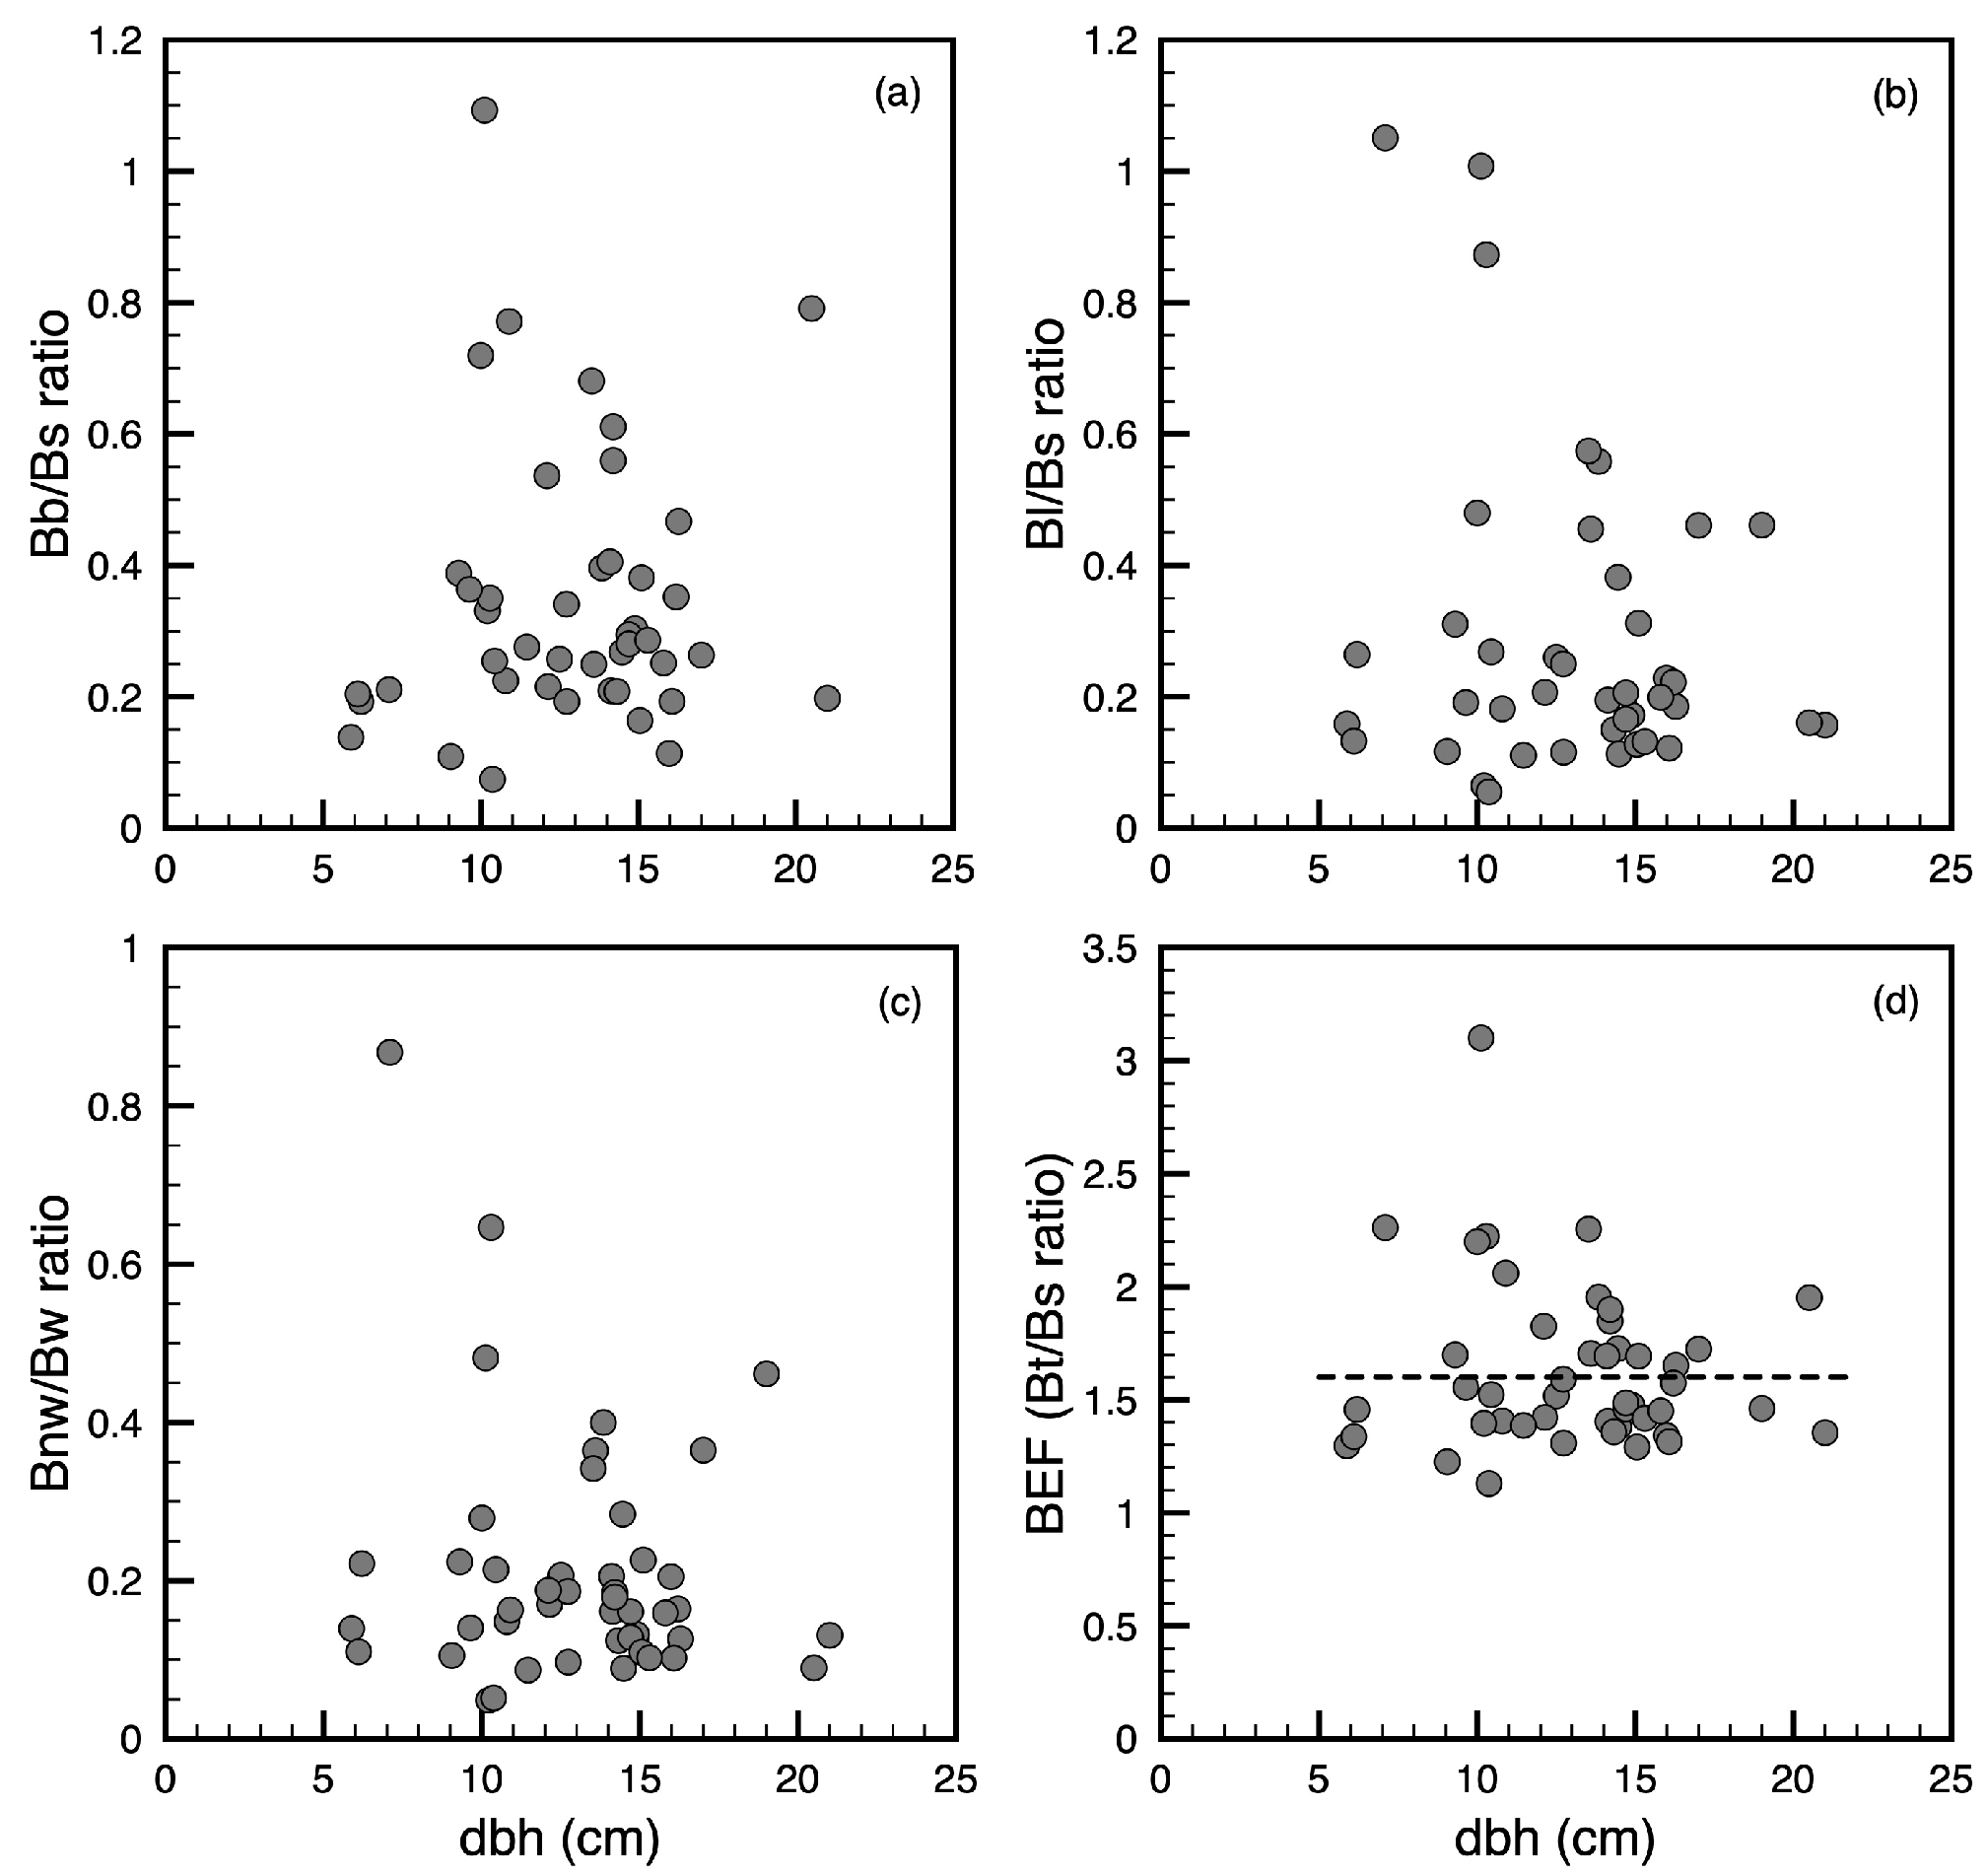
3.2. Biomass Expansion Factor and Other Biomass Ratios

This study revealed that, on average, the biomass of branches constituted 35% of the stem’s biomass, as illustrated in Figure 3a. The biomass of leaves accounted for 29% of the stem’s biomass and 21% of the combined biomass of stems and branches (representing woody components), as shown in Figure 3b and Figure 3c, respectively. Furthermore, the biomass expansion factor (BEF) was calculated to be 1.6, indicating that the total aboveground biomass was 1.6 times the biomass of the stem alone. Notably, there was a slight tendency for the BEF to increase in smaller trees, as depicted in Figure 3d, suggesting variations in biomass distribution patterns across different tree sizes.

3.3. Allometric Biomass Models

The best fitting models to estimate total aboveground and by component biomass were those based on diameter at the breast height (dbh) as the primary predictor (Table 2, Figure 4). Particularly, the best fitting models were those incorporating logarithmic transformations of the variables (Table 2, Figure 4). These models presented the best performance across several statistical metrics, including R2, AdjR2, FI, AIC, BIC, and RMSE (Table 2). The analysis showed that dbh accounted for between 60% and 84% of the observed variability in the biomass of branches, stems, and total biomass. However, for leaf biomass, dbh explained only 44% of the variability (Table 2). The residual analyses support the lack of heteroskedasticity of the best-fitting models, as do the results of the Breusch–Pagan test, which yielded p values between 0.05 and 0.90. Inclusion of CF increased MRE and did not affect ME in logarithmic models (Table 3). This confirms the possibility of developing these types of models without CF.
The best-fitting allometric model to estimate total biomass per five-year-old E. saligna tree planted in the Lower Montane thorny steppe was Ln(B) = −0.952 + 1.97∗Ln(dbh), where B: total aboveground biomass (kg/tree); dbh: diameter at breast height (cm). This model yielded more precise estimates than the models with which it was compared and that were developed for the same species in other regions. The models of Senelwa and Sims [38], Momolli et al. [40], and MacFarlane et al. [39] underestimated, to different degrees, the aboveground biomass of E. saligna, under the conditions of the study site (Figure 5). The best-fitting model in the present investigation estimated the total aboveground biomass as 23.2% of ERM, which was slightly lower than those estimates with the MacFarlane et al. [39] model, but significantly lower than those estimated by the Momolli et al. [40] models and Senelwa and Sims [38], whose ERMs were 29.3, 50.5, and 53.1%, respectively (Figure 5).
The best-fitting allometric model to estimate total biomass per five-year-old E. saligna tree planted in the Lower Montane thorny steppe was Ln(B) = −0.952 + 1.97∗Ln(dbh), where B: total aboveground biomass (kg/tree); dbh: diameter at breast height (cm). This model yielded more precise estimates than the models with which it was compared and that were developed for the same species in other regions. The models of Senelwa and Sims [38], Momolli et al. [40], and MacFarlane et al. [39] underestimated, to different degrees, the aboveground biomass of E. saligna, under the conditions of the study site (Figure 5). The best-fitting model in the present investigation estimated the total aboveground biomass as 23.2% of MRE, which was slightly lower than those estimates with the MacFarlane et al. [39] model but significantly lower than those estimated by the Momolli et al. [40] models and Senelwa and Sims [38], whose MREs were 29.3, 50.5, and 53.1%, respectively (Figure 5). Plantation and climatic conditions, such as solar radiation, may be factors that determine errors in model estimates when used at other sites.

4. Discussion

This research fills a significant gap by developing an allometric model specifically for estimating the biomass of Eucalyptus saligna in Ecuador, particularly within the Lower Montane thorny steppe regions. This study’s unique contribution lies in evaluating widely used generic equations to obtain a model that best fits the specific context, employing diameter at breast height (dbh) as the sole variable. This model represents an advance for biomass and carbon studies in this species in Ecuador and is particularly simple since it only uses dbh, data that are easy to measure and commonly found in forest inventories [29,62,63,64,65].
Further, the diameter at breast height (dbh) demonstrated the strongest correlation with the total aboveground biomass of individual E. saligna trees across all evaluated allometric models. This finding aligns with numerous researchers’ observations, noting a significant correlation between dbh and biomass, achieving highly satisfactory model fits [29,63,64,65]. Conversely, height variables, both total height and height to the live crown, did not serve as reliable predictors for the total aboveground biomass of E. saligna trees. This discrepancy may be attributed to silvicultural practices such as pruning, which could have influenced the trees’ structural development. Such patterns observed in this study are consistent with those reported in various research efforts involving other forest species, highlighting the consistent relationship between dbh and biomass across different contexts [29,50,65,66,67,68,69,70].
A higher BEF in small trees has been demonstrated by several authors [70,71,72], indicating a priority towards the crown in biomass allocation. As trees grow, stem biomass becomes increasingly important, changing the carbon components. Biomass allocation, represented in the biomass ratios, is an indicator of carbon permanence. By having low values of biomass ratio of various components in relation to that of the stem, the permanence of carbon in forest products, ideally long-lived, is increased. This is achieved by increasing tree size.
The allometric models that demonstrated the most accurate fit for estimating biomass incorporated logarithmic transformations, effectively addressing potential issues related to variance heteroskedasticity and enhancing model precision [29,69,70]. The results show a better fit of models without CF, which is congruent with models developed by some authors [35,50]. Further, the specific allometric models generated in the present research offer estimates of the aboveground biomass of individual E. saligna trees with greater precision than models built in other regions and general models [29,65,70,73]. Several authors have reported the need to develop species-specific and local biomass allometric models to reduce uncertainty in biomass and carbon estimates [29,65,74,75,76,77,78].
Specifically, the estimation of the total aboveground biomass of individual E. saligna trees with the allometric model generated in this research shows an exceptional fit compared to the one presented by MacFarlane et al. [39] with the same species in Kenya when developing models with a non-destructive technique, as well as models developed by Momolli et al. [40] and Senelwa and Sims [38]. The performance of the developed models to estimate total aboveground biomass is greater than those for biomass by components. However, the latter are important tools for estimating biomass of components in nutrient cycling studies [79,80].
In the context of advancing E. saligna biomass and production models in Ecuador, several avenues for future research emerge. Enhancing the precision of allometric models could involve integrating additional factors such as tree age, health, and specific environmental conditions, potentially refining biomass estimations and broadening the model’s utility across varied Ecuadorian landscapes. Comparative studies assessing E. saligna biomass in different climatic and geographical settings within Ecuador could clarify the model’s adaptability and the environmental determinants of biomass development. Also, investigating the carbon sequestration capacity of E. saligna, utilizing the refined allometric models, could yield valuable contributions to climate change mitigation efforts. Further, examining the influence of diverse silvicultural practices on E. saligna’s biomass growth could provide essential insights for optimizing forest management strategies to maximize carbon sequestration and timber production. Finally, the validation and calibration of these allometric models against independent datasets from analogous ecological zones or other regions are needed to verify their robustness and reliability, ensuring their applicability in broader scientific and practical contexts. We suggest that a validation of this model be carried out with larger trees and at other sites to conclude if it can be applied to a much larger area. BEF is another important tool developed in this research, which is a key to estimate total aboveground biomass based on trunk volume from inventories [35,72].

5. Conclusions

In conclusion, the allometric models developed to estimate biomass five-year-old E. saligna are notable for their simplicity and practicality in using only the diameter at breast height (dbh) as an independent variable, in addition to their high levels of fit and precision. This high degree of accuracy establishes these models as dependable tools for quantifying biomass production capabilities of individual components within E. saligna plantations, particularly in the ecological context of the subtropical Lower Montane thorny steppe regions. Moreover, the recommended allometric model to estimate total aboveground biomass in E. saligna plantations in Ecuadorian Lower Montane regions confirms the importance of generating specific allometric models for each phytogeographic province to provide precision in biomass estimates. The development and use of local models is a good and recommended practice to estimate the ABG with a lower uncertainty. The BEF developed here is also a key tool for use when inventory data are available. This model is a key tool for carbon capture for multiple purposes related to forest inventories, the calculation of national emissions, and the forest development strategies of the country.

Author Contributions

Conceptualization, R.R.-V. and H.J.A.; methodology, R.R.-V., M.S. and P.P.-P.; formal analysis, H.J.A., R.R.-V. and R.V.-V.; investigation, R.R.-V., P.P.-P. and J.E.-P.; data curation, H.J.A. and R.V.-V.; writing—original draft preparation, R.R.-V., H.J.A., R.V.-V., J.E.-P., M.S. and J.G.-O.; writing—review and editing, R.R.-V., H.J.A., R.V.-V., J.E.-P., M.S. and J.G.-O. All authors have read and agreed to the published version of the manuscript.

Funding

This research was funded by the National Secretariat of Science, Technology, and Innovation of Ecuador (SENESCYT) and the National Institute of Farming Research in Ecuador, grant number PC-13-INIAP/K058.

Data Availability Statement

Data are available upon request from the corresponding author.

Acknowledgments

Funding for this research was granted by the SENESCYT. The authors thank the National Institute of Agricultural Research, specifically the Santa Catalina Experimental Stations, the Faculty of Natural Resources of the ESPOCH, the students of the subject forestry at ESPOCH period of April–August 2018, and the University of Tolima, Colombia; the Central University of Ecuador; and the University of Saskatchwan, Canada, for all their contributions in the different phases of research development and dissemination. Finally, we thank Benjamin Hudock, an American Peace Corps Volunteer in Ecuador, for proofreading the English language version of the manuscript in the correction process sent by the reviewers.

Conflicts of Interest

The authors declare no conflicts of interest.

References

  1. UN Environment Program, UNEP. Annual Report UNEP 2022; The Global Authority for the Environment with Programs Focusing on Climate, Nature, Pollution, Sustainable Development; UNEP: Nairobi, Kenia, 2023; Available online: https://reliefweb.int/report/world/unep-2022?gclid=Cj0KCQjwib2mBhDWARIsAPZUn_lpAGFnd5tTDqYtc76C_BcGF7Z4oFV7tHUzbKjLdYA9HJIE-GhtZhYaAsV3EALw_wcB (accessed on 23 April 2023).
  2. Reyns, W.; Rineau, F.; Spaak, J.W.; Franken, O.; Berg, M.P.; Van der Plas, F.; Bardgett, R.D.; Beenaerts, N.; De Laender, F. Food web uncertainties influence predictions of climate change effects on soil carbon sequestration in heathlands. Microb. Ecol. 2020, 79, 686–693. [Google Scholar] [CrossRef]
  3. Costello, A.; Mustafa, A.; Adriana, A.; Sarah, B.; Sarah, B.; Richard, B.; Sharon, F.; Nora, G.; Anne, J.; Maria, K.; et al. Managing the health effects of climate change. Lancet and University College London Institute for Global Health Commission. Lancet 2009, 373, 1693–1733. Available online: https://www.researchgate.net/publication/40724209_Managing_the_Health_Effects_of_Climate_Change (accessed on 14 August 2023). [PubMed]
  4. Favier, T.; Ceballos, M.; Dehesa, L.; Veranes, M. Efectos del cambio climático en la salud. Rev. Inf. Cient. 2019, 98, 272–282. Available online: https://revinfcientifica.sld.cu/index.php/ric/article/view/2276 (accessed on 10 February 2024).
  5. Ojeda, R.; Murray, G. La huella del cambio climático en la vida. Rev. Digit. Univ. (Rdu) 2023, 24, 1–11. [Google Scholar] [CrossRef]
  6. Intergovernmental Panel on Climate Change (IPCC). Cambio Climático 2023: Informe de Síntesis; Informe del Panel Intergubernamental sobre Cambio Climático. Contribución de los Grupos de Trabajo I, II y III al Sexto Informe de Evaluación del Panel Intergubernamental sobre Cambio Climático [Equipo central de redacción]; Lee, H., Romero, J., Eds.; IPCC: Ginebra, Switzerland, 2023; Available online: https://www.ipcc.ch/report/ar6/syr/downloads/report/IPCC_AR6_SYR_SPM.pdf (accessed on 10 January 2024).
  7. Intergovernmental Panel on Climate Change (IPCC). Summary for Policymakers. In Climate Change 2021: The Physical Science Basis. Contribution of Working Group I to the Sixth Assessment Report of the Intergovernmental Panel on Climate Change; Masson-Delmotte, V., Zhai, P., Pirani, A., Connors, S.L., Péan, C., Berger, S., Caud, N., Chen, Y., Goldfarb, L., Gomis, M.I., et al., Eds.; IPCC: Ginebra, Switzerland, 2021; Available online: https://www.ipcc.ch/report/ar6/wg1/downloads/report/IPCC_AR6_WGI_SPM_final.pdf (accessed on 23 April 2023).
  8. Intergovernmental Panel on Climate Change (IPCC). Cambio Climático 2014: Mitigación del Cambio Climático. Resumen para Responsables de Políticas. Contribución del Grupo de trabajo III al Quinto Informe de Evaluación del Grupo Intergubernamental de Expertos sobre el Cambio Climático; IPCC: Ginebra, Switzerland, 2015; Available online: https://www.ipcc.ch/site/assets/uploads/2018/03/WGIIIAR5_SPM_TS_Volume_es-1.pdf (accessed on 14 August 2023).
  9. Waring, B.; Neumann, M.; Prentice, I.C.; Adams, M.; Smith, P.; Siegert, M. Forests and Decarbonization—Roles of Natural and Planted Forests. Front. For. Glob. Change 2020, 3, 1–6. [Google Scholar] [CrossRef]
  10. Samaniego, J.; Lorenzo, S.; Rondón, E.; Krieger, L.; Herrera, J.; Rouse, P.; Harrison, N. Soluciones Basadas en la Naturaleza y Remoción de Dióxido de Carbono; Documentos de Proyectos (LC/TS.2022/224); Comisión Económica para América Latina y el Caribe (CEPAL): Santiago, Chile, 2022; Available online: https://repositorio.cepal.org/bitstream/handle/11362/48615/1/S2201074_es.pdf (accessed on 14 August 2023).
  11. Constitución de la República del Ecuador. Ciudad Alfaro: Asamblea Constituyente. Ecuador. 2008. Available online: https://www.oas.org/juridico/pdfs/mesicic4_ecu_const.pdf (accessed on 14 February 2025).
  12. MAE. National Biodiversity Strategy and Its Action Plan 2016–2030; Ministry of the Environment of Ecuador (MAE): Quito, Ecuador, 2016; Available online: https://www.cbd.int/doc/world/ec/ec-nbsap-v2-p01-es.pdf (accessed on 6 August 2023).
  13. Lewis, S.L.; Lopez, G.G.; Sonké, B.; Affum, K.B.; Baker, T.R.; Ojo, L.O.; Phillips, O.L.; Reitsma, J.M.; White, L.; Comiskey, J.A.; et al. Increasing carbon storage in intact African tropical forests. Nat. Lett. 2009, 457, 1003–1007. [Google Scholar] [CrossRef]
  14. Pandey, S.S.; Maraseni, T.N.; Cockfield, G. Carbon stock dynamics in different vegetation dominated community forests under REDD+: A case from Nepal. For. Ecol. Manag. 2014, 327, 40–47. [Google Scholar] [CrossRef]
  15. Yadav, R.P.; Bisht, J.K.; Bhatt, J.C. Biomass, carbon stock under different production systems in the mid hills of Indian Himalaya. Trop. Ecol. 2017, 58, 15–21. [Google Scholar]
  16. Food and Agricultural Organization (FAO). Plantations and Wood Energy; Report Based on the Work of D. J. Mead; Forest Plantation Thematic Papers, Working Paper 5; FAO: Rome, Italy, 2001; 20p. [Google Scholar]
  17. Guariguata, M.; Arce, J.; Ammourt, T.; Capella, J. Las Plantaciones Forestales en el Perú: Reflexiones, Estatus Actual y Perspectivas a Futuro; Documento Ocacional 169; CIFOR: Bogor, Indonecia, 2017. [Google Scholar]
  18. Castillo, V.D.; Gavilanes, M.A. Challenges Faced by the Ecuadorian Forests and Forest Industry. Rev. Pădurilor 2020, 135, 1–56. [Google Scholar]
  19. Corporación Financiera Nacional. Ficha Sectorial: Explotación de Viveros Forestales y Madera en pie; Corporación Financiera Nacional: Quito, Ecuador, 2017; Available online: https://www.cfn.fin.ec/wp-content/uploads/2017/10/Ficha-Sectorial-Viveros-y-Madera-en-Pie.pdf (accessed on 14 August 2023).
  20. Food and Agricultural Organization (FAO). El Eucalipto en la Repoblación Forestal; Colección FAO: Montes, Roma, 1981. [Google Scholar]
  21. Food and Agricultural Organization (FAO). The State of Food Insecurity in the World; Food and Agriculture Organization of the United Nations: Rome, Italy, 2001. [Google Scholar]
  22. Kasekete, D.K.; Ligot, G.; Mweru, J.P.; Drouet, T.; Rousseau, M.; Moango, A.; Bourland, N. Growth, Productivity, Biomass and Carbon Stock in Eucalyptus saligna and Grevillea robusta Plantations in North Kivu, Democratic Republic of the Congo. Forests 2022, 13, 1508. [Google Scholar] [CrossRef]
  23. Turnbull, J.W. Eucalypt plantations. New For. 1999, 17, 37–52. Available online: https://link.springer.com/article/10.1023/A:1006524911242 (accessed on 18 August 2023). [CrossRef]
  24. Restrepo, C.; Alviar, M. Tasa de descuento y rotación forestal: El caso del Eucalyptus saligna. Lect. Econ. 2010, 73, 149–164. Available online: http://www.scielo.org.co/scielo.php?script=sci_arttext&pid=S0120-25962010000200006&lng=en&tlng=es (accessed on 5 May 2023). [CrossRef]
  25. Boland, J.; Brooker, M.; Chippendale, G.; Hall, N.; Hyland, B. Forest Trees of Australia; CSIRO: Melbourne, Australia, 1984. [Google Scholar]
  26. Jovanovic, T.; Booth, T. Improved Species Climatic Profiles: A Report for the RIRDC/L&W Australia/FWPRDC/MDBC Joint Venture Agroforestry Program; RIRDC Publication: Hobart, Australia, 2002. [Google Scholar]
  27. Henry, M.; Besnard, A.; Asante, W.A. Wood density, phytomass variations within and among trees, and allometric equations in a tropical rainforest of Africa. For. Ecol. Manag. 2010, 260, 1375–1388. Available online: https://www.sciencedirect.com/science/article/abs/pii/S037811271000424X (accessed on 22 February 2023). [CrossRef]
  28. Wang, Z.; Liu, L.; Peng, D.; Liu, X.; Zhang, S.; Wang, Y. Estimating woody aboveground biomass in an area of agroforestry using airborne light detection and ranging and compact airborne spectrographic imager hyperspectral data: Individual tree analysis incorporating tree species information. J. Appl. Remote Sens. 2016, 10, 036007. Available online: https://spie.org/Publications/Journal/10.1117/1.JRS.10.036007 (accessed on 2 March 2024). [CrossRef]
  29. Zhao, D.; Kane, M.; Markewitz, D.; Teskey, R.; Clutter, M. Additive tree biomass equations for midrotation loblolly pine plantations. For. Sci. 2015, 61, 613–623. [Google Scholar] [CrossRef]
  30. Picard, N.; Saint-André, L.; Henry, M. Manual de Construcción de Ecuaciones Alométricas para Estimar el Volumen y la Biomasa de los árboles: Del Trabajo de Campo a la Predicción; Las Naciones Unidas para la Alimentación y la Agricultura y el Centre de Coopération Internationale en Recherche Agronomique pour le Développement: Rome, Italy; Montpellier, France, 2012; 223p, Available online: http://www.globallometree.org/media/cms_page_media/6/tarifs_sp_web_19jun.pdf (accessed on 2 March 2023).
  31. Schlegel, B.; Gayoso, J.; Guerra, J. Manual de Procedimientos para Inventarios de Carbono en Ecosistemas Forestales; Proyecto FONDEF D98I1076; Universidad Austral de Chile: Santiago de Chile, Chile, 2001. [Google Scholar]
  32. Risio, A.L.; Bravo, F.; Bogino, S. Cuantificación de Biomasa y Carbono en Bosques Nativos de Prosopis caldenia (Burkhart) en la Pampa Semiárida Argentina. 2012. Available online: https://uvadoc.uva.es/bitstream/handle/10324/1593/TFM-L%2043.pdf?sequence=1&isAllowed=y (accessed on 23 April 2023).
  33. Henry, M.; Bombelli, A.; Trotta, C.; Alessandrini, A.; Birigazzi, L.; Sola, G.; Vieilledent, G.; Santenoise, P.; Longuetaud, F.; Valentini, R.; et al. GlobAllomeTree: International platform for tree allometric equations to support volume, biomass and carbon assessment. iFor. Biogeosci. For. 2013, 6, 326–330. Available online: https://iforest.sisef.org/pdf/?id=ifor0901-006 (accessed on 5 August 2022). [CrossRef]
  34. Martínez, L.A.; De los Santos, H.M.; Fierros, A.M.; Fierros, R.M.; Pérez, R.M.; Hernández, A.R.; Hernández, J.R. Factores de expansión y sistema de partición de biomasa aérea para Pinus chiapensis (Martínez) Andresen. Rev. Mex. Cienc. For. 2018, 10, 1–26. [Google Scholar] [CrossRef]
  35. Andrade, H.J.; Segura, M.; Somarriba, E. Above-ground biomass models for dominant trees species in cacao agroforestry systems in Talamanca, Costa Rica. Agrofor. Syst. 2022, 96, 787–797. [Google Scholar] [CrossRef]
  36. Hassan, A.; Jahangir, M.; Shaban, S.J. Allometric Models and Biomass Conversion and Expansion Factors to Predict Total Tree-level Aboveground Biomass for Three Conifers Species in Iran. For. Sci. 2023, 69, 355–379. [Google Scholar]
  37. Magalhães, T.M.; Mate, R.S. Least squares-based biomass conversion and expansion factors best estimate biomass tan ratio-based ones: Statistical evidences based on tropical timber species. MethodsX 2018, 5, 30–38. [Google Scholar] [CrossRef]
  38. Senelwa, K.; Sims, R. Tree biomass equations for short rotation eucalypts grown in New Zealand. Biomass Bioenergy 1998, 13, 133–140. Available online: https://www.sciencedirect.com/science/article/abs/pii/S0961953497000263 (accessed on 24 October 2022). [CrossRef]
  39. MacFarlane, D.W.; Kuyah, S.C.; Mulia, R.M.; Dietz, J.; Muthuri, C.; Noordwijk, M.V. Evaluating a non-destructive method for calibrating tree biomass equations derived from tree branching architecture. Trees 2014, 28, 807–817. [Google Scholar] [CrossRef]
  40. Momolli, D.R.; Valdir, M.; Ludvichak, A.A.; Araújo, A.A. Modeling and Biomass Quantification in Euc alyptus saligna Smith Stand at the End Rotation in the South of Brazil. J. Exp. Agric. Int. 2019, 33, 1–10. [Google Scholar] [CrossRef]
  41. Ngomanda, A.; Obiang, N.L.; Lebamba, J.; Mavouroulou, Q.; Gomat, H.; Mankou, G.S.; Loumeto, J.; Midoko, D.; Kossi, F.; Zinga, K.R.; et al. Site-specifc versus pantropical allometric equations: Which option to estimate the biomass of a moist central African forest? For. Ecol. Manag. 2014, 312, 1–9. Available online: https://www.sciencedirect.com/science/article/abs/pii/S0378112713007160 (accessed on 18 August 2023). [CrossRef]
  42. Intergovernmental Panel on Climate Change (IPCC). Guidelines for National Greenhouse Gas Inventories; Institute for Global Environmental Strategies (IGES): Tokyo, Japan, 2006; Available online: https://www.ipcc-nggip.iges.or.jp/public/2006gl/ (accessed on 23 April 2023).
  43. Lott, J.E.; Howard, S.B.; Black, C.R.; Ong, C.K. Allometric estimation of above-ground biomass and leaf area in managed Grevillea robusta agroforestry systems. Agrofor. Syst. 2000, 49, 1–15. [Google Scholar] [CrossRef]
  44. Albrecht, A.; Kandji, S.T. Carbon sequestration in tropical agroforestry systems. Agric. Ecosyst. Environ. 2003, 99, 15–27. [Google Scholar] [CrossRef]
  45. Holdridge, L.R. Ecología Basada en Zonas de Vida; Instituto Interamericano de Cooperación para la Agricultura: San José, Costa Rica, 1982; pp. 8–12. [Google Scholar]
  46. Vera, R.V.; Grijalva, J.O.; Ramos, R.V.; Sigcha, F.M.; Limongi, R.A. Respuesta de tres especies maderables de rápido crecimiento a diferentes bioclimas en Ecuador. Trop. Subtrop. Agroecosyst. 2023, 12, 1–10. [Google Scholar] [CrossRef]
  47. Guilcapi, B.D. Estudio de Adaptabilidad de Tres Especies Forestales del Género Paulownia (P. elongata, P. fortunei, y el híbrido P. elongata × P. fortunei) A las Condiciones de sitio “Estepa Espinosa” de Tunshi, Cantón Riobamba, Provincia de Chimborazo. Bechelor’s Thesis, Escuela Superior Politécnica de Chimborazo, Facultad de Recursos Naturales, Escuela de Ingeniería Agronómica, Riobamba, Ecuador, 2015. Available online: http://dspace.espoch.edu.ec/handle/123456789/3954 (accessed on 22 February 2022).
  48. Segura, M.; Andrade, H. ¿Cómo construir modelos alométricos de volumen, biomasa o carbono de especies leñosas perennes? Agrofor. Am. 2008, 46, 89–96. [Google Scholar]
  49. Fonseca, W.; Alice, F.; Rey, J.B. Modelos para estimar la biomasa de especies nativas en plantaciones y bosques secundarios en la zona Caribe de Costa Rica. Bosque 2009, 30, 36–47. [Google Scholar] [CrossRef]
  50. Sione, S.; Silvia, G.; Rosenberger, L.J.; Oszust, J.D.; Andrade, H.J.; Castañeda, G.O.; Wilson, M.G.; Sasal, M.C. Ecuaciones alométricas de biomasa aérea para Prosopis nigra (Griseb.) Hierón. “Algarrobo negro” (fabaceae) en bosques de entre Ríos (Argentina). Rev. Fac. Agron. UBA 2020, 40, 63–76. [Google Scholar]
  51. Piñeiro, G.; Perelman, S.; Guerschman, J.P.; Paruelo, J.M. How to evaluate models: Observed vs. predicted or predicted vs. observed? Ecol. Model. 2008, 216, 316–322. [Google Scholar] [CrossRef]
  52. Loetsch, F.; Zohrer, F.; Haller, K.E. Forest Inventory; BLV Verlagsgesellschaft: Munich, Germany, 1973. [Google Scholar]
  53. Cifuentes, J.M.; Henry, M.; Réjou, M.; Wayson, C.; Zapata, M.; Piotto, D.; Guie, A.G.; Alicer, F.; Castañeda, L.H.; Castellanos, L.E.; et al. Guidelines for documenting and reporting tree allometric equations. Ann. For. Sci. 2015, 72, 763–768. Available online: https://annforsci.biomedcentral.com/articles/10.1007/s13595-014-0415-z (accessed on 24 November 2024). [CrossRef]
  54. Correia, A.C.; Faias, S.P.; Ruiz, P.R.; Chianucci, F.; Cutini, A.; Fontes, L.; Manetti, M.C.; Montero, G.; Soares, P.; Tomé, M. Generalized biomass equations for Stone pine (Pinus pinea L.) across the Mediterranean basin. For. Ecol. Manag. 2018, 429, 425–436. [Google Scholar] [CrossRef]
  55. Sanquetta, C.R.; Dalla, C.A.; Behling, A.; Oliveira, L.R.; Péllico, S.; Rodrigues, A.L.; Inoue, M.N. Selection criteria for linear regression models to estimate individual tree biomasses in the Atlantic Rain Forest, Brazil. Carbon Balance Manag. 2018, 13, 1–15. [Google Scholar] [CrossRef] [PubMed]
  56. Hammer, Ø.; Harper, D.A.; Ryan, P.D. PAST: Paleontological Statistics Software package for education and data analysis. Paleontol. Electron. 2001, 4, 1–9. Available online: https://n9.cl/nb7vmt (accessed on 14 August 2023).
  57. Clutter, J.L.; Fortson, J.C.; Pienaar, L.V.; Brister, G.H.; Bailey, R.L. Timber Management: A Quantitative Approach; Wiley: New York, NY, USA, 1983. [Google Scholar]
  58. Sileshi, G.W. A critical review of forest biomass estimation models, common mistakes and corrective measures. For. Ecol. Manag. 2014, 329, 237–254. [Google Scholar] [CrossRef]
  59. Van, B.M.; Ransijn, J.; Craven, D.; Bongers, F.; Hall, J.S. Estimating carbon stock in secondary forests: Decisions and uncertainties associated with allometric biomass models. For. Ecol. Manag. 2011, 262, 1648–1657. [Google Scholar]
  60. Baskerville, G.L. Use of Logarithmic Regression in the Estimation of Plant Biomass. Can. J. For. Res. 1972, 2, 49–53. [Google Scholar] [CrossRef]
  61. Sprugel, D.L. Correcting for bias in log-transformed allometric equations. Ecology 1983, 64, 209–210. [Google Scholar] [CrossRef]
  62. Clifford, D.; Cressie, N.; England, J.R.; Roxburgh, S.H.; Paul, K.I. Correction factors for unbiased, efficient estimation and prediction of biomass from log–log allometric models. For. Ecol. Manag. 2013, 310, 375–381. [Google Scholar] [CrossRef]
  63. Dossa, E.; Fernández, E.C.; Reid, W.S.; Ezui, K. Above-and belowground biomass, nutrient and carbon stocks contrasting an open-grown and a shaded coffee plantation. Agrofor. Syst. 2008, 72, 103–115. [Google Scholar] [CrossRef]
  64. Intergovernmental Panel on Climate Change (IPCC). Cambio Climático 2013: Bases Físicas. Contribución del Grupo de Trabajo I al Quinto Informe de Evaluación del Grupo Intergubernamental de Expertos Sobre el Cambio Climático; IPCC: Ginebra, Switzerland, 2013. [Google Scholar]
  65. Kalkanlı Genç, S.; Diamantopoulou, M.J.; Özçelik, R. Tree Biomass Modeling Based on the Exploration of Regression and Artificial Neural Networks Approaches. Forests 2023, 14, 2429. [Google Scholar] [CrossRef]
  66. Quirós, S. Modelos de Volumen Comercial, Perfil de Fuste y Crecimiento Para Plantaciones Clonales de Gmelina Arborea Roxb., ex Sm., en Costa Rica. Bechelor’s Thesis, Ingeniería Forestal, Instituto Tecnológico de Costa Rica, Cartago, Costa Rica, 2015. Available online: https://repositoriotec.tec.ac.cr/bitstream/handle/2238/6659/Modelos_volumen_comercial_perfil_fuste_crecimiento_plantaciones_clonales%20_gmelina_arborea.pdf?sequence=1 (accessed on 23 April 2023).
  67. Jiménez, E.; Fonseca, W.; Pazmiño, L. Sistemas silvopastoriles y cambio climático: Estimación y predicción de biomasa arbórea. Granja Rev. Cienc. Vida 2019, 29, 45–55. [Google Scholar] [CrossRef]
  68. Fonseca, G.W.; Murillo, C.R.; Ávila, A.C.; Rojas, V.M.; Spínola, P.R. Modelos de biomasa y carbono para árboles de Gmelina arborea en plantaciones clonales. Rev. Cienc. Ambient. 2021, 55, 143–159. [Google Scholar] [CrossRef]
  69. Chave, J.; Andalo, C.; Brown, S.; Cairns, M.A.; Chambers, J.A.; Eamus, D.; Folster, H.; Fromard, F.; Higuchi, N.; Kira, T.; et al. Tree allometry and improved estimation of carbon stock and balance in tropical forest. Oecological 2005, 145, 87–99. [Google Scholar] [CrossRef]
  70. Segura, M.; Kanninen, M.; Suárez, D. Allometric models for estimating aboveground biomass of shade trees and cofee bushes grown together. Agrofor. Syst. 2006, 68, 143–150. [Google Scholar] [CrossRef]
  71. Brown, S. Estimating Biomass and Biomass Change of Tropical Forests: A Primer; FAO Forestry Paper-134; FAO: Rome, Italy, 1997. [Google Scholar]
  72. Segura, M.; Kanninen, M. Allometric models for tree volume and total aboveground biomass in a tropical humid forest in Costa Rica. Biotropica Sci. J. ATBC 2005, 37, 2–8. [Google Scholar]
  73. Intergovernmental Panel on Climate Change (IPCC). State of Knowledge of Climate Change. Synthesis Report (SYR) of the IPCC Sixth Assessment Report (AR6); IPCC: Ginebra, Switzerland, 2023; Available online: https://www.ipcc.ch/report/sixth-assessment-report-cycle/ (accessed on 6 August 2023).
  74. Ubuy, M.H.; Eid, T.; Bollandsås, O.M.; Birhane, E. Aboveground biomass models for trees and shrubs of exclosures in the drylands of Tigray, northern Ethiopia. J. Arid. Environ. 2018, 156, 9–18. [Google Scholar]
  75. Vorster, A.G.; Evangelista, P.H.; Stovall, A.E.; Ex, S. Variability and uncertainty in forest biomass estimates from the tree to landscape scale: The role of allometric equations. Carbon. Bal. Manag. 2020, 15, 1–20. [Google Scholar] [CrossRef]
  76. Intergovernmental Panel on Climate Change (IPCC). Good Practice Guidance for Land Use, Land-Use Change and Forestry; Penman, J., Gytarsky, M., Hiraishi, T., Krug, T., Kruger, D., Pipatti, R., Buendia, L., Miwa, K., Ngara, T., Tanabe, K., et al., Eds.; IPCC Good Practice Guidance for LULUCF; IPCC: Hayama, Japan, 2003; Volume 4, pp. 113–116. [Google Scholar]
  77. Duncanson, L.; Armston, J.; Disney, M.; Avitabile, V.; Barbier, N.; Calders, K.; Carter, S.; Chave, J.; Herold, M.; Crowther, T.W.; et al. The importance of consistent global forest aboveground biomass product validation. Surv. Geophys. 2019, 40, 979–999. [Google Scholar]
  78. Henry, M.; Cifuentes, J.M.; Réjou-Méchain, M.; Piotto, D.; Michel, F.J.M.; Wayson, C.; Alice, G.F.; Castañeda, L.H.; Castellanos, L.E.; Cuenca, L.R.; et al. Recommendations for the use of tree models to estimate national forest biomass and assess their uncertainty. Ann. For. Sci. 2015, 72, 769–777. [Google Scholar]
  79. MacFarlane, D.W. A generalized tree component biomass model derived from principles of variable allometry. For. Ecol. Manag. 2015, 354, 43–55. [Google Scholar] [CrossRef]
  80. Piza, P.A.; Suárez, J.C.; Andrade, H.J. Litter decomposition and nutrient release in different land use located in Valle del Cauca (Colombia). Agrofor. Syst. 2021, 95, 257–267. [Google Scholar] [CrossRef]
Figure 1. Map showing the Tunshi Experimental Station, part of ESPOCH, located in the Riobamba canton within the Chimborazo province of Ecuador.
Ijpb 16 00039 g001
Figure 2. Correlation between total and component aboveground biomass and the independent dendrometric tree variables of Eucalyptus saligna in Tunshi forestry plantations in Ecuador. Bt: total biomass; Bl: biomass in leaves; Bb: biomass in branches; Bs: biomass in the stem; dbh: diameter at breast height; ht: total height; hlc: height to the live crown; r: Pearson correlation coefficient with its respective probability value (p). *: Significance (p < 0.05); ns: no significance (p ≥ 0.05).
Ijpb 16 00039 g002
Figure 3. Relationships between biomass per components of Eucalyptus saligna in forestry plantations of Tunshi, Ecuador. (a) branch biomass (Bb)/stem biomass (Bs); (b): leaf biomass (Bl)/Bs; (c) non-woody component biomass (Bnw)/woody component biomass (Bw); (d) biomass expansion factor (BEF). Bt: total aboveground biomass; dbh: diameter at breast height.
Ijpb 16 00039 g003
Figure 4. Best fit models for the estimation of total biomass above ground and by components, as well as their corresponding residual graphs, of Eucalyptus saligna in forestry plantations in Tunshi, Ecuador. Bs. bole biomass (kg/tree); Bb: branch biomass (kg/tree); Bl: leaf biomass (kg/tree); Bt: total aboveground biomass (kg/tree); dbh: diameter at breast height.
Ijpb 16 00039 g004
Figure 5. Comparison of the best-fitting model performance (Ln (Bt) = −0.952 + 1.79∗Ln(d) to estimate the total aboveground biomass of Eucalyptus saligna in the forestry plantations of Tunshi, Ecuador, and models from the literature. Bt = 12.442 + 0.000567∗(dbh∗h)2 [40], Bt = 0.00014∗(dbh∗10)2∗h [38], and Bw = 0.035∗dbh2.739 [39].
Ijpb 16 00039 g005
Table 1. Allometric models used for the development of estimation models of the aboveground biomass of individual trees in young Eucalyptus saligna plantations in Ecuador.
No.Allometric Model
1B = a + b∗dbh
2B = a + b∗h
3B = a + b∗dbh + c∗h
4B = a + b∗dbh∗h
5B = a + b∗dbh2
6B = a + b∗d + c∗dbh2
7Ln(B) = a + b∗Ln(dbh)
8B = a + b∗h2
9B = a + b∗d + c∗dbh2∗h
10B = a + b∗dbh + c∗h2
11B = a + b∗dbh2∗h
12B = a + b∗Ln(dbh)
13B = a + b∗dbh2 + c∗dbh2∗h + d∗h
14B = a + b∗Ln(dbh) + c∗Ln(h)
15B = a + b∗dbh2 + c∗dbh∗h + d∗dbh2∗h
16Ln(B) = a + b∗Ln(dbh) + c∗Ln(h)
B: stem, branches, leaves, and total aboveground biomass (kg/tree); dbh: diameter at breast height (cm); h: total height (ht) or to the live crown (hlc) (m); a, b, c, and d: parameters of the equations.
Table 2. Best fitting models, and their statistics, to estimate the total aboveground biomass and per component in individuals of Eucalyptus saligna plantation at 5 years of age in the Lower Montano thorny steppe (Riobamba, Ecuador).
ComponentAllometric ModelStandard ErrorsR2AdjR2AICBICRMSEMSEFIBreusch–Pagan Test (p)
Intercept (a)Slope (b)
StemLn(B) = −1.49 + 2.00∗Ln(dbh)0.130.340.800.8312.0017.500.2580.079.100.90
BranchesLn(B) = −3.63 + 2.37∗Ln(dbh)0.290.740.600.5980.1085.500.5510.325.600.43
LeavesLn(B) = −2.61 + 1.86∗Ln(dbh)0.320.810.400.4391.4096.900.6120.395.000.05
TotalLn(B) = −0.952 + 1.97∗Ln(dbh)0.140.360.800.8117.1022.600.2730.0815.000.41
B: biomass (kg/tree); dbh: diameter at breast height (cm); R2: determination coefficient; AdjR2: adjusted R2; AIC: Akaike Information Criterion; BIC: Bayesian Information Criterion; RMSE: root mean square error; MSE: mean square error; FI: Furnival Index. The metrics were calculated with the logarithmically transformed values.
Table 3. Comparisons of best-fit models, with and without the correction factor (CF), to estimate the total aboveground biomass and per component in individuals of Eucalyptus saligna plantation at 5 years of age in the Lower Montano thorny steppe (Riobamba, Ecuador).
ComponentAllometric ModelMRE (%)ME
StemWith CFB = e(−1.49+2.00∗Ln(dbh))∗1.00220.90.79
Without CFB = e(−1.49+2.00∗Ln(dbh))21.00.79
BranchesWith CFB = e(−3.63+2.37∗Ln(dbh))∗1.04751.00.45
Without CFB = e(−3.63+2.37∗Ln(dbh))53.50.46
LeavesWith CFB = e(−2.61+1.86∗Ln(dbh))∗1.07355.10.26
Without CFB = e(−2.61+1.86∗Ln(dbh))59.40.29
TotalWith CFB = e(−0.952+1.97∗Ln(dbh))∗1.00323.20.80
Without CFB = e(−0.952+1.97∗Ln(dbh))23.30.80
MRE: mean relative error; ME: model efficiency.
Disclaimer/Publisher’s Note: The statements, opinions and data contained in all publications are solely those of the individual author(s) and contributor(s) and not of MDPI and/or the editor(s). MDPI and/or the editor(s) disclaim responsibility for any injury to people or property resulting from any ideas, methods, instructions or products referred to in the content.

