Article

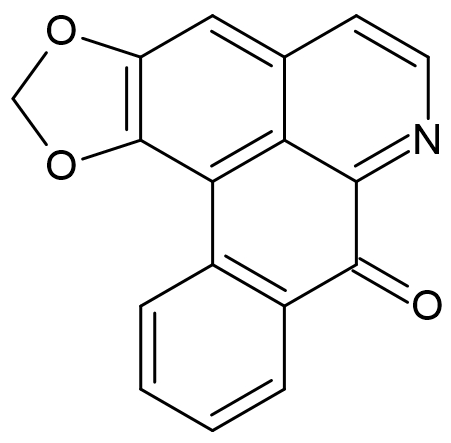
Liriodenine and Its Probable Role as an Osmolyte during Water Stress in Annona lutescens (Annonaceae)

by
Alfredo Cisneros-Andrés
1,2,
Rocío Cruz-Ortega
3,
Marisol Castro-Moreno
2 and
Alma Rosa González-Esquinca
2,*
1
Posgrado en Ciencias Biológicas, Universidad Nacional Autónoma de México, Ciudad de México 04510, Mexico
2
Laboratorio de Fisiología y Química Vegetal, Universidad de Ciencias y Artes de Chiapas, Chiapas 29039, Mexico
3
Instituto de Ecología, Universidad Nacional Autónoma de México, Ciudad de México 04510, Mexico
*
Author to whom correspondence should be addressed.
Int. J. Plant Biol. 2024, 15(2), 429-441; https://doi.org/10.3390/ijpb15020033
Submission received: 18 April 2024 / Revised: 15 May 2024 / Accepted: 16 May 2024 / Published: 22 May 2024

Abstract

:
In tropical deciduous forests (TDFs), plants have developed various strategies to tolerate desiccation during the dry season. One strategy is osmotic adjustment, which includes the accumulation of secondary metabolites. Annona lutescens, a species that inhabits TDFs, increases and accumulates liriodenine alkaloid in its roots during the dry season. In this study, we evaluate the possible role of this molecule as an osmolyte and in pH homeostasis. We performed growth analyses and determined liriodenine concentrations during water stress in Annona lutescens seedlings grown under controlled temperature, water, and light conditions. We also calculated their osmotic adjustment based on pressure–volume curves and performed solubility tests along a pH gradient. Osmotic adjustment was compared between control plants (irrigated) and plants subjected to 15, 25, and 35 days of water stress. Osmotic adjustment was dramatically higher in plants subjected to 35 days of water stress compared to the control. The solubility of liriodenine was 54% at pH 4.5, and when liriodenine was in contact with malic acid solutions, the pH increased slightly. The highest concentration of liriodenine was in the roots, with a significant increase from 540.855 μg g−1 after 15 days of water stress to 1239.897 μg g−1 after 35 days. Our results suggest that liriodenine plays an important role in the response to water stress as an osmolyte and in pH homeostasis.

1. Introduction

Decreases in soil water availability induce a series of biochemical, physiological, and morphological responses in plants, which are manifested in growth rate changes, stomatal closure, decreased photosynthesis rates, solute accumulation, wilting, and leaf senescence [1,2,3]. Water stress increases the abundance of reactive oxygen species (ROS) and secondary metabolites such as terpenes, phenols, and alkaloids [3,4,5,6]. Although essential oils and phenols show variable responses [7,8], compounds such as terpenes [6,9,10], saponins [11], flavonoids [12], and nitrogenous compounds [6,13,14,15] have been consistently found to increase in concentration with water stress.
In some species, alkaloids have been reported to respond to water stress. For example, after five days without irrigation, two-month-old Papaver somniferum seedlings had higher concentrations of alkaloids, specifically morphine (from 7.47 to 31.60 µg/mL), codeine (from 39.32 to 46.15 µg/mL) and narcotine (from 4.84 to 19.12 µg/mL) [16]. Both Briske and Camp (1982) [17] and Kirk et al. (2010) [14] report an increase of up to 4.6-fold in the concentration of pyrrolizidine alkaloids in species of the genus Senecio, and Cakir and Cebi (2010) [13] determined a higher nicotine concentration (2.26% and 2.12% on average) in Nicotiana tabacum plants subjected to severe water stress conditions.
Likewise, in Catharanthus roseus L., indole alkaloids such as ajmalicine, vinblastine, and vincristine increased in concentration during drought [18,19], demonstrating that water deficiency is an essential factor in their accumulation. In several Annonaceae species, such as A. purpurea [20] and A. crassiflora [21], that inhabit areas with rainy and dry seasons, the accumulation of alkaloids is modulated by seasonality, increasing during the dry season.
Aporphine alkaloids are both widespread and abundant among Annonaceae. One of the most common oxoaporphine alkaloids in the family is liriodenine, which has been identified in 240 Annonaceae species [22]. Liriodenine is a yellow needle oxoaporphine; it is fluorescent, plain with an oxo group in position 7 (Figure 1) [23,24] and a molecular weight of 275.26 g/mol. This alkaloid is often used as a representative study model of alkaloids in Annonaceae [25]. Liriodenine has cytotoxic activity and action against fungi, bacteria, protozoa, and phytopathogens [26], as well as catalytic activity, inhibiting the type II topoisomerase enzyme [22]. When Castro-Moreno et al. (2013) [15] evaluated the presence of liriodenine during an annual cycle in young and mature trees of Annona lutescens, they found the highest concentrations in the roots during the dry season, while in the stems and the leaves, the concentration was low, detected at only trace amounts during some months. During the dry season, the roots had levels of liriodenine up to 300 times the concentrations found in the stems and leaves (in adults, from 0.682 to 377.56 μmol g−1 dry weight), while during the rainy season, the concentrations in the roots were less than 70 μmol g−1. These data suggest that the biosynthesis and accumulation of liriodenine in organs such as roots could be a response strategy to deal with water stress [27,28].
In this work, we contribute data that explain why liriodenine accumulates in the roots during water stress and propose the following hypotheses: (1) the liriodenine concentration increases in the roots due to the involvement of these organs in drought tolerance and (2) liriodenine functions as an osmolyte, adding value to the osmotic adjustment (OA) of A. lutescens.

2. Materials and Methods

2.1. Plant Growth Conditions and Treatments

Fruits were collected from A. lutescens trees in the TDF of Villa Las Rosas, Chiapas, Mexico. Three hundred seeds were sown in plastic pots (one seed per pot) with 1.5 kg of clayey, sandy soil collected from the TDF and placed in a bioclimatic chamber with a controlled temperature of 25 °C. The photosynthetically active radiation (PAR) that the seedlings received was 205.2 μmol m−2 s−1 (min 201.1 and max 209) on average, provided by 18 W mercury lamps with a photoperiod of 12 h.
The soil was irrigated with 70 mL of water every third day to maintain the soil moisture between 65% and 75%, monitored with a Delmhorst KS-D1 digital soil moisture meter.
After the plants had grown for four months under these conditions, the plants were randomly assigned to four treatments: control (irrigation continued as described) or 15-day, 25-day, or 35-day water stress treatments, in which irrigation was halted completely for the corresponding length of time. A total of 50 plants were assigned to each water stress treatment and 150 were assigned to the control treatment, such that each water stress group had a corresponding control group of the same size and age. We verified that withholding water for these three time periods induced successive degrees of water stress that resulted in observable physiological changes in the leaves. These three periods/stress levels were decided based on a pilot experiment in which the plants were placed at field capacity and left without watering for 45 days. During that time, we measured the water potential daily at dawn and found that water potential in recently watered plants was less than −0.6 MPa. In plants that had gone 14–16 days without watering, it was less than −1.5 MPa; after 24–25 days without watering, the plants’ water potential was below −2.5 MPa and they showed signs of desiccation; and after 34–36 days, the water potential was below −4 MPa. The minimum water potential that can be measured by the pump used was −4.5 Mpa, so plants were not measured or considered for this experiment after 45 days without watering.

2.2. Net CO2 Assimilation (An), Stomatal Conductance (gs) and Growth Analysis

The values of An and gs were measured between 12:00 and 14:00 h. We chose this time period because assimilation curves generated prior to the experiment using a portable photosynthesis system equipped with an infrared gas analyzer (IRGA) LI-6400XT indicated that this was the time of day with the highest assimilation rates. The measurements were made at an average ambient CO2 concentration of 389.401 ± 39.062 μmol m−2 s−1. The chamber temperature was 25 °C, and the airflow was 500 μmol m−1. Fifty random measurements of stressed and control plants were taken at each level of water stress. The parameters An and gs were considered sufficient to determine if the plants were experiencing some degree of stress.
Measurements of biomass and leaf area and analysis of relative growth were conducted at three distinct points in the experiment: at the outset (0 days), at 20 days, and at 30 days. During the pilot test to determine the stress periods described above, we observed that at 40 days without watering, the plants began to desiccate, presenting leaf rolling and foliar abscission. After data collection, a comprehensive analysis was performed, yielding the corresponding indicators of RGR (relative growth rate), LAR (leaf area ratio), NAR (net assimilation rate), ARG (relative growth area), SLA (specific leaf area), and R/S (root/stem ratio). These calculations were based on the methods proposed by Hunt and Cornelissen in 1997 [29].

2.3. Pressure–Volume Curves

Six pressure–volume curves of the aerial parts of stressed plants and control plants were constructed for each level of water stress via the free transpiration method proposed by Tyree and Hammel (1972) [30], which simulates the natural dehydration of plants using a Scholander pump pressure chamber, PMS 600. We calculated the following components of the water potential (Ψ) from the curves: the modulus of elasticity (ε) and relative water content (RWC), the osmotic potential at full turgor (π100), and turgor 0 (π0).
We estimated the osmotic potential of the seedlings at the total turgor (X100) and at the turgor loss point (tlp). The RWC at the turgor loss point (RWCtlp) and the apoplastic water fraction (AWF) were calculated as described by Wilson et al. (1980) [31]. The symplastic solute content (NsPV) was calculated based on the formula NsPV = (−X100 × (TW − DW) × (100 − AWF)/100)/(R × T), where X100 is the total turgor, TW is the turgid weight, DW is the dry weight, AWF is the relative water content, R is the universal gas constant, and T is the absolute temperature of the leaf. The relative content of symplastic solutes (RNsPV) was calculated by dividing NsPV by the dry weight. The osmotic adjustment was calculated as OA = Δπ100 pE − Δπ100 pC, where pE is stressed plants and pC is control plants.

2.4. Liriodenine Content

A selective acid–base extraction [32] was performed on dried and ground leaves, stems, and roots. Each tissue was extracted in quintuplicate, collecting the tissues of three plants for each replicate for each water stress treatment and its respective control. The samples were impregnated with 30 mL of a saturated Na2CO3 solution, then they were dried at room temperature for approximately 48 h. Once dry, the alkaloids were extracted with 30 mL of CHCl3 and constant stirring for one hour. Each sample was filtered with Whatman #1 filter paper. The chloroform phase was extracted with 20 mL of 1N HCl. The acid phase was preserved, made alkaline with Na2CO3 to pH 9, and extracted again with 10 mL of CHCl3. Finally, it was filtered and evaporated in a rotary evaporator at 60 °C, thus obtaining extracts of total alkaloids. Liriodenine concentrations were then quantified using UV detection at 254 nm [22] using a spectrophotometer (Thermo Electron Corporation, Genesys 10 UV-visible, Madison, WI, USA) and a standard curve of liriodenine concentration.

2.5. Liriodenine Test and HCl Solubility

The solubility of the liriodenine alkaloid at different pH values (using HCl to adjust the pH in the solutions) was determined. We also evaluated the pH regulation in the solutions. The pH measurements were carried out with a Thermo-Scientific TM Orion 3-star portable pH meter.
The following test was used to determine if the liriodenine alkaloid solubility allows it to enter the vacuole [33]: A stock solution of 25 mL of 1 M HCl with pH ~0 was diluted with a saturated aqueous solution of sodium carbonate to generate a pH gradient from ~0 to 8. Then, 1 mg of liriodenine was added to each solution of the pH gradient and homogenized with a vortex mixer. An absorbance curve was constructed using a Genesys 10 UV-visible spectrophotometer, and the amount of dissolved liriodenine was determined for each pH value. Methanol was used as a reference, since liriodenine is highly soluble in it [22].

2.6. Test of pH Regulation by Liriodenine in Malic Acid

Malic acid was dissolved in distilled water to generate a pH gradient; the initial concentration of malic acid was 0.00106 N, which resulted in a pH of 3.22. Successive dilutions resulted in pH values of 3.56 and 4.01. To each malic acid solution, we added 2.5 mg of liriodenine per 5 mL of solution, homogenized with a vortex mixer, and measured the final pH of the solution.

2.7. Statistical Analysis

Differences among the three water stress treatments and the control in the parameters generated in the pressure–volume curves, the An concentrations, the growth parameters, the liriodenine concentration, and the pH regulation of liriodenine in malic acid were evaluated using Kruskal–Wallis tests, followed by pairwise Mann–Whitney tests when significant (p ≤ 0.05) using the software Past 3.18 [34]. In addition, we performed linear regressions to determine the relationships between liriodenine accumulation and osmotic adjustment and between liriodenine solubility and pH. In order to determine how the liriodenine content changes during water stress in the plant tissues measured, we performed non-metric multidimensional scaling (NMDS) based on the Bray–Curtis similarity index.

3. Results

The seedlings showed gradual phenotypic changes during the progression of water stress. At 15 days, there were mild changes in their coloration; at 25 days, the leaves began to curl and wilting began; and at 35 days, leaf senescence and abscission occurred (Figure 2).

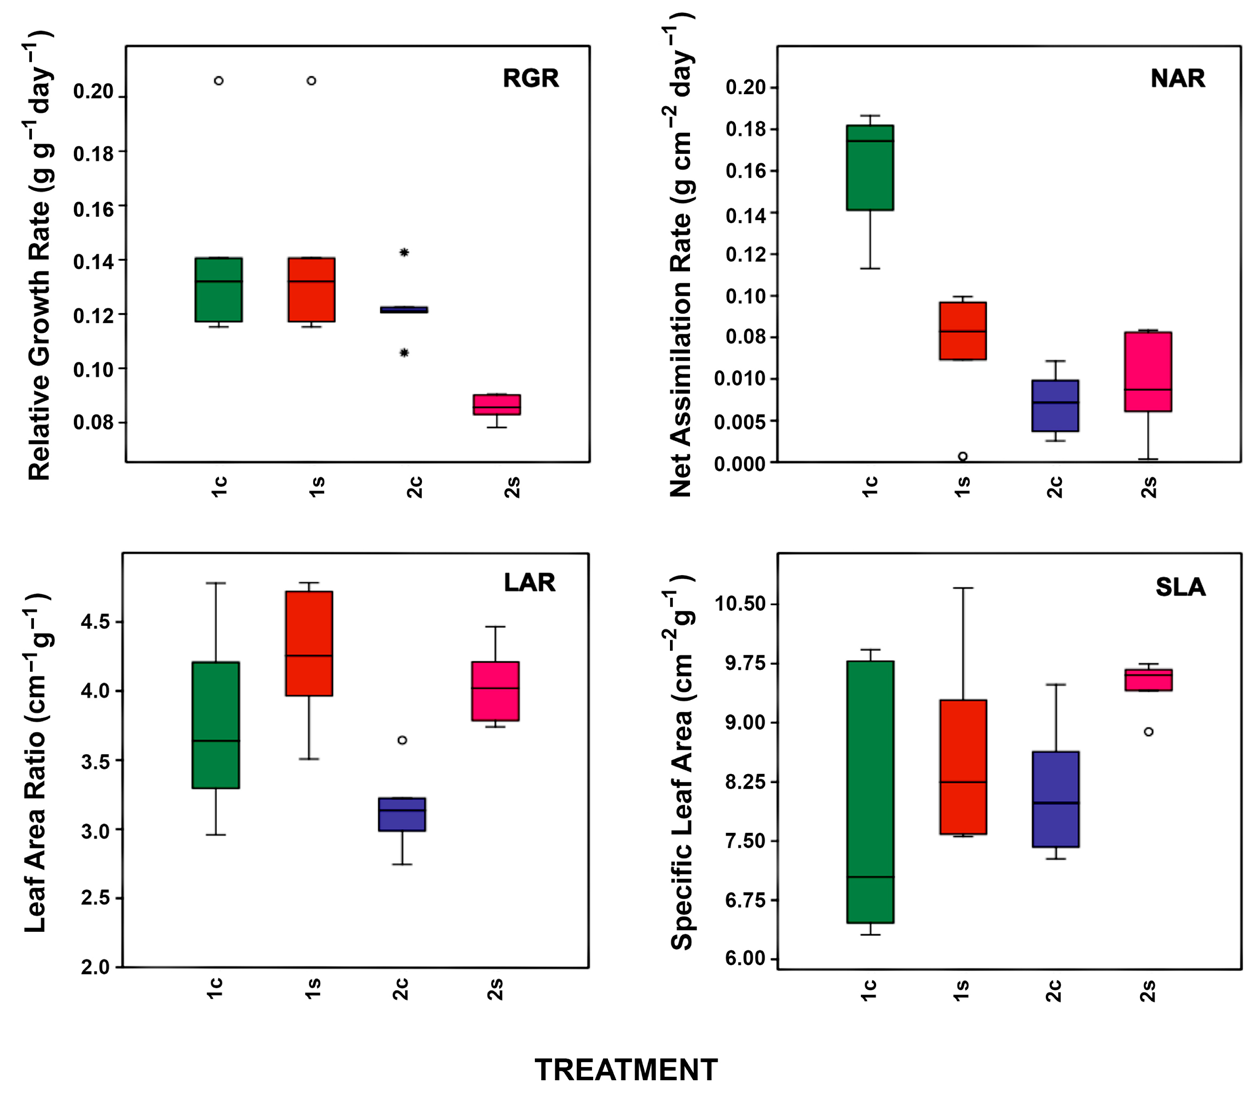
3.1. Net CO2 Assimilation Rate (An), Stomatal Conductance (gs) and Growth Analysis

The net CO2 assimilation rate (An) decreased significantly between each level of water stress (H = 249.77, p < 0.001), decreasing by 27% after 15 days of water stress and 66.6% after 35 days of water stress. Among the control plants, An did not show significant differences among the four time points (H = 1.6651, p = 0.4349). The values of gs decreased with increasing water stress, with values near zero at 35 days under stress.
The relative growth rate (RGR) was similar between the 15-day water stress group and the control group (p > 0.05), while the 25-day group had a significantly lower RGR than the control (p = 0.001). The net assimilation rate (NAR) decreased as the water stress time progressed. In the leaf area range (LAR), plants that underwent 15 days of water stress did not differ from the control, but after 25 days of water stress, the plants had a significantly higher LAR than the control group (p = 0.001). The specific leaf area (SLA) was significantly higher in the 25-day water stress group than the control (p = 0.001), but there were no differences between control and the 15- or 35-day water stress treatments (Figure 3).

3.2. Pressure–Volume Curves

The osmotic potential at full turgor (π100) was lower in groups with successive duration of water stress, showing an average value of π100 = −1.057 MPa in control plants and an average value of π100 = −2.363 MPa at 35 days of water stress. The osmotic potential at zero turgor (π0) was also lower in plants subjected to longer water stress, ranging from −1.23 MPa in control plants to −2.93 MPa after 35 days of water stress. However, the values of the modulus of elasticity (ε) and the relative water content (RWC) of the plants at maximum turgor did not show significant differences (Table 1).
The osmotic adjustment (OA) resulting from the difference between π100 of the plants after 35 days of water stress and the controls showed a dramatic increase (188.7%). OA increased with an increasing water stress duration (OA at 15 days = 0.452, OA at 25 days = 0.948, OA at 35 days = 1.305) (Figure 4).

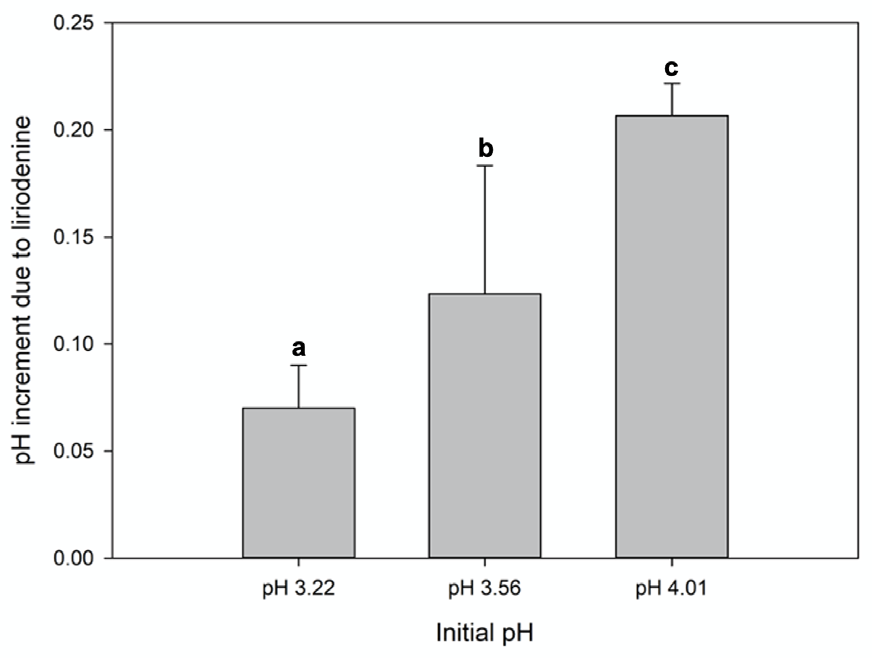
3.3. Liriodenine Content and Tests at Different pH Values

In the control group, the concentration of liriodenine did not change across the four time points in leaves (p = 0.690), stems (p = 0.329), or roots (p = 0.810); i.e., the liriodenine concentration did not change with plant growth over the course of the experiment. Therefore, for further analyses, we only used the liriodenine concentrations from day zero for each tissue.
The concentration of liriodenine in leaves tended to decrease as the duration of water stress increased; however, this decrease was not statistically significant. Liriodenine in stems was significantly higher than in controls after 25 days of water stress (from 199.223 to 637.286 µg g−1). The highest concentration of liriodenine occurred in the roots, and there was a significant increase from 540.855 µg g−1 at 15 days of water stress to 1239.897 µg g−1 at 25 days of water stress. These high concentrations were maintained until the 35th day (Figure 5).
We observed a moderately strong positive relationship between osmotic adjustment and the increase in liriodenine in roots in all of the stress treatments (r2 = 0.58, r = 0.76, p = 0.0001, y = 594x + 357.66) (Figure 4).
The solubility curves of liriodenine at different pH values showed that its solubility was 54% at pH 4.5 and 100% at pH~ 0 (r2 = 0.79, r = −0.889, y = −0.3365x+ 2.2733).
The liriodenine/malic acid pH regulation test showed that when liriodenine was added to malic acid solutions, the pH values increased slightly (from pH 3.22 to 3.29, from 3.56 to 3.68, from 4.01 to 4.21) (Figure 6).

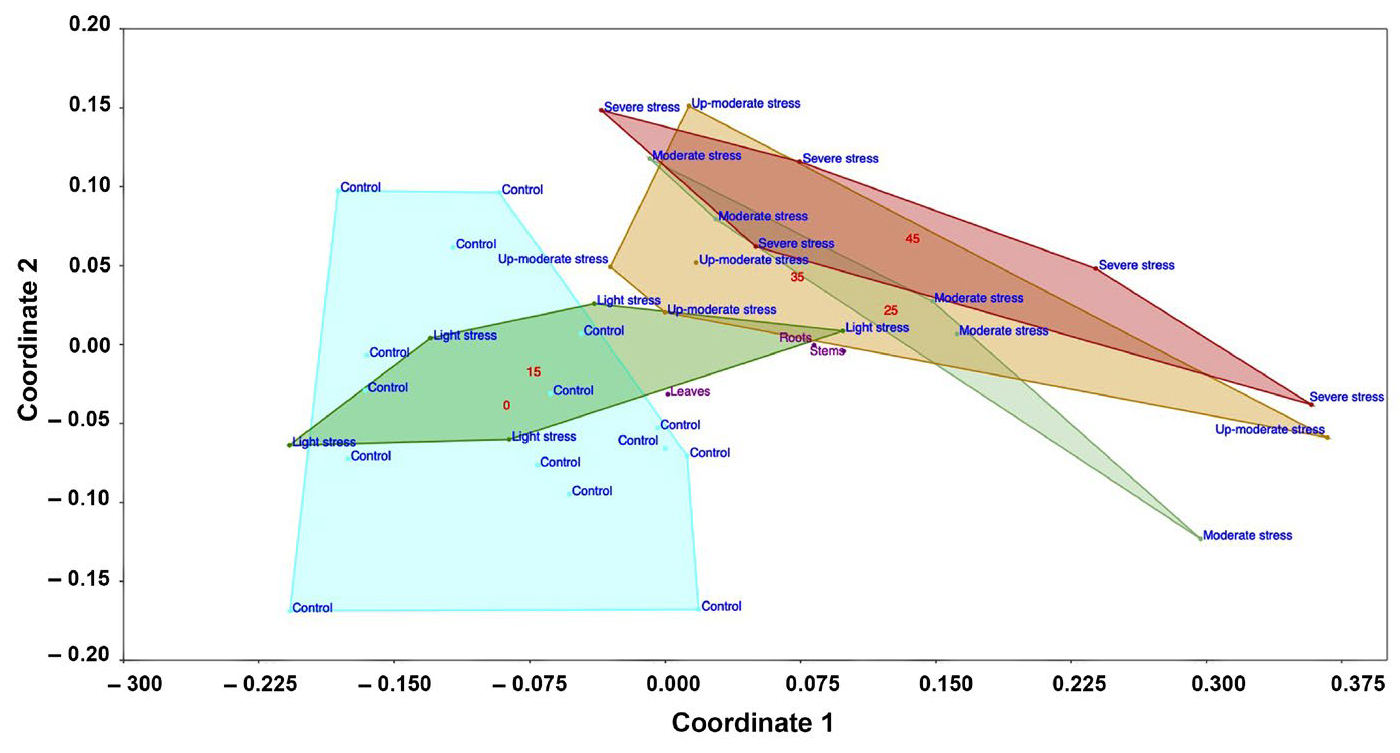
3.4. Non-Metric Multidimensional Scaling (NMDS)

NMDS suggested a gradient of liriodenine content due to water stress. The liriodenine concentration was low in the control seedlings (irrigation) while, as the water deficit progressed, the liriodenine content increased (Figure 7).

4. Discussion

A. lutescens is a benzylisoquinoline alkaloid-producing tree species adapted to the dry season of TDFs [24]. This species uses both avoidance (sparing) and tolerance (osmotic adjustment) strategies to cope with drought, which were analyzed in this study.
In a field study with young and adult plants of A. lutescens, Castro-Moreno et al. (2013) [15] reported that the concentration of liriodenine is highest in the roots and increases more than 300-fold in this tissue during the dry season. Since then, it has been suggested that water stress is the main factor driving the increase in the alkaloid. Similar increases were found in seedlings in this experiment.
Our results showed that the liriodenine content drastically increased in the roots of stressed plants and decreased in the leaves (Figure 5 and Figure 7). These findings are consistent with the exponential increase in liriodenine in the roots of adult trees and saplings during the driest months of the year (February, March, and April), whereas, at the beginning of the rainy season, the alkaloid content was significantly lower [15]. Similar increases were reported in Annona species that inhabit places with water availability conditions similar to those of A. lutescens. For example, in A. purpurea [20], total alkaloids increased in the roots during the driest season, and in A. crassiflora, Marques-Honório [21] reported an increase in the total content of alkaloids and the liriodenine alkaloid in roots during water stress.
Findings of increased production and accumulation of alkaloids during drought have been shown for plants from different families, for example, in Catharantus roseus [35,36,37,38] Papaver somniferum [16], Lycoris aurea [39], Datura stramonium [40], and Pinellia ternata [41]. Although the authors do not directly report the reason for these increases, some point out that alkaloids could be part of the protection strategies for plants under water stress.
Changes in osmotic adjustment and elastic adjustment are elements of the strategies of plants that lead to tolerance to water stress due to drought [42,43]. In this work, both values were calculated by comparing the parameters derived from the pressure–volume curves of plants subjected to stress to controls. Thus, the values reported here for A. lutescens show that this species is adapted to drought. The π100 decrease in A. lutescens plants was more significant when they were subjected to 35 days of water stress (−2363 MPa) compared to the 15- and 25-day water stress levels (Figure 4). The decrease in the osmotic potential of this species seems to be a strategy to maintain cell turgor for longer once the dry period has begun [44,45].
The osmotic adjustment represents the active lowering of the osmotic potential through the accumulation of osmotically active compounds in vacuoles and the cytoplasm (osmolytes) [46]. Osmolytes include various compounds such as sugars, polyamines, secondary metabolites, amino acids, and polyols, which protect or neutralize the damaging effects of abiotic stress, protect cells, and make them tolerant to abiotic stress [47,48,49]. In A. lutescens, we found a gradual osmotic adjustment related to the increase in the accumulation of liriodenine in the roots (Figure 4). Given this relationship, we propose that the liriodenine alkaloid contributes to the osmotic adjustment during water stress, acting as an osmolyte (Figure 4 and Figure 7). This behavior has not been documented in other species; however, in plants like coconuts and wheat, increased proline has been related to slight osmotic adjustment [50,51].
In addition, the adjustment of cellular pH is important to maintain resistance to drought. The pH can be increased or decreased by the compounds present in cells, and the pH must be regulated to avoid affecting physiological processes [52,53]. In this study, the liriodenine alkaloid showed a slight up-regulation in the pH (Figure 4), so the presence of the alkaloid in the cell would not represent a pH imbalance, but rather would help to balance pH. It has been documented that the vacuolar pH is acidic under normal conditions (4.5–6.5; with variation depending on the species and conditions); however, during water stress, it decreases even further [53,54]. Matile [55], and Nowak and Selmar [56], state that alkaloids cross the tonoplast due to differences in pH between the vacuole and the cytoplasm. This contributes to the alkaloid entering the vacuole due to the action of H-ATP pumps that activate during stress, where the alkaloids can be converted into N-oxides, decreasing their toxicity and increasing their solubility [56]. Liriodenine could be entering the vacuoles of root cells, together with other compounds that are known to accumulate in the vacuoles during water stress, like malic acid and succinate [57]. Several authors have discussed vacuole acidification during water stress. For example, Khan [57] and Nowak and Selmar [56], discuss the important role of secondary metabolites in maintaining vacuolar homeostasis. Singh and Dar [54], discuss the different types of osmolytes and their functions, while Nahar et al. [58] and Iqbal et al. [59], consider that secondary metabolites like alkaloids could have a role both as osmolytes and in the antioxidant system during water stress.
Although A. lutescens is a deciduous plant, during the seedling stage it can take up to 25 days without water to present visible signs of stress and more than 35 days to present signs of leaf abscission, which allows us to evaluate its tolerance mechanisms. Under severe stress, the decrease in liriodenine in leaves and visible signs of senescence and leaf abscission, together with the increase in liriodenine in roots, indicates that in this species, tolerance is primarily expressed in the roots. As such, in this work, we include elements to perform further research on tolerance in the roots, since all of the mechanisms of tolerance refer to the leaves.
In summary, our data could be used to obtain higher availability of liriodenine for use in applications related to its multiple types of biological activity, including antifungal action [60], cytotoxicity [61,62], antibacterial action [63,64], antiprotozoal action [63,65], activity against phytopathogens [66,67], and catalytic inhibition of topoisomerase II [68]. In this specific case, in addition to its defensive properties against other organisms [69], the liriodenine alkaloid plays several roles in the physiology of the plants that produce it; it seems to have a relevant role in strategies in response to water stress, both as an osmolyte and in pH homeostasis (Figure 6 and Figure 7). Furthermore, this metabolite could be actively participating in other processes, such as nutrient recycling or foliation, so it is necessary to continue studying it.

Author Contributions

Conceptualization, A.R.G.-E. and A.C.-A.; Formal analysis, M.C.-M. and A.R.G.-E.; Investigation, A.C.-A., R.C.-O. and A.R.G.-E.; Methodology, A.R.G.-E.; Supervision, R.C.-O.; Validation, R.C.-O.; Writing—review and editing, A.R.G.-E. All authors have read and agreed to the published version of the manuscript.

Funding

This research was supported by I0017-Fondo SEP—CONACyT.

Institutional Review Board Statement

Not applicable.

Informed Consent Statement

Not applicable.

Data Availability Statement

The data are contained within the manuscript.

Acknowledgments

The first author is thankful to the ‘‘Posgrado en Ciencias Biológicas’’ from Universidad Nacional Autónoma de México (UNAM), to the CONACyT and the Universidad de Ciencias yArtes de Chiapas (UNICACH) for the support to this research. This work is part of a Doctoral Thesis from the ‘‘Posgrado en Ciencias Biológicas” from UNAM.

Conflicts of Interest

The authors declare no conflicts of interest.

References

  1. Chaves, M.M.; Maroco, J.P.; Pereira, J.S. Understanding plant responses to drought–from genes to the whole plant. Funct. Plant Biol. 2003, 30, 239–264. [Google Scholar] [CrossRef] [PubMed]
  2. Lambers, H.; Chapin, F.S., III; Pons, T.L. Plant Physiological Ecology; Springer: New York, NY, USA, 2008; 571p. [Google Scholar]
  3. Mahajan, M.; Kuiry, R.; Pal, P.K. Understanding the consequence of environmental stress for accumulation of secondary metabolites in medicinal and aromatic plants. J. Appl. Res. Med. 2020, 18, 100255. [Google Scholar] [CrossRef]
  4. Oh, M.; Trick, H.N.; Rajasekar, C.B. Secondary metabolism and antioxidants are involved in environmental adaptation and stress tolerance in lettuce. J. Plant Physiol. 2009, 166, 180–191. [Google Scholar] [CrossRef] [PubMed]
  5. Selmar, D.; Kleinwächter, M. Influencing the product quality by deliberately applying drought stress during the cultivation of medicinal plants. Ind. Crops Prod. 2013, 42, 558–566. [Google Scholar] [CrossRef]
  6. Skoneczny, D.; Weston, P.A.; Weston, L.A. Metabolomics and metabolic profiling: Investigation of dynamic plant-environment interactions at the functional level. In Advances in Plant Ecophysiology Techniques; Sánchez-Moreiras, A.M., Reigosa, M.J., Eds.; Springer: Berlin/Heidelberg, Germany, 2018; pp. 323–345. [Google Scholar] [CrossRef]
  7. Kirakosyan, A.; Kaufman, P.; Warber, S.; Zick, S.; Aaronson, K.; Bolling, S. Applied environmental stresses to enhance the levels of polyphenolics in leaves of hawthorn plants. Physiol. Plant. 2004, 121, 182–186. [Google Scholar] [CrossRef] [PubMed]
  8. De Abreu, I.N.; Mazzafera, P. Effect of water temperature stress on the content of active constituents of Hypericum brasiliense Choisy. Plant Physiol. Biochem. 2005, 43, 241–248. [Google Scholar] [CrossRef] [PubMed]
  9. Nowak, M.; Manderscheid, R.; Weigel, H.J.; Kleinwächter, M.; Selmar, D. Drought stress increases the accumulation of monoterpenes in sage (Salvia officinalis), an effect that is compensated by elevated carbon dioxide concentration. J. Appl. Bot. Food Qual. 2010, 83, 133–136. [Google Scholar]
  10. Manukyan, A. Effect of growing factors on productivity and quality of lemon catmint, lemon balm and sage under soilless greenhouse production: I. Drought stress. Med. Aromat. Plant Sci. Biotechnol. 2011, 5, 119–125. [Google Scholar]
  11. Zhu, Z.; Liang, Z.; Han, R.; Wang, X. Impact of fertilization a drought response in the medicinal herb Bupleurum chinense DC: Growth and saikosaponin production. Ind. Crops Prod. 2009, 29, 629–663. [Google Scholar] [CrossRef]
  12. Nogués, S.; Allen, D.J.; Morison, J.I.L.; Baker, N.R. Ultraviolet-B radiation effects on water relations, leaf development, and photosynthesis in droughted pea plants. Plant Physiol. 1998, 117, 173–181. [Google Scholar] [CrossRef]
  13. Cakir, R.; Cebi, U. The effect of irrigation scheduling and water stress on the maturity and chemical composition on Virginia tobacco leaf. Field Crops Res. 2010, 119, 269–276. [Google Scholar] [CrossRef]
  14. Kirk, H.; Vrieling, K.; Van Der Meijden, E.; Klinkhamer, P.G.L. Species by environment interaction after pyrrolizidine alkaloid expression in Senecio jacobaea, Senecio aquaticus, and their hybrid. J. Chem. Ecol. 2010, 36, 378–387. [Google Scholar] [CrossRef] [PubMed]
  15. Castro-Moreno, M.; Tinoco-Ojangurén, C.L.; Cruz-Ortega, M.D.R.; González-Esquinca, A.R. Influence of seasonal variation on the phenology and liriodenine content of Annona lutescens (Annonaceae). J. Plant Res. 2013, 126, 529–537. [Google Scholar] [CrossRef]
  16. Szabó, B.; Tyihák, E.; Szabó, L.G.Y.; Botz, L. Mycotoxin and drought stress induced chance of alkaloids content of Papaver somniferum plantlets. Acta Bot. Hung. 2003, 45, 409–417. [Google Scholar] [CrossRef]
  17. Briske, D.D.; Camp, B.J. Water stress increases alkaloid concentrations in threadleaf groundsel (Senecio longilobus). Weed Sci. 1982, 30, 106–108. [Google Scholar] [CrossRef]
  18. Jaleel, C.A.; Sankar, B.; Murali, P.V.; Gomathinayagam, M.; Lakshmanan, G.M.A.; Panneerselvam, R. Water deficit stress effects on reactive oxygen metabolism in Catharanthus roseus; impacts on ajmalicine accumulation. Colloids Surf. B. 2008, 62, 105–111. [Google Scholar] [CrossRef]
  19. Ababaf, M.; Omidi, H.; Bakhshandeh, A. Changes in antioxidant activities and alkaloid amount of Catharanthus roseus in response to plant growth regulators under drought condition. Ind. Crops Prod. 2021, 167, 11. [Google Scholar] [CrossRef]
  20. De-la -Cruz-Chacón, I.; Riley-Saldaña, C.A.; Arrollo-Gómez, S.; Sancristóbal-Domínguez, T.J.; Castro-Moreno, M.; González-Esquinca, A.R. Spatio-temporal variation of alkaloids in Annona purpurea and the associated influence on their antifungal activity. Chem. Biodivers. 2018, 16, e1800284. [Google Scholar] [CrossRef] [PubMed]
  21. Honório, A.B.M.; De-la-Cruz-Chacón, I.; Martínez-Vázquez, M.; da Silva, M.R.; Campos, F.G.; Martin, B.C.; da Silva, G.C.; Fernandes Boaro, C.S.; Ferreira, G. Impact of drought and flooding on alkaloid production in Annona crassiflora Mart. Horticulturae 2021, 7, 414. [Google Scholar] [CrossRef]
  22. De-La-Cruz-Chacón, I.; González-Esquinca, A.R. Liriodenine alkaloid in Annona diversifolia during early development. Nat. Prod. Res. 2012, 26, 42–49. [Google Scholar] [CrossRef]
  23. Cohen, J.; Langenthal, W.; Taylor, W. Notes- The alkaloids of Liriodendron tulipifera L. The structure and synthesis of the unnamed yellow alkaloid and the isolation of D-glucina. J. Org. Chem. 1961, 26, 4143–4144. [Google Scholar] [CrossRef]
  24. Taylor, W.I. The structure and synthesis of liriodenine, a new type of isoquinoline alkaloid. Tetrahedron 1961, 14, 42–45. [Google Scholar] [CrossRef]
  25. Ríos, J.L.; Máñez, S.; Giner, R.M.; Recio, M.C. Biological aspects of aporphinoid alkaloids. In The Alkaloids: Chemistry and Biology; Cordell, G.A., Ed.; Academic Press: Cambridge, MA, USA, 1999; Volume 53, pp. 57–117. [Google Scholar]
  26. González-Esquinca, A.R.; De-La-Cruz-Chacón, I.; Castro-Moreno, M.; Riley-Saldaña, C.A. Phenological strategies of Annona species from the tropical deciduous forest of Chiapas, México. Bot. Sci. 2016, 94, 531–541. [Google Scholar] [CrossRef]
  27. Facchini, P.J.; De Luca, V. Phloem-specific expression of tyrosine/dopa decarboxylase genes and the biosynthesis of isoquinoline alkaloids in Opium poppy. Plant Cell 1995, 7, 1811–1821. [Google Scholar] [CrossRef]
  28. Roberts, M.F.; Wink, M. Alkaloids: Biochemistry, Ecology and Medicinal Application; Plenum Press: New York, NY, USA, 1998. [Google Scholar] [CrossRef]
  29. Hunt, R.; Cornelissen, J.H.C. Components of relative growth rate and their interrelations in 59 temperate plant species. New Phytol. 1997, 135, 395–417. [Google Scholar] [CrossRef]
  30. Tyree, M.T.; Hammel, H.T. The measurement of the turgor pressure and the water relations of plant by the pressure-bomb technique. J. Exp. Bot. 1972, 23, 267–282. [Google Scholar] [CrossRef]
  31. Wilson, J.R.; Ludlow, M.M.; Fisher, M.J.; Schulze, E. Adaptation to water stress of the leaf water relation of four tropical forage species. Aus. J. Plant Physiol. 1980, 7, 207–220. [Google Scholar] [CrossRef]
  32. González-Esquinca, A.R.; De-La-Cruz-Chacón, I.; Castro-Moreno, M.; Orozco-Castillo, J.A.; Riley-Saldaña, C.A. Alkaloids and acetogenins in Annonaceae development: Biological considerations. Rev. Bras. Frutic. 2014, 36, 1–16. [Google Scholar] [CrossRef]
  33. Shriner, R.L.; Fuson, R.C.; Curtin, D.Y. Identificación Sistemática de Compuestos Orgánicos; Cap. 6. Comportamiento de la Solubilidad. ed. Limusa: Ciudad de México, Mexico, 1977. [Google Scholar]
  34. Hammer, O.; Harper, D.A.T.; Ryan, P.D. PAST: Paleontological Statistics software package for education and data analysis. Palaeontol. Electrónica 2001, 4, 9. [Google Scholar]
  35. Jaleel, C.A.; Manivannan, P.; Kishorekumar, A.; Sankar, B.; Gopi, R.; Somasundaram, R.; Panneer, S. Alterations in osmoregulation, antioxidant enzymes and indole alkaloid levels in Catharanthus roseus exposed to water deficit. Colloids Surf. B. 2007, 59, 150–157. [Google Scholar] [CrossRef]
  36. Liu, J.; Gao, F.; Ren, J.; Lu, X.; Ren, G.; Wang, R. A novel AP2/ERF transcription factor CR1 regulates the accumulation of vindoline and serpentine in Catharanthus roseus. Front. Plant Sci. 2017, 8, 2082. [Google Scholar] [CrossRef] [PubMed]
  37. Liu, Y.; Meng, Q.; Duan, X.; Zhang, Z.; Li, D. Effects of PEG-induced drought stress on regulation of indole alkaloid biosynthesis in Catharanthus roseus. J. Plant Interact. 2017, 12, 87–91. [Google Scholar] [CrossRef]
  38. Mall, M.; Verma, R.K.; Gupta, M.M.; Shasany, A.K.; Khanuja, S.P.S.; Shukla, A.K. Influence of seasonal and ontogenic parameters on the pattern of key terpenoid indole alkaloids biosynthesized in the leaves of Catharanthus roseus. S. Afr. J. Bot. 2019, 123, 98–2014. [Google Scholar] [CrossRef]
  39. Liang, J.; Quan, M.; Chaowen, S.; He, A.; Xiang, X.; Feng, C. Effects of drought stress on growth, photosynthesis alkaloid accumulation of Lycoris Aurea. Pak. J. Bot. 2020, 52, 1137–1442. [Google Scholar] [CrossRef] [PubMed]
  40. Alinejad, S.; Sarabi, V.; Sadeghi, A.R.; Hashempour, H. Variation in physiological traits, yield and secondary metabolites of jimsonweed (Datura stramonium L.) under different irrigation regimes and nutrition systems. Ind. Crops Prod. 2020, 143, 8. [Google Scholar] [CrossRef]
  41. Chen, Y.; Chen, Y.; Guo, Q.; Zhu, G.; Wang, C.; Liu, Z. Effects of drought stress on the growth, physiology and secondary metabolite production in Pinellia ternate Thunb. Pak. J. Bot. 2021, 53, 833–840. [Google Scholar] [CrossRef] [PubMed]
  42. Maréchaux, I. Individual-Based Modeling of Tropical Forests: Role of Biodiversity and Responses to Drought. Ph.D. Thesis, Laboratoire Evolution et Diversité Biologique, Université de Toulouse 3 Paul Sabatier, Toulouse, France, 2016. [Google Scholar]
  43. Thilagavathy, A.; Naik, K.; Devaraj, V.R. microRNAs: Key Modulators of Drought stress responses in Plants. In Metabolic Adaptations in Plants during Abiotic Stress; CRC Press: Boca Raton, FL, USA, 2019. [Google Scholar]
  44. Barrios-Gómez, E.; López-Castañeda, C.; Kohashi-Shibata, J. Relaciones hídricas y temperaturas altas en frijol del tipo “Flor de mayo”. Agron. Costarric. 2011, 35, 131–145. [Google Scholar] [CrossRef]
  45. Basu, S.; Ramegowda, V.; Kumar, A.; Pereira, A. Plant adaptation to drought stress. F1000Research 2016, 5, 1554. [Google Scholar] [CrossRef]
  46. Zivcak, M.; Brestic, M.; Sytar, O. Osmotic Adjustment and Plant Adaptation to drought Stress. In Drought Stress Tolerance in Plants, Volume 1; Springer: Berlin/Heidelberg, Germany, 2016. [Google Scholar] [CrossRef]
  47. Roychoudhury, A.; Chakraborty, M. Biochemical and Molecular basis of varietal difference in plant salt tolerance. Annu. Rev. Res. Biol. 2013, 3, 422–454. [Google Scholar]
  48. Das, K.; Roychoudhury, A. Reactive oxygen species (ROS) and response of antioxidants as ROS-scavengers during environmental stress in plants. Front. Environ. Sci. 2014, 2, 53. [Google Scholar] [CrossRef]
  49. Roychoudhury, A.; Banerjee, A. Endogenous glycine betaine accumulation mediates abiotic stress tolerance in plants. Trop. Plant Res. 2016, 3, 105–111. [Google Scholar]
  50. Gomes, F.P.; Oliva, M.A.; Mielke, M.S.; Almeida, A.A.F.; Aquino, L.A. Osmotic adjustment, proline accumulation and cell membrane stability in leaves of Cocos nucifera submitted to drought stress. Sci. Hortic. 2010, 126, 379–384. [Google Scholar] [CrossRef]
  51. Nayyar, H. Accumulation of osmolytes and osmotic adjustment in water-stressed wheat (Triticum aestivum) and maize (Zea mays) as affected by calcium and its antagonist. Environ. Exp. Bot. 2003, 50, 253–264. [Google Scholar] [CrossRef]
  52. Liu, S.; Yan, Z.; Chen, Y.; Zhang, M.; Chen, J.; Han, W. Foliar pH, an emerging plant functional trait: Biogeography and variability across northern China. Glob. Ecol. Biogeogr. 2019, 28, 386–397. [Google Scholar] [CrossRef]
  53. Luo, Y.; Yan, Z.; Liu, S.; Chen, J.; Li, K.; Mohammat, A.; Han, W. Variation in desert shrub foliar pH in relation to drought and salinity in Xinjiang, China. J. Veg. Sci. 2021, 32, e13031. [Google Scholar] [CrossRef]
  54. Singh, L.R.; Dar, T.A. Cellular Osmolytes: From Chaperoning Protein Folding to Clinical Perspectives; Springer: Singapore, 2017. [Google Scholar]
  55. Matile, P. Localization of alkaloids and mechanism of their accumulation in vacuoles of Chelidonium majus laticifers. Nova Acta Leopold. Supplementum 1976, 1976. [Google Scholar]
  56. Nowak, M.; Selmar, D. Cellular distribution of alkaloids and their translocation via phloem and xylem: The importance of compartment pH. Plant Biol. 2016, 18, 879–882. [Google Scholar] [CrossRef] [PubMed]
  57. Khan, N.; Ali, S.; Zandi, P.; Mehmood, A.; Ullah, S.; Ikram, M.; Ismail, M.A.S.; Babar, M.A. Role of sugar, amino acids in improving plant abiotic stress tolerance. Pak. J. Bot. 2020, 52, 355–363. [Google Scholar] [CrossRef] [PubMed]
  58. Nahar, K.; Hasanuzzaman, M.; Alam, M.M.; Fujita, M. Glutathione-induced drought stress tolerance in mung bean: Coordinated roles of the antioxidant defense and methylglyoxal detoxification systems. AoB Plants 2015, 7, plv069. [Google Scholar] [CrossRef]
  59. Iqbal, N.; Nazar, R.; Khan, N.A. Osmolytes and Plants Acclimation to Changing Environment: Emerging Omics Technologies; Springer: Berlin/Heidelberg, Germany, 2015. [Google Scholar]
  60. Duke, J.A. Dr Duke’s Phytochemical and Ethnobotanical Database, Phytochemical Database, USDA-ARSNGRL, Beltsville Agricultural Research Centre, Maryland, USA, 2000. Available online: https://www.vetiver.org/TVN_vetoil03.pdf (accessed on 3 May 2024).
  61. De Siquiera, J.M.; Bomm, M.D.; Gomes, P.N.F. Activity—Guided isolation of constituents of Unonopsis lindmanii—Annonaceae, based on the brine shrimp lethality bioassay. Química Nova 1998, 21, 557–559. [Google Scholar] [CrossRef]
  62. Wirasathien, L.; Boonarkart, C.; Pengsuparp, T.; Suttisri, R. Biological activities of alkaloids from Pseuduvaria setosa. Pharm. Biol. 2006, 44, 274–278. [Google Scholar] [CrossRef]
  63. Hossain, M.S.; Ferdous, A.J.; Hasan, C.M. In vitro antimicrobial activities of alkaloids from the stem bark of Desmos longiflorus (Roxb.). Bangladesh J. Bot. 1993, 22, 37–40. [Google Scholar]
  64. Rhaman, M.M.; Loppa, S.S.; Sadik, G.; Rashid, H.O.; Islam, R.; Khonkar, P.; Rashid, M.A. Antibacterial and cytotoxic compounds from the bark of Cananga odorata. Fitoterapia 2005, 76, 758–761. [Google Scholar] [CrossRef] [PubMed]
  65. Waechter, A.I.; Cave´, A.; Hocquemiller, R.; Bories, C.; Muñoz, V.; Fournet, A. Antiprotozoal activity of aporphine alkaloids isolated from Unonopsis buchtienii (Annonaceae). Phytother. Res. 1999, 13, 175–177. [Google Scholar] [CrossRef]
  66. Hesse, M. Alkaloids: Nature’s Curse or Blessing? Verlag Helvetica Chemica Acta: Zurich, Switzerland; Wiley-VCH: Weinheim, Germany, 2002; p. 414. [Google Scholar]
  67. Hufford, C.D.; Sharma, A.S.; Oguntimein, B.O. Antibacterial and antifungal activity of liriodenine and related oxoaporphine alkaloids. J. Pharm. Sci. 1980, 69, 1180–1183. [Google Scholar] [CrossRef]
  68. Woo, S.H.; Sun, N.J.; Cassady, J.M.; Snapka, R.M. Topoisomerase II inhibition by aporphine alkaloids. Biochem. Pharmacol. 1999, 57, 1141–1145. [Google Scholar] [CrossRef]
  69. De-La-Cruz-Chacón, I.; González-Esquinca, A.R.; Fefer, P.G.; Garcia, L.F. Liriodenine, early antimicrobial defense in Annona diversifolia. Z. Naturforschung C 2011, 66, 377–384. [Google Scholar] [CrossRef]
Figure 1. The oxoaporphine alkaloid liriodenine.
Ijpb 15 00033 g001
Figure 2. Plants of A. lutescens at the different periods of the treatments. The letters represent the water stress periods: (A) = control, recently watered plants, (B) = 15 days, (C) = 25 days, (D) = 35 days and (E) = 45 days. The white asterisk (*) in (B) indicates the first pair of leaves at their final size in which the photosynthetic parameters were determined. Scale bars represent 10 cm.
Ijpb 15 00033 g002
Figure 3. Growth analysis in A. lutescens. Relative growth rate (RGR), net assimilation rate (NAR), leaf area ratio (LAR) and specific leaf area (SLA). The box indicating the values of each water stress group is shown to the right of its respective control group: 1c = 15-day control group; 1s = 15-day water stress group; 2c = 25-day control group; 2c = 25-day water stress group. Asterisks and circles represent outliers and the colors differentiate the groups.
Ijpb 15 00033 g003
Figure 4. Relationship between liriodenine accumulation and osmotic adjustment after 0, 15, 25 and 35 days of water stress in A. lutescens. Symbol color and shape correspond to the treatment: green asterisks = control; green squares = 15-day water stress; yellow diamonds = 25-day water stress; brown circles = 35-day water stress.
Ijpb 15 00033 g004
Figure 5. Effect of water stress on liriodenine concentration in different plant tissues of A. lutescens. The values are shown as means ± SD of five composite samples. Within each panel, groups that do not share a letter were significantly different in pairwise post hoc comparisons (Mann–Whitney U, leaves p> 0.05 stem and root p ≤ 0.05, n = 5) following significant Kruskal–Wallis tests.
Ijpb 15 00033 g005
Figure 6. pH regulation of liriodenine in acid malic solution at different pH values (2.5 mg of liriodenine was added per 5 mL of malic acid solution 0.00106 N). The bars show the average increase in the pH of the malic acid solutions after adding liriodenine (Kruskal–Wallis p = 0.001, n = 5). The a, b, c, represent the significant differences.
Ijpb 15 00033 g006
Figure 7. Increase in liriodenine concentration over a water stress gradient using non-metric multidimensional scaling (NMDS). The coordinates represent environmental gradients that explain the increase in liriodenine, which occurred mainly in the roots. Coordinate 1 is the moisture gradient, and the variation summarized in coordinate 2 is the three different plant tissues (leaves, stems, and roots). The control and 15-day water stress groups are in the part with the highest moisture (light blue and dark green polygons; red number 0 and 15, respectively), while the 25-day water stress group (light green polygon; red number 25) is found from the center of the gradient to the right extreme, which represents low moisture. The 35- and 45-day water stress groups are found in the gradient with the lowest moisture (right) in the yellow and red polygons (red numbers 35 and 45, respectively). The ANOSIM confirmed the groupings evident in the graph; the control and 15-day stress treatment were indistinguishable from each other but significantly different (p = 0.01) from the 25-, 35-, and 45-day water stress treatments, which were indistinguishable from each other.
Ijpb 15 00033 g007
Table 1. Water potential components in A. lutescens plants subjected to 0, 15, 25 and 35 days of water stress. IP values corresponding to the Kruskal–Wallis tests are shown in the last row of the table. Given the significant Kruskal–Wallis test for π0, we performed post hoc Mann–Whitney U comparisons across treatments (n = 6), the results of which are indicated using letters; groups that do not share a letter were significantly different from each other (p ≤ 0.05).
Water Stress (Days)RWC (%)ε (MPa)π0 (MPa)
082.33 ± 132.79 ± 1.85−1.23 ± 0.33 a
1572 ± 191.29 ± 1.42−1.99 ± 0.35 b
2575.16 ± 153.63 ± 3.13−2.54 ± 0.31 c
3572 ± 7.561.67 ± 0.96−2.93 ± 0.27 c
p = 0.42p = 0.45p < 0.001
Disclaimer/Publisher’s Note: The statements, opinions and data contained in all publications are solely those of the individual author(s) and contributor(s) and not of MDPI and/or the editor(s). MDPI and/or the editor(s) disclaim responsibility for any injury to people or property resulting from any ideas, methods, instructions or products referred to in the content.

