Article

Habitat Characteristics of Camellia quephongensis and Adaptation Mechanisms in Que Phong District, North-Central Vietnam

1
Geography Department, Vinh University, Vinh 460000, Vietnam
2
NPO Ecology and Regional Culture Studies Association, Ohmihachiman 523-0821, Japan
3
Lago Co., Ltd., Ohmihachiman 523-0821, Japan
4
School of Agriculture and Natural Resources, Vinh University, Vinh 460000, Vietnam
5
Doctor Course, Vinh University, Vinh 460000, Vietnam
*
Author to whom correspondence should be addressed.
Int. J. Plant Biol. 2023, 14(4), 959-973; https://doi.org/10.3390/ijpb14040070
Submission received: 25 September 2023 / Revised: 19 October 2023 / Accepted: 21 October 2023 / Published: 23 October 2023
(This article belongs to the Section Plant Ecology and Biodiversity)

Abstract

:
Camellia quephongensis Hakoda et Ninh is a yellow-flowered camellia that inhabits the Que Phong District, Nghe An Province, North-Central Vietnam, and its taxon includes approximately 50 species from South China and Vietnam. Researchers have primarily focused on the taxonomy and biochemistry of medicinal substances found in camellia flowers and on horticultural studies of their propagation. Consequently, habitat characteristics and adaptation mechanisms still need to be better understood. Thus, this study investigated the habitats of C. quephongensis in terms of landscape and stand composition, analyzed the morphological variabilities and age distribution patterns among different habitat types, and explored its adaptation mechanisms. The results revealed that this species preferentially inhabited forests on vulnerable slopes and stream banks, which were frequently disturbed by slope failure or flooding, while its multi-stemming traits were key factors in recovering from damage and persisting in such habitats. Relatively stable sites with fewer disturbances can be a source habitat, whereas frequently disturbed sites can be a sink habitat for the populations. Regular thinning of the shrub and herb layers in the plantation maintained a stand composition similar to that of natural stands; thus, succession control is recommended to conserve the naturally growing site of this species. The findings of this study will aid in the future conservation and restoration of growing areas.

1. Introduction

Camellia quephongensis Hakoda et Ninh (Theaceae) is a yellow-flowered camellia that inhabits the tropical riparian forests at an altitude of 200 m–300 m in Que Phong District, Nghe An Province, North-Central Vietnam (Figure 1). It is a short-sized shrub, 4 m–5 m tall, produces flowers, 5.5 cm–6.5 cm in diameter annually from December to February [1]. Tran et al. (2019) [2] reported that more than 50 species of yellow camellia are distributed in South China and Vietnam, including 40 species native to Vietnam, whereas Le et al. (2020) [3] listed 46 species of yellow camellia in this country. This implies that the region of South China–Vietnam is the center of speciation for this taxon. C. quephongensis is a relatively recent described species (2002) [1], in addition to this, new species have been described in North-Central Vietnam from 2018 to 2022, including C. vuquangensis Luong et al. sp. nov. from Vu Quang District, Ha Tinh Province [4], C. pukhangensis Do et al. sp. nov. from Quy Hop District, Nghe An Province [5], C. puhoatensis Ly et al. sp. nov. from Que Phong District, Nghe An Province [6], and C. ngheanensis Do et al. sp. nov. from Tuong Duong District, Nghe An Province [7]. Taxonomic studies of this taxon have been conducted.
Furthermore, the biochemical features of this taxon are of interest to researchers owing to the medicinal substances contained mainly in the flowers, such as saponins and antioxidants of polyphenols and carotenoids [8,9,10]. Therefore, yellow-flowered camellia, known as golden camellia tea, is used in medicine and health [2]. Tanikawa et al. (2008) [11] revealed that quercetin, along with aluminum, plays a role in the yellow color of the petals.
Because it is a highly valued commercial plant whose flowers are traded at a high price of hundreds of USD per kilogram in retail markets [2], several horticultural studies on the methodologies of propagation by cuttings [12,13] and light response experiments have been actively conducted [14].
Of the five species of yellow-flowered camellia in North-Central Vietnam, four (C. vuquangensis, C. pukhangensis, C. puhoatensis, C. ngheanensis) are endangered according to the International Union for Conservation Nature (IUCN) Red List criteria [4,5,6,7], and C. quephongensis is at risk of diminishing populations owing to sapling transplantation and unregulated exploitation of flowers from naturally growing trees [15]. To conserve this taxon, we must understand the ecological aspects, not only the external appearance of the habitats but also the physical and biological factors that establish them. In addition, it is essential to explore the ecological mechanisms of adaptation to habitats. Zhu et al. (2022) elucidated the adaptation mechanisms of soil characteristics of some species distributed in the Guangxi Province, South China; however, this was the case for species native to calcareous soils in karst regions [16]. Xu et al. (2021) described the detailed habitat of C. longzhouensis, also a calcareous-adapted species in karst regions [17]. However, C. quephongensis is distributed in granite-based soils [18,19], and therefore, this adaptation mechanism cannot be applied to this species.
In terms of C. quephongensis, Le et al. (2021) [1] and Takahashi et al. (2023) [15] described its habitats; however, its adaptation mechanisms have not been elucidated. In this study, we reviewed the habitats of this species, and subsequently used landscape ecological methods to understand the relationship between vegetation and topographical features of the habitats. Consequently, we discuss the morphological characteristics and population structure of this species that persists in its habitats. Additionally, conservation policies for this species are indicated.

2. Materials and Methods

2.1. Materials

2.1.1. Study Area and Sites

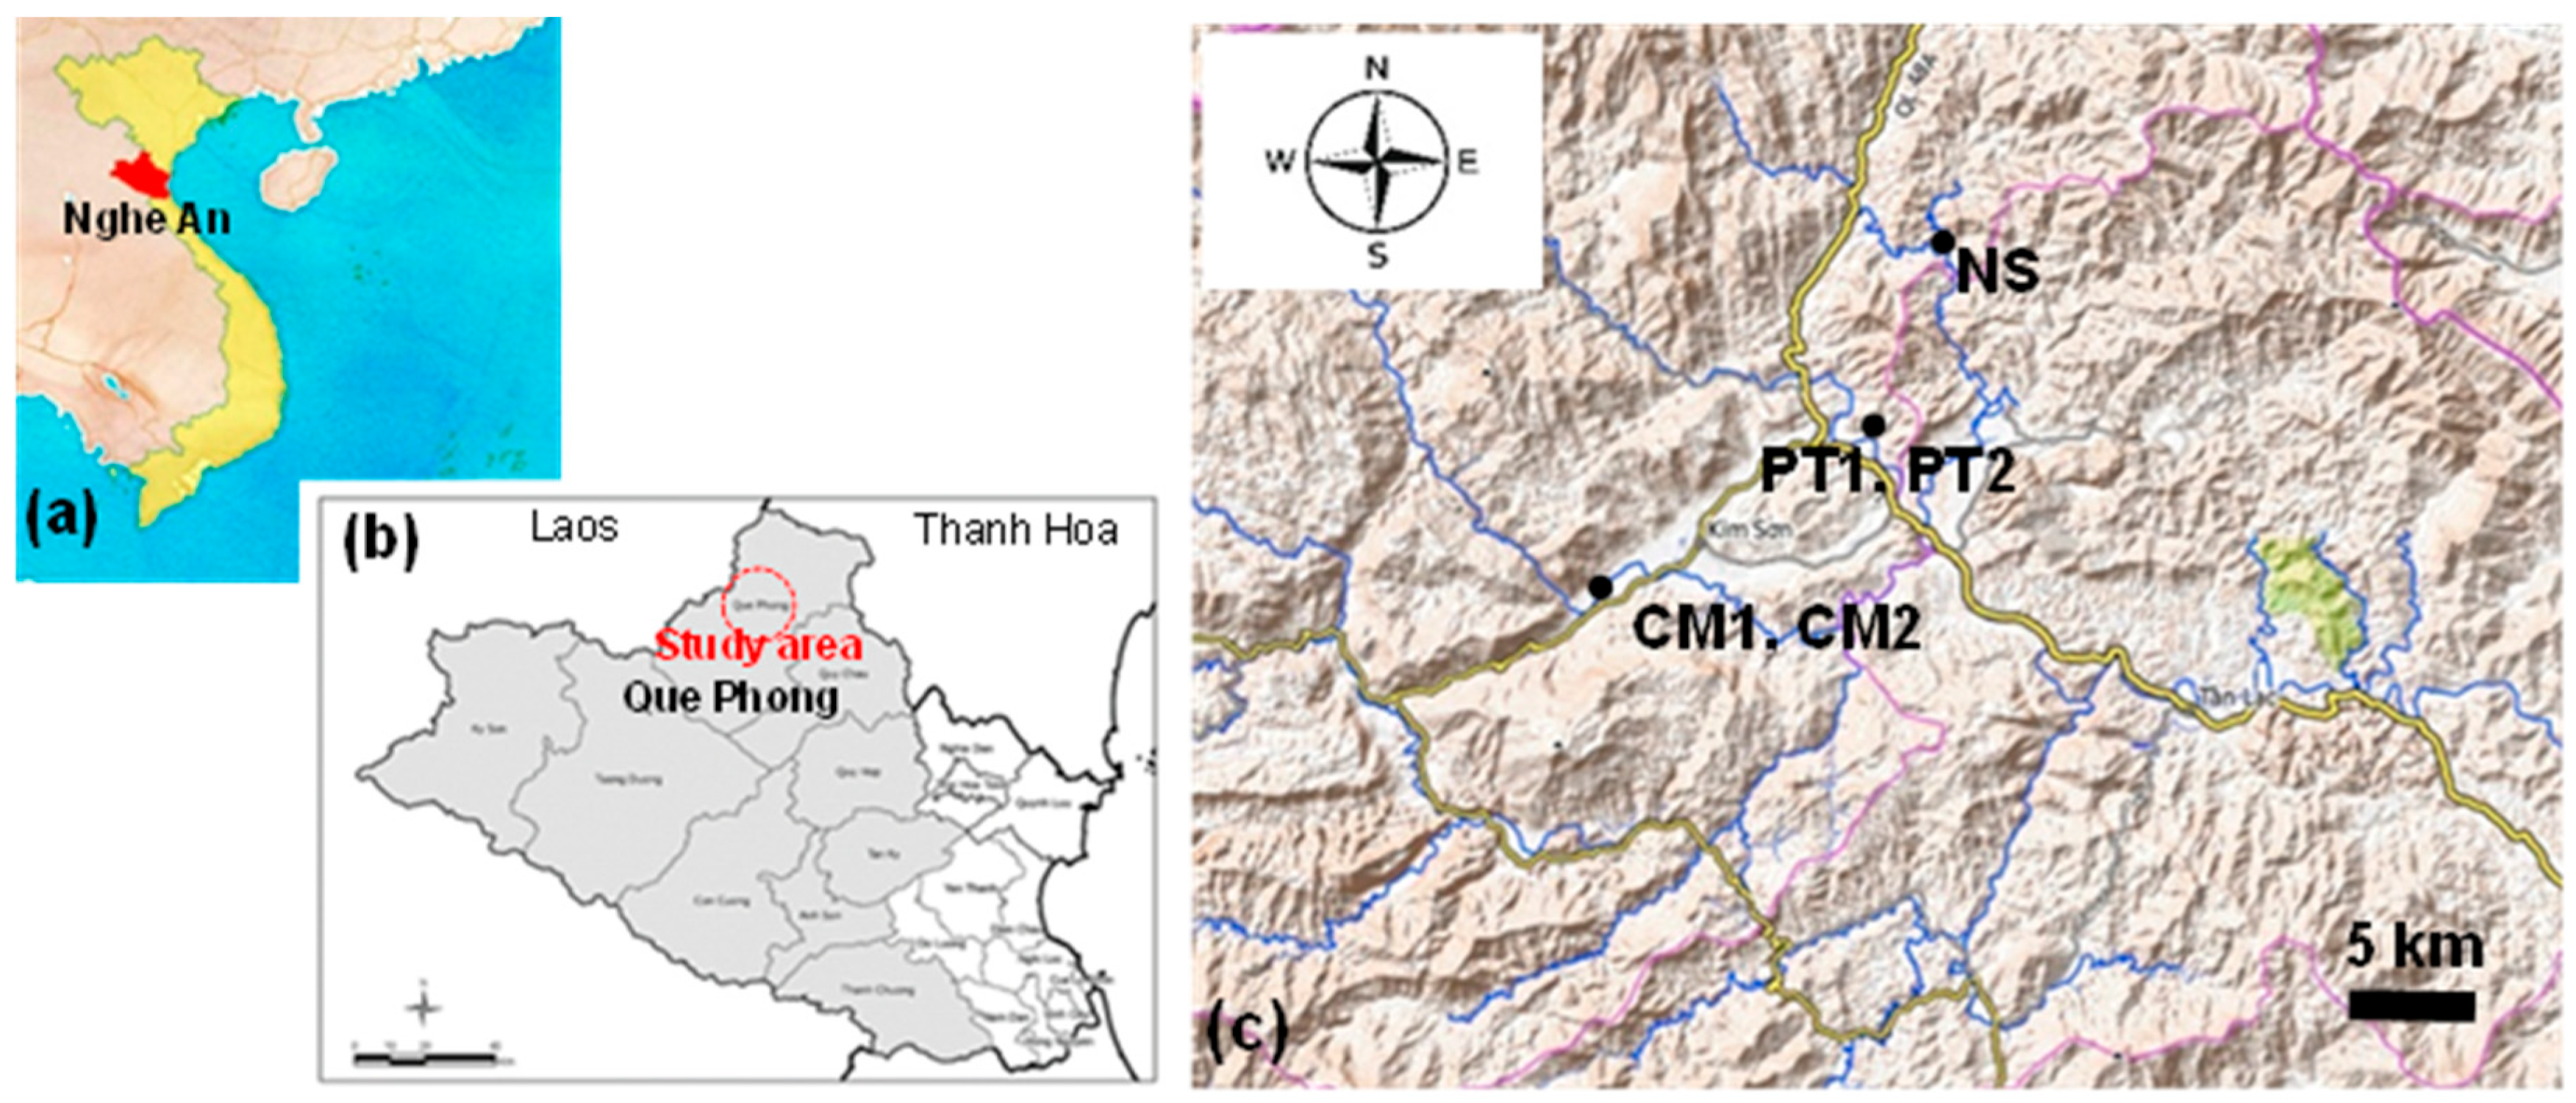
Que Phong District is located in the northwest corner of Nghe An Province, facing the boundaries of Laos and Thanh Hoa Province, Vietnam, to the west and north, respectively, and is designated as a biosphere reserve by UNESCO (Figure 2a,b). This area is surrounded by high mountain ranges, including a river network flowing down to the district center, forming the Hieu River.
Takahashi et al. (2023) surveyed the local populations distributed in Co Muong (CM) (19°34′36″ N, 104°52′21″ E–19°34′30″ N, 104°52′82″ E), Chau Kim Commune, Phuong Tien (PT) (19°38′25″ N, 104°59′18″ E–19°38′33″ N, 104°59′07″ E), Na Sanh (NS) (19°42′00″ N, 105°00′21″ E), and Tien Phong Commune. CM and PT included two patches, CM1 and CM2, and PT1 and PT2 (Figure 2c) [15]. CM2 and NS are anthropogenically created patches that consist of trees transplanted from CM1 and nearby NS areas, respectively. The same population was selected for the present study.

2.1.2. Climate

The study area belongs to the subtropical zone, April–October is summer; it is hot and humid, and the temperature peaks at 34 °C on average, especially in May–September, which is a rainy season owing to the northwest monsoon. The remainder is winter, which is relatively cold and dry, and the temperature drops to 9 °C on average, due to northeast monsoons. The mean annual rainfall is 1800 mm [20].

2.1.3. Vegetation and Topography

Que Phong District is mostly covered by forests (143,000 ha), which account for 75% of the total. Approximately half of the forests are restricted for use and designated as Special Use Forests and Protection Forests, according to the Que Phong District People’s Committee.
Mountain slopes in this area, especially those near communities, have been widely used for slush-and-burn farming since 1992. It was banned by the local government in 1996; consequently, the regenerated evergreen broad-leaved forests, logged areas of CM surroundings decreased from 31.9% to 11.9%, and the PT-included area was also under a similar situation [15].
In terms of the anthropogenic population, CM2 and NS grew in cinnamon plantations (Cinnamomun loureiroi) and bamboo stands, respectively.
Topographically, the center of the Que Phong District is located at the basin bottom, and populations inhabit mountain slopes, valley slopes, or bottoms. The soil environment is characterized by granite, tonalite, and mafic rocks [18,19].

2.2. Methods

2.2.1. Temperature and Humidity

On-site observations of temperature and relative humidity were conducted during the 2022–2023 flowering season from 4 December 2022 to 28 February 2023, within CM1 and PT1 (EasyLog, LASCAR Electronics, Hong Kong, China).

2.2.2. Population Size and Floristic Composition of the Habitats

Data on population size, such as distribution area and population density, and habitat characteristics, such as stand attributes, were obtained from a previous study [15]. To understand the biological factors characterizing the habitats, the dominant species comprising the canopy layer and the layer next to it (hereafter referred to as the second layer) of the stands were recorded in situ on 5–9 December 2022, and 9–10 January 2023. A dominant species was defined as having a large projected area of foliage on the ground (≥25%) and a large number of individuals in the quadrat established as a representative of the stand.

2.2.3. Landscape Pattern Analysis

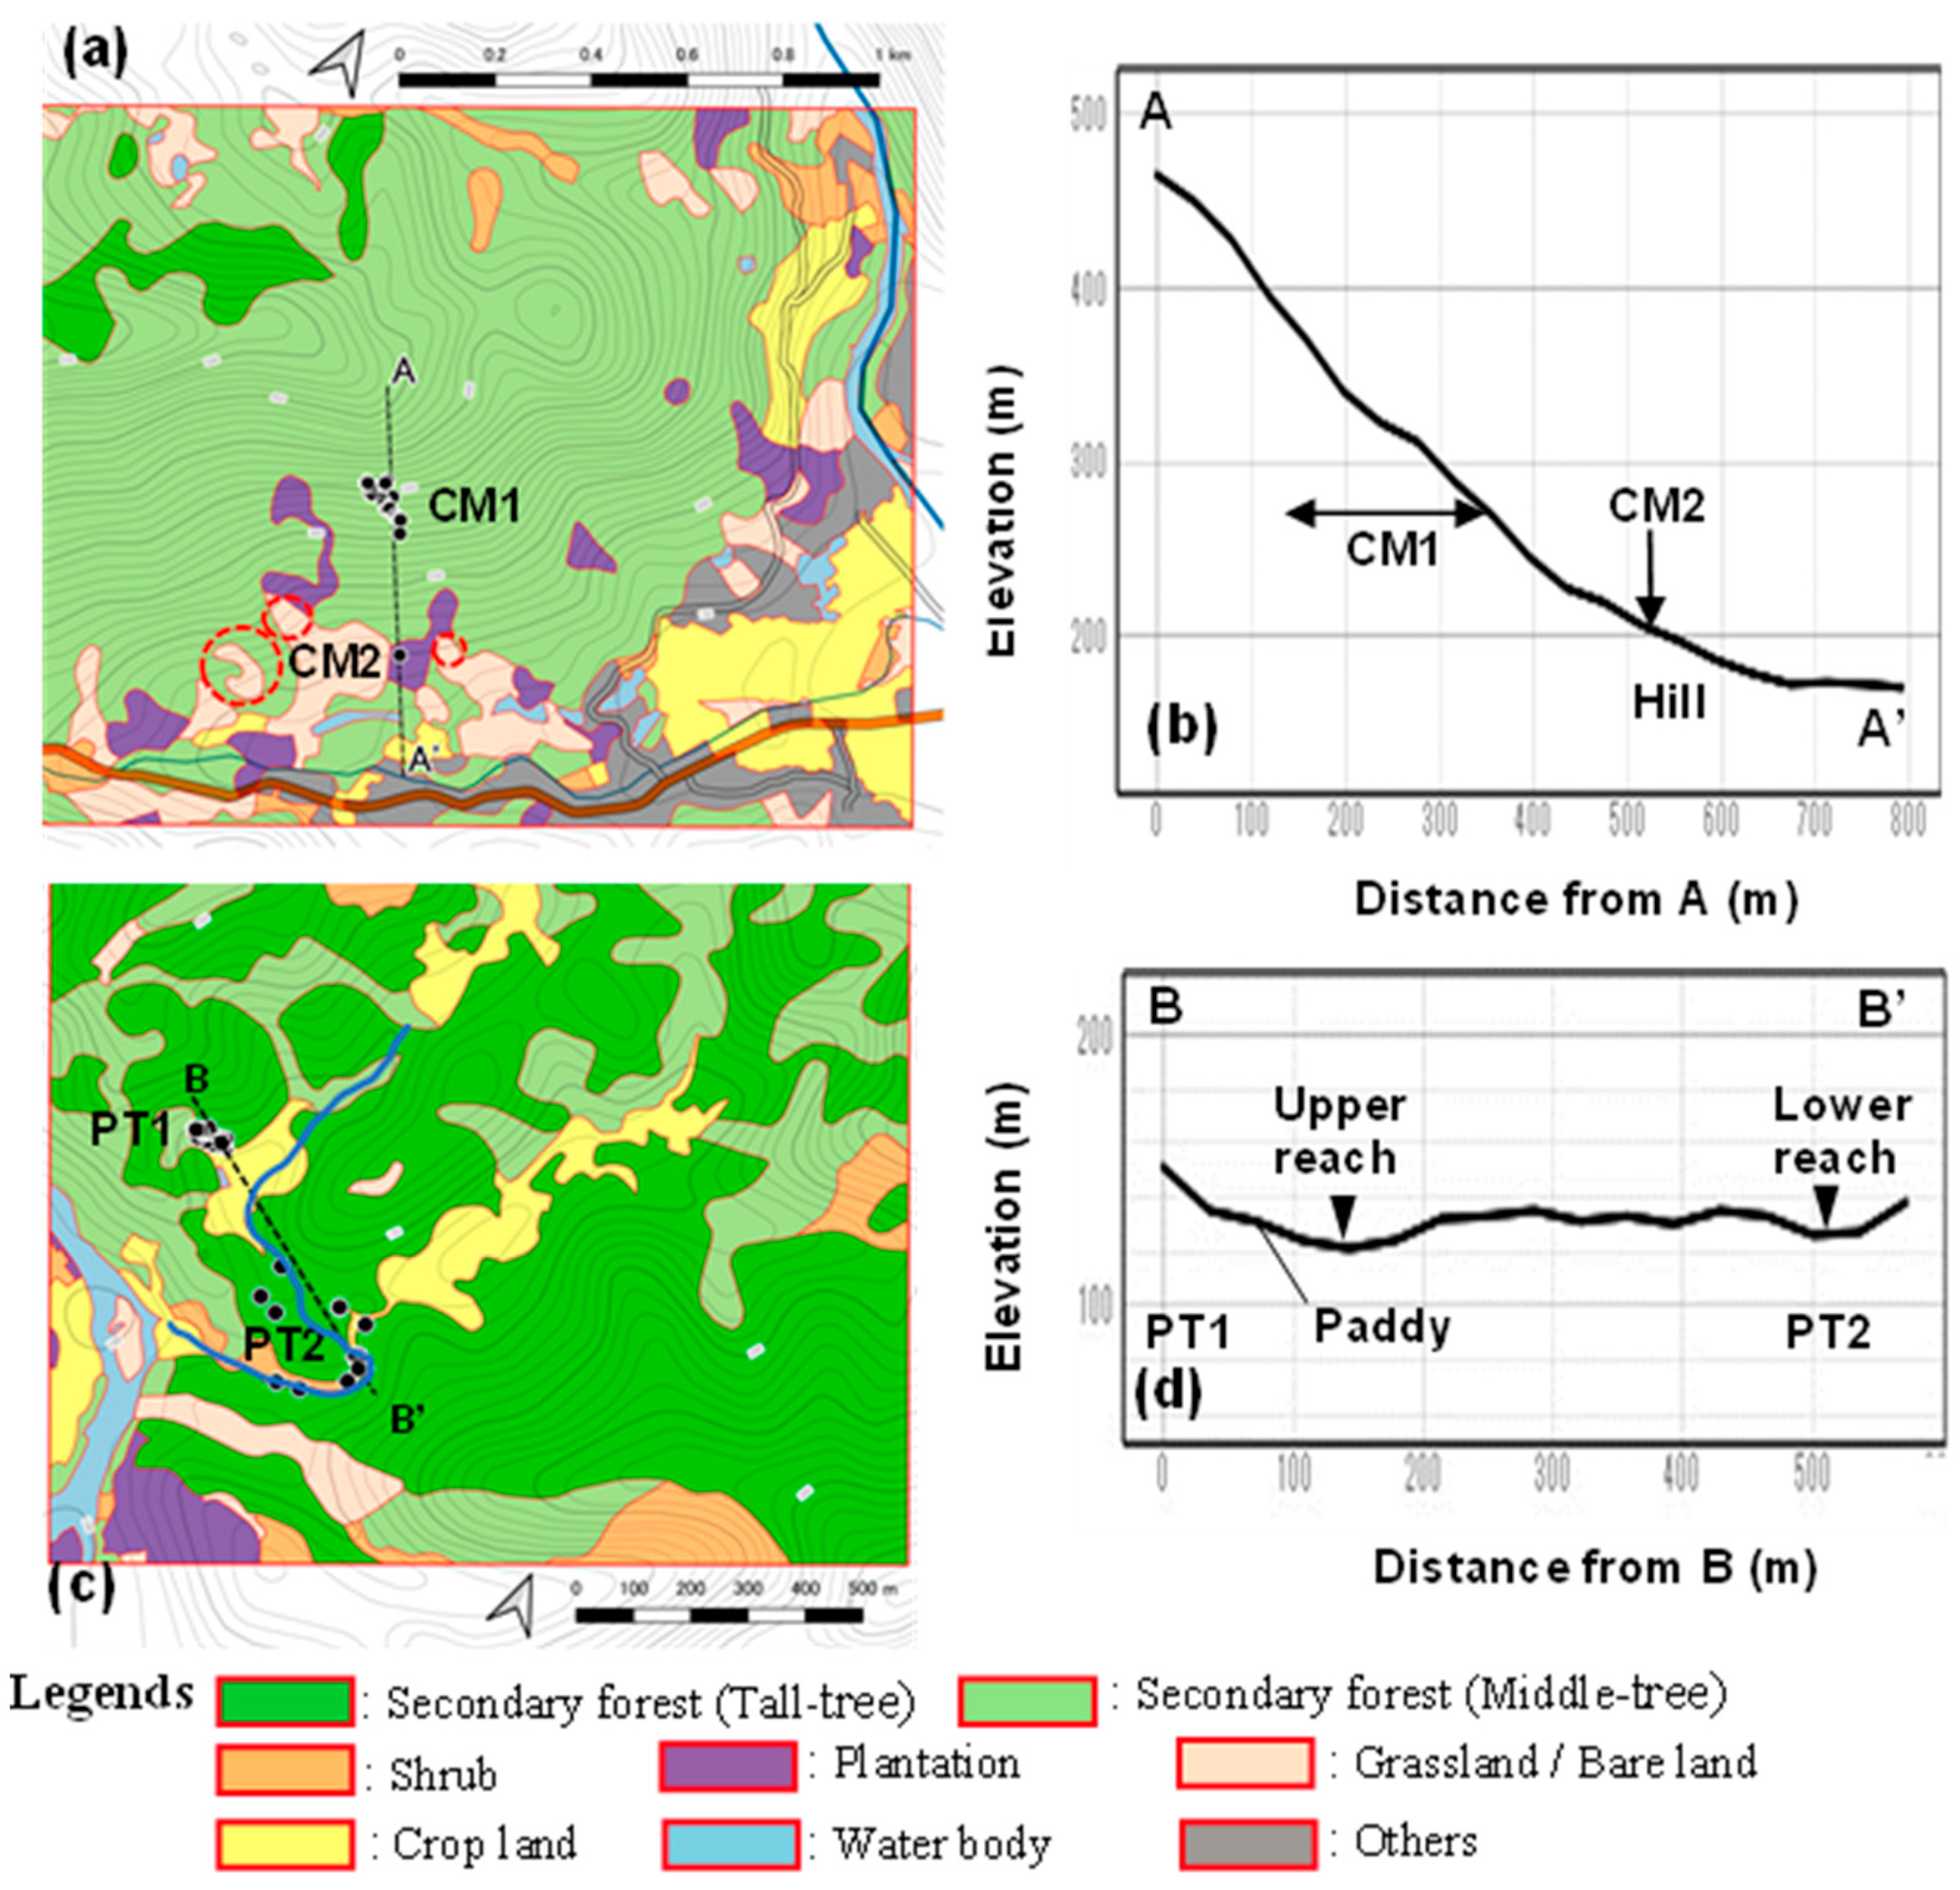
The vegetation and land-use types of the areas, including CM, PT, and NS, and their surroundings (ca. 1.5 km × 1.5 km), were obtained using Google Earth (2022) and confirmed by in situ observations on 5–9 December 2022. Regarding vegetation type, the tree stands were divided into tall, middle, and shrub in relative height in the respective areas. Subsequently, the polygons of vegetation and land-use types, and localities of C. quephongensis trees obtained from the previous study [15] were overlaid onto the contour maps (opentopomap.org, accessed on 1 November 2022).

2.2.4. Age Distribution Patterns

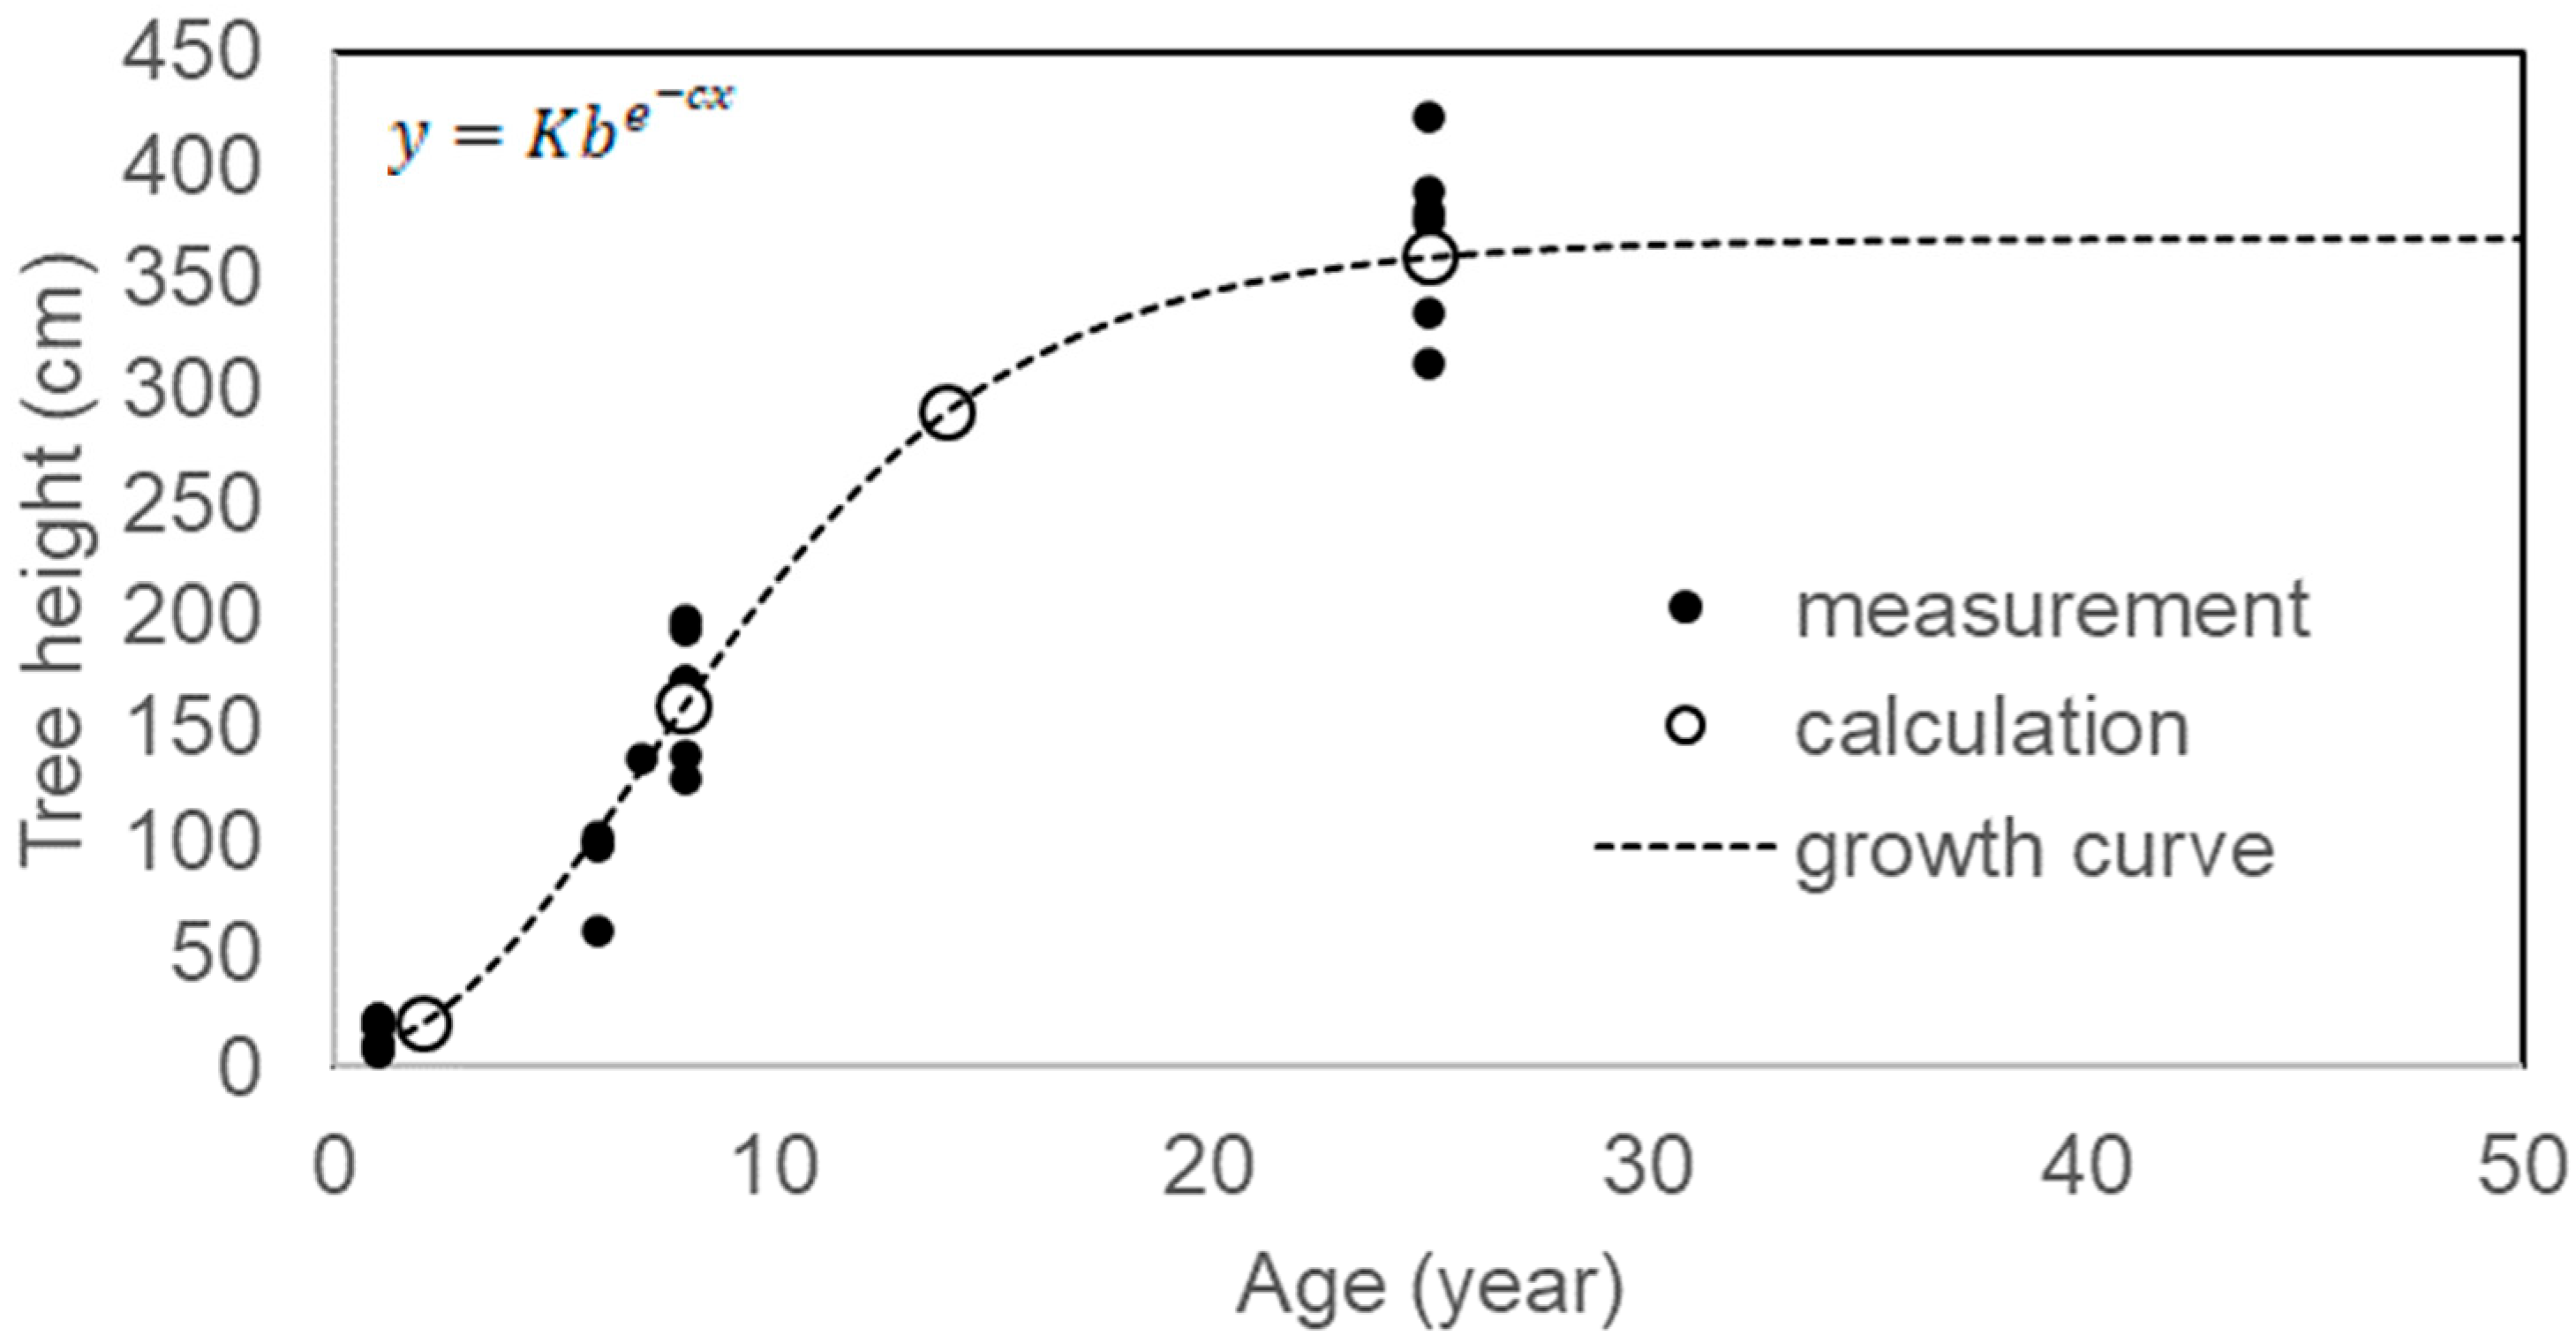
Based on the growth curve of this species (Figure 3) [15], age was categorized by tree height into seedling and sapling (Seed. + Sap.), young tree phase I (Y-tree I), young tree phase II (Y-tree II), and old tree (O-tree); consequently, the age distribution pattern of each patch was analyzed, excluding CM1 and CM2 because of the exploitation of saplings from CM1 to transplant into CM2 in the cinnamon plantation. Age category was defined as ≤150 cm, <8-year-old; ≤240 cm, <11-year-old; ≤280 cm, <13-year-old; >280 cm, ≥13-year-old. Y-trees and older trees were able to reproduce. Data on tree height in the PT and NS populations were obtained from a previous study [15].

2.2.5. Multi-Stemming

C. quephongensis is a multi-stemmed tree, a key factor for recovery from damage. Thus, focusing on this trait, the following were analyzed: (1) the relationship between multi-stemming and aging; and (2) the differences in this trait among habitats.
For the former, this species has been reported to increase almost linearly with tree height up to approximately 300 cm with age [15]; thus, if multi-stemming is induced with aging, the number of stems correlates with tree height up to 300 cm. We calculated a correlation coefficient between variables of tree height (TH) and the number of stems (NOS)—r = Cov (x,y)/σxσy, where r is correlation coefficient; Cov (x,y) is covariance of TH and NOS; σx is standard deviation of TH; σy is standard deviation of NOS—with p < 0.05 using previous data [15] to clarify the possibilities of the stems being multiplied with aging (if r > 0.5, two variables are correlated).
For the latter, two naturally distributed patches were included in the same local population; however, growth in heterogeneous habitats was compared in terms of the ratio of multi-stemmed individuals. In addition, a principal component analysis of tree height (TH), stem diameter (SD), number of stems (NOS), and crown width (CW) of these two patches was conducted to obtain the eigenvector of the principal components (PCs). Subsequently, the relationship between the patches and four variables was analyzed using scores of PCs with eigenvalue > 1.
The above analyses were conducted with the data obtained from previous study [15], using BellCurve for Excel (version 4.00) (Social Survey Research Information Co., Ltd., Tokyo, Japan).

3. Results

3.1. Micro-Climate

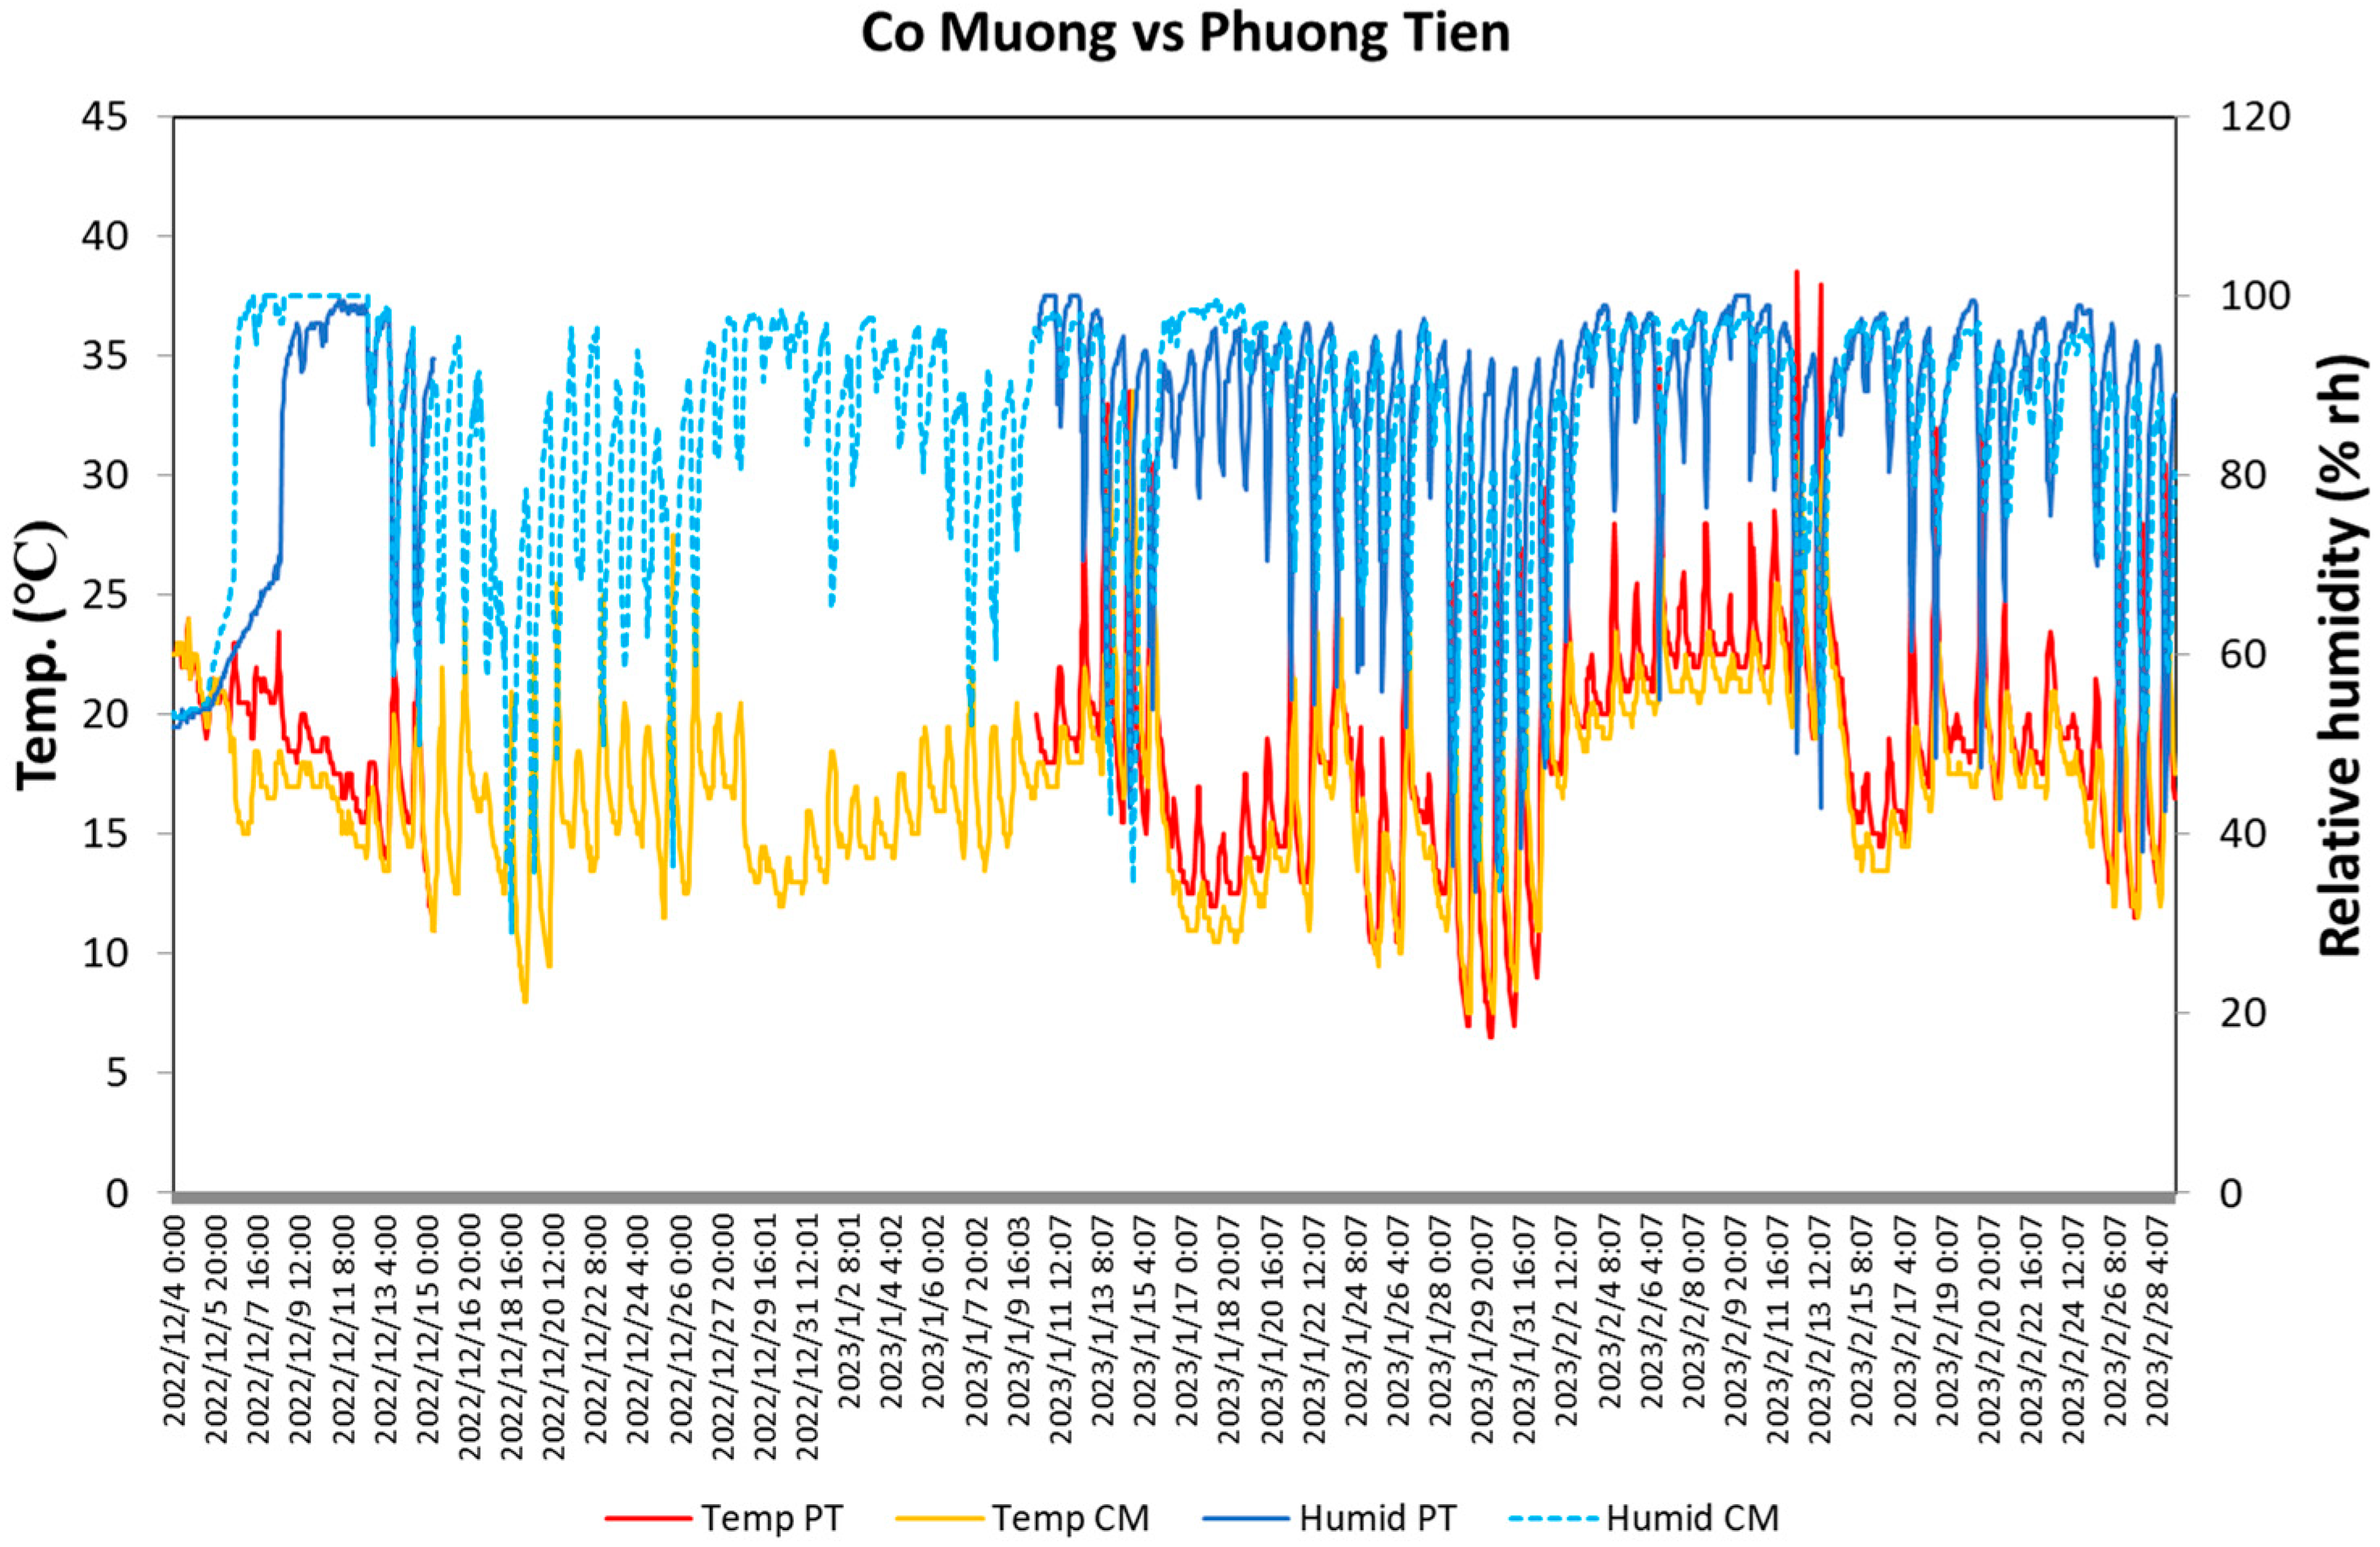
The mean temperature and relative humidity (rh) of the flowering season from 4 December 2022 to 28 February 2023 in CM and PT were 17.0 °C and 85.3%rh (17.5 °C and 86.3%rh for the excluded period of PT because of unavailable data), and 20.1 °C and 85.5%rh, respectively. The temperature fluctuated between 21.2 ± 0.6 and 15.2 ± 0.5 °C for CM, and 24.7 ± 0.7 and 15.9 ± 0.5 °C for PT during the day at both sites (4–14 December 2022 and 11 January–28 February 2023) (Figure 4), and the relative humidity changed from 94.0 ± 1.0%rh and 94.1 ± 1.2%rh in the morning to a minimum of 74.1 ± 2.5%rh and 65.9 ± 2.3%rh in the afternoon (Table 1).

3.2. Population Size and Floristic Composition of the Habitats

The size and habitat characteristics of the naturally distributed populations were similar, except for those of PT2. C. quephongensis primarily grew with a population density of 1.1 individual/100 m2–1.4 individual/m2 under the relatively close canopies (canopy openness: 18.8–36.5%) with a height of approximately 20 m and a tree density of approximately 2.0 individual/100 m2–3.0 individual/100 m2 on the steep slopes (15°–43°) facing south. In contrast, the population size of PT2 was lower in density, with 0.3 individual/100 m2, inhabiting the lower height of the stand (16.0 m in canopy height) (Table 2).
Floristic composition was also similar among the stands on the slopes. The common species were Vernicia montana and Melia azedarach in the canopy layer, while Symplocos sp., Quercus sp., and Livistona sp. were dominant in the second layer of CM1 and PT1, respectively. Anodendron sp. in CM1, a climbing plant, was abundant in the second layer. Stream banks were also the habitats of C. quephongensis, scattering with mean altitude of 1.07 m from the stream bed, including Fraxinus griffithii and C. loureiroi in the canopy and second layer, respectively, as the dominant species (Table 2).
Anthropogenic populations of CM2 and NS grew in cinnamon plantations (C. loureiroi) and bamboo (Dendrocalamus sp.) with Acacia mangium stands, respectively. The plantation was well managed, with thinning to maintain a similar tree density (4.5 individual/100 m2) to the natural stands for CM1 (2.3 individual/100 m2–3.3 individual/100 m2). V. montana and M. azedarach also grew in association with cinnamon trees. In contrast, NS had a high tree density, with 7.1 individual/100 m2–7.6 individual/100 m2 (Table 2).

3.3. Habitat Characteristics in the Landscape Perspective

Local populations, CM and PT, inhabited different landscape patterns. The former was distributed on a low-altitude mountain (up to EL: 550 m) slope, whereas the latter grew in a riparian area (Figure 5); thus, the former was named the mountain slope type, and the latter was called the riparian type in this study (Table 2).
The mountainous area of CM was covered with secondary forest aged approximately 25 years, regenerated after the termination of slush-and-burn farming (SBF) [15], and tree height was relatively homogeneous; only the trees on the mountain ridge were taller, that had not been used for SBF (Figure 5a). The mountain slope was steep, with a gradient of 15°–30°, 20° (arctan 80 m/200 m) on average (Figure 5b); however, the lower part of the slope was relatively gentle, with a hill-like shape due to sedimentation with gigantic rocks. Therefore, this is used for plantations, including CM2, croplands, and housing. Grasslands and bare lands were on the slopes, which were attributed to anthropogenic modifications or slope failure. As indicated by traces of land failure, the slope of this species was vulnerable and easily collapsed.
The riparian area of the PT was distributed at the elevation of 130 m–140 m in the valleys (Figure 5c), the watercourse meandered, and the stream-bed gradient was gentle (Figure 5d; the altitudes of the stream beds of the upper and lower reaches are almost the same). The sedimented area in the valley was used as a paddy field, and a few houses existed in its surroundings. PT1 inhabited the forests on the valley slopes behind the sedimented area, indicating that PT1 grows on vulnerable slopes and functions as a source of sediment. The valley floors were merely used as paths in the remaining reaches, and C. quephongensis was scattered on the banks. All stands in this area were secondary forests regenerated after SBF termination [15]; however, they were heterogeneous in tree height, the stands were near crop lands such as paddy fields, and the houses were more frequently affected by anthropogenic activities; tall and middle-sized stands were distributed in a mosaic pattern in this area.
The anthropogenic population of NS was located on a valley slope at an elevation of 160 m; thus, it was also categorized as the riparian type (Table 2). The population grew in bush-like stands comprising bamboo and planted acacia trees, parallel to the river, at an altitude of approximately 20 m from the riverbed. A road was constructed along the river, and a small community existed near the population. Behind the community, on the mountainside, the slope was covered with medium-sized trees, and deforested patches were scattered in a mosaic pattern.

3.4. Age Distribution Patterns

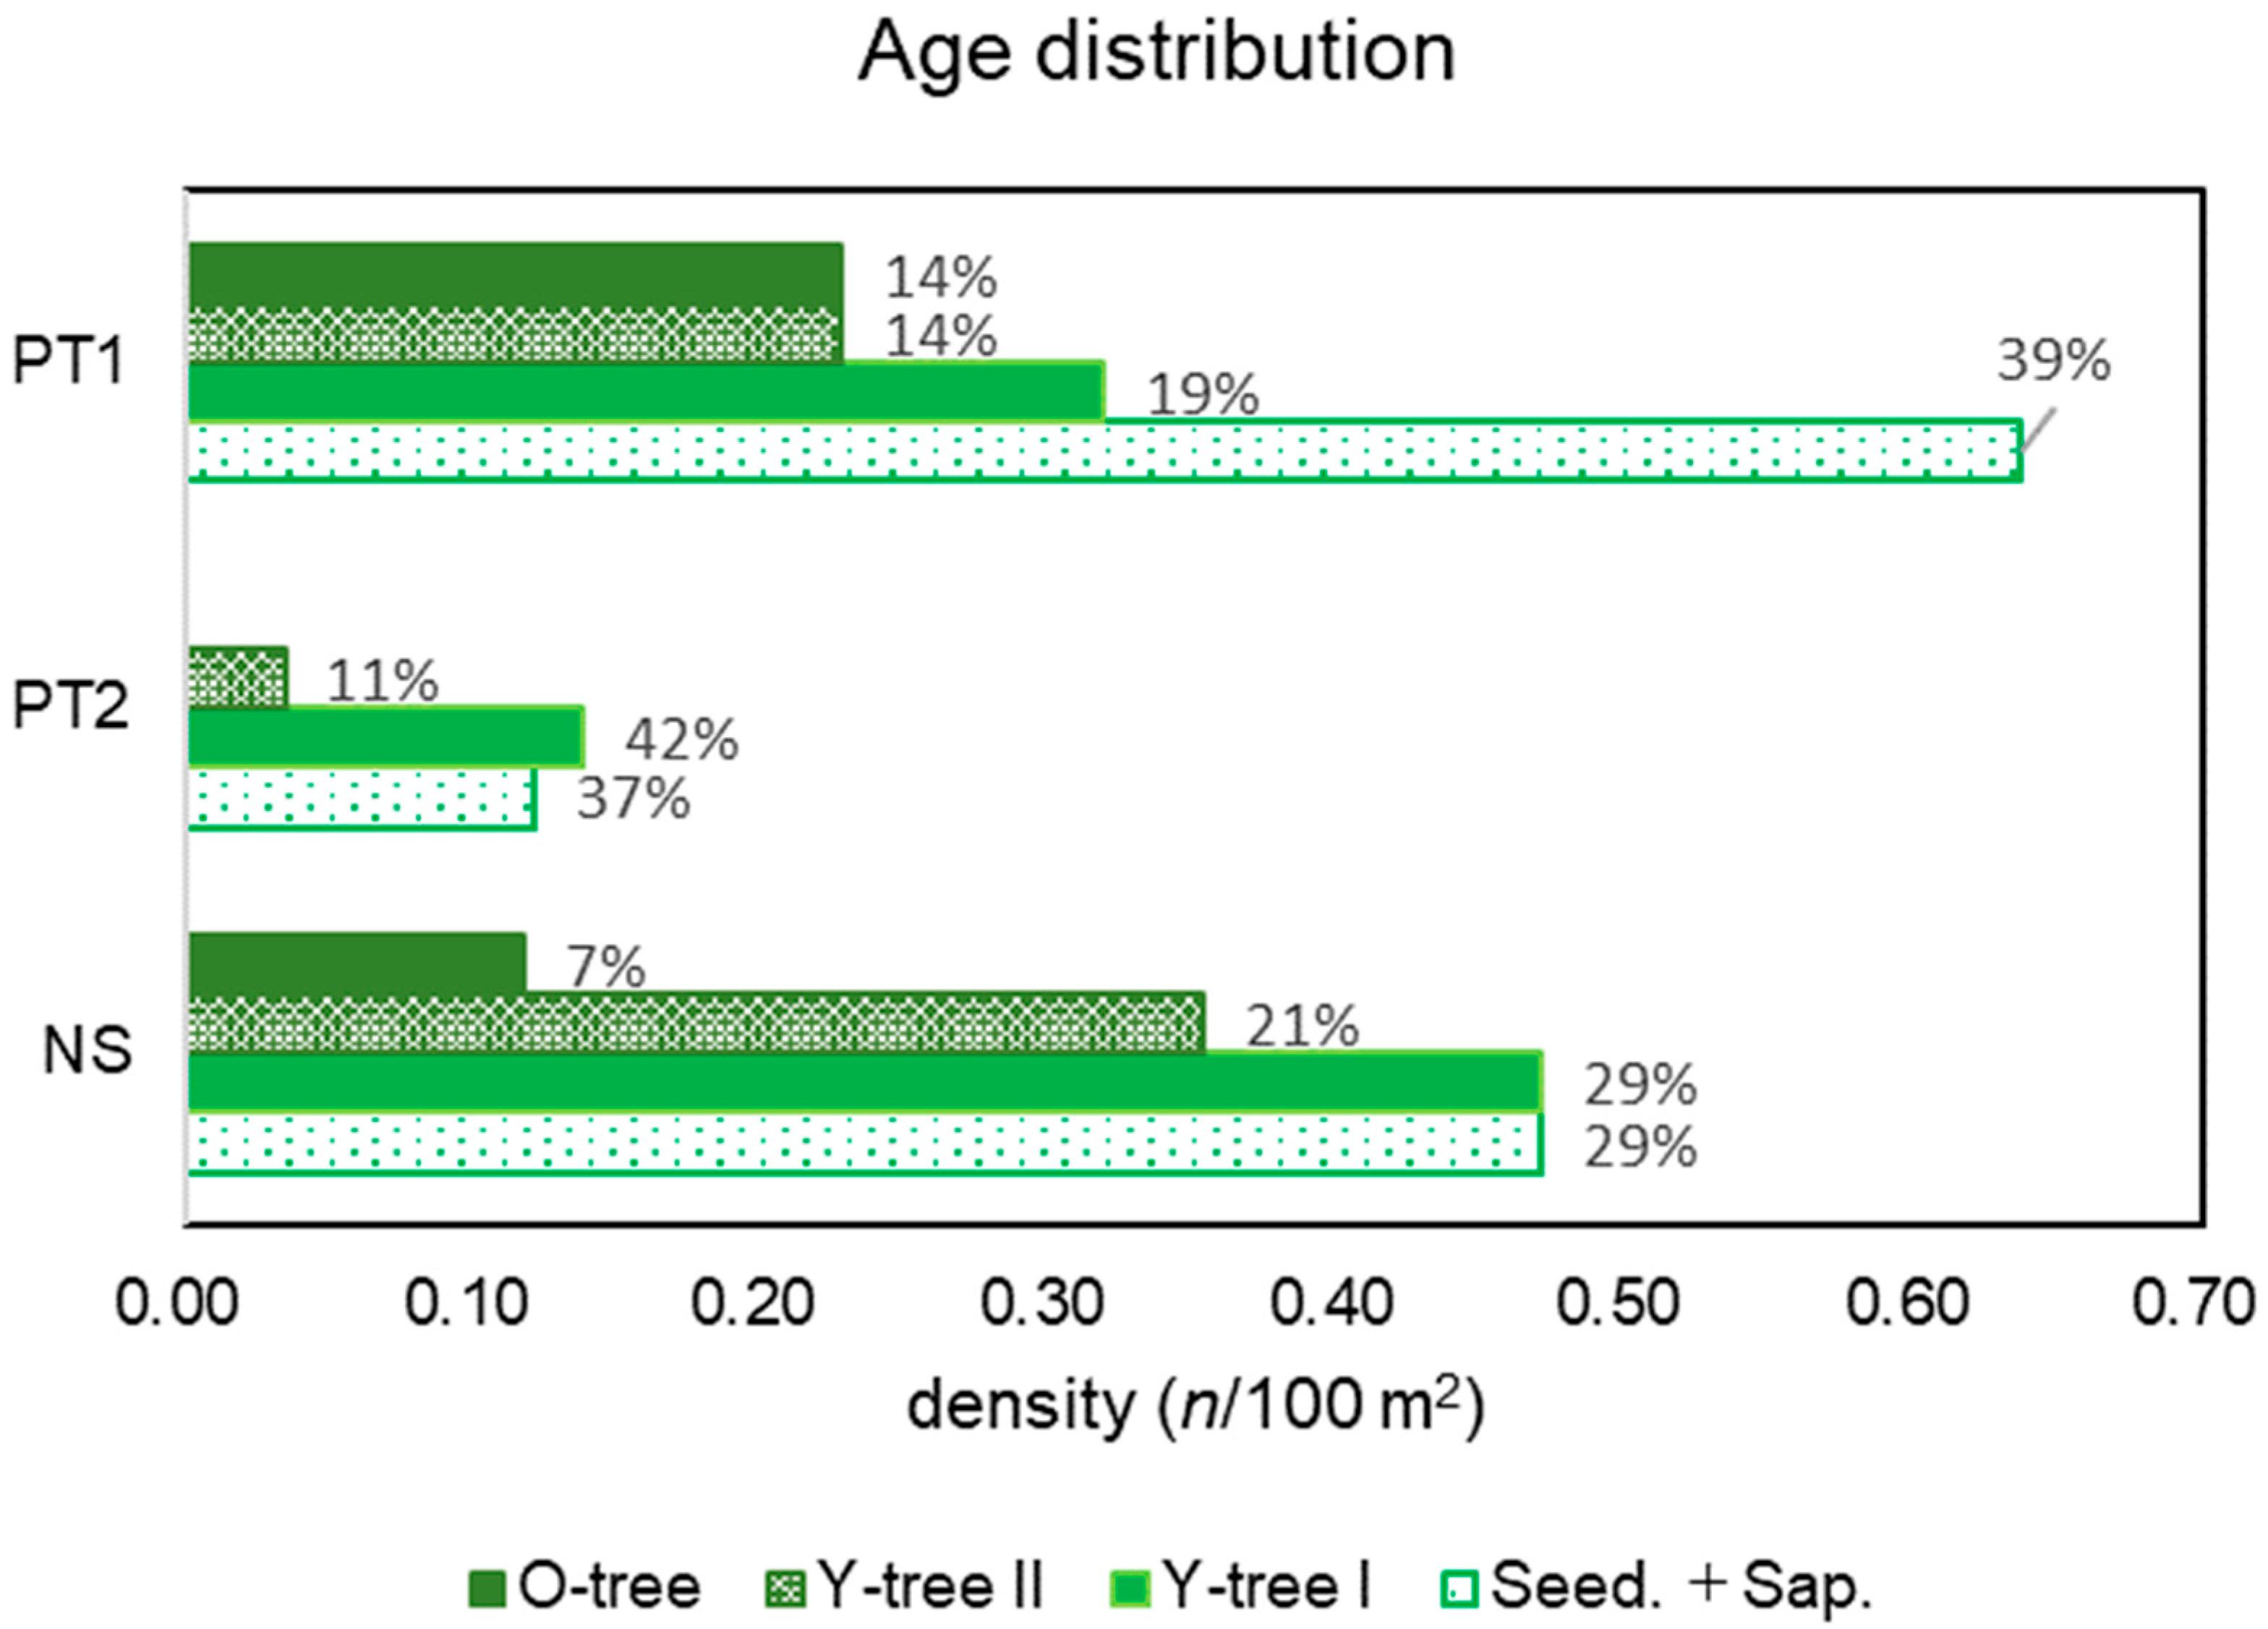
PT included heterogeneous habitats and their age distribution patterns differed; that of PT1 was pyramid shaped with 39% of Seed. + Sap., whereas PT2 was inverted and pyramid-shaped and lacked O-trees (Figure 6). This implies that PT is expanding in population size, whereas PT2 is shrinking.
In terms of NS, tree phase, that is over the age category of Y-tree I, formed a pyramid shape; however, the portion of Seed. + Sap. was the same as that of Y-tree I (Figure 6). The saplings transplanted seven years ago occupied the tree phase with a density of 0.9 individual/100 m2. According to the landowner, the initial density was 2.4 individual/100 m2, and more than half of the trees had disappeared. Considering the portion of the next generations of Seed. + Sap., the population could shrink.

3.5. Multi-Stemming and Growth

The number of stems in PT (PT1 and PT2) did not correlate with tree height; the correlation coefficient was 0.1978 (p = 0.1778), implying that multi-stemming did not constantly develop with extension growth; that is, without aging in this case, but also induced by external factors.
Figure 7 shows the ratios of multi-stemmed individuals in the tree phase (Y-tree + O-tree), seedlings, and saplings (Seed. + Sap.). The ratio of multi-stemmed for the tree-phased individuals was more than half (72.7%) in PT2 inhabiting the riparian forests, but less than half (41.2%) in PT1 distributed in the secondary forests. However, in terms of Seed. + Sap.-phased individuals, both PT1 and PT2 had a lower proportion of multi-stemmed individuals than tree-phased individuals.

3.6. Variability between Patches

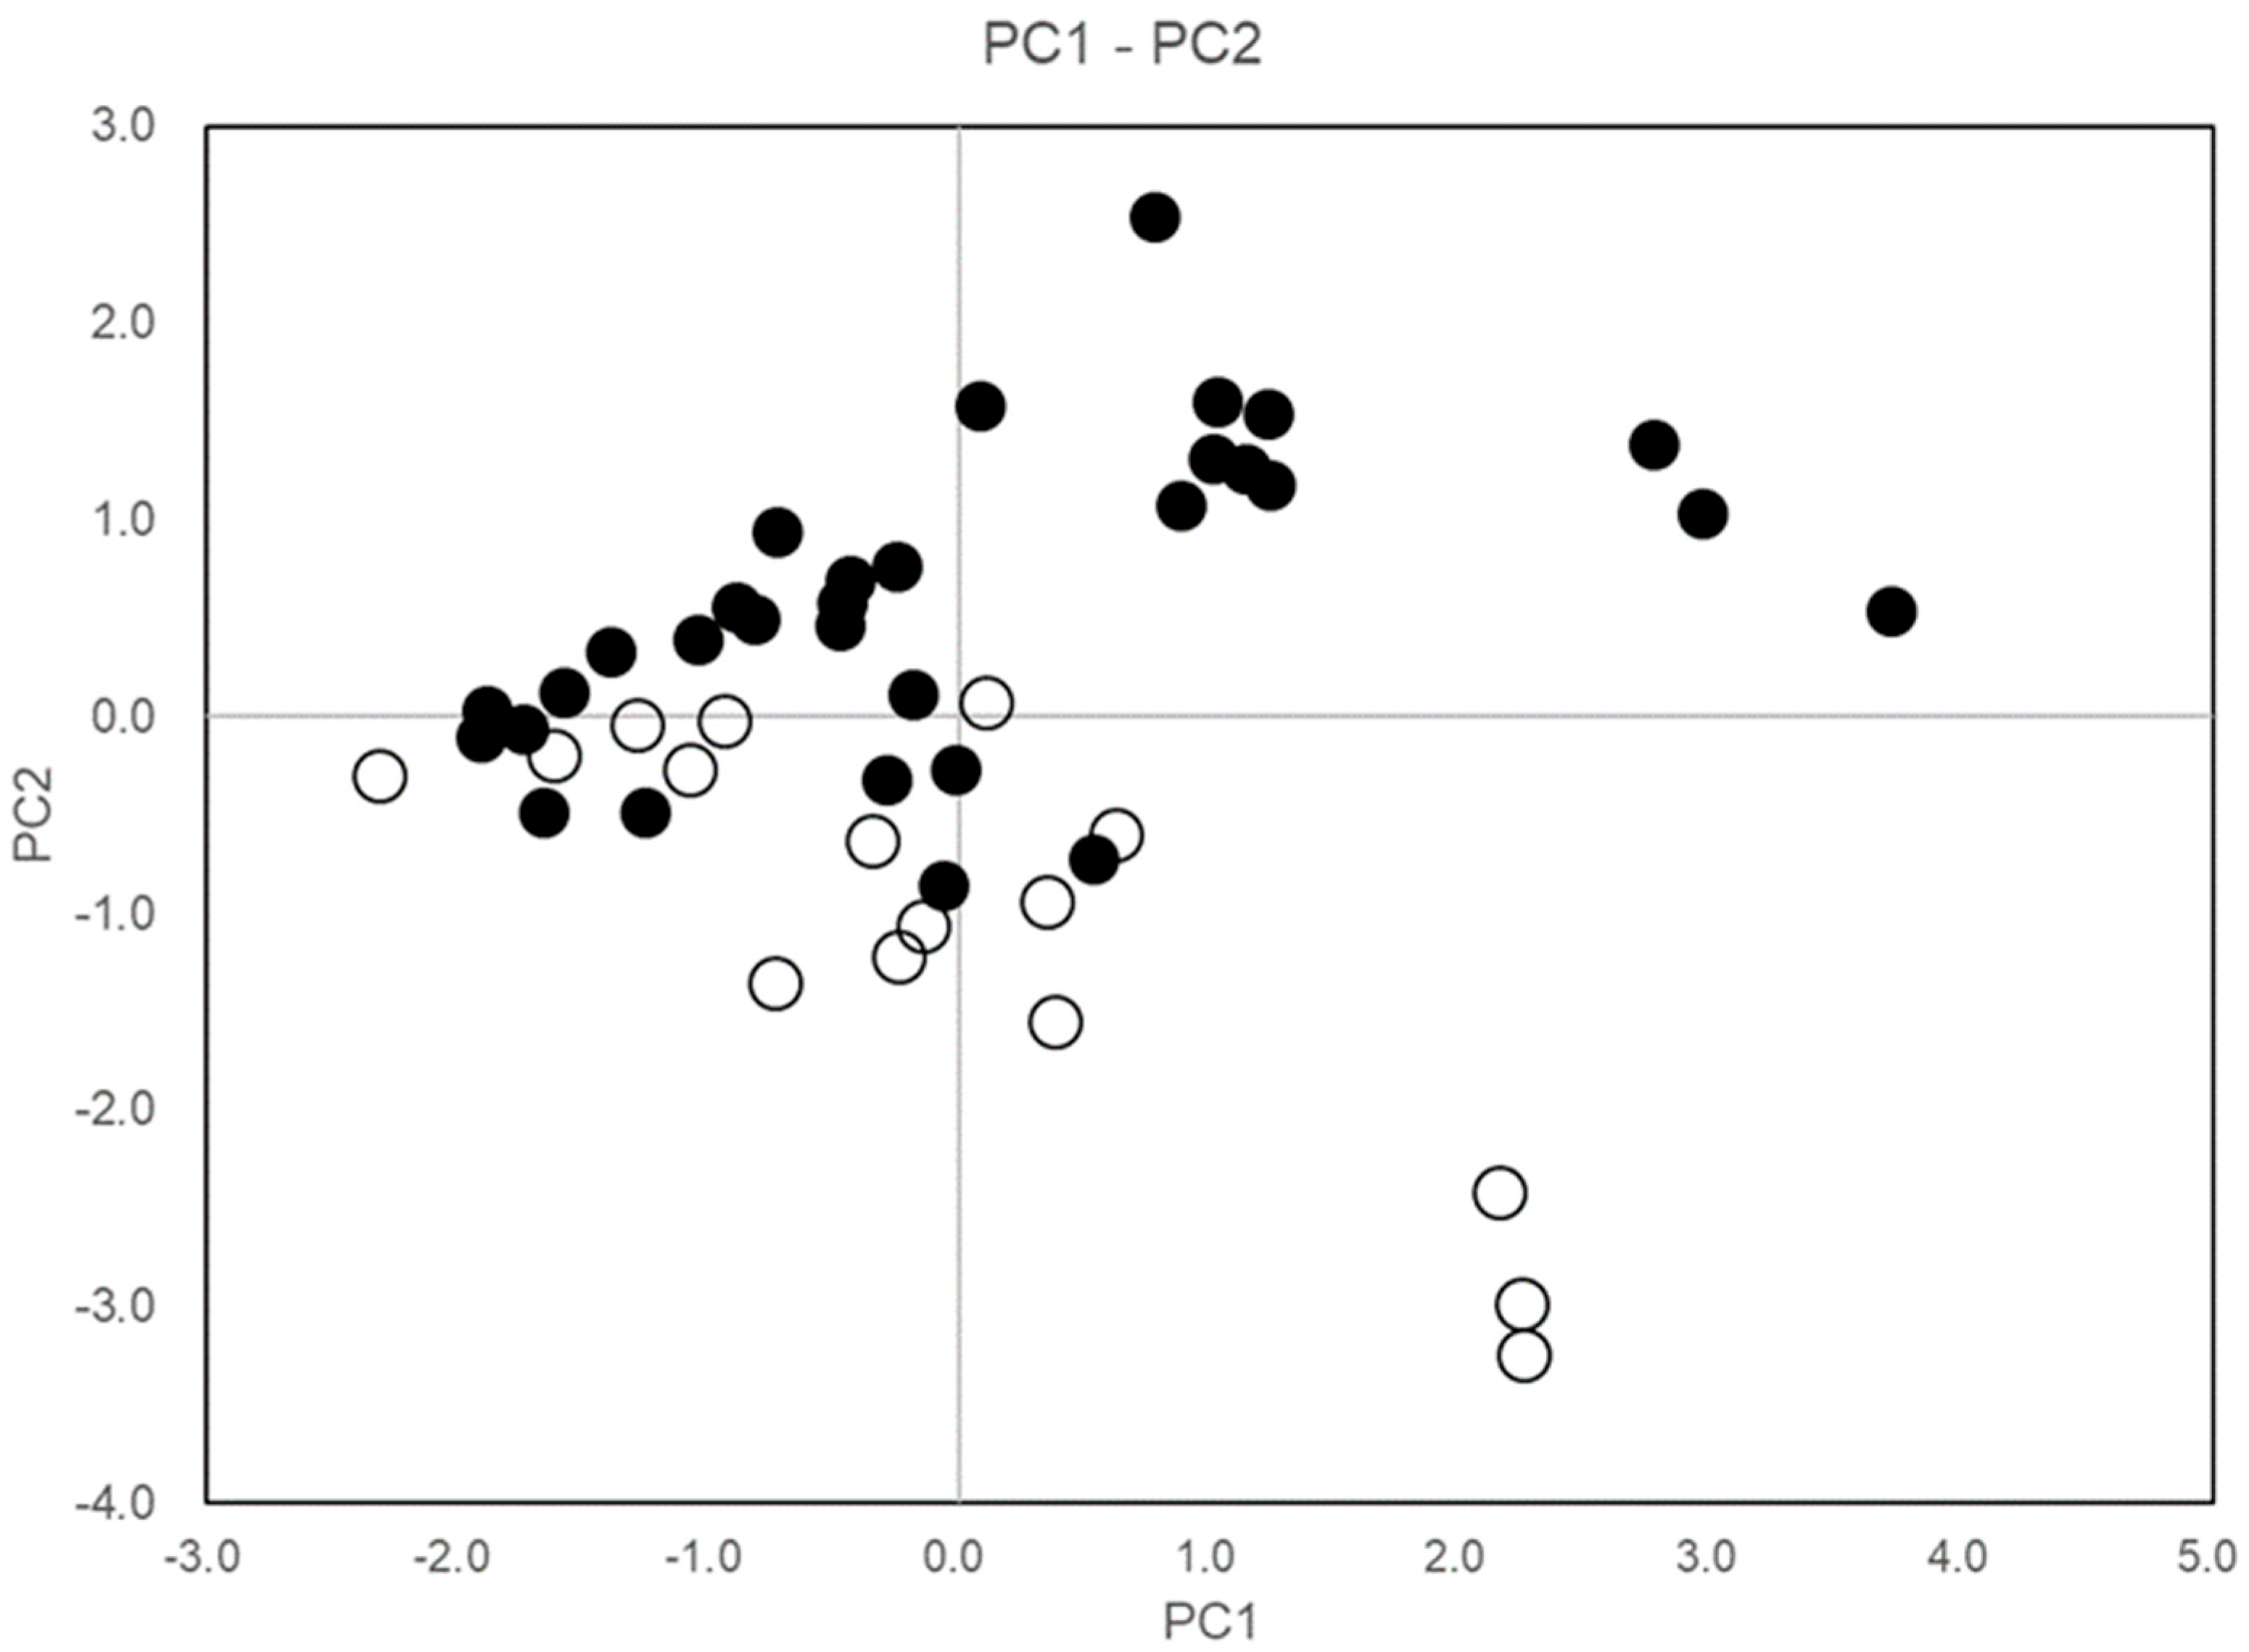
Table 3 was derived from the principal component analysis of the TH, SD, NOS, and CW variables. The first two principal components (PC1 and PC2) contributed 82.28% of C. quephongensis individual variability, and PC1 was correlated with TH (r = 0.6556) and CW (r = 0.5626), whereas PC2 was negatively correlated with NOS (r = −0.6288) but positively correlated with SD (r = 0.6521). This implies that PC1 and PC2 indicate variability in size (short with narrow crown–tall with wide crown) and growth pattern (single stem with large diameter and multiple stems with small diameter), respectively.
Figure 8 shows a sample score plot for PC1–PC2, indicating that PT1 varied with tree height and crown width, whereas PT2 ranged from single to multiple stems and from large to small stem diameters.

4. Discussion

4.1. Vulnerability of the Habitats

Table 4 summarizes the habitat characteristics of the study area. CM1 and PT1 grew on slopes that are vulnerable to slope failure and/or soil erosion; thus, the included stands of this species were pioneer forests comprising V. montana, observed frequently at the margins of evergreen forests [21] and M. azedarach, a deciduous tree that grows in poor soil and dry conditions [22] in the canopy layer. These pioneer species were once recruited for disturbed areas. On the other hand, species inhabiting evergreen broadleaved forests in the tropics and subtropics in Asia were dominant, with these pioneer species in the second layer, such as the genus Symplocos in CM1 and Quercus in PT1 [23,24,25] A few decades have passed since the SBF was terminated; consequently, ecological succession has progressed, but the pioneer species still thrives in the canopy layers, possibly owing to irregular disturbances such as slope failure.
In contrast, PT2 inhabited the low-altitude stream banks from the stream bed in Fraxinus griffithii-dominated riparian forests [26], whose species component recruitment and growth are strongly affected by floods [27,28], while C. quephongensis was one of the dominant species in the understories of the forests.
The habitats of this species were heterogeneous among the sites, but three of them were commonly affected by irregular or regular disturbances; CM1 and PT1 were irregularly disturbed by slope failure and soil erosion, whereas PT2 was regularly submerged by flooding, thus, C. quephongensis may be a natural and anthropogenic disturbance-adapted species.

4.2. Adaptation Mechanisms

4.2.1. Growth Pattern Perspective

PT consisted of two patches, PT1 and PT2, which differed in their morphological variables. The ratio of multi-stemmed trees in the tree phase in PT2 was greater than that in PT1 (Figure 7).
PT1 ranges in tree height and crown width from smaller to larger; however, PT2, which is frequently submerged by flooding in the rainy season, is characterized by single–multiple stemming (Figure 8), and in general, multi-stemmed architecture is commonly observed in riparian forests [29]. C. quephongensis can be frequently damaged by flooding but can recover through the development of lateral shoots, consequently becoming a multi-stemmed tree. Multi-stemming is a key trait that allows this species to persist in frequently disturbed-forests [30,31].
The relative humidity records show that the inside of the forests was misty in the morning during the winter season, that is, a cloud-forest-like micro-climate in the flowering season for this species. A multi-stemmed architecture is a typical trait of trees in cloud forests because fog and clouds reduce the amount of light received [32]. This occurred only during the flowering season; thus, the contribution of multi-stemming to adapting to the microclimate of its habitat throughout the year has not been elucidated, but it acts advantageously, at least during the winter season.

4.2.2. Population Structure Perspective

PT1 and PT2 included in the same local population differed in floral characteristics and population density. PT1 grew under the canopy of V. montana–M. azedarach on a steep slope with a higher density of 1.4 individual/100 m2. While PT2’s habitat was a typical riparian forest of F. griffithii with a lower density of C. quephongensis:0.3 individual/100 m2 (Table 2).
Age distribution patterns also differed between patches (Figure 6); PT1 was pyramid shaped, supported by 39% of the total of seedlings and saplings, indicating expansion of the patch size. In contrast, PT2 age structure was inverted pyramid-shaped; that is, the density of seedlings and saplings was less than that of the tree phase individuals, indicating a reduction in patch size. This population structure was previously observed in CM1 on 3 October 2018; however, a riverside patch was not confirmed on 5 December 2022. Likewise, habitats in the population are heterogeneous; some are of good quality, and some are poor for the species.
Habitats producing demographic excesses are called source habitats, whereas those producing demographic deficits are called sink habitats [33]. Based on this definition, PT1, with an expanding age distribution pattern, can be the source habitat, whereas PT2, with a diminishing pattern, which is frequently disturbed by flooding, can be the sink habitat. The latter can persist through the seed supply from the former. A recent study revealed that C. japonica disperses seeds not only by gravity but also by rodents [34]; thus, source habitats can be a seed supplier to sink habitats. The seed dispersal of C. quephongensis should be further studied; however, the sink-source habitat structure of this species is an important perspective for understanding its adaptation mechanisms.

4.3. Recommended Measures for Conservation

4.3.1. Zonation

C. quephongensis populations are at risk of diminishing because of the deregulated exploitation of its flowers. Considering the sustainable use of these natural resources, community-based harvesting is recommended based on the zonation of harvest and protection areas. In the PT-distributed area, relatively succession-progressed stands with taller canopies (ca. 20 m, Table 1) were the habitats of this species. However, the population size of this species expands as succession progresses [15]; thus, even less-progressed evergreen broadleaved stands near the current habitats could be potential habitats. Young stands, which are potential habitats, should be added as protection areas for zonation.

4.3.2. Control of Succession

This study revealed that C. quephongensis grew preferentially under pioneer forest canopies on vulnerable slopes that are frequently disturbed. In contrast, C. quephongensis grown in the cinnamon plantation was planted on a gentle hill-like slope where other competitors would be easily recruited. In fact, the anthropogenic population in the bush-like stand diminished the density of C. quephongensis. Therefore, the owner regularly thinned the shrub and herb layers, and the trees associated with C. loureiroi were similar to the dominant species at CM1 and PT1. Extreme succession-progressive stands could pressure C. quephongensis to persist. Even in naturally growing stands, adequate thinning is recommended to control succession.

5. Conclusions

This study revealed that C. quephongensis preferentially inhabited pioneer forests comprising V. montana and M. azedarach, and a riparian forest of F. griffithii in vulnerable environments that are frequently disturbed, such as collapsed, eroded, and flood-occurring areas. Their physiological capacity for multi-stemming acted as an advantageous trait to adapt to such environments; in fact, the ratio of multi-stemmed individuals was significantly greater in the more frequently disturbed habitats, such as the riparian forest. From a demographic perspective, the source–sink habitat structure can be key for this species to persist. For conservation measures, protection of potential habitats with zonation is recommended, and considering this species grows in the succession-controlled habitats, succession management is required for the populations to be maintained.

Author Contributions

Conceptualization, T.T.T. and K.T.; methodology, K.T. and H.N.; software, K.T. and R.T.; validation, T.T.T. and H.N.; formal analysis, K.T. and H.N.; investigation, K.T., H.N., T.T.T.N., V.H.T.N., T.M.T.N. and H.V.B.; resources, H.N. and R.T.; data curation, T.T.T.N., V.H.T.N. and T.M.T.N.; writing—original draft preparation, K.T.; writing—review and editing, T.T.T.; visualization, R.T.; supervision, T.T.T.; project administration, T.T.T.; funding acquisition, K.T. All authors have read and agreed to the published version of the manuscript.

Funding

This research was funded by the Pro Natura Foundation Japan’s 33rd Pro Natura Fund.

Institutional Review Board Statement

Not applicable.

Informed Consent Statement

Not applicable.

Data Availability Statement

The data presented in this study are available on request from the corresponding author.

Acknowledgments

We thank the Que Phong People’s Committee for their cooperation with the survey.

Conflicts of Interest

The authors declare no conflict of interest.

References

  1. Le, N.N.H.; Luong, D.V.; Do, D.N. Additional conditions for effective publication of Camellia quephongensis and Camellia hamyenensis. Int. Camellia J. 2021, 53, 99–107. [Google Scholar]
  2. Tran, M.D.; Nguyen, T.T.; Hoang, S.T.; Dang, T.V.; Phung, T.D.; Nguyen, T.V.; Dao, D.T.; Mai, L.T.; Vu, L.T.; Nguyen, T.H.; et al. Golden Camellias: A Review. Arch. Curr. Res. Int. 2019, 16, 1–8. [Google Scholar]
  3. Le, N.N.H.; Luong, D.V.; Nguyen, C.V.; Pham, T.D.T.; Luu, T.T.; Pham, T.V. An updated checklist of Theaceae and a new species of Polyspora from Vietnam. Taiwania 2020, 65, 216–227. [Google Scholar] [CrossRef]
  4. Nguyen, L.T.; Tran, N.; Uematsu, C.; Katayama, H.; Luong, D.V.; Hoang, S.T.; Nguyen, K.D.; Nguyen, H.V.; Thai, T.C. Two new species of Camellia (Theaceae) from Vietnam. Korean J. Plant Taxon. 2018, 48, 115–122. [Google Scholar] [CrossRef]
  5. Do, D.N.; Luong, D.V.; Nguyen, C.D.; Hoang, S.T.; Le, H.T.; Han, J.E.; Park, H. A new yellow Camellia (Theaceae) from central Vietnam. Korean J. Plant Taxon. 2019, 49, 90–95. [Google Scholar] [CrossRef]
  6. Nguyen, H.D.; Luong, D.V.; Le, H.T.; Tran, T.Q.; Do, D.N.; Ly, S.N. Camellia puhoatensis (Sect. Archecamellia—Theaceae), a new species from Vietnam. PhytoKeys 2020, 153, 1–11. [Google Scholar] [CrossRef] [PubMed]
  7. Do, D.N.; Luong, D.V.; Le, H.T.; Nguyen, H.D.; Nguyen, N.T.; Ly, S.N. Camellia ngheanensis (Sect. Chrythanta: Theaceae), a new species from Central Vietnam. Phytotaxa 2020, 452, 209–216. [Google Scholar] [CrossRef]
  8. Ohmiya, A. Review Diversity of carotenoid composition of flower petals. Jpn. Agri. Res. Q. 2011, 45, 163–172. [Google Scholar] [CrossRef]
  9. Nguyen, H.V.T.; Pham, B.C.; Cam, I.T.; Doan, P.L.; Le, T.T.; Tran, T.Q.; Pham, L.Q. Flavonoids isolated from the flowers of Camellia chrysantha. Vietnam J. Sci. Technol. 2019, 57, 287–293. [Google Scholar] [CrossRef]
  10. Diep, T.T. Yellow camellias: A review of chemical constituents and biological activities. Dalat Univ. J. Sci. 2022, 12, 117–144. [Google Scholar]
  11. Tanikawa, N.; Kashiwabara, T.; Hokura, A.; Abe, T.; Shibata, M.; Nakayama, M. A Peculiar Yellow Flower Coloration of Camellia Using Aluminum-flavonoid Interaction. J. Jpn. Soc. Hort. Sci. 2008, 77, 402–407. [Google Scholar] [CrossRef]
  12. Dao, D.T.; Mai, L.T.; Tran, M.D.; Dang, T.V.; Ly, T.H.T.; Nguyen, T.V.; Phung, T.D.; Nguyen, T.P.T.; Ninh, K.V.; Dang, H.H.T.; et al. Cutting size and position affect rooting efficiency of Camellia impressinervis: A golden camellia. Plant Cell Biotechnol. Mol. Biol. 2019, 20, 179–187. [Google Scholar]
  13. Tran, D.V.; Tran, M.D.; Dao, D.T.; Mai, L.T.; Nguyen, T.T.; Dang, T.V.; Ly, T.H.T.; Nguyen, T.V.; Phung, T.D.; Nguyen, T.P.T.; et al. Effect of exogenous hormone and rooting medium on cutting propagation of golden Camellia (Camellia impressinervis). J. Appl. Hortic. 2020, 22, 159–163. [Google Scholar] [CrossRef]
  14. Chai, S.; Trang, J.; Mallik, A.; Shi1, Y.; Zou, R.; Li, J.; Wei, X. Eco-physiological basis of shade adaptation of Camellia nitidissima, a rare and endangered forest understory plant of Southeast Asia. BioMed Central Biol. 2018, 18, 5. [Google Scholar] [CrossRef] [PubMed]
  15. Takahashi, K.; Nishikawa, H.; Tanabe, R.; Tran, D.Q. Golden camellia as a driver of forest regeneration and conservation: A case study of value-chain forestry with Camellia quephongensis in Que Phong, Nghe An, North-Central Vietnam. Forests 2023, 14, 1087. [Google Scholar] [CrossRef]
  16. Zhu, X.; Tang, J.; Qin, H.; Bai, K.; Chen, Z.; Zou, R.; Liu, S.; Yang, Q.; Wei, X.; Chai, S. Contrasting adaptation mechanisms of golden camellia species to different soil habitats revealed by Nutrient Characteristics. Agronomy 2022, 12, 1511. [Google Scholar] [CrossRef]
  17. Xu, Z.; Ren, H.; Wei, X.; Ouyang, K.; Li, D.; Guo, Y.; Wen, S.; Long, J.; Wang, J.; Hui, D. Distribution and conservation status of Camellia longzhouensis (Theaceae), a critically endangered plant species endemic to southern China. Glob. Ecol. Conserv. 2021, 27. [Google Scholar] [CrossRef]
  18. Inoue, K.; Fukushi, M.; Le, T.V.; Tsuruoka, H.; Kasahara, S.; Nimelan, V. Distribution of gamma radiation dose rate related with natural radionuclides in all of Vietnam and radiological risk assessment of the built-up environment. Sci. Rep. 2020, 10, 12428. [Google Scholar] [CrossRef]
  19. Trinh, H.D.; Luu, T.C.; Nguyen, A.T.; Tran, A.V.; Phan, G.H.; Takahashi, N.; Saddsy, B.L. Paleogene granite magmatism in the north of the Truong Son belt and implication for crustal evolution. Vietnam J. Earth Sci. 2021, 43, 444–464. [Google Scholar] [CrossRef]
  20. Que Phong District People’s Committee: Location, Natural Conditions. Available online: https://nghean.gov.vn (accessed on 30 April 2023).
  21. Stuppy, W.; van Welzen, P.C.; Klinratana, P.; Posa, M.C.T. Revision of the genera Aleurites, Reutealis and Vernicia (Euphorbiaceae). Blumea Biodivers. Evol. Biogeogr. Plants 1999, 44, 73–98. [Google Scholar]
  22. EL-Juhany, L.I. Evaluation of some wood quality measures of eight-year-old Melia azedarach trees. Turk. J. Agric. For. 2011, 35, 165–171. [Google Scholar] [CrossRef]
  23. Fritsch, P.W.; Kelly, L.M.; Wang, Y.; Almeda, F.; Kriebel, R. Revised infrafamilial classification of Symplocaceae based on phylogenetic data from DNA sequences and morphology. Taxon 2008, 57, 823–852. [Google Scholar] [CrossRef]
  24. Yang, X.; Yan, H.; Li, B.; Han, Y.; Song, B. Spatial distribution patterns of Symplocos congeners in a subtropical evergreen broad-leaf forest of southern China. J. For. Res. 2018, 29, 773–784. [Google Scholar] [CrossRef]
  25. Nguyen, N.L.; Do, D.S.; Nguyen, X.Q.; Tran, V.L.; Ngo, D.Q.; Tran, V.C.; Nguyen, D.K.; Lai, V.C.; Do, H.T.; Ngo, T.G.; et al. Final Report on Forest Ecological Stratification in Vietnam; UN-REDD Programme: Hanoi, Vietnam, 2011; p. 130. [Google Scholar]
  26. Camarero, J.J.; Colangelo, M.; Rodríguez-Gonzalez, P.M.; Sanchez-Miranda, Á.; Sanchez-Salguero, R.; Campelo, F.; Rita, A.; Ripullone, F. Wood anatomy and tree growth covary in riparian ash forests along climatic and ecological gradients. Dendrochronologia 2021, 70, 125891. [Google Scholar] [CrossRef]
  27. Berthelot, J.S.; Saint-Laurent, D.; Gervais-Beaulac, V.; Savoie, D. Assessing the Effects of Periodic Flooding on the Population Structure and Recruitment Rates of Riparian Tree Forests. Water 2014, 6, 2614–2633. [Google Scholar] [CrossRef]
  28. Greet, J.; Fischer, S.; Walsh, C.J.; Sammonds, M.J.; Catford, J.A. Restored river-floodplain connectivity promotes riparian tree maintenance and recruitment. For. Ecol. Manag. 2022, 506, 119952. [Google Scholar] [CrossRef]
  29. Fischer, S.; Greet, J.; Walsh, C.J.; Catford, J.A. Flood disturbance affects morphology and reproduction of woody riparian plants. Sci. Rep. 2021, 11, 16477. [Google Scholar] [CrossRef]
  30. Tanentzap, A.J.; Edward, P.; Mountford, E.P.; Cooke, A.S.; Coomes, D.A. The more stems the merrier: Advantages of multi-stemmed architecture for the demography of understorey trees in a temperate broadleaf woodland. J. Ecol. 2012, 100, 171–183. [Google Scholar] [CrossRef]
  31. Kavsnica, I.; Matula, R.; Rejzek, M.; Ewers, R.M.; Riutta, T.; Turner, E.C.; Nilus, R.; Svatek, M. Multi-stemming enhances tree survival and growth in Borneo’s logged forests. For. Ecol. Manag. 2023, 544, 121140. [Google Scholar] [CrossRef]
  32. Fahey, T.J.; Sherman, R.E.; Tanner, E.V.J. Tropical montane cloud forest: Environmental drivers of vegetation structure and ecosystem function. J. Trop. Ecol. 2015, 32. [Google Scholar] [CrossRef]
  33. Dias, P.C. Sources and sinks in population biology. Tree 1996, 11, 326–330. [Google Scholar] [CrossRef] [PubMed]
  34. Abe, H.; Matsuki, R.; Ueno, S.; Nashimoto, M.; Hasegawa, M. Dispersal of Camellia japonica seeds by Apodemus speciosus revealed by maternity analysis of plants and behavioral observation of animal vectors. Ecol. Res. 2006, 21, 732–740. [Google Scholar] [CrossRef]
Figure 1. Camellia quephongensis inhabiting Que Phong District, Nghe An Province. (a) Flower, (b) landscape of this species growing in Phuong Tien, (c) multi-stemmed tree.
Ijpb 14 00070 g001
Figure 2. Study area and sites. (ac) indicate the location of Nghe An Province, Que Phong District, and the sites of C. quephongensis populations surveyed. Gray-shaded area and red circle indicate the biosphere reserve (UNESCO) and the study area, respectively. The topographic map in (c) was cited from opentopomap.org (accessed on 1 November 2022).
Ijpb 14 00070 g002
Figure 3. Growth curve of Camellia quephongensis. Where y is tree height, x is age, and K, b, and c are constants: 366.941, 0.01157, and 0.21058, respectively. Cited from Takahashi et al., 2023 [15].
Ijpb 14 00070 g003
Figure 4. Temperature and relative humidity during the flowering season of C. quiphongensis in the study area (4 December 2022–28 February 2023). Blue and light blue, red, and yellow lines indicate the temperature and relative humidity of CM and PT, respectively. In terms of PT, the data from 10:00, 15 December, to 12:00, 10 January, were unavailable.
Ijpb 14 00070 g004
Figure 5. Vegetation map with the localities of C. quephongensis; (a) CM, (b) lateral view of A–A′ in Co Muong, (c) PT, and (d) lateral view of B–B′ in Phuong Tien. Black dots indicate the localities of C. qupephongensis grown. Bare lands surrounded by red-dotted circles indicate the traces of slope failure.
Ijpb 14 00070 g005
Figure 6. Age distribution patterns of PT1, PT2, and NS.
Ijpb 14 00070 g006
Figure 7. Ratio of multi-stemmed individuals in PT1 and PT2. a and b are for Y-tree + O-tree, respectively.
Ijpb 14 00070 g007
Figure 8. Sample score plot of C. quephongensis growing in PT1 and PT2 patches on the PC1–PC2. Black and white circles correspond to individuals in PT1 and PT2, respectively. PC1 and PC2 represent variabilities in tree height, crown size (smaller–larger), and growth pattern (single stem with large diameter–multi-stems with less diameter), respectively.
Ijpb 14 00070 g008
Table 1. Mean highest and lowest temperature and relative humidity in Co Muong (CM) and Phuong Tien (PT) during 4–14 December 2022, and 11 January–28 February 2023.
HighestLowest
Temperature (°C)
CM21.2 ± 0.615.2 ± 0.5
PT24.7 ± 0.715.9 ± 0.5
Relative humidity (%rh)
CM94.0 ± 1.074.1 ± 2.5
PT94.1 ± 1.265.9 ± 2.3
Table 2. Population size and stand structure. ++ and (++) indicate dominant species of the canopy layer and the second layer, respectively (the foliage partially overlapped). + is not a dominant species, but an associated one. Cited from Takahashi et al., 2023 [15], except for floristic data.
Local PopulationPTCMNS
Riparian TypeMountain Slope TypeRiparian Type
PatchPT2PT1CM1CM2
Habitat
Land morphology
stream bank valley slopemountain slopehill slopevalley slope
Anthropogenic impactsregenerated forest for 10–20 yearsregenerated forest for 25 yearstransplanted population
Population size
Distributed area (m × m)
580 × 10220 × 10275 × 1085 × 10
Population density (n/100 m2)0.31.41.11.4
Stand characteristics
Stand type
riparian forest secondary forest
(evergreen broadleaved forest)
plantationbamboo forest
Elevation (m)130140330300200160
SlopeNNE—SSWSESESESW
Gradient (°)35431530154243
Canopy openness (%)20.236.522.718.827.628.0 28.3
Canopy height (m)16 22 20 21 20 12 14
Tree density (n/100 m2)3.0 2.7 3.3 2.3 4.5 7.1 7.6
Dominant species
Acacia mangium++++
Anodendron sp.(++)
Cinnamomum loureiroi++
Dendrocalamus sp.++++
Fraxinus griffithii++
Livistona sp.(++)
Melia azedarach+++++++
Quercus sp.++
(++)
Symplocos sp.(++)
Vernicia montana+++++++
Table 3. Eigenvectors of 1st–4th principal components (PC1–PC4). Percentage indicates cumulative contributions.
PCsPC1PC2PC3PC4
Eigenvalue1.9341.3570.5260.183
Cumulative %48.3582.2895.42100.00
Variables
TH0.65560.2287−0.0894−0.7140
CW0.5626−0.3565−0.57560.4744
NOS0.3216−0.62880.70790.0052
SD0.38760.65210.39940.5148
Table 4. Summary of the habitat of C. quephongensis.
Stand Land MorphologyDominant in Canopy LayerVulnerability
Natural population
CMMountain slopePioneer forest
(evergreen broadleaved forest)
15°–30°
(20° on average)
Vernicia montana
Melia azedarach
Slope failure occurred
PT1Valley slopePioneer forest
(evergreen broadleaved forest)
43°Vernicia monata
Melia azedarach
Quercus sp.
Soil erosion occurred, slope failure possibly occurs.
PT2Stream bankRiparian forest
35°Fraxinus griffithiiFlooded
Anthropogenic population
CM2Hill slopePlantation
15°Cinnamomun loureiroi
Vernicia montana *
Melia azedarach *
Stable
NSValley slopeHalf planted
42°–43°Bamboo
Acacia mangium
Occupied by bush-like shrubs
* indicates associate species in the canopy layer.
Disclaimer/Publisher’s Note: The statements, opinions and data contained in all publications are solely those of the individual author(s) and contributor(s) and not of MDPI and/or the editor(s). MDPI and/or the editor(s) disclaim responsibility for any injury to people or property resulting from any ideas, methods, instructions or products referred to in the content.