Article

Hydrogen Peroxide Measurement Can Be Used to Monitor Plant Oxidative Stress Rapidly Using Modified Ferrous Oxidation Xylenol Orange and Titanium Sulfate Assay Correlation

1
Graduate School of Science and Engineering, Saitama University, Saitama 338-8570, Japan
2
Hydro Technology Institute, Osaka 530-6126, Japan
3
Research and Development Center, Nippon Koei, Tsukuba 300-1259, Japan
*
Authors to whom correspondence should be addressed.
Int. J. Plant Biol. 2023, 14(3), 546-557; https://doi.org/10.3390/ijpb14030043
Submission received: 7 May 2023 / Revised: 8 June 2023 / Accepted: 21 June 2023 / Published: 23 June 2023
(This article belongs to the Section Plant Response to Stresses)

Abstract

:
Various methodologies, sensitivities, and types of interference affect the quantification of plant hydrogen peroxide (H2O2) concentration. Modified ferrous oxidation xylenol orange (eFOX) assay and titanium sulfate (Ti(SO4)2 assay are relatively accessible methods. However, their correlation is unknown, for example whether we can get the same results for different species in different environments. Leaf samples of Ambrosia trifida, Solidago altissima, Artemisia princeps, and Sicyos angulatus were collected from a riparian vegetation zone on sunny days. The H2O2 concentration in the plant leaves was evaluated in two groups. Nonfrozen leaf samples were prepared for analysis soon after arriving at the laboratory, and frozen leaf samples were stored at −80 °C for 25 days and prepared afterwards. The eFOX assay can measure even lower fluctuations in H2O2 concentration than the Ti(SO4)2 assay. A substantial correlation was observed between nonfrozen and frozen samples in the eFOX (r = 0.879, p < 0.001) and Ti(SO4)2 assays (r = 0.837, p < 0.001). Sample weight did not affect H2O2 quantification. Each species showed a substantial correlation between the eFOX and Ti(SO4)2 assays in nonfrozen conditions (Ambrosia trifida (r = 0.767, p < 0.001), Solidago altissima (r = 0.583, p < 0.001), Artemisia princeps (r = 0.672, p < 0.001), and Sicyos angulatus (r = 0.828, p < 0.001)). Therefore, both methods can be utilized easily and rapidly to quantify oxidative stress using H2O2.

1. Introduction

Ecological balance depends on riparian plant species [1,2]. Riparian areas are core habitats for a wide range of semiaquatic and terrestrial species [3]. The riparian zone contains a range of ecologically important species. Invasive species can completely alter the ecosystem along the channel bed by covering large areas [4,5]. Therefore, it is important to monitor their habitat preferences, and to identify environmental factors that affect their existence.
Oxidative damage occurs in plants when they produce excess reactive oxygen species (ROS) under adverse environmental conditions [6]. Hydrogen peroxide (H2O2) is a prevalent ROS in plant tissues. H2O2 is a precursor of oxidative stress which plays a critical signaling role in biotic and abiotic stress responses in plants, such as response to pathogens, drought, extreme temperatures, excessive radiation, ozone, and wounds [7,8,9], extracellular oligogalacturonides [10,11], stomatal responses, systemic acquired resistance [12], and programmed cell death [13]. Many studies have been conducted to determine oxidative stress using H2O2 concentration measurements [14,15,16,17,18,19]. Therefore, H2O2 concentration in plant tissue can be used to determine a plant’s physiological status [14,20].
Measurement of H2O2 in plant tissues is relatively simple [21,22]. In contrast to superoxide radicals (O2.−) and hydroxy radicals (OH), H2O2 measurement requires minimal amounts of loss. Plant studies have extensively used H2O2 to evaluate ROS damage or stress. Therefore, H2O2 can be used to monitor the response of plants to environmental stress and to determine their physiological status [15,16,23,24].
Various factors affect H2O2 quantification. For example, the addition of salicylic acid increases H2O2 concentration in tomato leaves from 0.15 μmol/gFW to 0.25 μmol/gFW [12]. The concentration of H2O2 in pear fruit tissue was increased from 0.35 mol/gFW to 0.8 mol/gFW in response to potassium cyanide with a Ti(SO4)2 assay [25]. Bruguiera parviflora’s H2O2 concentrations rose from 0.067 μmol/gFW to 0.089 μmol/gFW under greenhouse hydroponic conditions [26]. In addition, measurements of H2O2 concentration can vary due to the sensitivity of the methods applied and interference from other redox-active compounds [27]. For example, apple leaves were estimated to contain 20–70 nmol/g FW of H2O2 using the Ti(SO4)2 assay [28], while 5–25 nmol/g FW was found using the Bioxytech H2O2-560 colorimetric assay [29]. In pears, 0.5–0.8 μmol/g FW of H2O2 was quantified utilizing the Ti(SO4)2 assay, while 6–11 nmol/g FW was observed using the Bioxytech H2O2-560 kit [30].
The estimation of H2O2 concentration in living tissues has been achieved using a variety of techniques [31]. H2O2 levels are commonly measured with peroxidase assays [32], Amplex Red H2O2 detection kit [33], 3,3-diaminobenzidine (DAB) [34], DCFDA (Di chloro dihydro fluorescein diacetate) [35], fluorescence [36], and chemiluminescence [37]. As with superoxide detection, many methods used to measure H2O2, such as DAB and DCFDA, have low specificities, thus measuring generalized oxidative stress rather than a specific ROS [38]. As a result, it is necessary to use more appropriate methods to determine H2O2 concentration in plant tissues.
Spectrophotometric reading is a very popular method to detect H2O2 concentration. Various researchers have developed spectrophotometric techniques [20,39,40]. The determination of H2O2 in plant tissues, particularly leaves, has been described in numerous studies. Major spectrophotometric assays include a titanium H2O2 color complex (Ti(SO4)2 assay [25], and another using ferrous ions being oxidized by H2O2 to ferric ions [41]. The modified ferrous oxidation xylenol orange (eFOX) assay has gained considerable acceptance due to its sensitivity, stability, and adaptability to high-throughput techniques. There may be some interference between the eFOX and Ti(SO4)2 assays during the measurement process [27,39,42], and their correlation in quantifying plant leaves is unknown.
When it comes to field sampling and ecological aspects, it is necessary to measure many samples over time. It is therefore important to avoid complex methods when analyzing data, in order to ensure accurate results. A long-term monitoring method is employed to study the growth and function of plants in response to resource availability and stressors [43]. Another associated problem is transportation soon after the collection of plant leaves. If the samples are not maintained properly, there is a possibility of deterioration in the collected leaves’ quality. The H2O2 concentration decreased by 60% after seven days of storage at −20 °C or −80 °C [44] because some plants are susceptible to chilling stress at even moderately low temperatures (0–10 °C) [45]. Low temperatures can affect various plants, leading to sudden leaf loss, reduction of branches, and even death [46,47,48,49]. In order to achieve acceptable results, we need to develop a simple method.
To our knowledge, this is the first study to find a correlation between eFOX and Ti(SO4)2 assays using riparian vegetation plant leaves. Therefore, the main objectives of this study are as follows: (1) As soon as leaf tissues are collected (frozen or nonfrozen state), determine the optimal environmental conditions for analysis. (2) Establish a new approach to quantifying H2O2 by evaluating the correlation between eFOX and Ti(SO4)2 assays, using riparian plant species.

2. Materials and Methods

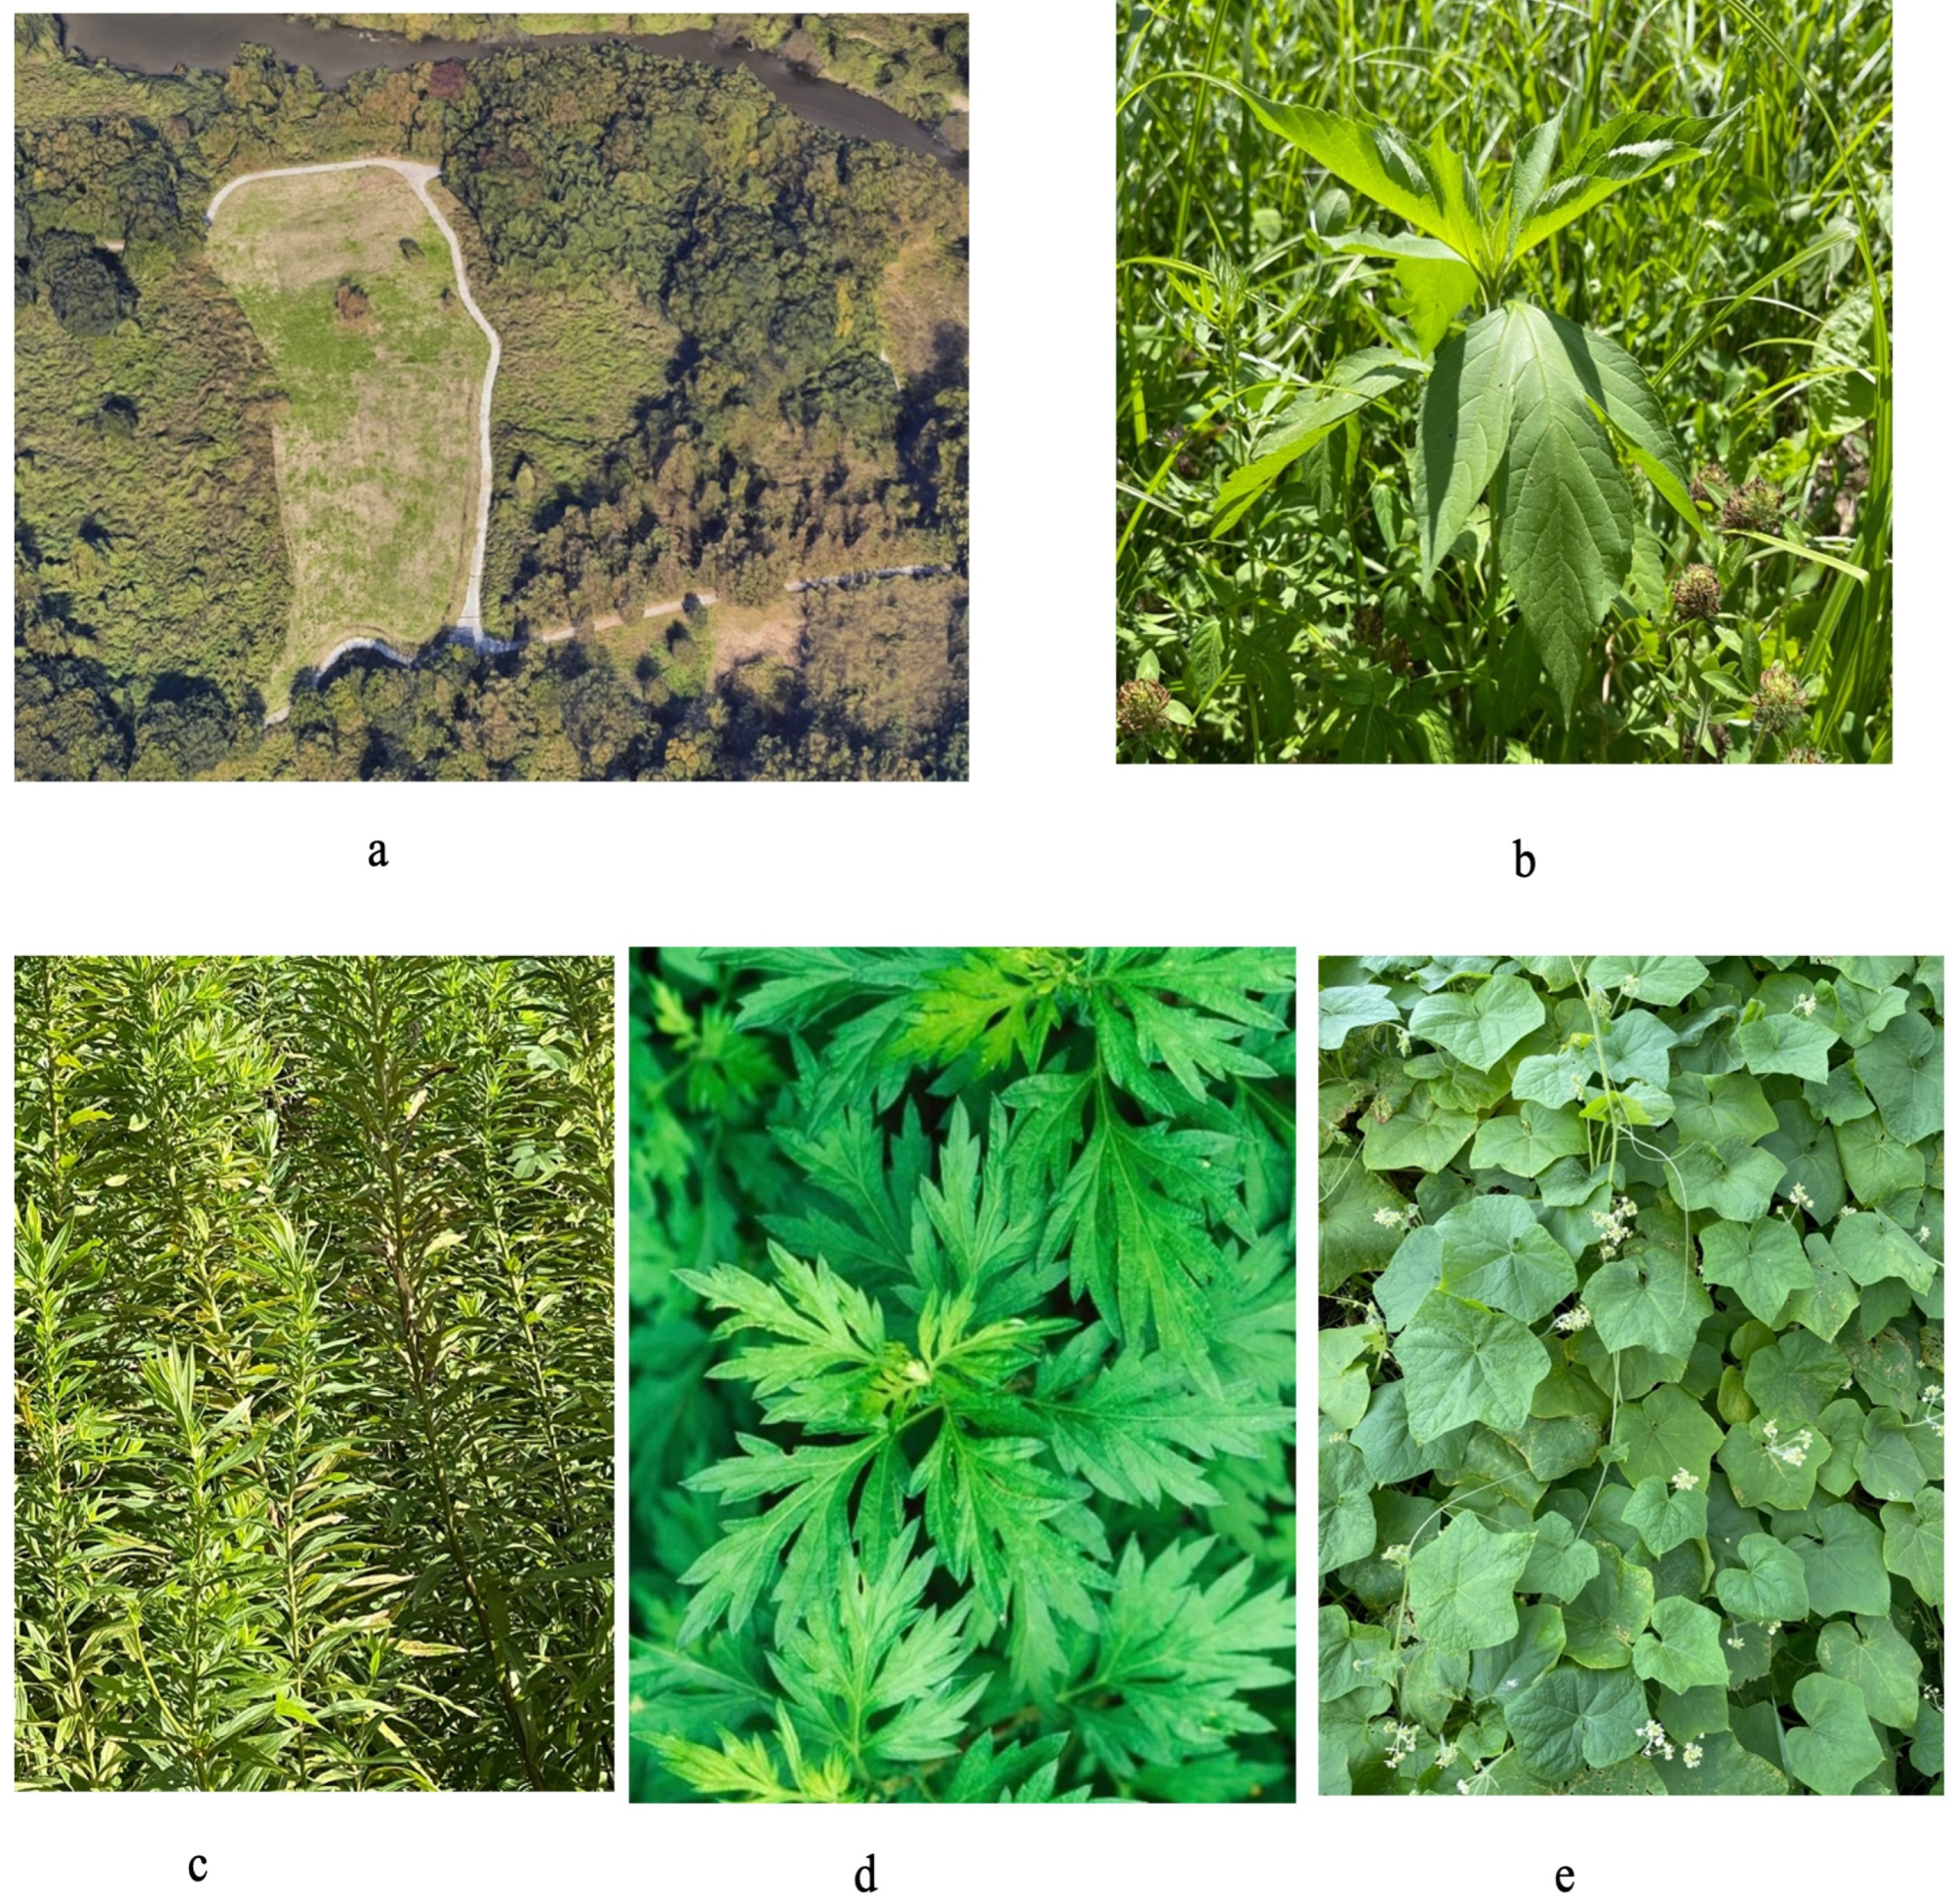
2.1. Plant Leaves Collection

Leaves of riparian plants, such as Ambrosia trifida, Solidago altissima, Artemisia princeps, and Sicyos angulatus, were collected for this study. Sampling was conducted at Arakawa Taroemon (35°56′52.2″ N, 139°32′13.1″ E to 35°59′7.3″ N, 139°30′58.2″ E) on a sunny day on 1st June, 2nd August and 9th September 2022. The collected samples were transported to the laboratory. Fully expanded leaves from the middle part of plants in each replicate were collected. Plant leaves were divided into two groups to evaluate the best conditions for obtaining maximum H2O2 concentrations. Nonfrozen samples: The collected samples were prepared for analysis soon after arriving in the laboratory, as described later. Nonfrozen samples were kept at a normal temperature (25 °C ± 3 °C) until arrival in the laboratory. Frozen samples: The collected samples were kept at −80 °C for 25 days after being transported to the laboratory. Frozen samples were kept in dry ice (−70 °C) until arrival in the laboratory. After 25 days, samples were prepared to compare H2O2 levels with their nonfrozen counterparts. The study site and selected species are presented in Figure 1a–e.

2.2. Preparation of Frozen and Nonfrozen Samples

Approximately 40 to 50 mg of plant leaf was weighed and placed into a 15 mL centrifuge tube with a combination of beads (3 mm and 10 mm) (Bio Medical Science Inc., Tokyo, Japan). For each leaf, experiments were performed in triplicate. The contents of the centrifuge tube were frozen with liquid nitrogen and ground to a powder using a Shake master (BMS Inc., Poway, CA, USA). A volume of 5 mL potassium phosphate buffer (pH 6, 50 mM) was added, and a small amount of polyvinylpyrrolidone (PVP) was used to prevent the effect of the phenolic compounds. The mixture was centrifuged (Kokusan H60-R, Kyoto, Japan) twice at 5500 rpm for 10 min, and the supernatant was collected as an extract to analyze H2O2 using both methods. The extract was transferred to a −80 °C freezer until analysis.

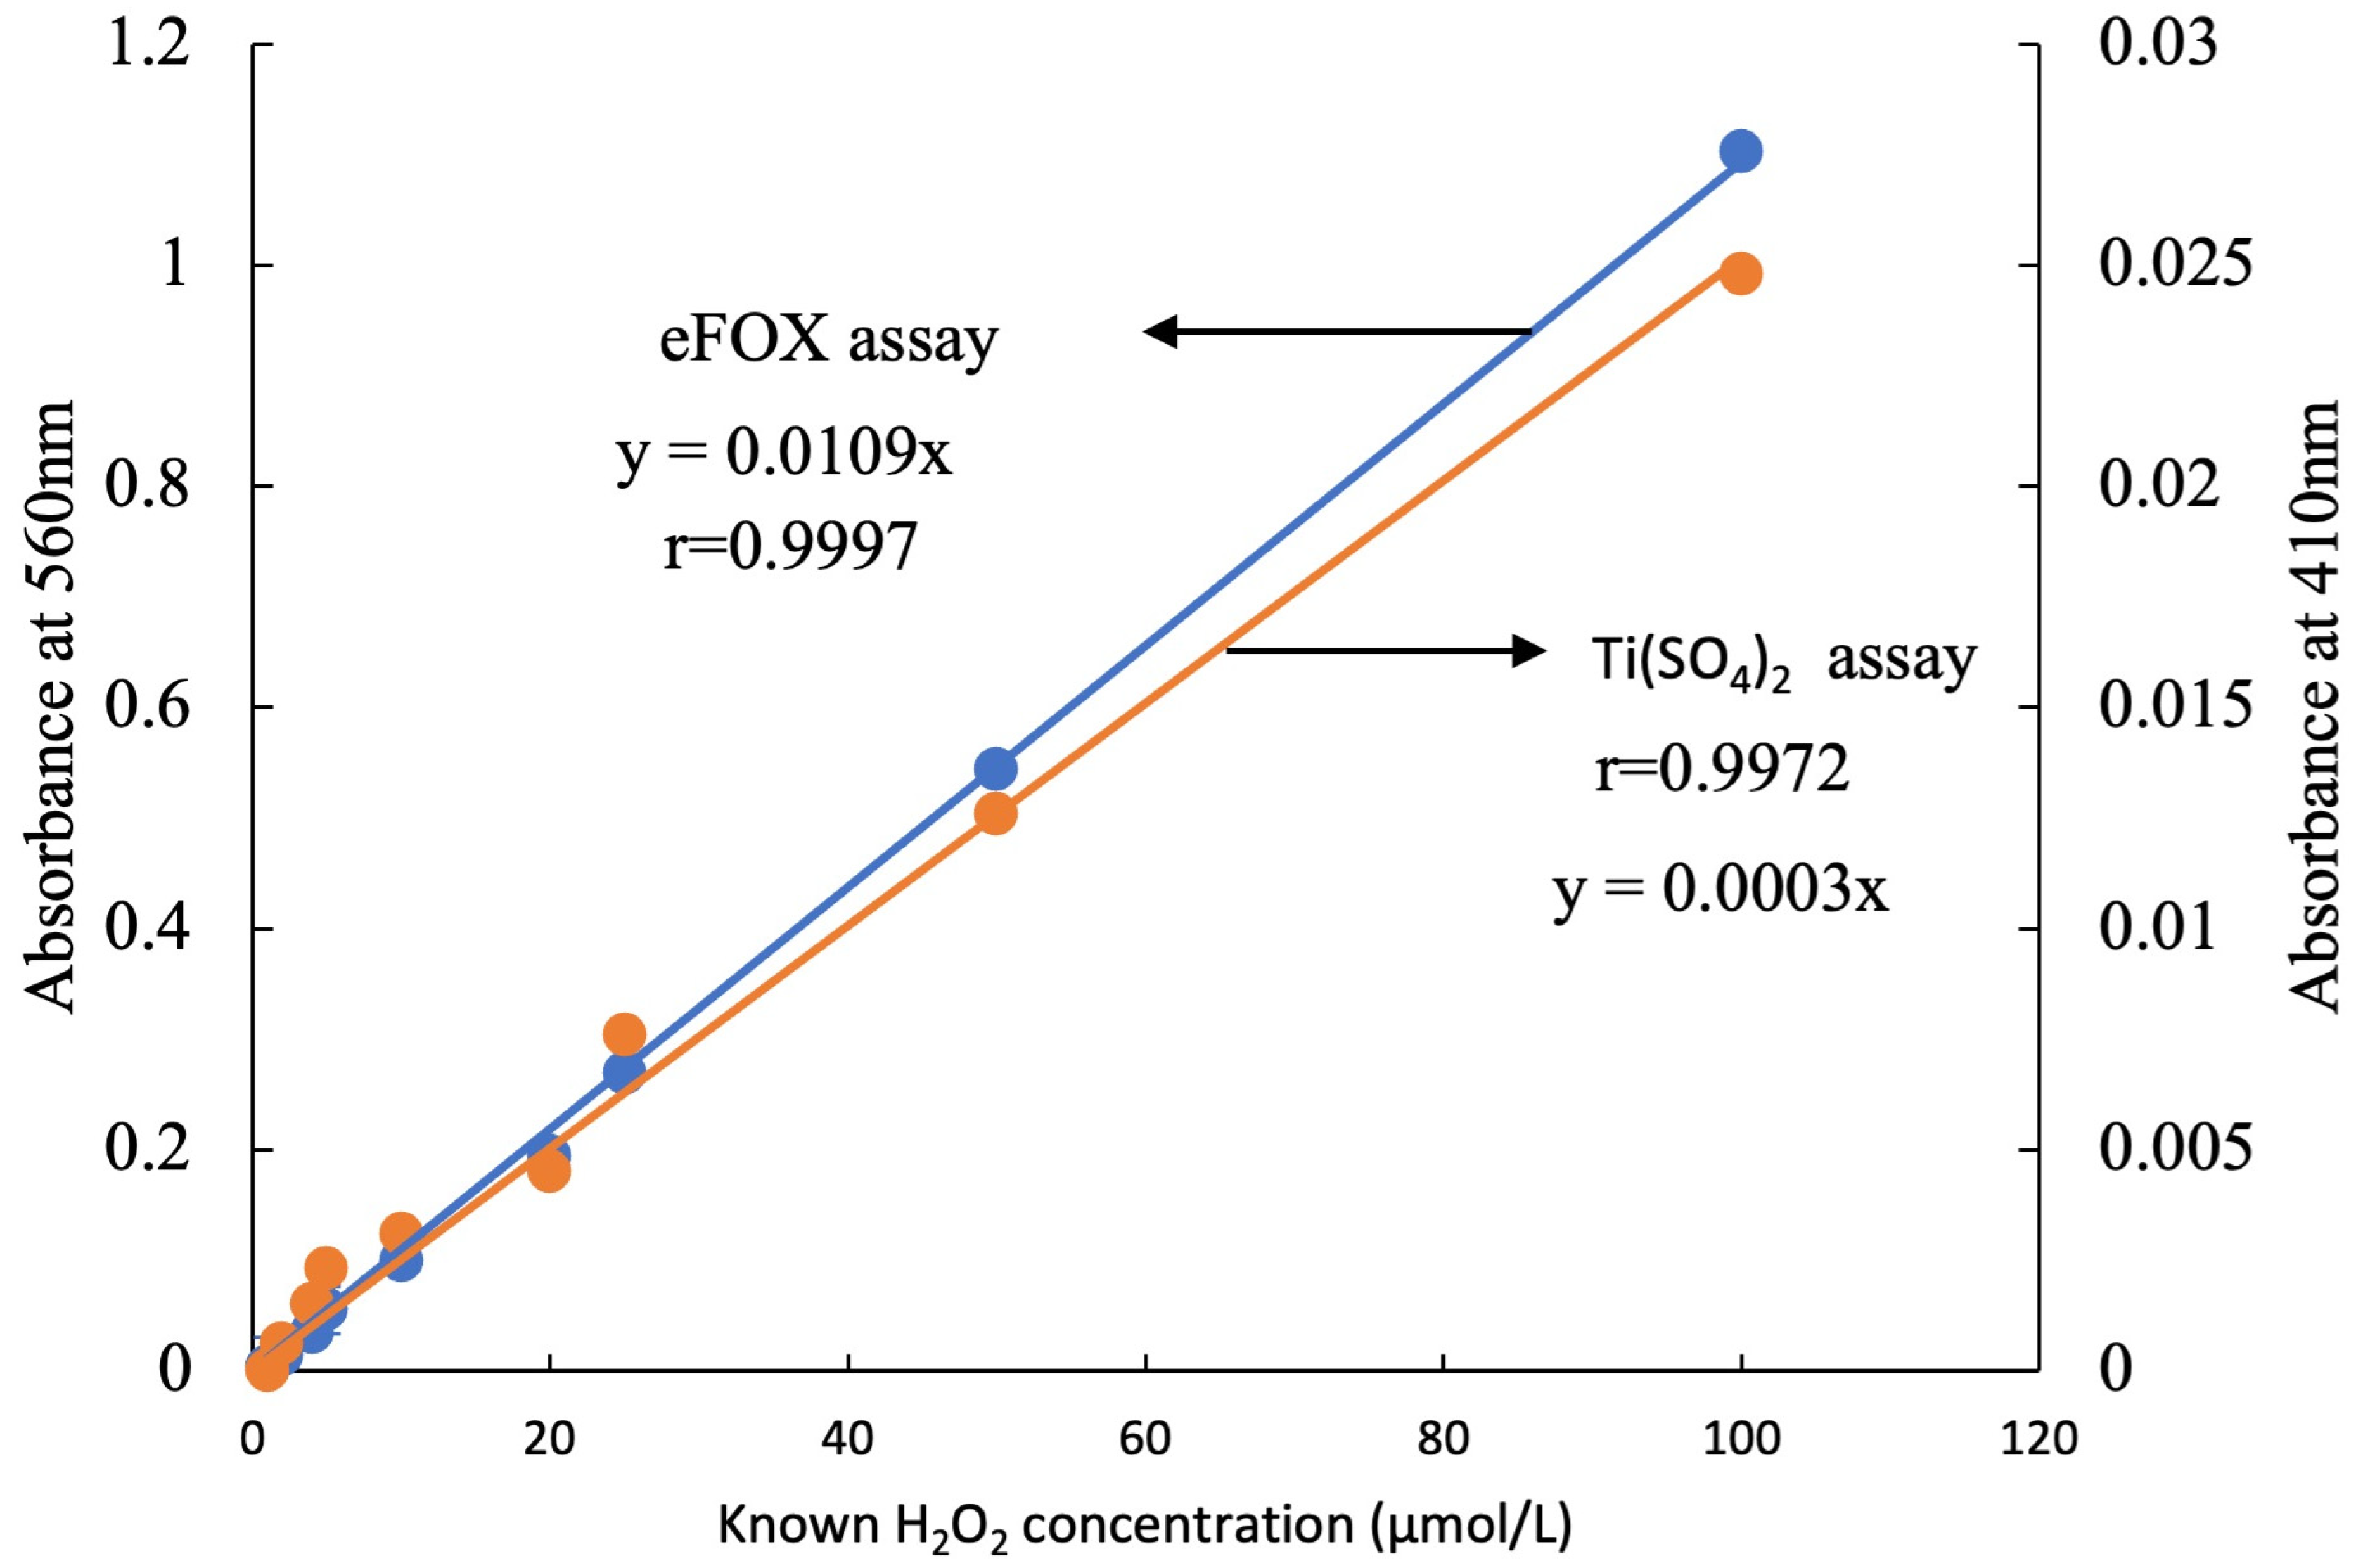
2.3. Preparations of the Standard Curve with the eFOX and Ti(SO4)2

Commercially available 30% H2O2 (w/w) was diluted with potassium phosphate buffer (pH 6, 50 mM) to prepare a known H2O2 concentration of 1, 2, 4, 5, 10, 20, 25, 50, and 100 μmol/L to measure with both methods. Ultra-pure water (Milli-Q water) (Fujifilm Wako pure chemical corporation, Osaka, Japan) water was used throughout the experiment where necessary.

2.4. Quantification of H2O2 Content with eFOX Assay

The modified ferrous-xylenol orange assay was used to measure H2O2 [29,44]. The supernatant (100 µL) was added to 1 mL of the assay solution containing 250 µM ferrous ammonium sulfate, 100 µM sorbitol, 100 µM xylenol orange, 25 mM H2SO4 (sulfuric acid). Adding 1% ethanol to the reagent increased its sensitivity to H2O2 by 50% (Fujifilm Wako pure chemical corporation, Japan); it was deoxygenated with gaseous nitrogen to prevent artifacts. Reaction mixtures were incubated at room temperature for 15 min. The absorbance was measured at 560 nm by spectrophotometry (UVmini-1240, Shimadzu, Japan). H2O2 content was calculated by a standard curve prepared using a series of diluted solutions of commercial, high-grade 9.8 M H2O2 (30%) (w/w) [24,50].

2.5. Determination of H2O2 Content with Ti(SO4)2 Assay

The Brennan and Frenkel [25] method was used to measure H2O2. The titanium (II) metal ions in the acidic solution form a peroxide complex with H2O2, a yellow-colored compound. After 750 µL of extract was placed in a 10 mL round centrifuge tube, 2.5 mL of 0.1% of Ti(SO4)2 in 20% H2SO4 solution was added. The mixture was centrifuged at 10,000 rpm for 15 min at room temperature. Next, 1 mL of the supernatant was transferred into a 1 mL spectrophotometer cell. The absorbance was measured at 410 nm. For the blank, a mixture of 750 µL of 0.05 M phosphate buffer (pH 6.0) and 2.5 mL of 0.1% Ti(SO4)2 in 20% H2SO4 was used.

2.6. Statistical Analyses
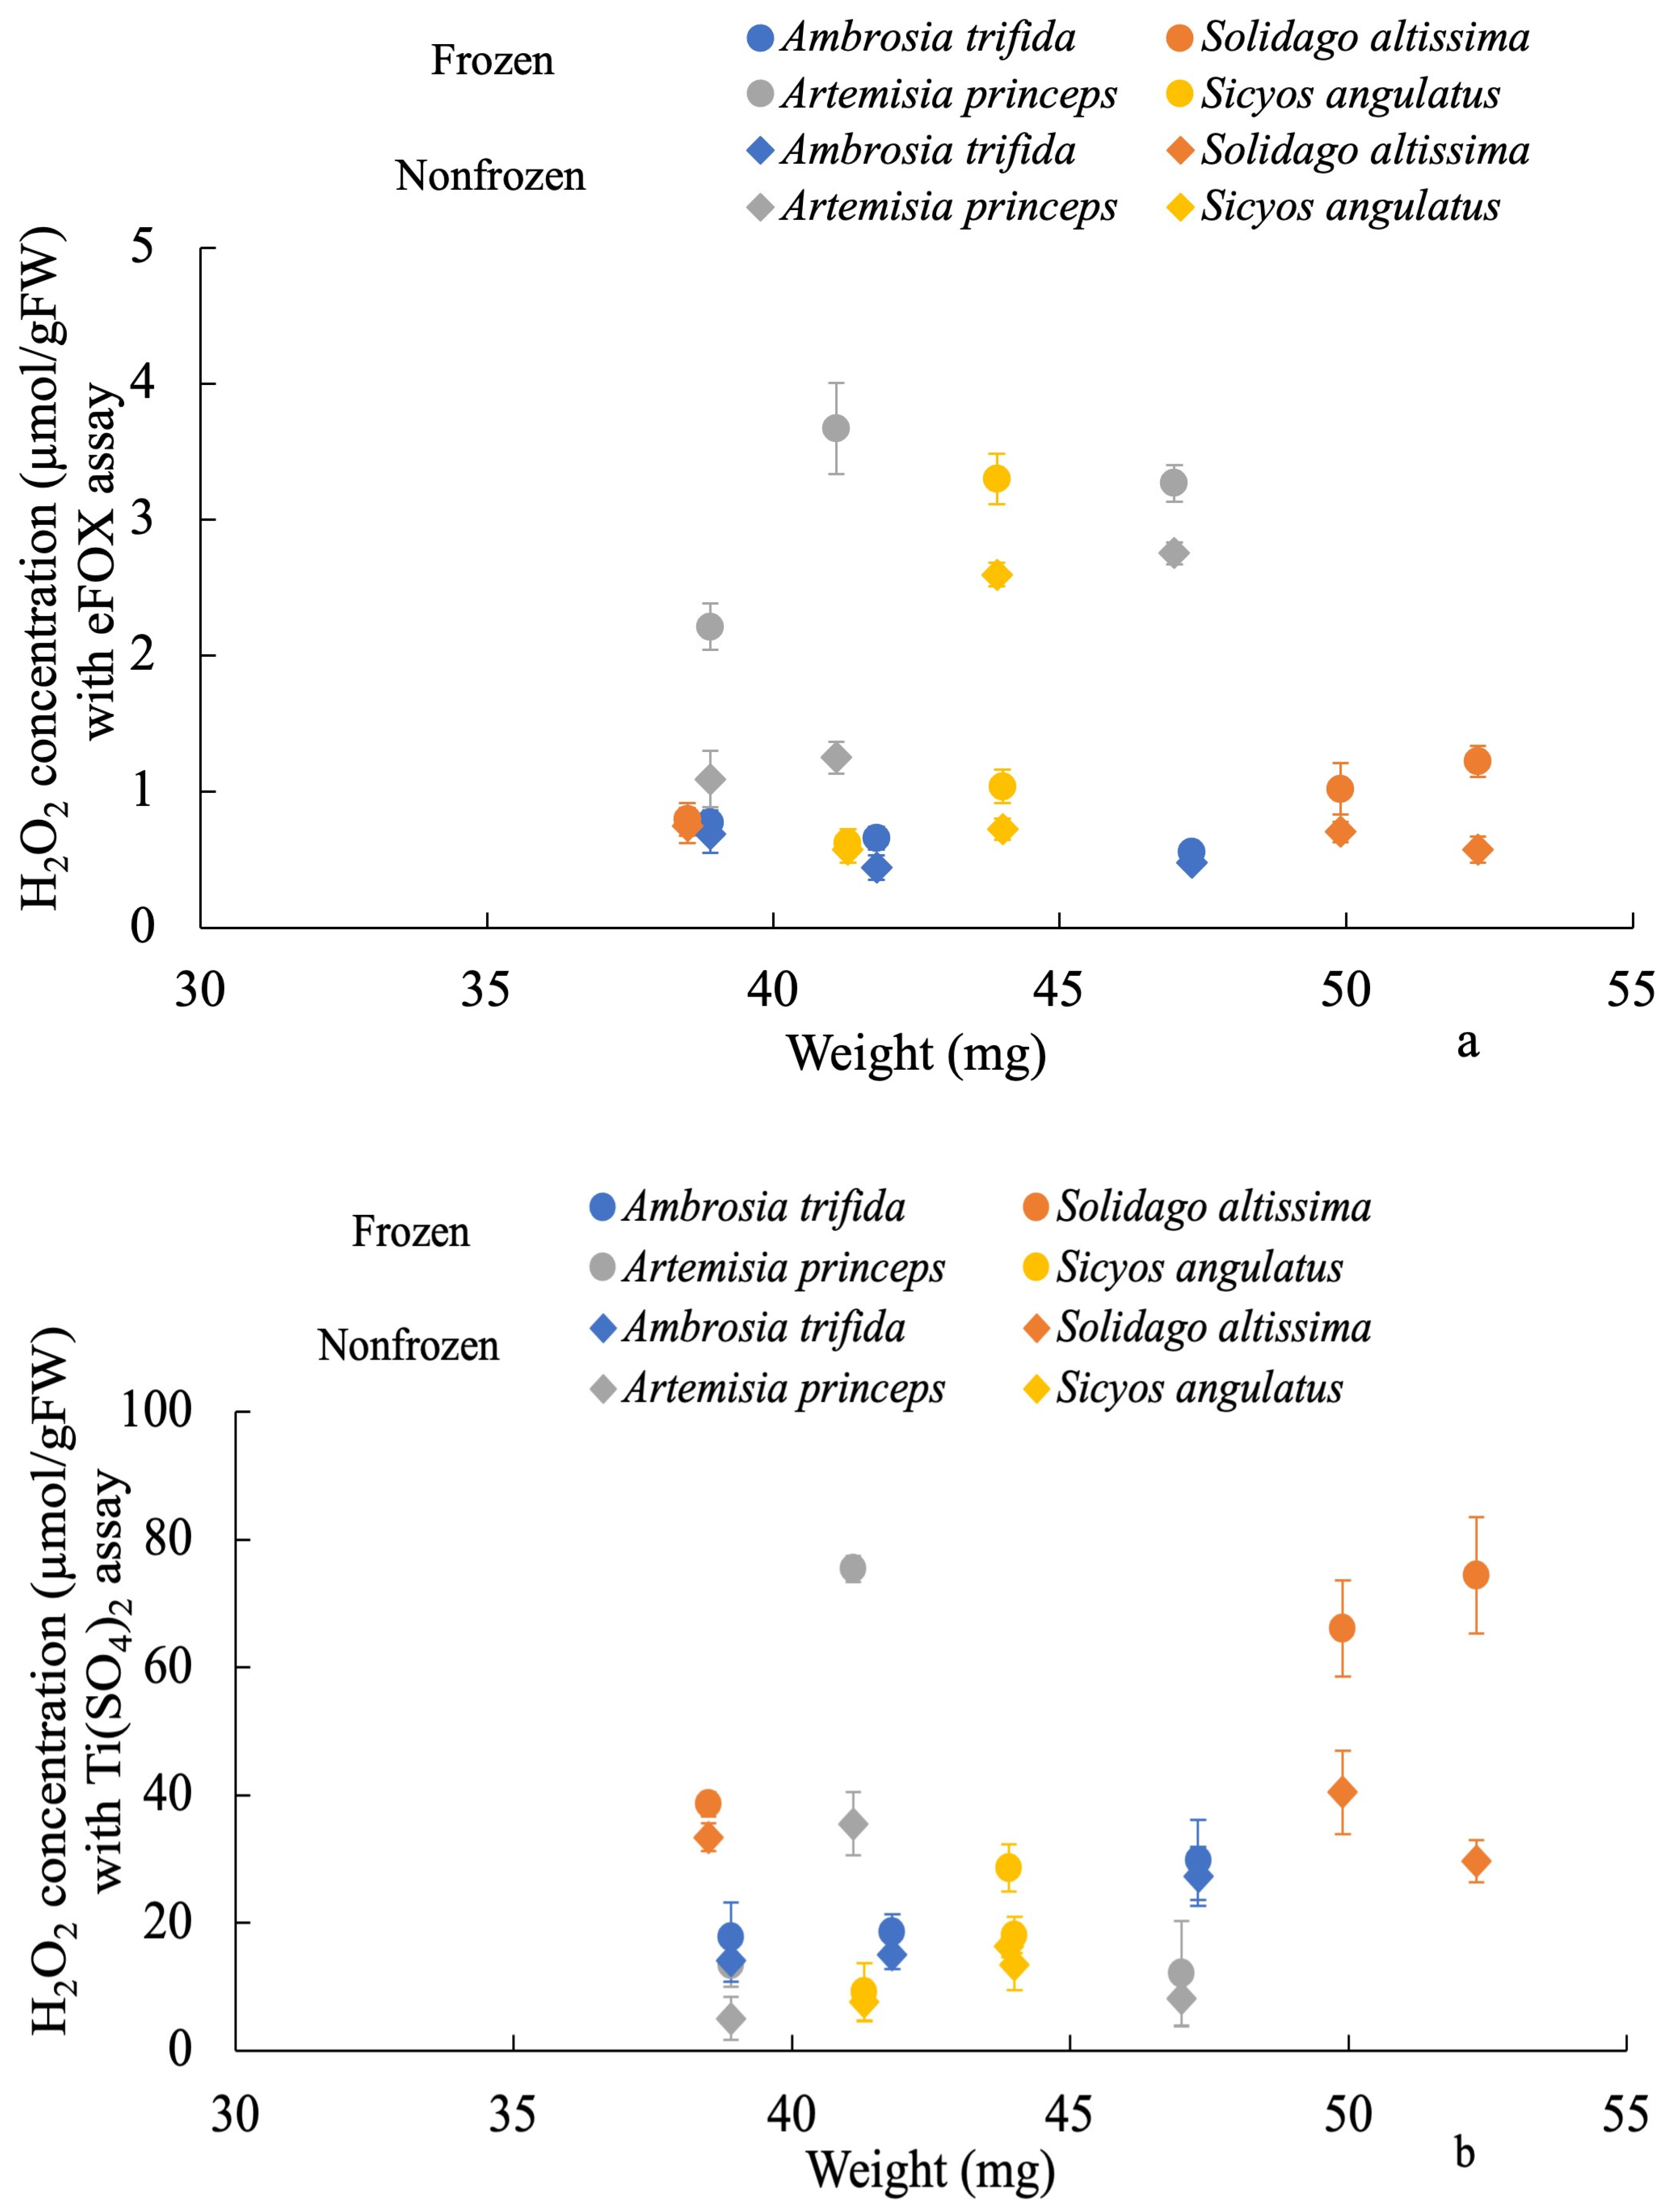
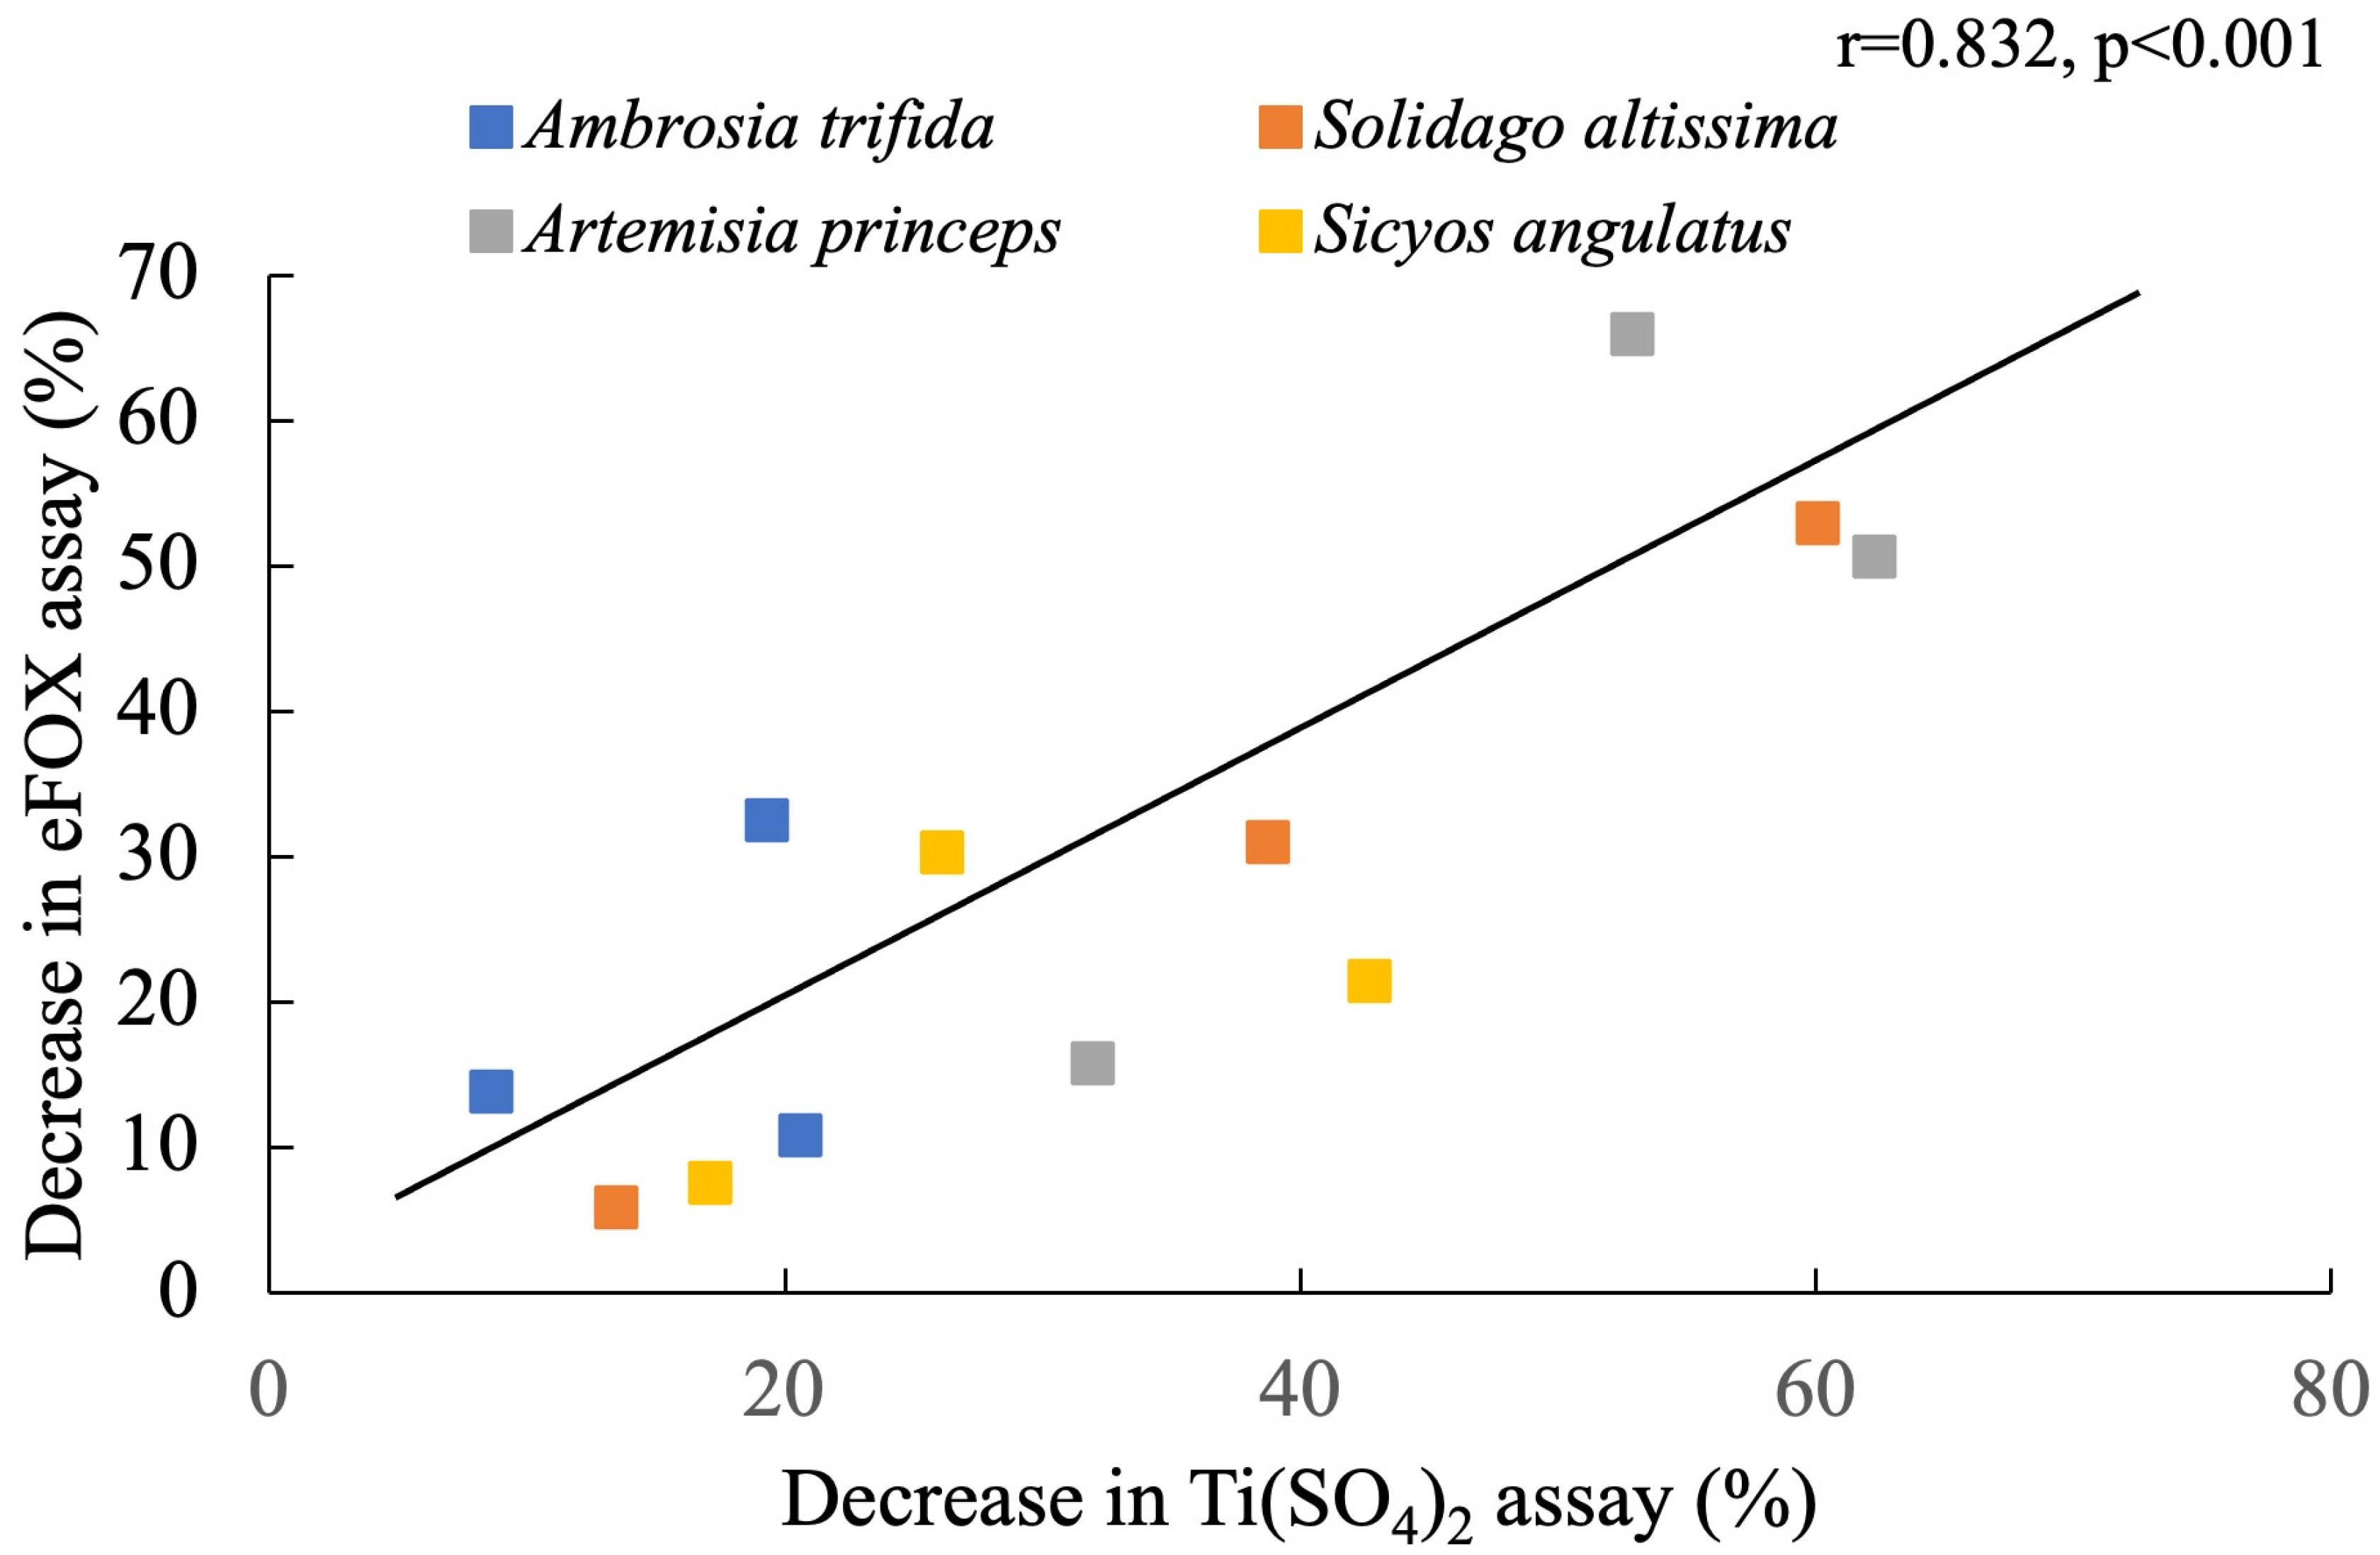
IBM SPSS Statistics (Version 28.0 IBM Corporation, Chicago, IL, USA) software was used to execute the statistical analysis. Pearson’s correlation analysis was employed to assess correlations between the two methods.

3. Results

The correlation between the two methods and a wide range of H2O2 concentrations is highly linear, as shown by the standard curves in Figure 2. Compared to Ti(SO4)2, the eFOX method exhibits a higher level of sensitivity in terms of absorbance. This clearly indicates that the eFOX assay is capable of measuring low fluctuations of H2O2 concentration more accurately. A significant decreasing trend was observed from nonfrozen to frozen samples in the eFOX (r = 0.879, p < 0.001) and Ti(SO4)2 (r = 0.837, p < 0.001) assays, which is shown in Figure 3a,b. Meanwhile, the sample weight does not affect the quantification procedure of H2O2 concentration in eFOX (nonfrozen r = −0.017, p = 0.959; frozen r = 0.061, p = 0.851) and Ti(SO4)2 (nonfrozen r = 0.477, p = 0.117; frozen r = 0.37, p = 0.236) assays (Figure 3a,b). Each species is independent of sampling weight in frozen and nonfrozen conditions for eFOX and Ti(SO4)2 (Table 1). The maximum reduction rates (%) in both methods between frozen and nonfrozen samples for each species are shown in Table 2. Figure 4 also exhibits a highly substantial correlation in the decreasing rate between eFOX and Ti(SO4)2 in frozen and nonfrozen samples (r = 0.832, p < 0.001). From the above findings, it is clear that nonfrozen samples give higher H2O2 concentrations than frozen samples. Therefore, the study was conducted on a large scale to find the correlation between eFOX and Ti(SO4)2 with the nonfrozen samples. The 2nd and 3rd time collections (2nd August and 9th September 2022) were performed to expand the volume of nonfrozen samples to analyze with both methods. Nonfrozen leaves of each species showed a substantial correlation between results using eFOX and Ti(SO4)2 (Ambrosia trifida r = 0.767, p < 0.001; Solidago altissima r = 0.583, p < 0.001, Artemisia princeps r = 0.672, p < 0.001; and Sicyos angulatus r = 0.828, p < 0.001) (Figure 5a–d).

4. Discussion

Plants suffer from oxidative stress when too much ROS, especially H2O2, is present in the tissues [51,52]. Therefore, quantitative detection of H2O2 is very important for studying riparian vegetation plant species. Variable sensitivity of methods and interfering compounds affect H2O2 quantification [27,44], such as the high concentrations of ascorbic acid present in leaf extracts which interfere with peroxidase coupled assay and luminometric methods [42]. Using peroxidase-coupled oxidation, values of approximately 50 nmol/gFW were obtained [42,53], whereas luminol chemiluminescence with catalase pre-treatment yielded values of around 5 µmol/ gFW [54,55]. Methods should be developed where the above restrictions can be overcome as well as quantifying H2O2 concentrations with minimal losses. The correlations with eFOX and Ti(SO4)2 can be of great interest. A broad range of H2O2 concentrations was obtained by different researchers due to various techniques and types of interference (Table 3). This study also demonstrated a vast range of H2O2 concentrations employing both methods. Among different species, Ambrosia trifida shows the minimum (eFOX 0.31 ± 0.03 µmol/gFW; Ti(SO4)2 5.07 ± 0.65 µmol/gFW) and Artemisia princeps exhibits the maximum (eFOX 6.85 ± 0.16 µmol/gFW; Ti(SO4)2 94.92 ± 1.14 µmol/gFW) H2O2 concentrations (Figure 5). From the standard curve, it can be observed that eFOX shows more sensitivity than the Ti(SO4)2 assay, achieving lower values more accurately. For example, in the case of the eFOX H2O2 concentration measurement of 10 µmol/L, it gives 0.092 absorbance at 560 nm, whereas the same H2O2 concentration in the Ti(SO4)2 measurement is 0.0031 at 410 nm. This is the key point across results in the same samples of riparian species using the two methods. The standard curve absorbance ratio of eFOX: Ti(SO4)2 is almost 1:36. This ratio is also a factor contributing to different results in individual methods.
During lowering of temperature, plant leaves may experience stress resulting in chilling injury, which induces ROS accumulation and impairs the normal functioning of the plants [59,60]. Due to chilling stress, H2O2 causes oxidative injuries. Temperature plays an important role in abiotic stresses as well as crop productivity [61]. In tomato plants, chilling injury is a result of low temperatures reducing water and nutrient uptake, but it is not caused by nonfreezing temperatures (especially those above 10 °C) [62]. Chilling injury also decreases tomato fruit quality [63]. Chilling injuries are temperature-dependent and time-dependent. Chilling injury occurs when the temperature falls below a threshold temperature for an extended period, causing many metabolic processes that result in measurable symptoms [64]. Environmental stress frequently reduces plant growth through the overproduction of ROS, which damages various macromolecules and cellular structures [59], cellular membranes, photosynthetic apparatus, and enzymes [65] and leads to the death of cells [66,67,68]. Low temperatures also result in reductions in catalase activity, which can be found in leaves of both chilling-sensitive and non-sensitive species [69], and in avocado fruit [70]. The function of catalase is to degrade H2O2, which is relatively unreactive. [71]. It is possible for H2O2 to generate hydroxyl radicals or singlet oxygen. As a result of catalase inactivation, H2O2 can accumulate, resulting in the production of free radicals and cell damage [71,72]. Pea leaf H2O2 content was markedly reduced (38.31%), while mung bean leaf H2O2 was also decreased (25.40%) by chilling injury (20 °C to 4 °C) [73]. In the present study, chilling injury was also observed due to keeping samples in the freezer (−80 °C) for 25 days before the preparation of samples. As a result, each selected species undergoes a reduced rate of H2O2 concentration measurement (Figure 4). Therefore, it is anticipated that preparing the samples soon after collection is the best way to get more accurate values of H2O2 concentration.
Although there is some interference between the eFOX and Ti(SO4)2 assays, the present study’s results demonstrate that there is a high correlation for both methods in Ambrosia trifida, Solidago altissima, Artemisia princeps, and Sicyos angulatus in nonfrozen samples. It can be considered that frozen samples have lower H2O2 concentrations than nonfrozen samples, which is mainly caused by chilling injury. Thus, the nonfrozen samples are likely to have higher concentrations of H2O2, and the high correlation using both methods signifies that a wide range of H2O2 concentrations are measured effectively.

5. Conclusions

The correlation between eFOX and Ti(SO4)2 assays can provide a simple and acceptable way to measure H2O2 concentration on a large scale in nonfrozen conditions. The weight of samples has no impact on H2O2 concentration measurement regardless of whether the sample was frozen or nonfrozen. The best condition to minimize loss of H2O2 is the nonfrozen state. The significant relationship between the eFOX and Ti(SO4)2 assays in riparian plants indicates that these methods’ correlation can be adapted to measure H2O2 effectively. Hence, these two methods can be measured in parallel in the same samples. In order to quantify oxidative stress caused by biotic and abiotic stressors, use of both methods is highly recommended.

Author Contributions

Conceptualization, T.A.; methodology, T.A. and M.R.; software, M.R.; validation, T.A., K.F. and M.R.; formal analysis, M.R., F.I., A.N. and M.M.; investigation, T.A., M.R., F.I., A.N. and M.M.; resources, T.A.; data curation, M.R.; writing—original draft preparation, M.R.; writing—review and editing, T.A. and K.F.; visualization, M.R., F.I., A.N. and M.M.; supervision, T.A. and K.F.; project administration, T.A.; funding acquisition, T.A. All authors have read and agreed to the published version of the manuscript.

Funding

This work was financially supported by the Grant-in-Aid for Scientific Research (B) (19H02245), (C) (23K04040), and the Fund for the Promotion of Joint International Research (18KK0116) of the Japan Society for the Promotion of Science (JSPS).

Institutional Review Board Statement

This study has been approved by the Ministry of Land, Infrastructure, Transport and Tourism, Japan (protocol code 39, Taroemon-chiku, Shizensaiseijigyou, Kanto-Chiho-Seibikyoku).

Informed Consent Statement

Not applicable.

Data Availability Statement

Data are available from the corresponding authors upon reasonable request.

Conflicts of Interest

The authors declare that the research was conducted without any commercial or financial relationships that could be construed as a potential conflict of interest.

References

  1. Nallaperuma, B.; Asaeda, T. Long-term changes in riparian forest cover under a dam-induced flow scheme: The accompanying a numerical modelling perspective. J. Ecohydraulics 2019, 4, 106–112. [Google Scholar] [CrossRef]
  2. Corbacho, C.; Sánchez, J.M.; Costillo, E. Patterns of structural complexity and human disturbance of riparian vegetation in agricultural landscapes of a Mediterranean area. Agric. Ecosyst. Environ. 2003, 95, 495–507. [Google Scholar] [CrossRef]
  3. Richardson, J.S.; Taylor, E.B.; Schluter, D.; Pearson, M.; Hatfield, T.; Lapointe, N.W.; Cooke, S.J.; Imhof, J.G.; Boisclair, D.; Casselman, J.M.; et al. Do riparian zones qualify as critical habitat for endangered freshwater fishes? Can. J. Fish. Aquat. Sci. 2010, 67, 1197–1204. [Google Scholar] [CrossRef] [Green Version]
  4. Collier, P.; Gunning, J.W. Why Has Africa Grown Slowly? J. Econ. Perspect. 1999, 13, 3–22. [Google Scholar] [CrossRef] [Green Version]
  5. Yarrow, M.; Marín, V.H.; Finlayson, M.; Tironi, A.; Delgado, L.E.; Fischer, F. The ecology of Egeria densa Planchón (Liliopsida: Alismatales): A wetland ecosystem engineer? Rev. Chil. De Hist. Nat. 2009, 82, 299–313. [Google Scholar] [CrossRef] [Green Version]
  6. Asada, K. The Water-Water Cycle in Chloroplasts: Scavenging of Active Oxygens and Dissipation of Excess Photons. Annu. Rev. Biol. 1999, 50, 601–639. [Google Scholar] [CrossRef]
  7. Neill, S.; Desikan, R.; Hancock, J. Hydrogen peroxide signalling. Curr. Opin. Plant Biol. 2002, 5, 388–395. [Google Scholar] [CrossRef]
  8. Orozco-Cárdenas, M.L.; Narváez-Vásquez, J.; Ryan, C.A. Hydrogen Peroxide Acts as a Second Messenger for the Induction of Defense Genes in Tomato Plants in Response to Wounding, Systemin, and Methyl Jasmonate. Plant Cell 2001, 13, 179–191. [Google Scholar] [CrossRef] [Green Version]
  9. Wohlgemuth, H.; Mittelstrass, K.; Kschieschan, S.; Bender, J.; Weigel, H.-J.; Overmyer, K.; Kangasjärvi, J.; Sandermann, H.; Langebartels, C. Activation of an oxidative burst is a general feature of sensitive plants exposed to the air pollutant ozone. Plant Cell Environ. 2002, 25, 717–726. [Google Scholar] [CrossRef]
  10. Spiro, M.D.; Ridley, B.L.; Eberhard, S.; Kates, K.A.; Mathieu, Y.; O’Neill, M.A.; Mohnen, D.; Guern, J.; Darvill, A.; Albersheim, P. Biological Activity of Reducing-End-Derivatized Oligogalacturonides in Tobacco Tissue Cultures1. Plant Physiol. 1998, 116, 1289–1298. [Google Scholar] [CrossRef] [Green Version]
  11. Bellincampi, D.; Dipierro, N.; Salvi, G.; Cervone, F.; De Lorenzo, G. Extracellular H2O2 Induced by Oligogalacturonides Is Not Involved in the Inhibition of the Auxin-Regulated rolB Gene Expression in Tobacco Leaf Explants. Plant Physiol. 2000, 122, 1379–1386. [Google Scholar] [CrossRef] [PubMed] [Green Version]
  12. Chen, Z.; Silva, H.; Klessig, D.F. Active oxygen species in the induction of plant systemic acquired resistance induced by salicylic acid. Science 1993, 262, 1883–1886. [Google Scholar] [CrossRef] [PubMed]
  13. Gechev, T.S.; Hille, J. Hydrogen peroxide as a signal controlling plant programmed cell death. J. Cell Biol. 2005, 168, 17–20. [Google Scholar] [CrossRef] [PubMed] [Green Version]
  14. Asaeda, T.; Rahman, M.; Abeynayaka, H.D.L. Hydrogen peroxide can be a plausible biomarker in cyanobacterial bloom treatment. Sci. Rep. 2022, 12, 12. [Google Scholar] [CrossRef]
  15. Asaeda, T.; Jayasanka, S.M.D.H.; Xia, L.-P.; Barnuevo, A. Application of Hydrogen Peroxide as an Environmental Stress Indicator for Vegetation Management. Engineering 2018, 4, 610–616. [Google Scholar] [CrossRef]
  16. Asaeda, T.; Rahman, M.; Liping, X.; Schoelynck, J. Hydrogen Peroxide Variation Patterns as Abiotic Stress Responses of Egeria densa. Front. Plant Sci. 2022, 13. [Google Scholar] [CrossRef]
  17. Cho, U.-H.; Seo, N.-H. Oxidative stress in Arabidopsis thaliana exposed to cadmium is due to hydrogen peroxide accumulation. Plant Sci. 2005, 168, 113–120. [Google Scholar] [CrossRef]
  18. Işeri, Ö.D.; Körpe, D.A.; Sahin, F.I.; Haberal, M. Hydrogen peroxide pretreatment of roots enhanced oxidative stress response of tomato under cold stress. Acta Physiol. Plant. 2013, 35, 1905–1913. [Google Scholar] [CrossRef]
  19. Chaliha, M.; Sultanbawa, Y. Terminalia ferdinandiana, a traditional medicinal plant of Australia, alleviates hydrogen peroxide induced oxidative stress and inflammation, in vitro. J. Complement. Integr. Med. 2019, 17. [Google Scholar] [CrossRef]
  20. Smirnoff, N.; Arnaud, D. Hydrogen peroxide metabolism and functions in plants. New Phytol. 2018, 221, 1197–1214. [Google Scholar] [CrossRef] [Green Version]
  21. Satterfield, C.N.; Bonnell, A.H. Interferences in Titanium Sulfate Method for Hydrogen Peroxide. Anal. Chem. 1955, 27, 1174–1175. [Google Scholar] [CrossRef]
  22. Zhou, B.; Wang, J.; Guo, Z.; Tan, H.; Zhu, X. A simple colorimetric method for determination of hydrogen peroxide in plant tissues. Plant Growth Regul. 2006, 49, 113–118. [Google Scholar] [CrossRef]
  23. Barnuevo, A.; Asaeda, T. Integrating the ecophysiology and biochemical stress indicators into the paradigm of mangrove ecology and a rehabilitation blueprint. PLoS ONE 2018, 13, e0202227. [Google Scholar] [CrossRef] [PubMed] [Green Version]
  24. Asaeda, T.; Senavirathna, M.D.H.J.; Krishna, L.V.; Yoshida, N. Impact of regulated water levels on willows (Salix subfragilis) at a flood-control dam, and the use of hydrogen peroxide as an indicator of environmental stress. Ecol. Eng. 2018, 127, 96–102. [Google Scholar] [CrossRef]
  25. Brennan, T.; Frenkel, C. Involvement of Hydrogen Peroxide in the Regulation of Senescence in Pear. Plant Physiol. 1977, 59, 411–416. [Google Scholar] [CrossRef] [Green Version]
  26. Parida, A.K.; Das, A.B. Salt tolerance and salinity effects on plants: A review. Ecotoxicol. Environ. Saf. 2005, 60, 324–349. [Google Scholar] [CrossRef]
  27. Queval, G.; Hager, J.; Gakière, B.; Noctor, G. Why are literature data for H2O2 contents so variable? A discussion of potential difficulties in the quantitative assay of leaf extracts. J. Exp. Bot. 2008, 59, 135–146. [Google Scholar] [CrossRef] [Green Version]
  28. Okazaki, Y.; Rao, S.; Asao, S.; Tateishi, T.; Katsuda, S.-I.; Furuki, Y. Effects of Ti, Al and V Concentrations on Cell Viability. Mater. Trans. JIM 1998, 39, 1053–1062. [Google Scholar] [CrossRef] [Green Version]
  29. Vilaplana, R.; Valentines, M.C.; Toivonen, P.; Larrigaudière, C. Antioxidant Potential and Peroxidative State of ‘Golden Smoothee’ Apples Treated with 1-Methylcyclopropene. J. Am. Soc. Hortic. Sci. 2006, 131, 104–109. [Google Scholar] [CrossRef]
  30. Lentheric, I.; Pinto, E.; Graell, J.; Larrigaudière, C. Effects of CO2 pretreatment on oxidative metabolism and core- browning incidence in controlled atmosphere stored pears. J. Hortic. Sci. Biotechnol. 2003, 78, 177–181. [Google Scholar] [CrossRef]
  31. Halliwell, B.; Gutteridge, J.M. Free Radicals in Biology and Medicine, 5th ed.; Oxford University Press: Oxford, UK, 2015. [Google Scholar]
  32. Demmano, G.; Selegny, E.; Vincent, J.-C. Experimental Procedure for a Hydrogen Peroxide Assay Based on the Peroxidase-Oxidase Reaction. JBIC J. Biol. Inorg. Chem. 1996, 238, 785–789. [Google Scholar] [CrossRef]
  33. Orozco-Cárdenas, M.L.; Ryan, C.A. Nitric Oxide Negatively Modulates Wound Signaling in Tomato Plants. Plant Physiol. 2002, 130, 487–493. [Google Scholar] [CrossRef] [Green Version]
  34. Thordal-Christensen, H.; Zhang, Z.; Wei, Y.; Collinge, D.B. Subcellular localization of H2O2 in plants. H2O2 accumulation in papillae and hypersensitive response during the barley—Powdery mildew interaction. Plant J. 1997, 11, 1187–1194. [Google Scholar] [CrossRef]
  35. Yao, N.; Tada, Y.; Sakamoto, M.; Nakayashiki, H.; Park, P.; Tosa, Y.; Mayama, S. Mitochondrial oxidative burst involved in apoptotic response in oats. Plant J. 2002, 30, 567–579. [Google Scholar] [CrossRef] [PubMed] [Green Version]
  36. Jimenez, A.; Creissen, G.; Kular, B.; Firmin, J.; Robinson, S.; Verhoeyen, M.; Mullineaux, P. Changes in oxidative processes and components of the antioxidant system during tomato fruit ripening. Planta 2002, 214, 751–758. [Google Scholar] [CrossRef] [PubMed]
  37. Jones, M.R.; Lee, K. Determination of environmental H2O2 for extended periods by chemiluminescence with real-time inhibition of iron interferences. Microchem. J. 2019, 147, 1021–1027. [Google Scholar] [CrossRef]
  38. Halliwell, B.; Whiteman, M. Measuring reactive species and oxidative damage in vivo and in cell culture: How should you do it and what do the results mean? Br. J. Pharmacol. 2004, 142, 231–255. [Google Scholar] [CrossRef] [Green Version]
  39. Patterson, B.D.; MacRae, E.A.; Ferguson, I.B. Estimation of hydrogen peroxide in plant extracts using titanium(IV). Anal. Biochem. 1984, 139, 487–492. [Google Scholar] [CrossRef]
  40. Li, J.; Lu, B.; Xu, L.L. An improved method for the determination of hydrogen peroxide in leaves. Progr. Biochem. Biophys. 2000, 27, 548–551. [Google Scholar]
  41. Gay, C.; Collins, J.; Gebicki, J.M. Hydroperoxide Assay with the Ferric–Xylenol Orange Complex. Anal. Biochem. 1999, 273, 149–155. [Google Scholar] [CrossRef]
  42. Veljovic-Jovanovic, S.; Noctor, G.; Foyer, C.H. Are leaf hydrogen peroxide concentrations commonly overestimated? The potential influence of artefactual interference by tissue phenolics and ascorbate. Plant Physiol. Biochem. 2002, 40, 501–507. [Google Scholar] [CrossRef]
  43. Grime, J.P.; Mackey, J.M.L. The role of plasticity in resource capture by plants. Evol. Ecol. 2002, 16, 299–307. [Google Scholar] [CrossRef]
  44. Cheeseman, J.M. Hydrogen peroxide concentrations in leaves under natural conditions. J. Exp. Bot. 2006, 57, 2435–2444. [Google Scholar] [CrossRef] [PubMed] [Green Version]
  45. Allen, D.J.; Ort, D.R. Impacts of chilling temperatures on photosynthesis in warm-climate plants. Trends Plant Sci. 2001, 6, 36–42. [Google Scholar] [CrossRef]
  46. Peng, C.; Crawshaw, J.P.; Maitland, G.C.; Trusler, J.M.; Vega-Maza, D. The pH of CO2-saturated water at temperatures between 308K and 423K at pressures up to 15 MPa. J. Supercrit. Fluids 2013, 82, 129–137. [Google Scholar] [CrossRef]
  47. Peng, P.; Hu, A.; Gerlich, A.P.; Zou, G.; Liu, L.; Zhou, Y.N. Joining of Silver Nanomaterials at Low Temperatures: Processes, Properties, and Applications. ACS Appl. Mater. Interfaces 2015, 7, 12597–12618. [Google Scholar] [CrossRef]
  48. Fei, H.; Dong, J.; Arellano-Jiménez, M.J.; Ye, G.; Kim, N.D.; Samuel, E.L.; Peng, Z.; Zhu, Z.; Qin, F.; Bao, J.; et al. Atomic cobalt on nitrogen-doped graphene for hydrogen generation. Nat. Commun. 2015, 6, 8668. [Google Scholar] [CrossRef] [Green Version]
  49. Lovelock, C.E.; Krauss, K.W.; Osland, M.J.; Reef, R.; Ball, M.C. The physiology of mangrove trees with changing climate. Trop. Tree Physiol. Adapt. Responses A Chang. Environ. 2016, 6, 149–179. [Google Scholar]
  50. Dautania, G.K.; Singh, G.P. Role of Light and Dark Cycle and Different Temperatures in the Regulation of Growth and Protein Expression in Oscillatoria agardhii Strain. Braz. Arch. Biol. Technol. 2014, 57, 933–940. [Google Scholar] [CrossRef] [Green Version]
  51. Sharma, P.; Jha, A.B.; Dubey, R.S.; Pessarakli, M. Reactive Oxygen Species, Oxidative Damage, and Antioxidative Defense Mechanism in Plants under Stressful Conditions. J. Bot. 2012, 2012, 217037. [Google Scholar] [CrossRef] [Green Version]
  52. Choudhury, F.K.; Rivero, R.M.; Blumwald, E.; Mittler, R. Reactive oxygen species, abiotic stress and stress combination. Plant J. 2017, 90, 856–867. [Google Scholar] [CrossRef] [PubMed]
  53. Bouché, N.; Fait, A.; Bouchez, D.; Møller, S.G.; Fromm, H. Mitochondrial succinic-semialdehyde dehydrogenase of the γ-aminobutyrate shunt is required to restrict levels of reactive oxygen intermediates in plants. Proc. Natl. Acad. Sci. USA 2003, 100, 6843–6848. [Google Scholar] [CrossRef] [PubMed] [Green Version]
  54. Karpinski, S.; Escobar, C.; Karpinska, B.; Creissen, G.; Mullineaux, P.M. Photosynthetic electron transport regu- lates the ex-pression of cytosolic ascorbate peroxidase genes in Arabidopsis during excess light stress. Plant Cell 1997, 9, 627–640. [Google Scholar] [PubMed] [Green Version]
  55. Karpinski, S.; Reynolds, H.; Karpinska, B.; Wingsle, G.; Creissen, G.; Mullineaux, P. Systemic signaling and acclimation in response to excess excitation energy in Arabidopsis. Science 1999, 284, 654–657. [Google Scholar] [CrossRef]
  56. Chaparzadeh, N.; D’Amico, M.L.; Khavari-Nejad, R.-A.; Izzo, R.; Navari-Izzo, F. Antioxidative responses of Calendula officinalis under salinity conditions. Plant Physiol. Biochem. 2004, 42, 695–701. [Google Scholar] [CrossRef]
  57. Tewari, R.K.; Kumar, P.; Tewari, N.; Srivastava, S.; Sharma, P.N. Macronutrient deficiencies and differential antioxidant responses—Influence on the activity and expression of superoxide dismutase in maize. Plant Sci. 2004, 166, 687–694. [Google Scholar] [CrossRef]
  58. Mur, L.A.J.; Kenton, P.; Draper, J. In planta measurements of oxidative bursts elicited by avirulent and virulent bacterial pathogens suggests that H2O2 is insufficient to elicit cell death in tobacco. Plant Cell Environ. 2005, 28, 548–561. [Google Scholar] [CrossRef]
  59. Apel, K.; Hirt, H. Reactive oxygen species: Metabolism, oxidative stress, and signal transduction. Annu. Rev. Plant Biol. 2004, 55, 373–399. [Google Scholar] [CrossRef] [Green Version]
  60. Ruelland, E.; Vaultier, M.N.; Curie, M.; Galile, R.; Seine, I. Cold signalling and cold acclimation in Plants. Adv. Bot. Res. 2009, 49, 35–150. [Google Scholar] [CrossRef]
  61. Miura, K.; Tada, Y. Regulation of water, salinity, and cold stress responses by salicylic acid. Front. Plant Sci. 2014, 5, 4. [Google Scholar] [CrossRef] [Green Version]
  62. Gu, L.; Hanson, P.J.; Mac Post, W.; Kaiser, D.P.; Yang, B.; Nemani, R.; Pallardy, S.G.; Meyers, T. The 2007 Eastern US Spring Freeze: Increased Cold Damage in a Warming World? Bioscience 2008, 58, 253–262. [Google Scholar] [CrossRef]
  63. Sevillano, L.; Sanchez-Ballesta, M.T.; Romojaro, F.; Flores, F.B. Physiological, hormonal and molecular mechanisms regulating chilling injury in horticultural species. Postharvest technologies applied to reduce its impact. J. Sci. Food Agric. 2009, 89, 555–573. [Google Scholar] [CrossRef]
  64. Luengwilai, K.; Beckles, D.M.; Saltveit, M.E. Chilling-injury of harvested tomato (Solanum lycopersicum L.) cv. Micro-Tom fruit is reduced by temperature pre-treatments. Postharvest Biol. Technol. 2012, 63, 123–128. [Google Scholar] [CrossRef]
  65. Lukatkin, A.S. Initiation and Development of Chilling Injury in Leaves of Chilling-Sensitive Plants. Russ. J. Plant Physiol. 2005, 52, 542–546. [Google Scholar] [CrossRef]
  66. Upadhyaya, H.; Khan, M.H.; Panda, S.K. Hydrogen peroxide induces oxidative stress in detached leaves of Oryza sativa L. Gen. Appl. Plant Physiol. 2007, 33, 83–95. [Google Scholar]
  67. Liu, Z.-J.; Guo, Y.-K.; Bai, J.-G. Exogenous Hydrogen Peroxide Changes Antioxidant Enzyme Activity and Protects Ultrastructure in Leaves of Two Cucumber Ecotypes Under Osmotic Stress. J. Plant Growth Regul. 2010, 29, 171–183. [Google Scholar] [CrossRef]
  68. Goud, P.B.; Kachole, M.S. Effect of exogenous hydrogen peroxide on peroxidase and polyphenol oxidase activities in Ca-januscajan (L.) Millsp.detached leaves. Int. J. Curr. Res. Rev. 2011, 3, 61–65. [Google Scholar]
  69. Kacperska, A. Metabolic Consequences of Low Temperature Stress in Chilling-Insensitive Plants. In Low Temperature Stress Physiology in Crops; CRC Press: Boca Raton, FL, USA, 2018; pp. 27–40. [Google Scholar] [CrossRef]
  70. Sharon, O.; Kahn, V. Browning Potential, PPO, Catalase and Acid Phosphatase Activities during Ripening of Non-chilled and Chilled Avocado. J. Sci. Food Agric. 1979, 30, 634–638. [Google Scholar] [CrossRef]
  71. Yang, T.; Poovaiah, B.W. Hydrogen peroxide homeostasis: Activation of plant catalase by calcium/calmodulin. Proc. Natl. Acad. Sci. USA 2002, 99, 4097–4102. [Google Scholar] [CrossRef] [Green Version]
  72. Rao, P.S.; Kalva, S.; Yerramilli, A.; Mamidi, S. Free Radicals and Tissue Damage: Role of Antioxidants. Free. Radic. Antioxid. 2011, 1, 2–7. [Google Scholar] [CrossRef] [Green Version]
  73. MacRae, E.A.; Ferguson, I.B. Changes in catalase activity and hydrogen peroxide concentration in plants in response to low temperature. Physiol. Plant. 1985, 65, 51–56. [Google Scholar] [CrossRef]
Figure 1. Study site (a); riparian plant species were Ambrosia trifida (b), Solidago altissima (c), Artemisia princeps (d), and Sicyos angulatus (e).
Ijpb 14 00043 g001
Figure 2. Standard curve for eFOX and Ti(SO4)2 using the known concentration of H2O2.
Ijpb 14 00043 g002
Figure 3. Decreasing trend between frozen and nonfrozen samples in both methods (eFOX (a) and Ti(SO4)2 (b)). Vertical bars indicate standard deviation.
Ijpb 14 00043 g003
Figure 4. Percentage decrease correlation with both methods comparing frozen and nonfrozen samples.
Ijpb 14 00043 g004
Figure 5. Correlation between Ti(SO4)2 and eFOX in Ambrosia trifida (a), Solidago altissima (b), Artemisia princeps (c), and Sicyos angulatus (d) in nonfrozen samples. Vertical and horizontal bars indicate eFOX and Ti(SO4)2 standard deviation, respectively.
Ijpb 14 00043 g005
Table 1. Relationship between sampling weight and frozen along with nonfrozen conditions utilizing both methods.
eFOX AssayTi(SO4)2 Assay
Species NameFrozenNonfrozenFrozenNonfrozen
Ambrosia trifidar = −0.670, p = 532r = −0.977, p = 0.137r = 0.958, p = 186r = 0.957, p = 0.187
Solidago altissimar = −0.812, p = 0.397r = 0.946, p = 0.21r = 0.30, p = 0.806r = 0.302, p = 0.804
Artemisia princepsr = 0.984, p = 0.115r = 0.496, p = 0.67r = −0.162, p = 0.896r = −0.273, p = 0.824
Sicyos angulatusr = 0.528, p = 0.646r = 0.593, p = 0.596r = 0.931, p = 0.239r = 0.824, p = 0.383
Table 2. Maximum reduction rate (%) in each species for both methods.
Species NameMaximum Reduction Rate (%) in eFOX AssayMaximum Reduction Rate (%) in Ti(SO4)2 Assay
Ambrosia trifida32.4720.62
Solidago altissima52.9160.10
Artemisia princeps65.9452.90
Sicyos angulatus30.2826.10
Table 3. H2O2 concentrations in leaves of various plant species.
Species nameH2O2
Concentration (µmol/gFW)
TechniqueNotesReference
Litchi chinensis Sonn.0.64Glucose peroxidaseFully expanded leaves[20]
Spinacia olearacea0.54 Titanium (IV)-PAR complex.Fully expanded leaves[39]
Glycine max L.3.47Ferrous oxidation/xylenol orangeFully expanded leaves[43]
Calendula officinalis6 Glycolate oxidaseYoung leaves[56]
Arabidopsis thaliana5 Luminol chemiluminescenceYoung leaves[54,55]
Zea mays L. 75Ti(SO4)2 assayFully expanded leaves[57]
Nicotinia tabacum5Titanium-peroxide complex assayFully expanded leaves[58]
Rice (Oryza sativa L.)0.26Titanium (IV) sulphate- TiCl4 complexYoung leaves[40]
Wheat (Triticum aestivum L.)0.58Titanium (IV) sulphate- TiCl4 complexOld leaves[40]
Banana (Musa acuminata Colla)0.72Glucose peroxidaseFully expanded leaves[20]
Disclaimer/Publisher’s Note: The statements, opinions and data contained in all publications are solely those of the individual author(s) and contributor(s) and not of MDPI and/or the editor(s). MDPI and/or the editor(s) disclaim responsibility for any injury to people or property resulting from any ideas, methods, instructions or products referred to in the content.

