Article

Salinity Tolerance and Ion Accumulation of Coastal and Inland Accessions of Clonal Climbing Plant Species Calystegia sepium in Comparison with a Coastal-Specific Clonal Species Calystegia soldanella

Department of Plant Physiology, Faculty of Biology, University of Latvia, 1 Jelgavas Str., LV-1004 Riga, Latvia
*
Author to whom correspondence should be addressed.
Int. J. Plant Biol. 2022, 13(4), 381-399; https://doi.org/10.3390/ijpb13040032
Submission received: 4 August 2022 / Revised: 19 September 2022 / Accepted: 20 September 2022 / Published: 23 September 2022

Abstract

:
Plant species adapted to saline habitats represent an important resource in the assessment of salinity tolerance mechanisms. The aim of the present study was to analyze salinity tolerance and ion accumulation characteristics for various accessions of Calystegia sepium from different habitats in comparison to these of Calystegia soldanella in controlled conditions. Plants were introduced in culture using stem explants with leaf and were cultivated in controlled conditions under six different substrate salinities. Salinity tolerance of both C. sepium and C. soldanella plants was relatively high, but the tolerance of particular accessions did not depend on the substrate salinity level in their natural habitats. C. sepium accession from a mesophytic non-saline habitat was only slightly negatively affected by increasing substrate salinity. However, coastal accession of C. sepium and coastal-specific species C. soldanella had some similarities in ion accumulation characteristics, both accumulating a high concentration of soluble ions in aboveground parts and excluding them from underground parts. All C. sepium accessions from different habitats represented varied physiotypes, possibly associated with their genetic differences. C. sepium accessions from different habitats can be suggested as models for further studies aiming at dissecting possible genetic, epigenetic and physiological mechanisms of adaptation to heterogeneous environmental conditions.

1. Introduction

Physiology of salinity tolerance is a fundamentally relevant aspect in plant biology with immense practical importance for nature conservation, agriculture as well as environmental biotechnology. Plant species adapted to saline habitats represent an important resource in this respect [1,2,3,4]. So far, a majority of salinity tolerance studies have focused on obligate halophyte species from hypersaline habitats, such as inland saline deserts or coastal salt marshes, but the mechanisms of salinity tolerance of facultative halophytic species occurring both in saline and non-saline habitats are a mostly unexplored topic. In contrast to obligate halophytes, it is expected to find a wider diversity of different physiological salinity tolerance-related mechanisms in plants from habitats along a border between saline and non-saline environments [5].
Calystegia sepium (L.) R. Br. (Convolvulaceae) is a clonal climbing plant species found in a variety of habitats. C. sepium is an umbrella species of the European-protected habitat EUH 6430: “Hydrophilous tall herb fringe communities of plains and the montane to alpine levels” [6]. However, the species exhibits high diversity in respect to a range of habitats where it can be found. Thus, at one extreme, C. sepium is a component of nitrophilous mesophytic vegetation of riverbanks and other similar habitats [7]; at the other, it is frequently located in relatively arid semi-ruderal habitats like road verges [8]. Moreover, C. sepium is often found on coastal habitats, being an important species of salt-adapted vegetation complexes of the Southern Baltics [9]. These facts raise the question on existence of different ecotypes of C. sepium based on genetical variation in certain adaptive characteristics. Due to the predominantly vegetative mode of propagation of the species [10], it is highly possible that certain populations consist of a single locally well-adapted clone of C. sepium. The presence of C. sepium plants in habitats with different salinity levels gives the opportunity to consider the existence of differences in their salinity tolerance, but there is no experimental data available on the salinity tolerance of C. sepium. However, according to the recently established ecological indicators of Swedish vascular plants, the species is characterized as only moderately salinity tolerant (indicator value 2 of 5) [11].
The taxonomically closely related species, Calystegia soldanella (L.) R. Br., is a coastal-specific creeping clonal plant characteristic for sand dunes [12]. The species has pronounced drought [13] and, presumably, salinity tolerance [14,15], but the latter has been assessed experimentally only in a hydroponic cultivation system [16].
Accumulation of monovalent cations K+ and Na+ is an important constituent of salinity tolerance of plant species native to salt-affected habitats with consequences for both osmotic as well as ion balance [17,18,19]. There are extremely large differences in ion accumulation rates, patterns and specificity for various salt-adapted plant species [20,21,22,23]. Most intriguing, alrhough it is usually justified that retention of K+ in cytoplasm is a critical feature for salinity tolerance, several species native to saline habitats predominantly accumulate Na+ and exclude K+ at high salinity [24,25]. Previously, during a survey of 102 coastal plant species from sea-affected habitats, it was found that C. sepium had relatively high Na+ uptake potential in leaves, with ion accumulation characteristics similar to these of the coastal-specific species Trifolium fragiferum, Schoenoplectus tabernaemontani, Atriplex littoralis etc. [26].
The aim of the present study was to analyze salinity tolerance and ion accumulation characteristics for various accessions of C. sepium from different habitats in comparison to these of C. soldanella. in controlled conditions. It was hypothesized that salt tolerance and ion accumulation characteristics of coastal accession of C. sepium will be comparable to these of C. soldanella, but putatively drought tolerant inland accession of C. sepium will be more salt tolerant than the accession from a mesophytic habitat.

2. Materials and Methods

2.1. Plant Material

As model plants, three accessions of C. sepium from different habitats and C. soldanella were used (Table 1). Mature rhizome fragments from various accessions of C. sepium were collected in three different habitats in June and July. C. sepium 1 (CSe1) was a component of a salt-affected coastal sandy beach perennial vegetation, located about 10 m from a water line, together with Phragmites australis. C. sepium 2 (CSe2) was from a mesophytic vegetation on the banks of a pond together with P. australis and other perennial vascular plant species. C. sepium 3 (CSe3) plants were located on a drought-exposed steep riverbank growing in sand-gravel soil. The fragments were used to establish a laboratory stock culture of C. sepium. Seeds of C. soldanella (CSo) were purchased from Plant World Seeds (Newton Abbot, Devon, UK).
In addition, five leaves from different shoots were collected from all accessions of C. sepium plants in their native habitats and were used for measurements, as described further.

2.2. Establishment of Stock Cultures

Rhizomes were washed in tap water to remove all soil particles, rinsed with deionized water and cut in 2–3 cm fragments with visible presence of vegetative meristems (nodes). After immersing for 30 s in ethanol (70%), rhizome fragments were washed with tap water for 2 min, followed by deionized water, and were blotted dry. Rhizome fragments (30 for each accession) were planted in plastic tissue culture containers (1 L, 10 fragments per container) containing heated (60 °C, 24 h) garden soil (Biolan, Eura, Finland) and closed with lids. Containers were placed in a growth cabinet (light/dark period of 16/8 h, photosynthetically active radiation with a photon flux density 100 µmol m−2 s−1, day/night temperature 15/20 °C). After the appearance of shoots, the lids were removed and the containers were acclimated to greenhouse conditions. When shoots reached 10–15 cm length, plants were transferred to 5 L containers with garden soil (Biolan, Eura, Finland), 5 plants per container. Plants were cultivated in an experimental automated greenhouse (HortiMaX, Maasdijk, Netherlands) with supplemented light from Master SON-TPIA Green Power CG T 400 W (Philips, Amsterdam, Netherlands) and Powerstar HQI-BT 400 W/D PRO (Osram, Munich, Germany) lamps (380 µmol m−2 s−1 at the plant level) for a 16 h photoperiod, with day/night temperature of 24/16 °C and relative air humidity of 60–70%. Support for plants was provided by bamboo poles. Necessary soil moisture was provided by deionized water. Stock cultures of C. sepium were used for the propagation of plant material for experiments when plagiotropic above-ground stems formed.
For C. soldanella, seeds were treated with concentrated H2SO4 for 3 h to interrupt physical dormancy, as described previously [27]. Seeds were planted in plastic tissue culture containers (1 L, 5 seeds per container) containing heated (60 °C, 24 h) garden soil (Biolan, Eura, Finland) and closed with lids. Containers were placed in a growth cabinet (light/dark period of 16/8 h, photosynthetically active radiation with a photon flux density 100 µmol m−2 s−1, day/night temperature 15/20 °C). After the appearance of seedlings, the lids were removed, and the containers were acclimated to greenhouse conditions. Well-developed seedlings with 2–3 leaves were transferred to 5 L containers with garden soil (Biolan, Eura, Finland), 3 plants per container, and cultivated in greenhouse for 10 weeks. Necessary soil moisture was provided by deionized water.

2.3. Plant Propagation for Experiments and Cultivation

Preliminary experiments were performed to establish the most suitable method for vegetative propagation of C. sepium and C. soldanella from a stock culture. It was established that fragments of plagiotropic stem with a single leaf and fragments of creeping stem with a single leaf were the most appropriate material for propagation of C. sepium and C. soldanella, respectively. Stem explants (about 5–6 and 3–4 cm in length for C. sepium and C. soldanella, respectively) were inserted in quartz sand (Saulkalne S, Saulkalne, Latvia), moistened with deionized water in plant growing trays and placed in closed 48 L containers. Containers were put in a growth chamber (light/dark period of 16/8 h, photosynthetically active radiation with a photon flux density 100 µmol m−2 s−1, day/night temperature 15/20 °C). After 12 days, explants with well-developed roots and vigorous shoot growth were transplanted to 1.2 L plastic containers filled with 1 L garden soil (Biolan, Eura, Finland) and quartz sand (Saulkalne S, Saulkalne, Latvia) (2:1, v/v).
During all experiments, plants were kept in a greenhouse in the same conditions as indicated above and irrigated with deionized water every other day. Substrate water content was monitored with a HH2 moisture meter equipped with a WET-2 sensor (Delta-T Devices, Burwell, UK) and kept at 50 to 60%. Every other week, plants were fertilized with Yara Tera Kristalon Red and Yara Tera Calcinit fertilizers (Yara International, Oslo, Norway). A stock solution was prepared for each fertilizer (100 g L−1) and the working solution contained 25 mL of each per 10 L deionized water, used with a rate 100 mL per container. Individual containers were randomly redistributed weekly on a greenhouse bench. Support for C. sepium plants was provided by bamboo poles.

2.4. Plant Treatment and Harvesting

Ten days after the final transplanting, plants from three accessions of C. sepium and C. soldanella plants were randomly distributed in six groups (treatments), with five individuals per group (control without Na+ addition, 0.5, 1, 2, 4, 6 g Na+ L−1). Treatment with NaCl dissolved in deionized water was performed once a week, using doses not larger than 1 g Na+ (2.54 g NaCl) per individual container until final treatment doses were reached. Plants were cultivated for an additional 7 weeks after reaching the full treatment.
At termination of the experiments, plants were individually separated in different parts (stems, leaves, rhizomes, roots). For CSe3, also flowers, and for CSo, leaf blades and leaf petioles were harvested separately. The number of individual stems and leaves, as well as the length of stems, were measured. All above-ground parts were rinsed with deionized water and blotted dry. Roots and rhizomes were carefully washed with running tap water to remove any substrate particles, rinsed with deionized water and blotted dry. All individual parts were weighed before and after drying in an oven at 60 °C for 72 h. Water content in plant parts was calculated in g H2O per g dry mass.

2.5. Measurements

Measurements were performed in three biological replicates (tissue samples from individual plants) per treatment. Tissue samples were cut to small pieces using scissors, thoroughly homogenized, and a sample of 0.2 g was randomly taken from the total amount of tissue material. Tissues were ground with mortar and pestle to a fine powder, and 10 mL of deionized water was added. The homogenate was stirred with a pestle for 1 min. After filtration through nylon mesh cloth, (No. 80) homogenate was used for measurement of ion concentration by LAQUAtwin compact meters B-722 (Na+) and B-731 (K+), and electrical conductivity by LAQUAtwin conductivity meter B-771 (Horiba, Kyoto, Japan) and measurement of osmotic value. For osmotic value analysis, 50 μL of extract were transferred in a 1.5 mL Eppendorf tube and placed in a freezing point osmometer, Osmomat 3000 Basic (Gonotec Meβ- und Regeltechnik, Berlin, Germany), and operated according to the manufacturer’s instructions. Using a standard curve for different concentrations of NaCl and KCl, the osmotic value caused by the total concentration of Na+ and K+ was calculated according to the actual Na+ and K+ concentration of each sample extract. For each sample, the difference between the total osmotic value and the osmotic value due to Na+ and K+ ions was calculated and designated as “non-ionic osmotic value”, which showed the osmotic effect of other osmotically active ions (besides Na+, K+ and Cl) or non-ionic compounds. At least three analytical replicates were performed for each sample and the average value was calculated.

2.6. Data Analysis

Results were analyzed by KaleidaGraph (v. 5.0, Synergy Software, Reading, PA, USA). Statistical significance of differences was evaluated by one-way ANOVA using post-hoc analysis with minimum significant difference. Principal component analysis was performed by a freely available web program, ClustVis (http://biit.cs.ut.ee/clustvis/) (accessed on 30 June 2022) [28]. For graphs of principal component analysis, prediction ellipses were such that, with probability 0.95, a new observation from the same group will fall inside the ellipse. Unit variance scaling was applied to rows; singular value decomposition with imputation was used to calculate principal components.

3. Results

Plants from three different C. sepium accessions showed significant differences in ion accumulation character in leaves in natural conditions (Table 2). Significant higher tissue water content in leaves of coastal accession CSe1 tended to equate to differences in ion content and electrolytical activity that were visible on dry mass basis.
When cultivated in controlled conditions, the model species showed different biomass accumulation potential (Figure 1) and biomass partitioning characteristics even without added salt (Figure 2). In non-saline conditions, CSe1 plants had the highest total biomass, and more than 80% was allocated to stems. CSe2 plants also had high contribution of stems, but no rhizomes were present. In contrast, C. soldanella plants had the lowest biomass and accumulated most of the matter in leaves and rhizomes. Only CSe3 plants developed flowers in the current conditions.
In addition, the growth of different model plants was differentially affected by increasing soil salinity. Total biomass of CSe1 plants showed the most dramatic decrease as a result of increasing soil salinity both in absolute (Figure 1A) and relative (Figure 1B) terms. C. soldanella (CSo) plants also were highly negatively affected by increasing soil NaCl concentration. In contrast, CSe2 plants showed significantly lower total biomass, at only 2 g Na+ L−1. However, the CSe3 plants were sensitive even at 0.5 g Na+ L−1, but the effect was not concentration-dependent.
The most pronounced change in biomass partitioning due to increasing soil salinity was the Na+ concentration-dependent relative increase of rhizome biomass in CSe1, accompanied by a decrease in both leaf and root biomass (Figure 2A). A similar effect was evident also for CSe2, but to a lesser extent (Figure 2B). Individual variability in biomass partitioning was rather high for CSe3 plants (Figure 2C); therefore, no pronounced effect of increasing salinity was evident. For CSo plants, sudden disappearance of rhizomes occurred at the highest salinity, but no other changes were evident (Figure 2D).
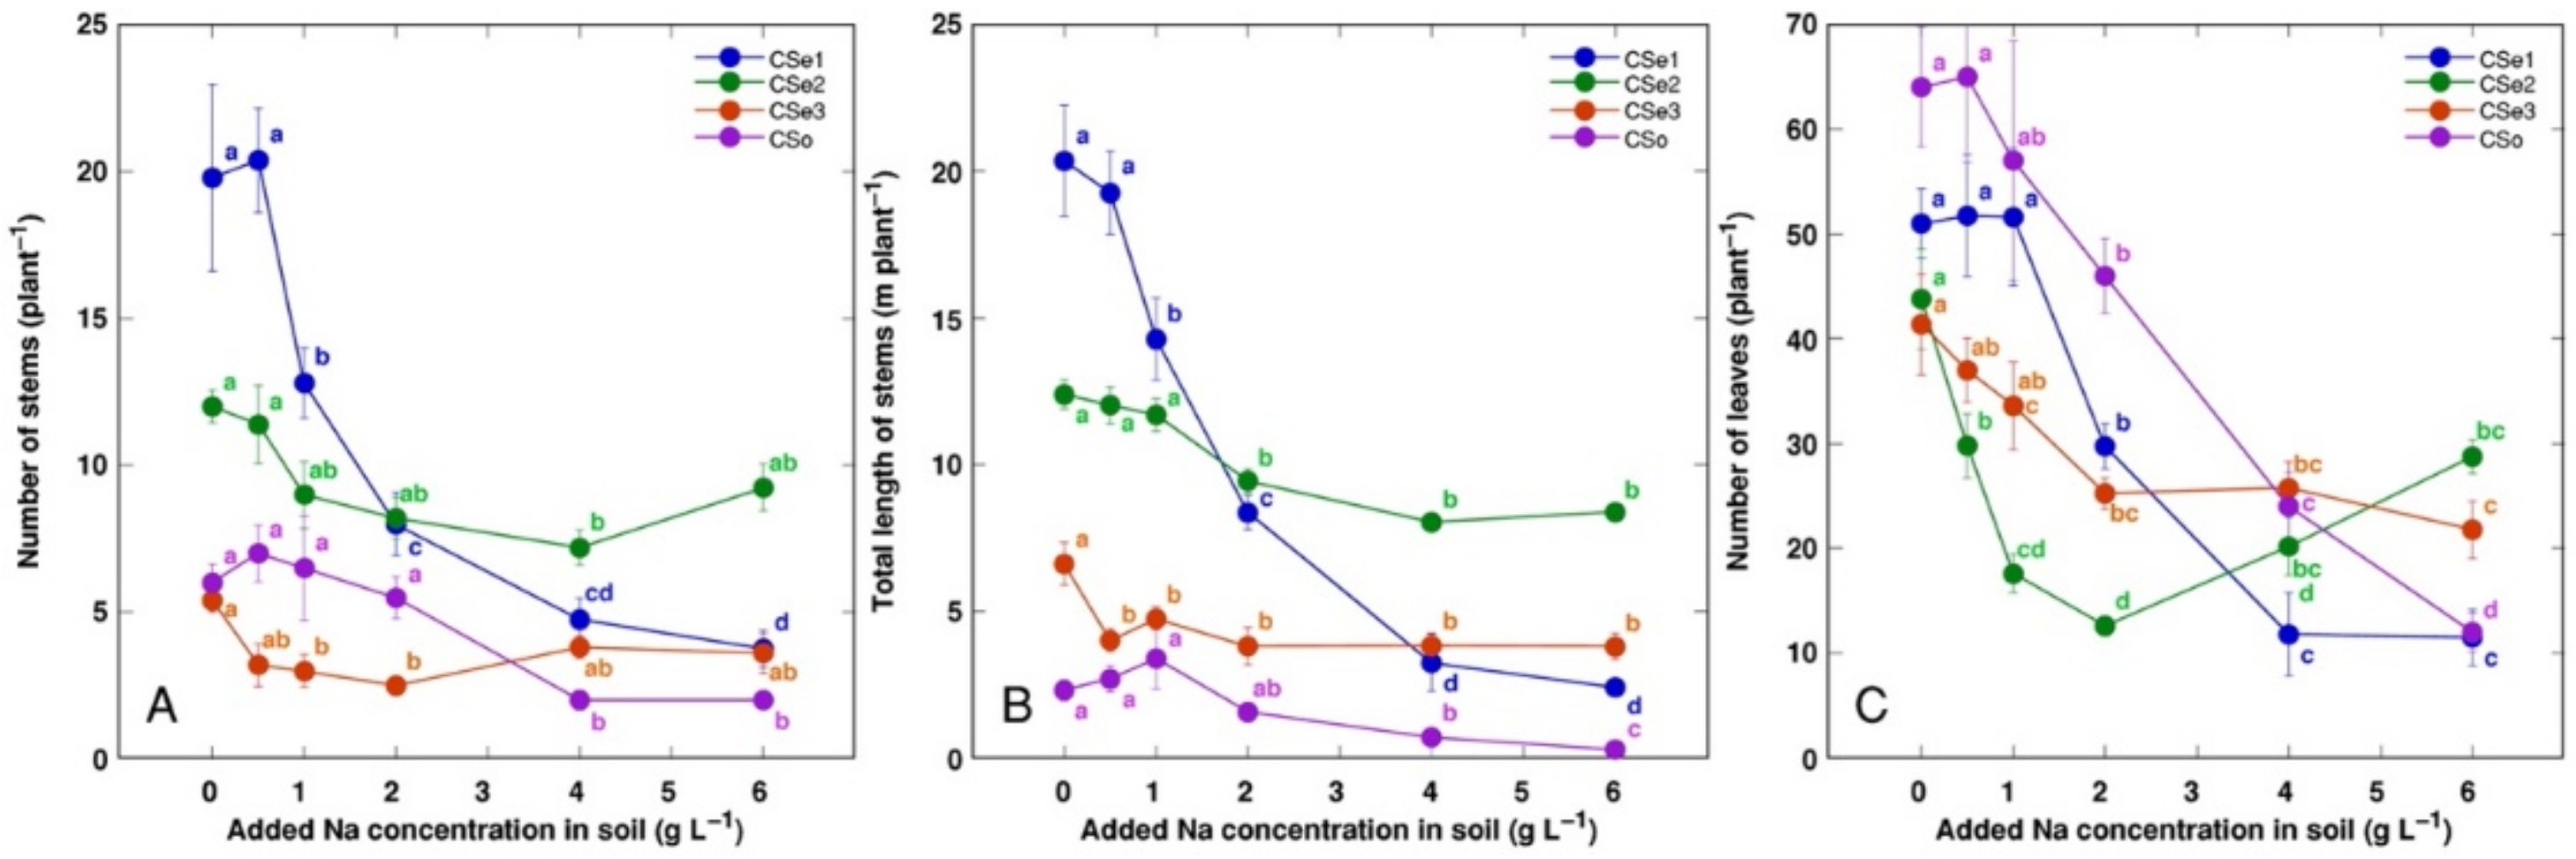
Other morphological parameters also showed plant genotype-specific changes due to increasing soil salinity (Figure 3). The number of leaves was the most sensitive indicator, with significant decrease by salinity for all model plants (Figure 3C). Coastal accession C. sepium had the highest number of stems (Figure 3A) and total stem length (Figure 3B) for control plants, and these parameters were dramatically decreased with increasing soil salinity.
Water content in leaves and stems changed relatively little with increasing soil salinity (data not shown); however, the roots showed salinity-related physiological differences between the model plants (Figure 4A). Root water content significantly increased by salinity in CSe1 and decreased in CSe2. In addition, root water content increased in CSe3 at low salinity and tended to decrease in CSo. Rhizome water content decreased both in CSe1 and CSe2, with a tendency to increase in CSo (Figure 4B).
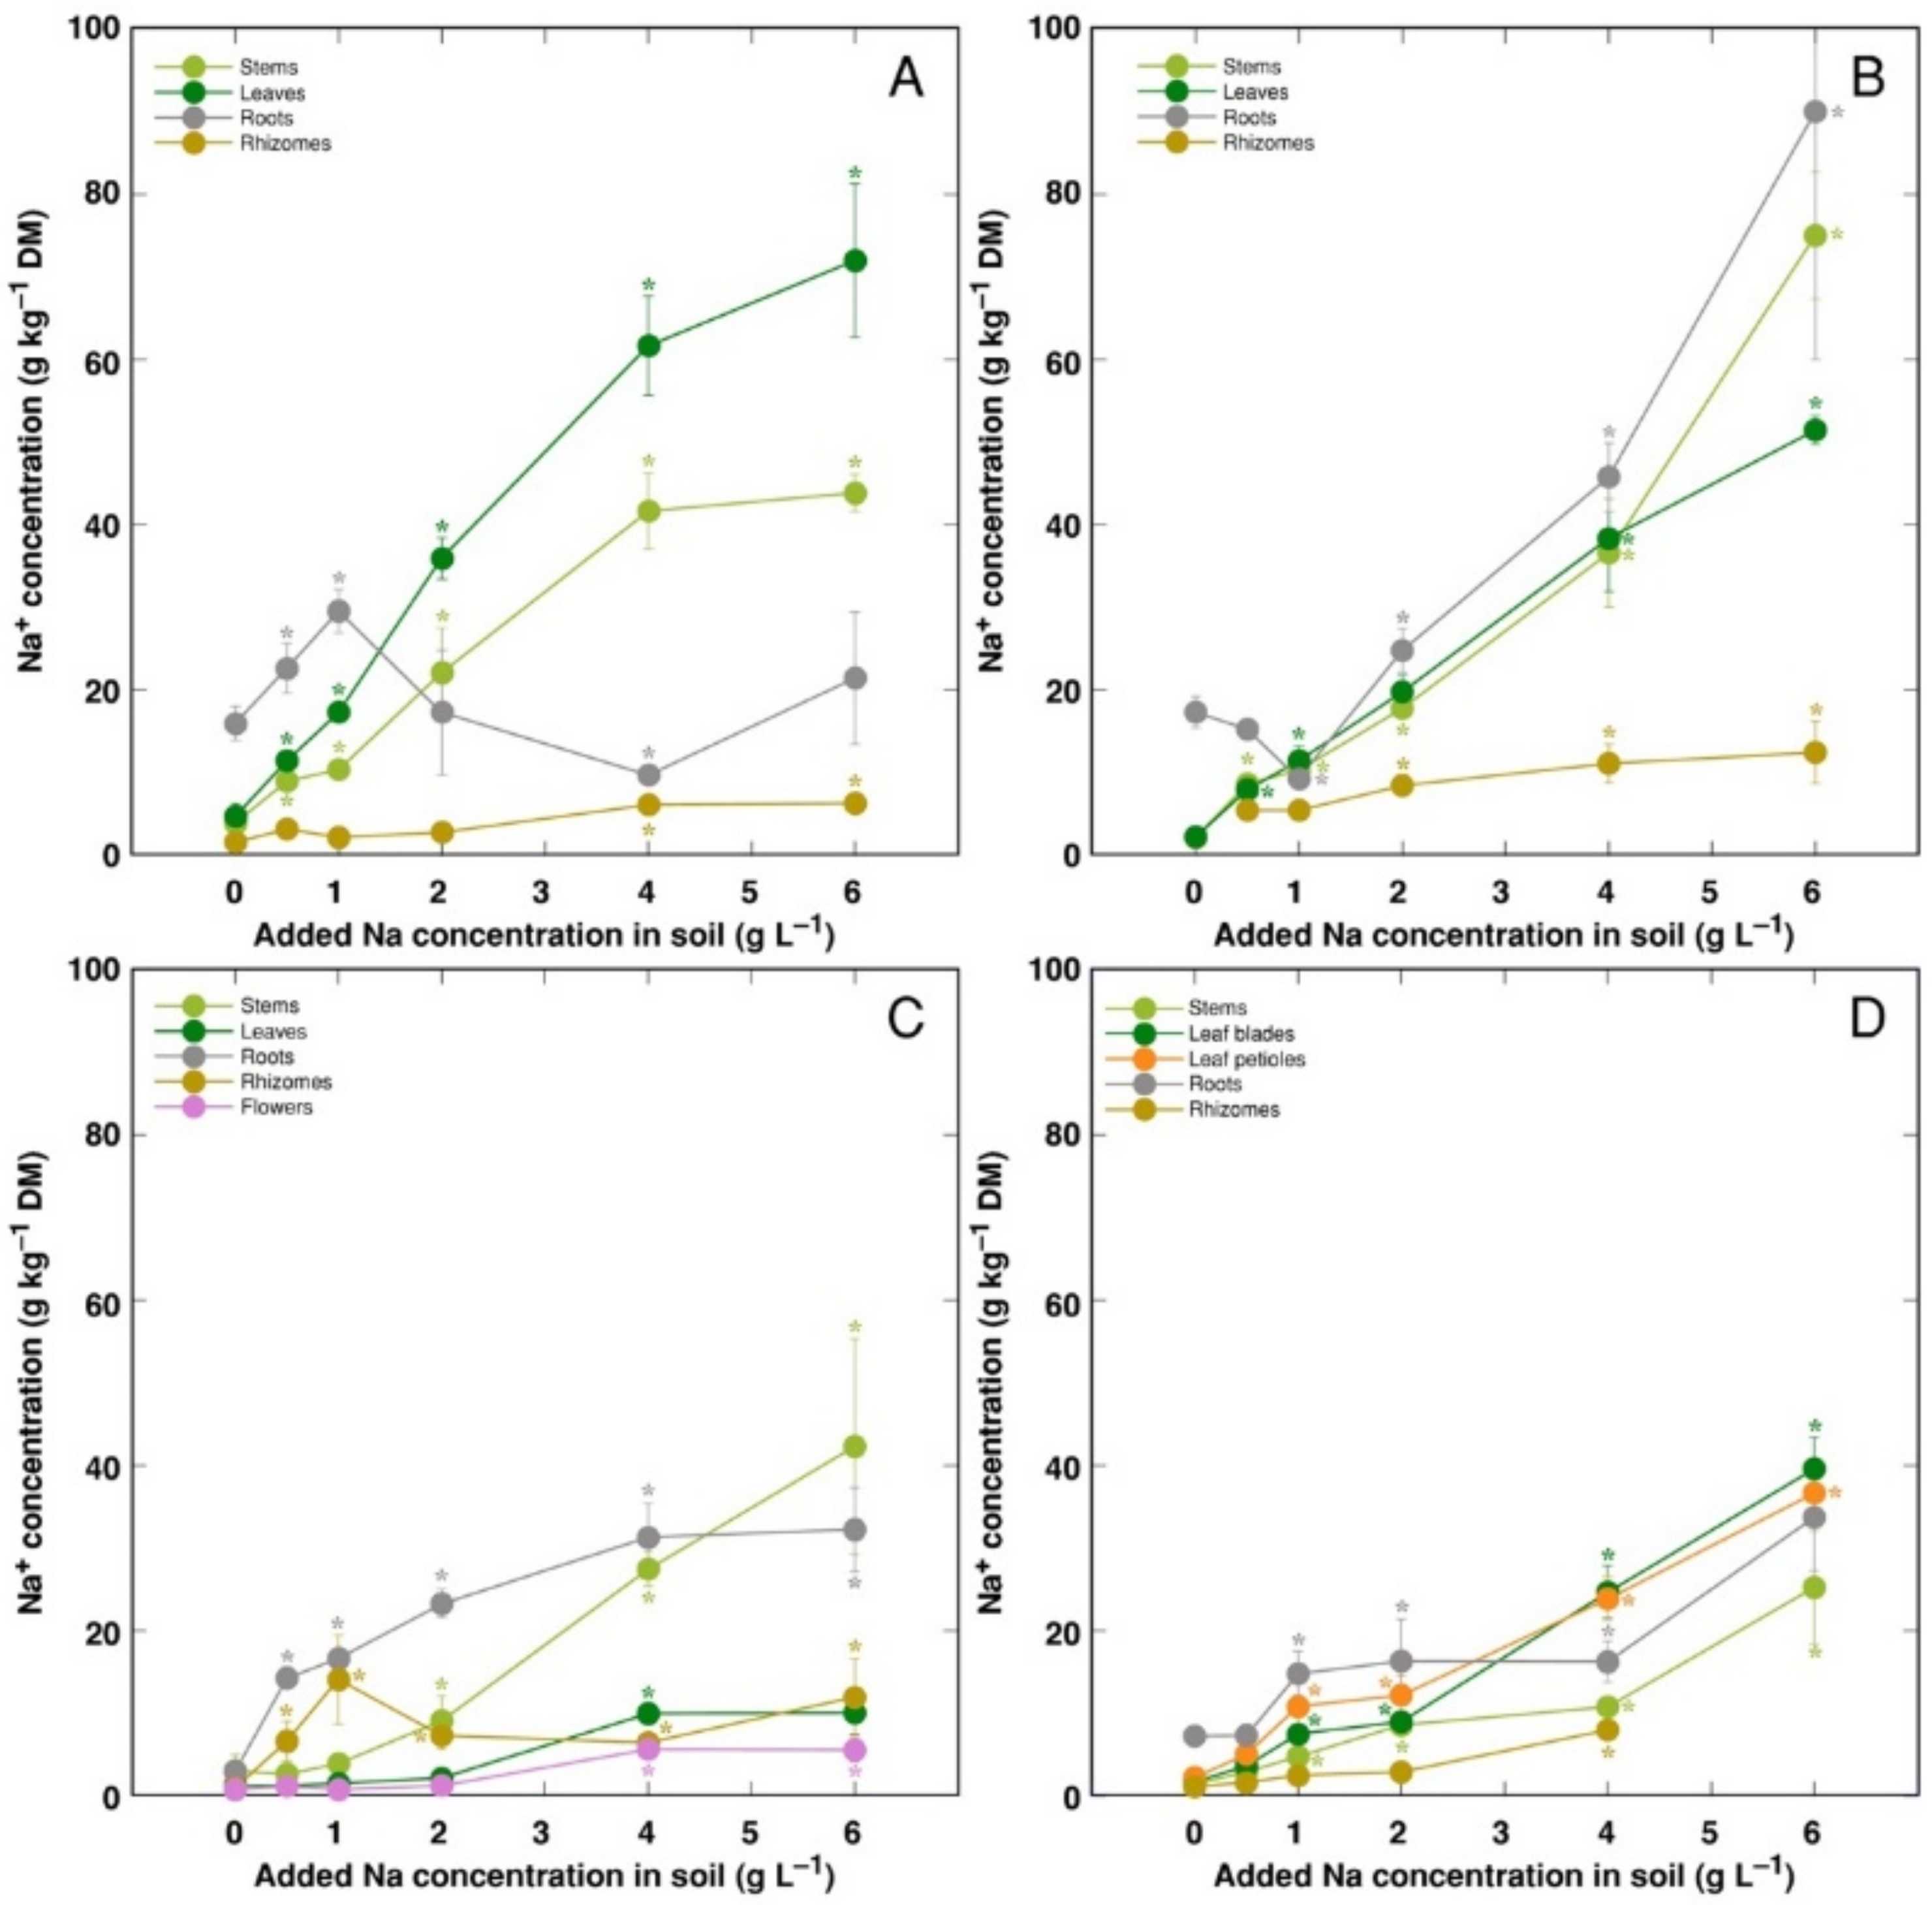
Changes in ion accumulation under salinity were evaluated in separate plant parts. Na+ was efficiently excluded from rhizomes of all model plants, leaves of CSe3 and roots of CSe1 (Figure 5). For CSe1, Na+ preferentially accumulated in leaves, with lower concentration in stems (Figure 5A). For CSe2 and CSo, similar concentration of Na+ accumulated in roots, leaves and stems (Figure 5B,D). For CSe3, accumulation of Na+ dominated in roots at low and medium soil Na+ concentration, with stem Na+ concentration reaching high levels at high treatment rate (Figure 5C). In general, CSe1 and CSe2 had higher Na+ accumulation potential in comparison to that in CSe3 and CSo.
K+ concentration increased in stems and decreased in leaves for CSe1 and CSe2 plants under the effect of salinity (Figure 6A,B). However, leaf K+ concentration increased for CSe3 and CSo (Figure 6C,D). In roots, K+ concentration was not significantly affected by salinity for CSe1, but it decreased for all other model plants. In rhizomes, K+ concentration increased for CSe1 and decreased in CSe3, and it was not affected for CSe2 and CSo.
For control plants, the molar concentration ratio of K+ to Na+ was the lowest for CSe1, and it increased equally in CSe2 and CSo, with the highest value in CSe3 (Figure 7). The K+:Na+ ratio decreased with increasing soil salinity in all plant genotypes and parts, but the character of decrease was highly variable. In general, a less-pronounced decrease was evident for CSo and especially CSe3. In leaves and flowers of CSe3, the K+:Na+ ratio at first even increased at low salinity (Figure 7C). For all model plants, the lowest K+:Na+ ratio was for roots.
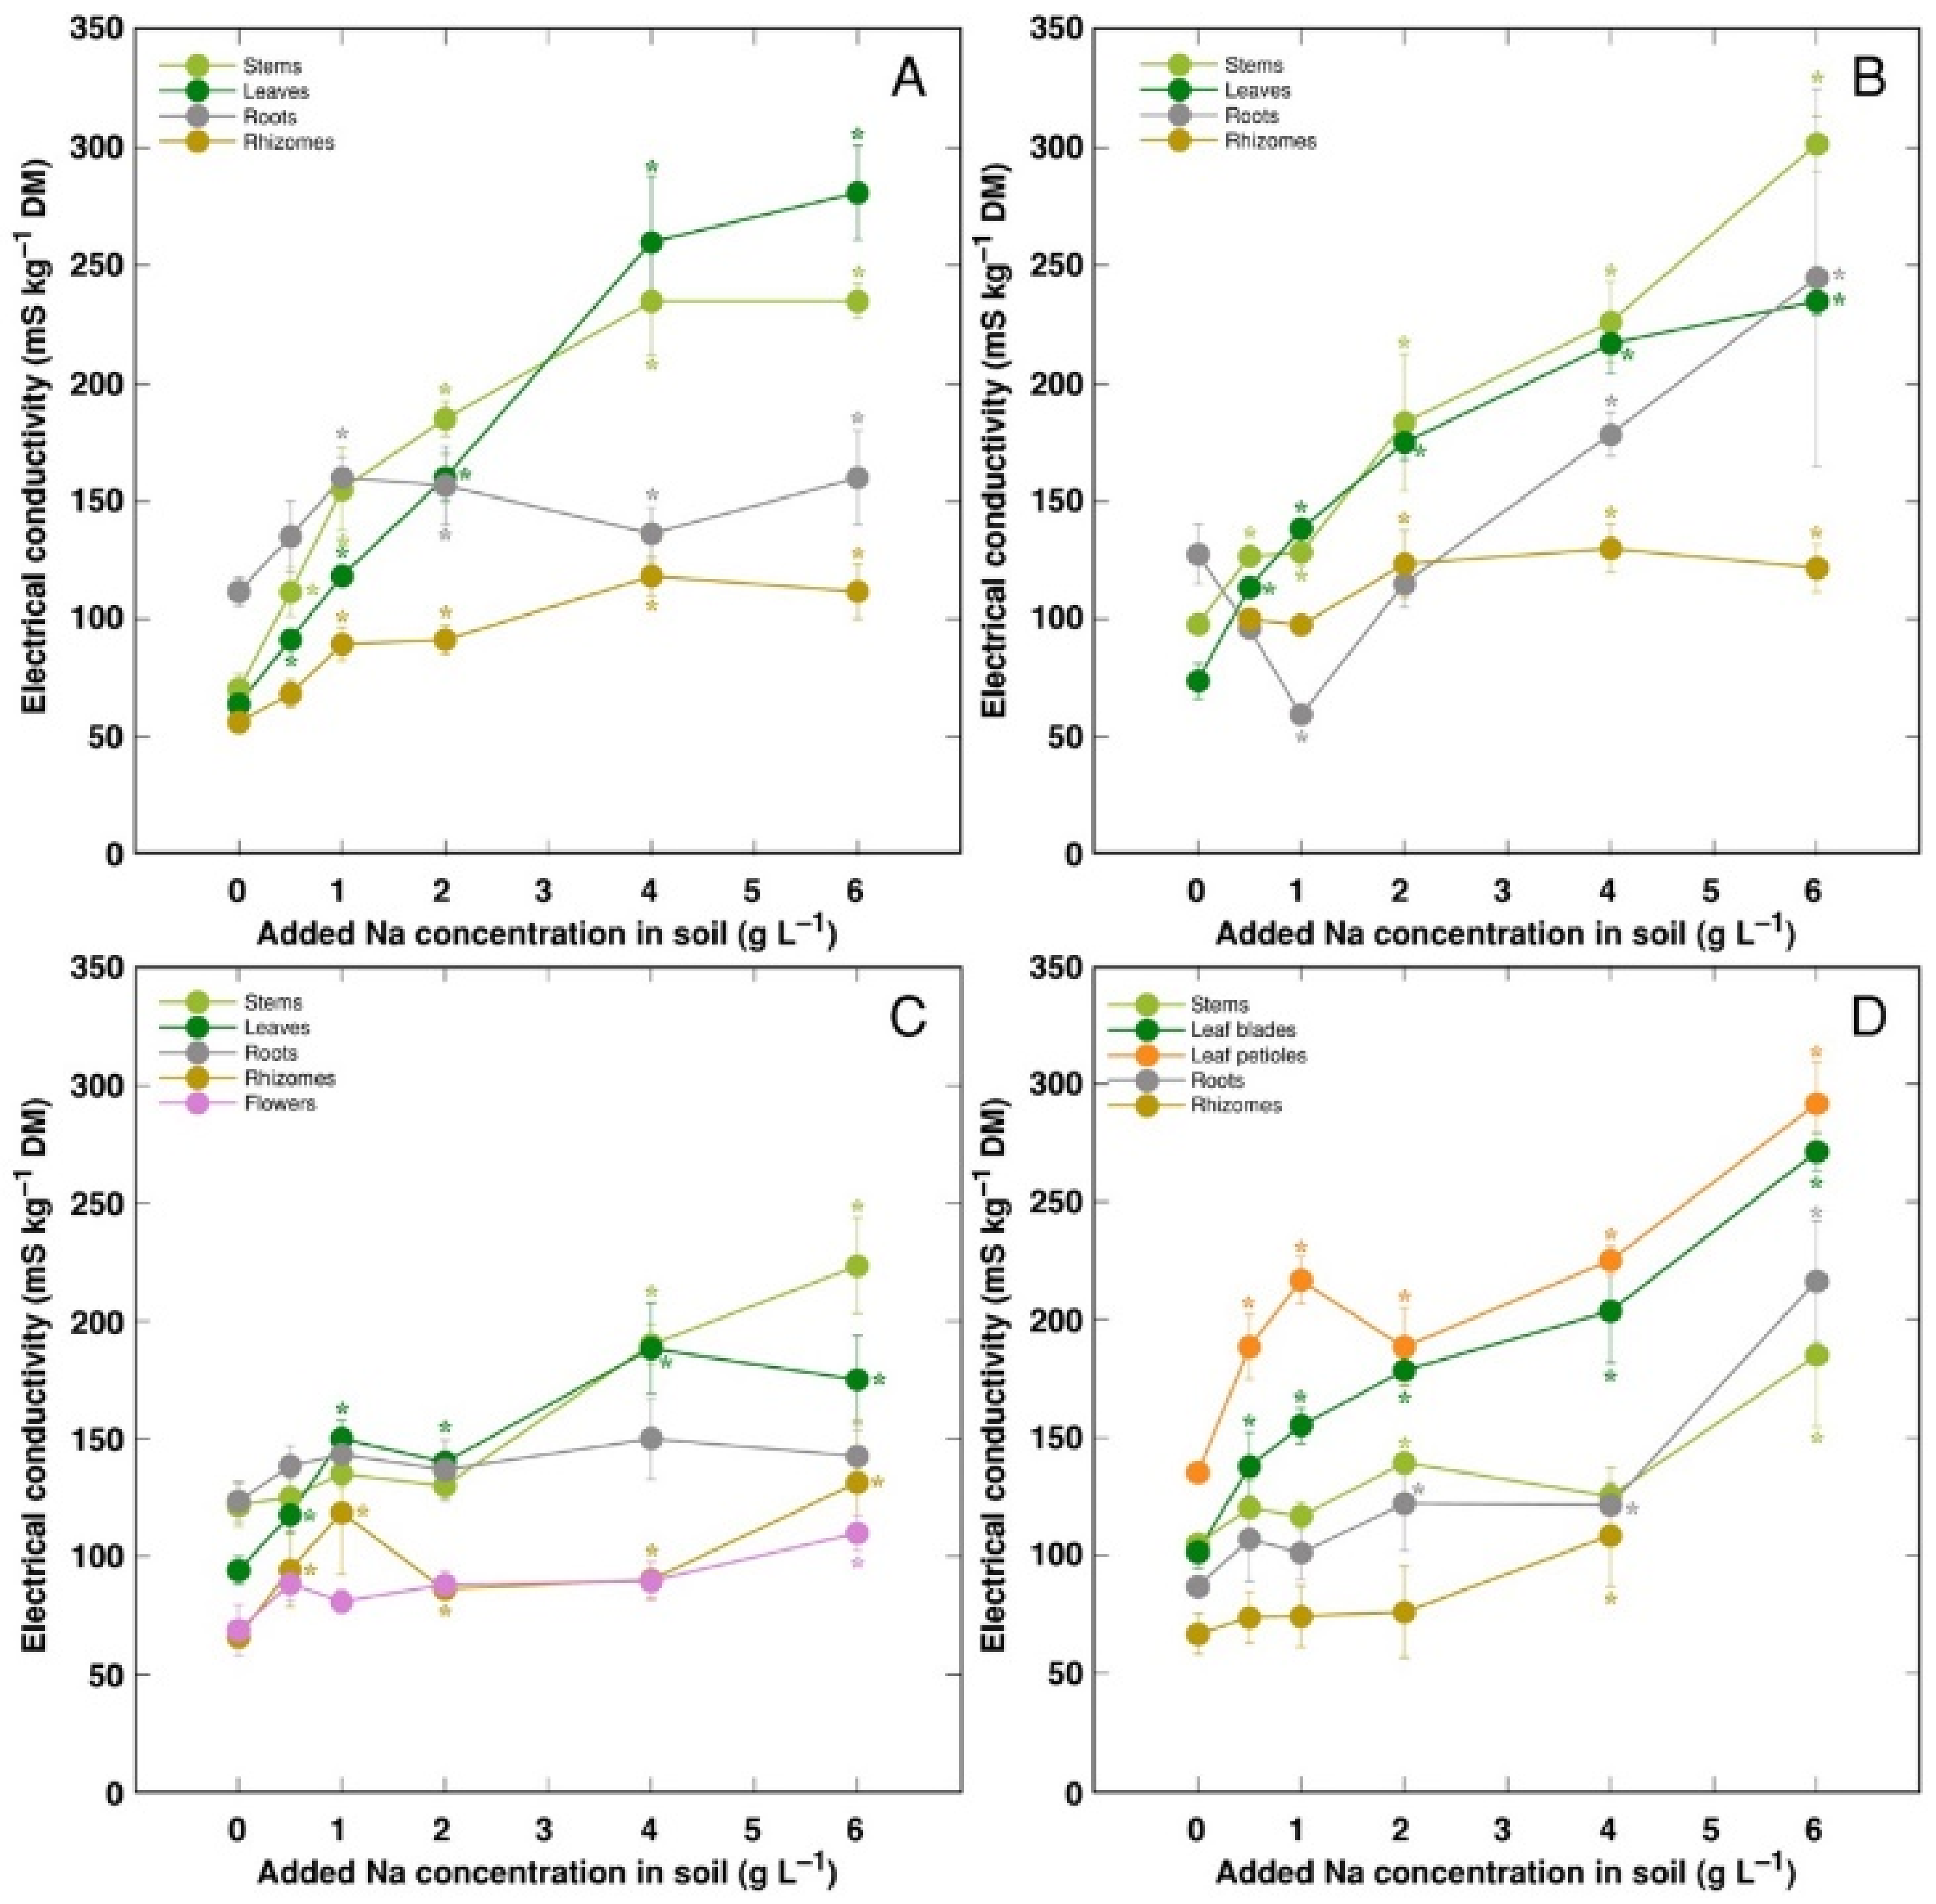
Electrical conductivity was measured as an indication of the total concentration of electrolytically active ions in plant tissues, and, in general, it increased with increasing soil salinity, but to a different degree (Figure 8). The lowest electrolytical activity and, relatively, the least increase of the activity by salinity was evident in rhizomes for all genotypes, and flowers for CSe3. Electrical conductivity was similar in stems and leaves for all model plants except CSo, where its level was lower in stems.
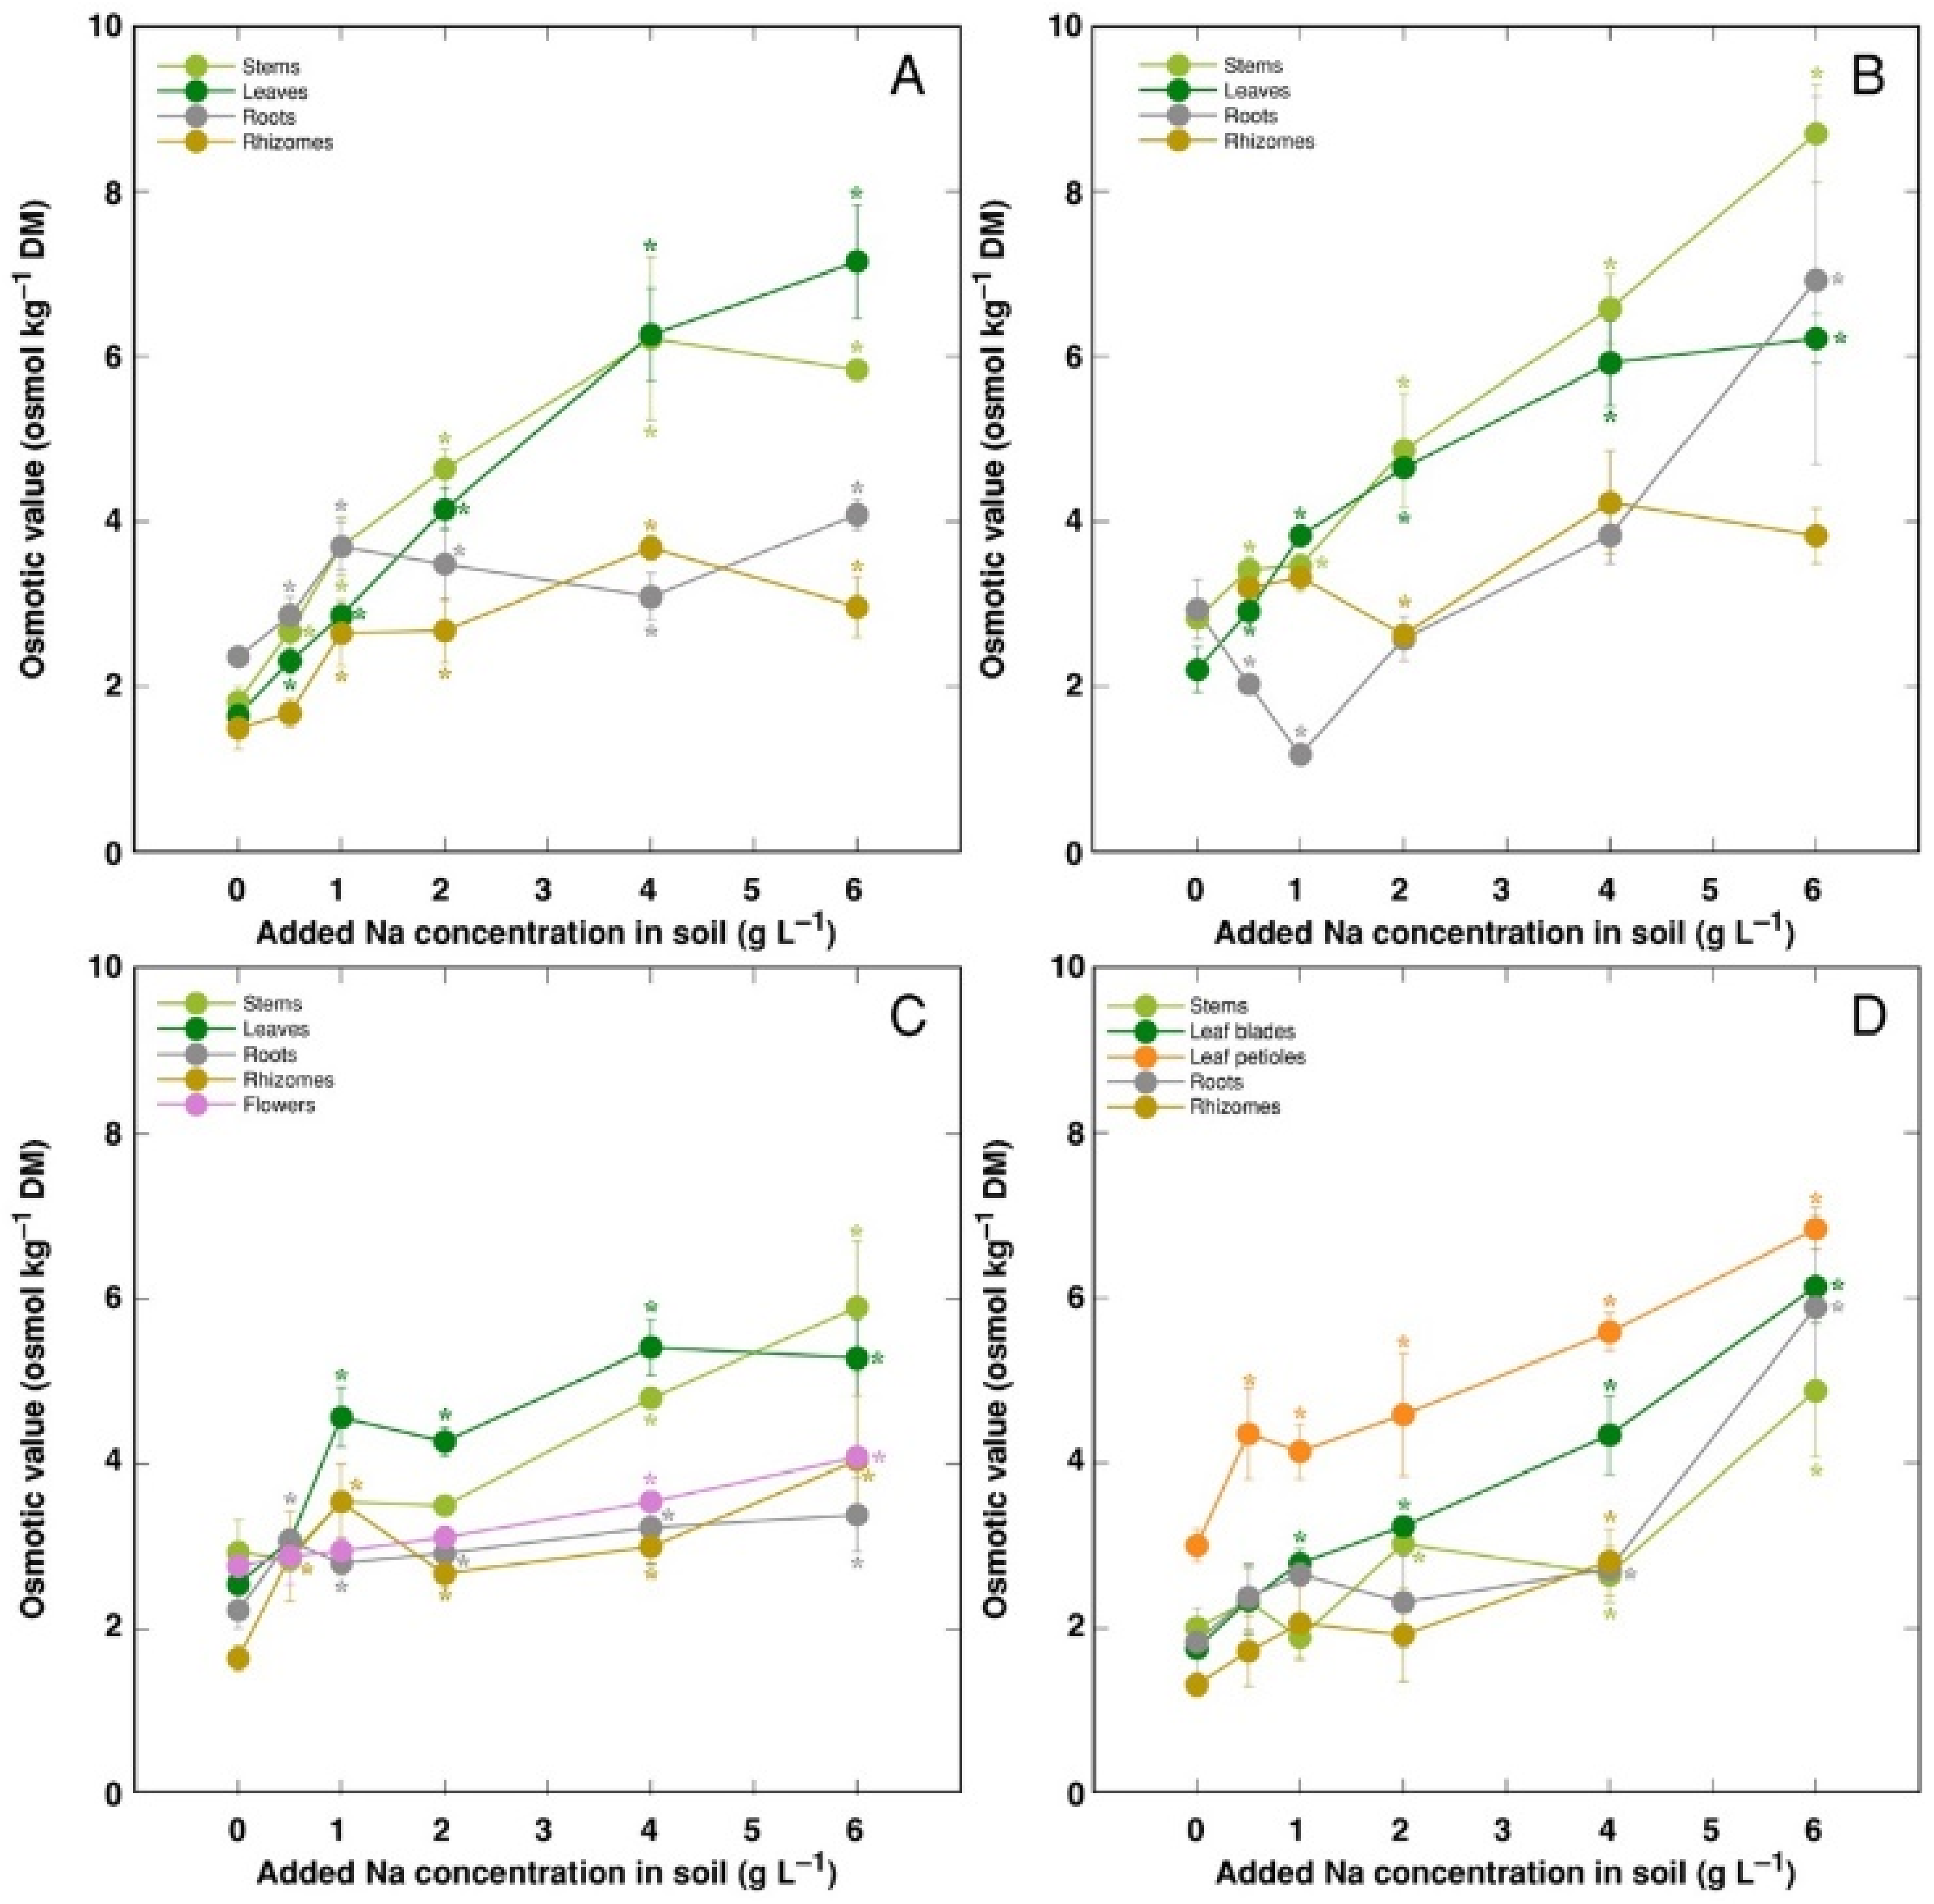
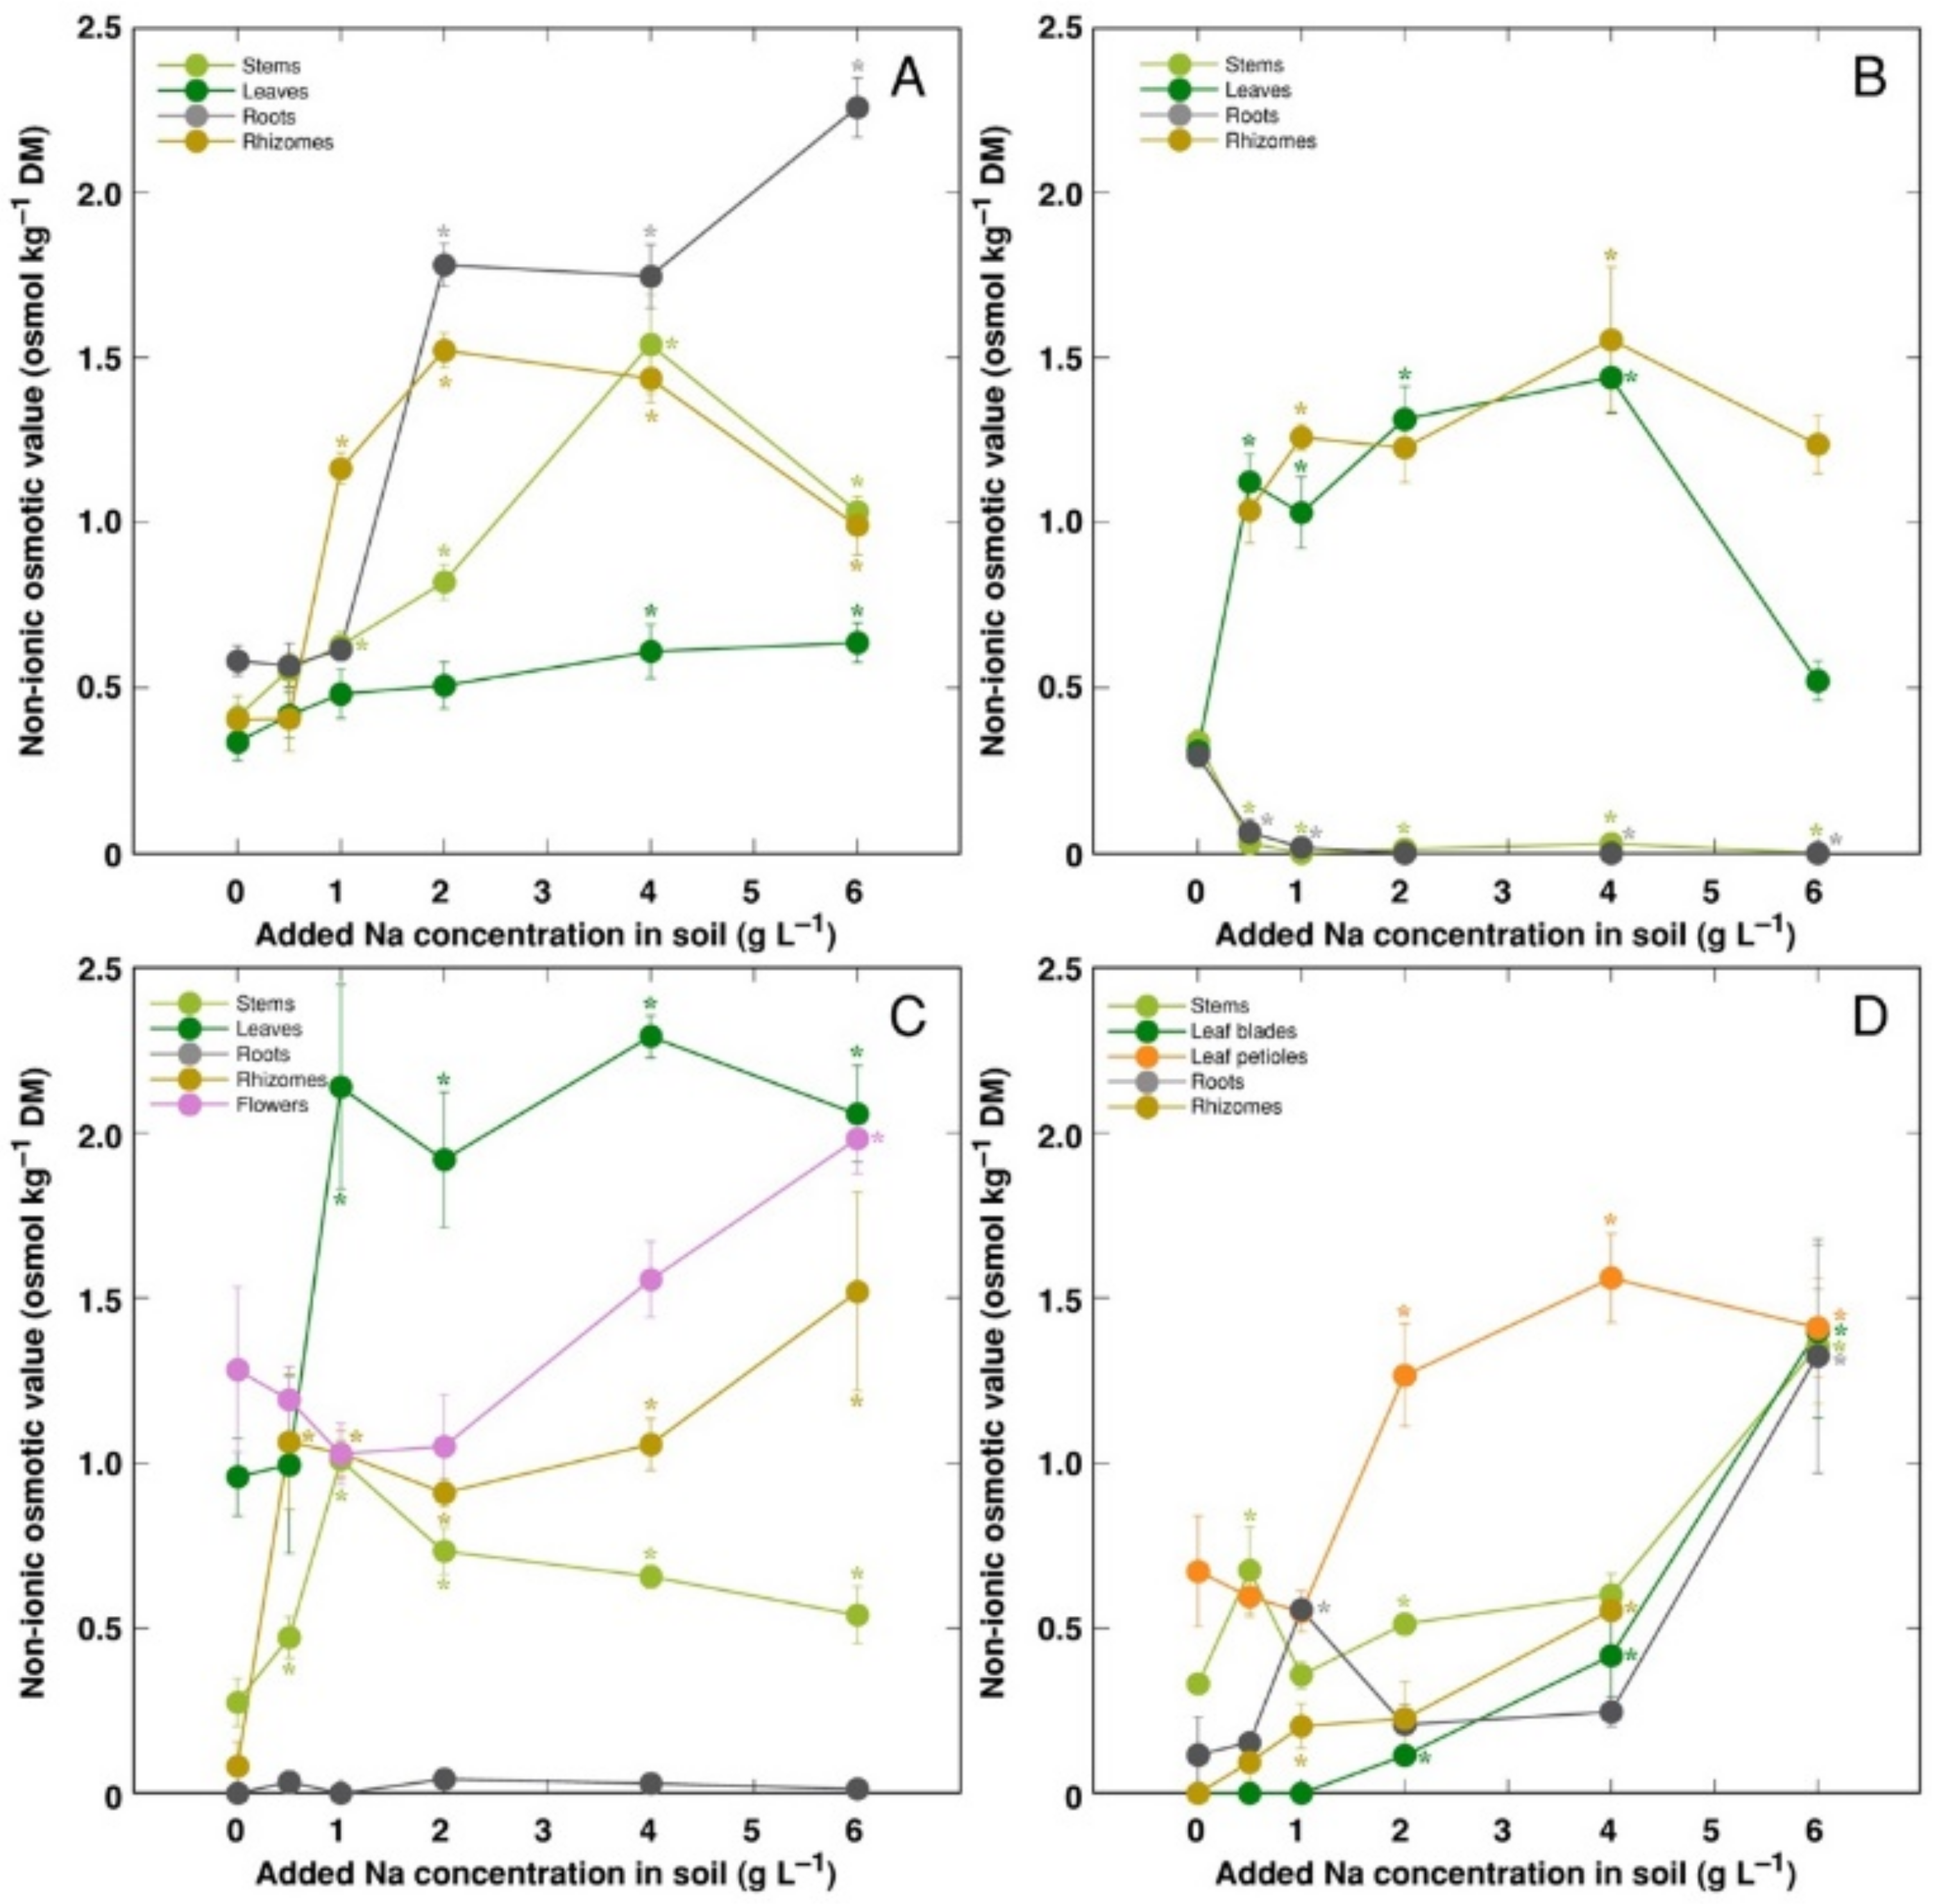
The trend of changes in the total osmotic value was similar to that for electrical conductivity; however, differences between plant organs were less pronounced (Figure 9). However, distribution of the osmotic value not associated with Na+, K+ and Cl (non-ionic osmotic value), under the effect of increasing soil salinity, showed both genotype- and organ-specific differences (Figure 10). Concentration of non-ionic osmolytes increased as a result of increased soil salinity in stems, leaves, roots and rhizomes of CSe1 (Figure 10A), stems and leaves of CSe2 (Figure 10B), all plant parts except roots of CSe3 (Figure 10C), and in leaf petioles of CSo, with a significant increase in all plant parts at the highest salinity (Figure 10D).
There was a tight correlation between Na+ + K+ concentration and osmotic value (Figure 11A), Na+ + K+ concentration and electrical conductivity (Figure 11B) as well as electrical conductivity and osmotic value (Figure 11C) for all model plants (p < 0.0001). However, a shifted distribution of relationship between Na+ + K+ concentration and osmotic value was evident, reaching relatively higher osmotic activity at a lower ion concentration, indicating a higher contribution of non-ionic osmolytes in the total osmotic value (Figure 11A).
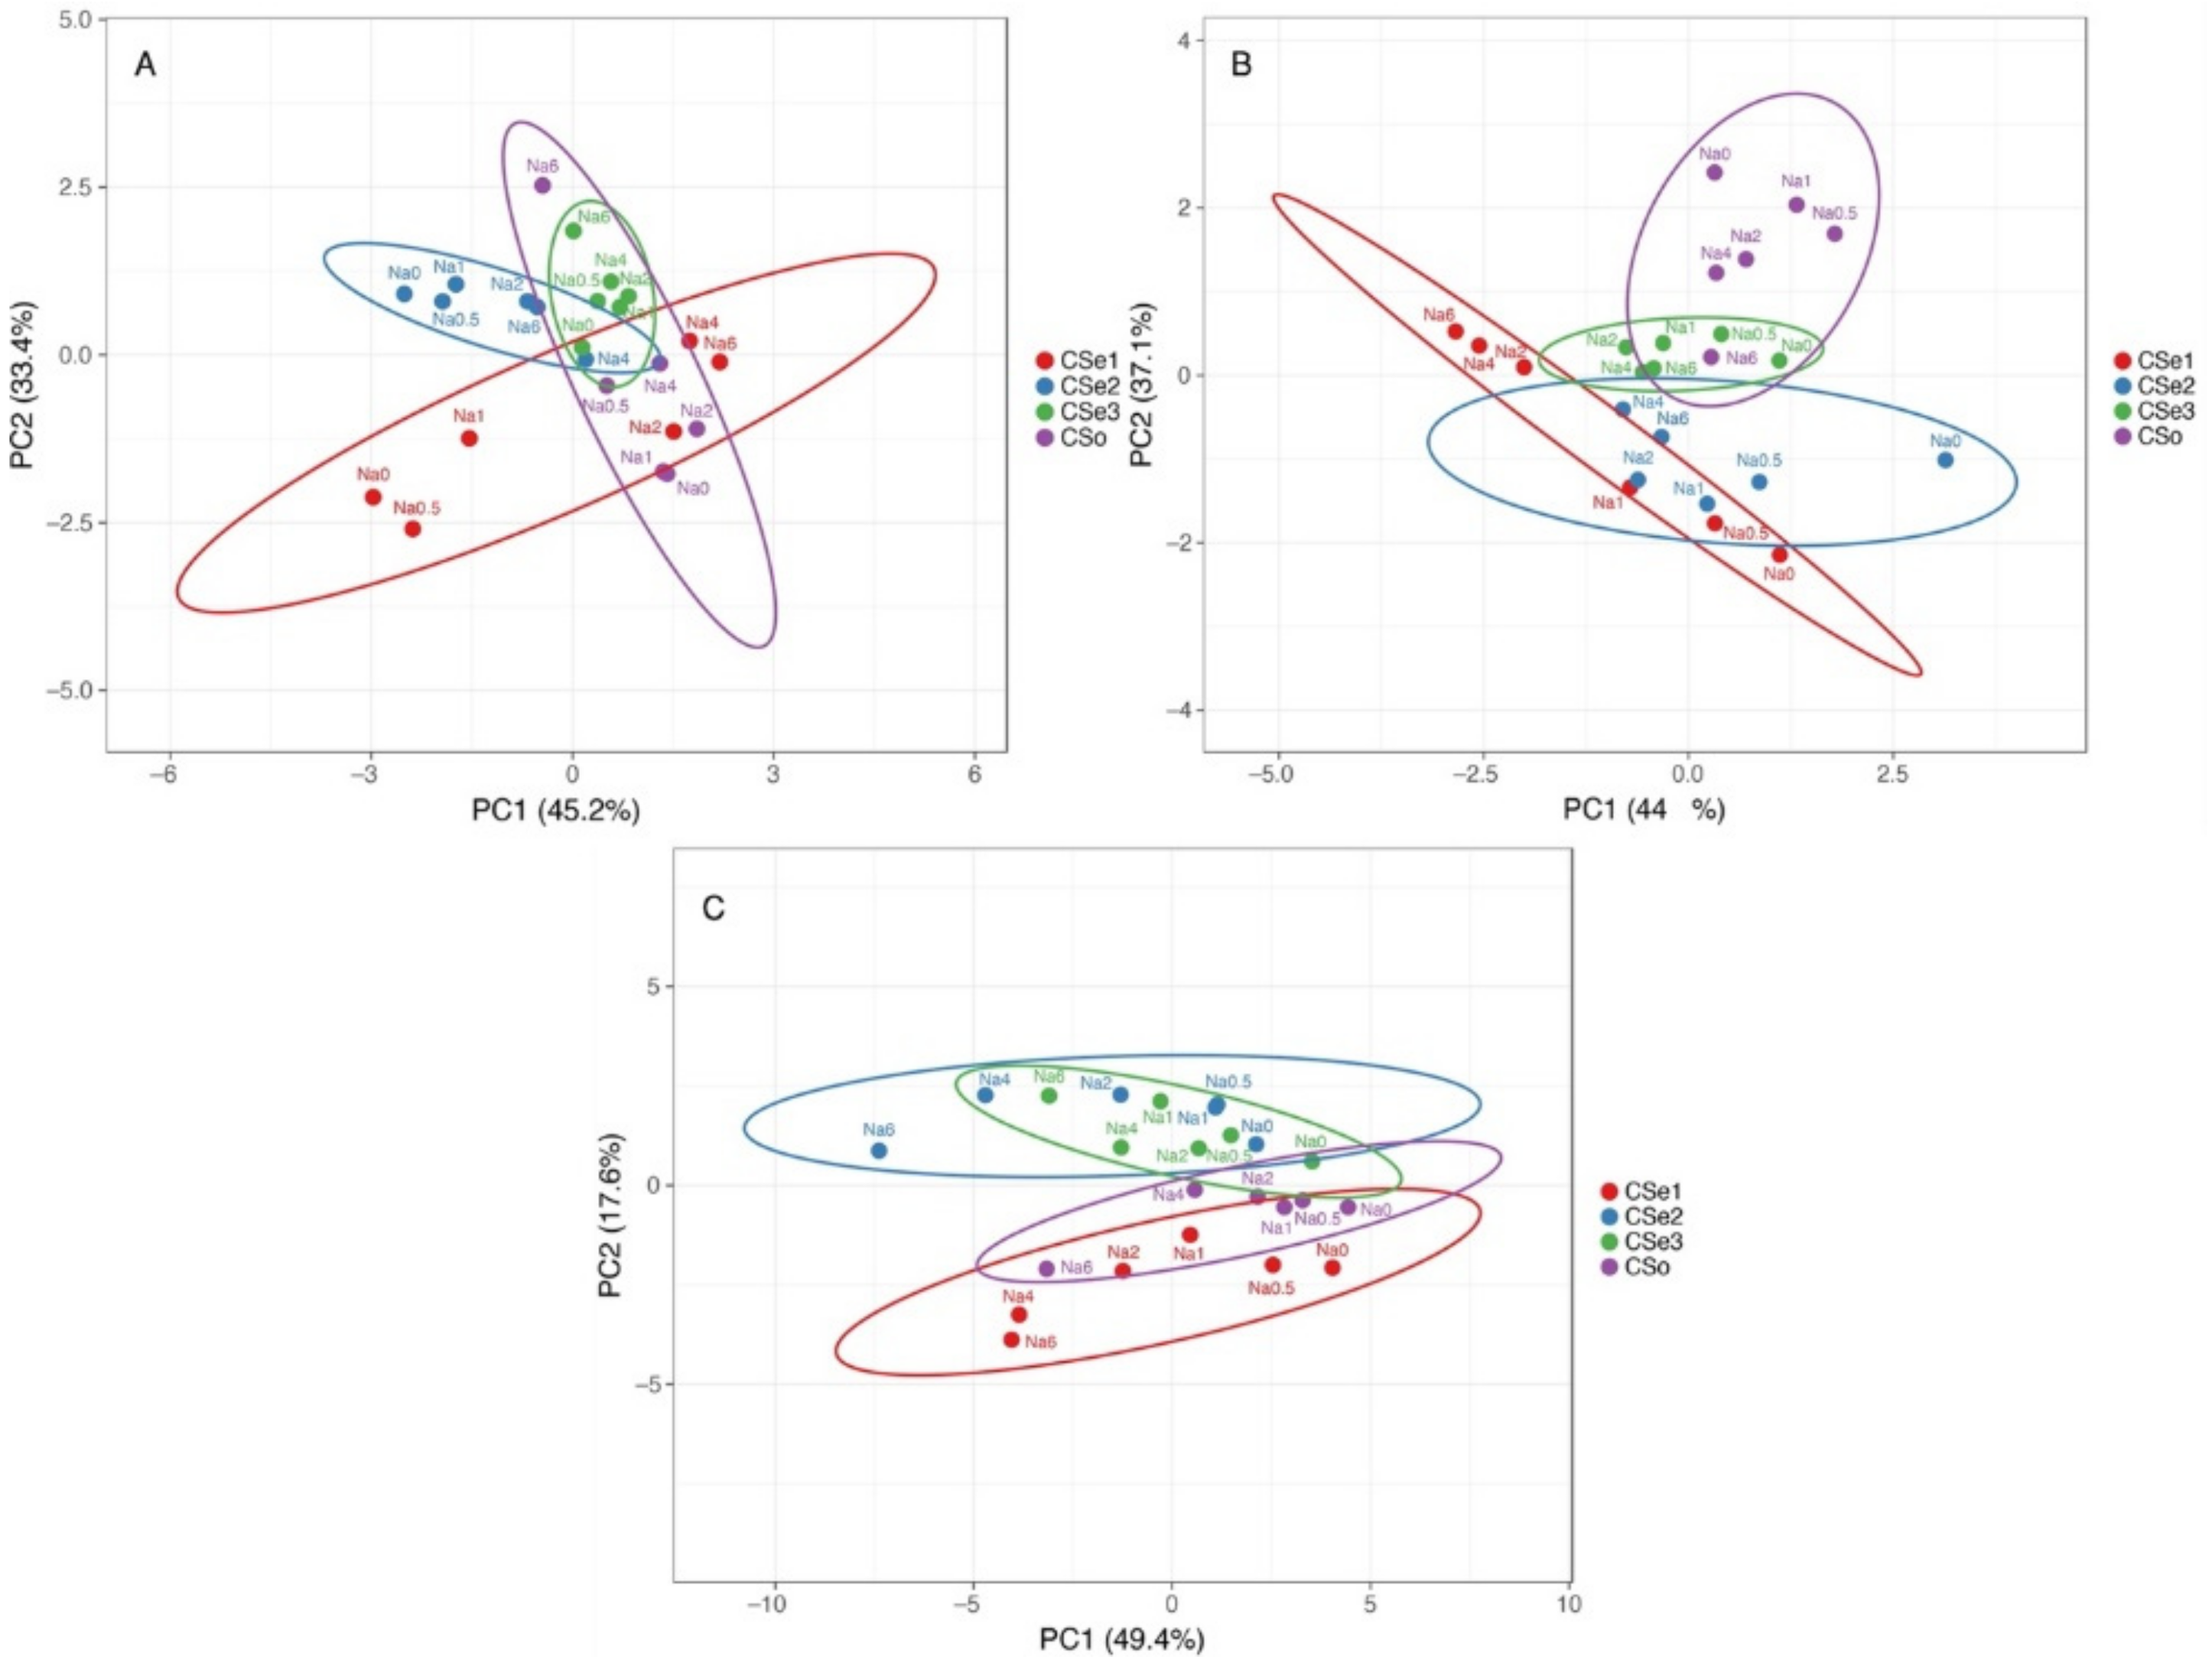
Multivariate analysis indicated relatively high variability of responses to increasing soil salinity between the tested model plants (Figure 12). In respect to morphological parameters (number of leaves, number of stems and rhizomes, length of stems and rhizomes), plants of coastal accession of C. sepium (CSe1) as well as plants of CSe2 growing in control conditions or at low salinity were very different from the others, but a certain similarity was evident between CSe1 and CSe2 and other genotypes at higher salinity (Figure 12A). The morphological parameters of CSe3 fully overlapped with these of CSo. Changes in biomass partitioning due to salinity treatment showed some overlap between CSe1 and CSe2, which was associated with increased partitioning in rhizomes by salinity (Figure 12B). The other two genotypes clearly separated from the previous two, with some overlap between CSe3 plants in control conditions or low salinity with CSo at high salinity. At the level of ion accumulation, Cse1 had some similarity with SCo, and these genotypes separated from the other two, which had similar responses (Figure 12C).

4. Discussion

Usually, studies on plant tolerance mechanisms against salinity involve only single species. Due to differences in experimental conditions, results from these studies are difficult to compare directly. Another very large group of studies compare several halophytic species from a particular type of salt-affected habitat, with comparison of Atriplex prostrata and Plantago coronopus [29] or Triglochin buchenaui, Bassia diffusa and Limonium linifolium [30] as examples. Recently, taxonomically related plant species, including halophytes, have been compared in respect to their salinity tolerance, ion accumulation and maintenance of osmotic balance, in order to understand physiological responses crucial for differences in salinity tolerance in genetically allied species. Examples of this type of studies include but are not limited to species of Plantago [31,32], Limonium [33,34], Silene [35] and Suaeda [36]. However, studies comparing salinity responses of different accessions or cultivars within the same species are much less common [37,38,39,40,41].
In the present study, the three C. sepium accessions used as model plants for salinity tolerance and ion accumulation study were selected based on pronounced differences in their habitats (Table 1). The fourth model plant was coastal-specific taxonomically related species C. soldanella. It was initially hypothesized that C. sepium accession from a coastal salt-affected sandy beach (CSe1) will have characteristics similar to these in C. soldanella (CSo), but C. sepium from a dry grassland habitat (CSe3) will be more tolerant to salinity than C. sepium from a mesophytic habitat (CSe2). The first hypothesis was generally confirmed, as the relative changes in biomass accumulation of CSe1 and CSo were similar, but salinity tolerance of both plants was lower than that of the two other model plants (Figure 1B). In addition, CSe1 and CSo had similarities in ion accumulation characteristics (Figure 12C). However, the character of changes in biomass partitioning in response to salinity significantly differed between the two model plants (Figure 2 and Figure 12B). Most importantly, salinity tolerance of the coastal accession of C. sepium and coastal-specific C. soldanella was less pronounced than that of the two inland accessions of C. sepium (Figure 1). The second hypothesis was not confirmed, as CSe3 from a dry habitat was less salinity tolerant than CSe2 from a mesophytic habitat (Figure 1). Thus, the initial assumption for the relationship between salinity tolerance and habitat was not met, although there were significant differences between the tested accessions. In respect to total biomass accumulation, CSe2 from a mesophytic non-saline habitat had the highest absolute and relative salinity tolerance, but C. soldanella (CSo) had the lowest (Figure 1).
The results obtained in the present study are in apparent contradiction with several general assumptions concerning plant salinity tolerance and salinity responses that could be overgeneralizations or simplifications. First, it is often considered that salinity tolerance of a certain species or accession needs to be positively related to the actual salinity level in its habitat [42]. Second, it is widely regarded that any changes in plant growth due to increasing salinity are primarily related to the direct or indirect deleterious effect of substrate salt content or tissue Na+ accumulation on physiological processes, excluding the possibility of physiological regulation [43]. In respect to the first assumption, it can be valid if both glycophyte and halophyte species are considered, but for particular salt-adapted species, plants with higher salt resistance than the existing salinity level may grow in the particular habitat. It is necessary to remember that the salinity of the substrate is an extremely heterogeneous variable, subject to both spatial and temporal fluctuations [44,45]. It seems that C. sepium has a species-wide salinity tolerance; therefore, the accession CSe1 from a salt-affected coastal habitat does not represent an unique halophytic ecotype of C. sepium, as it was initially considered, as the accession CSe2 from a mesophytic inland habitat had higher salinity tolerance (Figure 1). In respect to the second assumption, responses to many single environmental factors have complex nature at physiological level, due to the fact that different signaling systems can be initiated, with various physiological responses having specific does-response relationships, in addition to the direct or indirect deleterious effect on physiological processes [46]. In the present study, growth of C. sepium accession CSe3 was sensitive to low Na+ concentration, but further increase in salinity did not result in growth reduction (Figure 1). Similarly, the accession CSe2 even showed stimulation of leaf formation at high salinity, without further increase of their growth (Figure 3). Moreover, although growth of the accession CSe1 was most drastically inhibited by increasing salinity, biomass allocation to clonal underground structures, rhizomes, was stimulated (Figure 2A), showing a response similar to that in sand dune-adapted plant species as a result of sand accretion [47].
The most striking differences in physiological responses to salinity between accessions of C. sepium were found in respect to biomass partitioning. Being clonal species, C. sepium plants have a very high level of potential morphological plasticity [10]. In addition to long and branched rhizomes, which are present on both C. sepium and C. soldanella, the former species possesses an additional clonal growth system, represented by annual below-ground tubers on a distal part of the plagiotropic above-ground stems (runners), which are produced in autumn and readily penetrate soil [48]. Increased allocation to runners (stems) was evident for C. sepium plants in low nutrient conditions, but biomass allocation to rhizomes did not depend on nutrient availability [10]. In the present study, model plants showed prominent differences in biomass allocation patterns. Plants from coastal accession CSe1 allocated more biomass in rhizomes with increasing soil salinity, reaching more than 60% from the total biomass at the highest salinity (Figure 2A). Mesophytic accession CSe2 had similar features, but the rhizome share of the total biomass reached only 20% (Figure 2B). Surprisingly, the effect of increased allocation to rhizomes by salinity was not consistent in C. soldanella. From an ecological point of view, it is generally believed that clonal plants can escape unfavorable environmental conditions by placing new ramets in spots with more favorable conditions [49]. Biomass allocation to rhizomes could be seen as a manifestation of this escape response, as elongation of rhizomes makes it possible to reach soil areas with lower salinity, and this ability was most pronounced for the C. sepium accession from a salt-affected coastal habitat.
Apart from differences in morphological responses to salinity, Calystegia model plants in the present study also showed differences in ion accumulation, electrolytical activity and osmotic values in plant parts. Organ specificity for accumulation of electrolytically and osmotically active ions was very high in both Calystegium species, with pronounced differences between accessions of C. sepium. Preferential accumulation of Na+ in leaves is another characteristic feature of typical ion-accumulating halophytes. However, usually there is no correlation between a species tolerance to salinity and their Na+ accumulation potential [50]. Only plants from the coastal accession of C. sepium (CSe1) accumulated Na+ preferentially in leaves (Figure 5A), but the accumulation potential for Na+ in leaves vs roots was relatively similar for C. sepium CSe2 (Figure 5B) and C. soldanella (Figure 5D). However, C. sepium CSe3 preferentially accumulated Na+ in roots and stems (Figure 5C), showing typical salt excluder characteristics.
For coastal species growing in moderately saline soils, the Na+ hyperaccumulation threshold range was proposed to be 18–30 g kg−1 [26]. According to this criterion, in the present study, C. sepium accession CSe1 reached the accumulation threshold in leaves at soil Na+ concentration >1 g L−1 (Figure 5A), CSe2 at >2 g Na+ L−1 (Figure 5B), and C. soldanella only at >3 g Na+ L−1 (Figure 5C). However, C. sepium accession CSe3 did not reach the threshold concentration (Figure 5C). In natural conditions of coastal dunes, growing in sandy soil with relatively low Na+ content, C. soldanella plants accumulated 7.1 g kg−1 Na+ in leaves [15]. In the present study, plants of coastal accession of C. sepium (CSe1), growing on seawater-affected saline sandy beach, accumulated 26.3 g kg−1 Na+ in leaves, but C. sepium plants from inland habitats had low levels of Na+ (Table 2). Together with the results from the present experiments in controlled conditions, it shows that leaf Na+ concentration for both Calystegia species is an indicator of substrate salinity.
K+ is necessary for providing a certain ionic strength intensity inside plant tissues for supporting optimum protein interactions [51]; it also contributes to osmotic potential [52]. Due to a pronounced similarity in chemical properties between K+ and Na+, Na+ could contribute to both functions in Na+-accumulating halophytic species [53,54]. However, K+ is retained in a cytoplasm, whereas Na+ is sequestered in vacuole [55]. Differential localization in various leaf tissues of the two ions cannot be excluded: in addition to epidermis, where both ions are accumulated, K+ can be found also in mesophyll cells [56]. As a result of increasing salinity, character of changes in K+ concentration in Calystegia plants was organ-dependent and genotype-specific (Figure 6), and no general trend of changes in K+ can be described. It is evident that, at the individual organ level, each model plant had a specific K+:Na+ concentration ratio, which decreased under increasing salinity, showing tight control of individual ion concentration (Figure 7). As based on a study in natural conditions comparing ion accumulation characteristics within and between coastal species, it was concluded that C. sepium is a tight regulator of electrical conductivity, proportionately adjusting both K+ and Na+ concentration to keep leaf tissue electrolytical activity as constant as possible, irrespective of soil concentration for these ions [26]. However, in controlled conditions, electrical conductivity gradually increased by increasing soil salinity both in stems and leaves of all model plants, but was relatively less affected in rhizomes and, to some extent, in roots (Figure 8). Consequently, the character of ion accumulation in C. sepium, irrespective of salinity level in the native habitat, and C. soldanella was at least partially similar to that typical for ion-accumulating halophytic species, accumulating high concentration of soluble ions in aboveground parts and excluding them from underground parts [54], but this characteristic was fully expressed only for coastal accession CSe1.
Initially, it was proposed that accumulation of organic osmotica in a form of compatible solutes is the main mechanism for osmotic adjustment [52]. Thus, amino acid proline has been suggested as one of the most universal and main osmoticum, especially in response to salinity [57]. However, more recently, the actual role of compatible solutes in maintaining osmotic balance has been seriously questioned, arguing that the bulk osmotic adjustment is provided by inorganic osmotica [58]. However, relative contribution to ionic species vs organic osmolytes in plants has been rarely assessed. Instead, concentration of particular osmotically active metabolite has been measured, and increase in its concentration due to salinity has been suggested as a proof of the role in osmotic adjustment [33,59]. In the present study, an attempt was made to distinguish between ionic and non-ionic osmotica, subtracting from the total osmotic value the part which depended on Na+, K+ and Cl. As a result, the major contribution of these inorganic ions in osmotic pool for all model plants under increasing soil salinity was clearly evident, with contribution of non-ionic solutes being only up to 25% of the total osmotic value. Although, high organ specificity of accumulation of osmotically active ions vs compatible solutes was seen. It has been shown earlier that Na+ and Cl concentration did not increase by NaCl treatment in stolons of clonal plant Hydrocotyle vulgaris, indicating that osmotic balance was maintained by an increase in organic osmolyte concentration [60]. Similarly, for example, in coastal accession of C. sepium (CSe1), Na+ concentration did not increase in roots and rhizomes under increasing soil salinity (Figure 5A), but significant part of osmotic value in these organs were associated with increased value of non-ionic osmotica (Figure 10A). Similar phenomenon was evident for leaves, flowers, rhizomes and stems of CSe3 (Figure 5C and Figure 10C). As it has been experimentally tested that C. soldanella plants accumulate a considerable concentration of proline [15], accumulation of proline in Calystegia species in response to salinity could be one of the reasons for the increase in non-ionic osmotic activity found in the present study. In addition, increase in sucrose concentration is shown to be a characteristic response to salinity, as in Trifolium repens [50].
In general, there was a very tight correlation between osmotic value in tissues and electrical conductivity, indicating that mainly electrolytically active soluble ions were responsible for ensuring osmotic potential. Leaves of CSe3 accumulated the highest level of non-ionic osmotica as a result of NaCl treatment, and this was also reflected by a shifted distribution of relationship between Na+ + K+ concentration and osmotic value, reaching relatively higher osmotic activity at lower ion concentration (Figure 11A). Interestingly, C. sepium accession CSe1 from a salt-affected habitat was the only model plant showing increased water content in roots due to enhanced substrate salinity (Figure 4A), and this coincided with a significant increase in non-ionic osmotic value (Figure 10A).
As a basis for variability in physiological responses to salinity between taxonomically related model plants, as between C. sepium accessions from different habitats, both genetic and epigenetic differences can be considered. From the genetic side, coastal-specific ecotypes of several plant species appearing both in coastal and inland habitats have been described [50,61,62,63]. However, apart from local genetic adaptation, epigenetic control may have played a role in showing different physiological responses between different accessions. The term “ecological stress memory”, implying also epigenetic modifications, has been used to discuss plant responses to climate variability [64,65]; however, there is no evidence on general heritability of epigenetic changes after stress exposure [66,67]. Although, response to herbivores and pathogens are examples of transgenerational epigenetic adaptation [68]. It can be suggested, however, that the species with high degree of clonal propagation in the life history of their populations could be an exception [69]. Therefore, vegetatively propagated C. sepium accessions from different habitats represent an excellent model system for further studies aimed at dissecting control of adaptation mechanisms of clonal plant species to environmental conditions, especially, at the level of epigenetic changes.

5. Conclusions

As based on morphological, biomass partitioning and ion accumulation characteristics, all C. sepium accessions from different habitats represented varied physiotypes, possibly associated with their genetic differences. Salinity tolerance of both C. sepium and C. soldanella was relatively high, but the tolerance of particular accessions did not depend on substrate salinity level in their natural habitats. C. sepium accession from a mesophytic non-saline habitat was only slightly negatively affected by increasing substrate salinity. However, coastal accession of C. sepium and coastal-specific species C. soldanella had some similarities in ion accumulation characteristics. Pattern of accumulation of inorganic and organic osmotica in plants grown in saline soil showed high genotype- and organ-specificity. C. sepium accessions from different habitats can be suggested as models for further studies aiming at dissecting possible genetic, epigenetic and physiological mechanisms of adaptation to heterogeneous environmental conditions.

Author Contributions

Conceptualization, G.I.; methodology, G.I. and A.J.; investigation, A.J.; writing—original draft preparation, G.I.; writing—review and editing, A.J.; visualization, G.I. All authors have read and agreed to the published version of the manuscript.

Funding

This study was supported by the University of Latvia project “Functional diversity of ecosystems and their contribution to ecosystem services II”.

Institutional Review Board Statement

Not applicable.

Informed Consent Statement

Not applicable.

Data Availability Statement

All data reported here is available from the authors upon request.

Acknowledgments

Technical support of Una Andersone-Ozola is gratefully acknowledged.

Conflicts of Interest

The authors declare no conflict of interest. The funders had no role in the design of the study; in the collection, analyses, or interpretation of data; in the writing of the manuscript; or in the decision to publish the results.

References

  1. Rozema, J.; Schat, H. Salt tolerance of halophytes, research questions reviewed in the perspective of saline agriculture. Environ. Exp. Bot. 2013, 92, 83–95. [Google Scholar] [CrossRef]
  2. Shabala, S. Learning from halophytes: Physiological basis and strategies to improve abiotic stress tolerance in crops. Ann. Bot. 2013, 112, 1209–1221. [Google Scholar] [CrossRef]
  3. Flowers, T.J.; Colmer, T.D. Plant salt tolerance: Adaptations in halophytes. Ann. Bot. 2015, 115, 327–331. [Google Scholar] [CrossRef]
  4. Ievinsh, G.; Andersone-Ozola, U.; Landorfa-Svalbe, Z.; Karlsons, A.; Osvalde, A. Wild plants from coastal habitats as a potential resource for soil remediation. In Soil Health; Giri, B., Varma, A., Eds.; Springer Nature: Cham, Switzerland, 2020; pp. 121–144. [Google Scholar]
  5. Parida, A.K.; Jha, B. Salt tolerance mechanisms in mangroves: A review. Trees 2010, 24, 199–217. [Google Scholar] [CrossRef]
  6. Rūsiņa, S. 1230 Hydrophilous tall herb fringe communities of plains and the montane to alpine levels. In European Union Protected Habitats in Latvia; Auniņš, A., Ed.; Interpretation Manual. Riga, Latvian Fund for Nature, Ministry of Environmental Protection and Regional Development: Riga, Latvia, 2013; pp. 186–189. [Google Scholar]
  7. Duvigneaud, J. La végétation nitrophile du bord des eaux (alliance du Calystegion sepium) dans la valée de la Moselle (Allemagne, France, Grand-Duché de Luxembourg). Bull. Soc. Roy. Bot. Belg. 1978, 111, 27–35. [Google Scholar]
  8. Grime, J.P.; Hodgson, J.G.; Hunt, R. Comparative Plant Ecology: A Functional Approach to Common British Species; Unwin Hyman: London, UK, 1988. [Google Scholar]
  9. Hulisz, P.; Piernik, A.; Mantilla-Contreras, J.; Elvisto, T. Main driving factors for seacoast vegetation in the Southern and Eastern Baltic. Wetlands 2016, 36, 909–919. [Google Scholar] [CrossRef]
  10. Klimeš, L.; Klimešová, J. Biomass allocation in a clonal vine: Effects of intraspecific competition and nutrient availability. Folia Geobot. Phytotax. 1994, 29, 237–244. [Google Scholar] [CrossRef]
  11. Tyler, T.; Herbertsson, L.; Olofsson, J.; Olsson, P.A. Ecological indicator and traits values for Swedish vascular plants. Ecol. Indic. 2021, 120, 106923. [Google Scholar] [CrossRef]
  12. Arafeh, R.; Kadereit, J.W. Long-distance seed dispersal, clone longevity and lack of phylogeographical structure in the European distributional range of the coastal Calystegia soldanella (L.) R. Br. (Convolvulaceae). J. Biogeogr. 2006, 33, 1461–1469. [Google Scholar] [CrossRef]
  13. Bae, C.-Y.; Hwang, J.-S.; Bae, J.-J.; Choi, S.-C.; Lim, S.-H.; Choi, D.-G.; Kim, J.-G.; Choo, Y.-S. Physiological responses of Calystegia soldanella under drought stress. J. Ecol. Environ. 2013, 36, 255–265. [Google Scholar] [CrossRef]
  14. Noda, A.; Nomura, N.; Setoguchi, H. Chlorophyll fluorescence in response to salt stress in the coastal plant Calystegia soldanella: A comparison between coastal and freshwater populations. Bull. Nat. Mus. Nat. Sci. Ser. B 2009, 35, 123–129. [Google Scholar]
  15. Spanò, C.; Bruno, M.; Bottega, S. Calystegia soldanella: Dune versus laboratory plants to highlight key adaptive physiological traits. Acta Physiol. Plant. 2013, 35, 1329–11336. [Google Scholar] [CrossRef]
  16. Ishikawa, S.-I.; Oikawa, T.; Furukawa, A. Responses of photosynthesis, leaf conductance and growth to different salinities in three coastal dune plants. Ecol. Res. 1991, 6, 217–226. [Google Scholar] [CrossRef]
  17. Hasegawa, P.M. Sodium (Na+) homeostasis and salt tolerance of plants. Environ. Exp. Bot. 2013, 92, 19–31. [Google Scholar] [CrossRef]
  18. Maathuis, F.J.M. Sodium in plants: Perception, signalling and regulation of sodium fluxes. J. Exp. Bot. 2014, 65, 849–858. [Google Scholar] [CrossRef]
  19. Volkov, V. Salinity tolerance in plants. Quantitative approach to ion transport starting from halophytes and stepping to genetic and protein engineering for manipulating ion fluxes. Front. Plant Sci. 2014, 6, 873. [Google Scholar] [CrossRef]
  20. Tipirdamaz, R.; Gagneul, D.; Duhazé, C.; Aïnouche, A.; Monnier, C.; Özkum, D.; Larher, F. Clustering of halophytes from an inland salt marsh in Turkey according to their ability to accumulate sodium and nitrogenous osmolytes. Environ. Exp. Bot. 2006, 57, 139–153. [Google Scholar] [CrossRef]
  21. Matinzadeh, Z.; Breckle, S.-W.; Mirmaccoumi, M.; Akhani, H. Ionic relationships in some halophytic Iranian Chenopodiaceae and their rhizospheres. Plant Soil 2013, 372, 523–539. [Google Scholar] [CrossRef]
  22. Milić, D.; Luković, J.; Zorić, L.; Vasin, J.; Ninkov, J.; Zeremski, T.; Milić, S. Halophytes relations to soil ionic composition. J. Serb. Chem. Soc. 2013, 78, 1259–1268. [Google Scholar] [CrossRef]
  23. Matinzadeh, Z.; Akhani, H.; Abedi, M.; Palacio, S. The elemental composition of halophytes correlates with key morphological adaptations and taxonomic groups. Plant Physiol. Biochem. 2019, 141, 259–278. [Google Scholar] [CrossRef]
  24. Bendaly, A.; Messedi, D.; Smaoui, A.; Ksouri, R.; Bouchereau, A.; Abdelly, C. Physiological and leaf metabolome changes in the xerohalophyte species Atriplex halimus induced by salinity. Plant Physiol. Biochem. 2016, 103, 208–218. [Google Scholar] [CrossRef]
  25. Ievinsh, G. Coastal plant species as electrolytophytes: Effect of NaCl and light intensity on accumulation characteristics of Atriplex glabriuscula from coastal drift lines. Environ. Exp. Biol. 2020, 18, 95–105. [Google Scholar]
  26. Ievinsh, G.; Ieviņa, S.; Andersone-Ozola, U.; Samsone, I. Leaf sodium, potassium and electrolyte accumulation capacity of plant species from salt-affected coastal habitats of the Baltic Sea: Towards a definition of Na hyperaccumulation. Flora 2021, 274, 151748. [Google Scholar] [CrossRef]
  27. Ko, J.-M.; Park, H.-J.; Min, B.-M.; Cha, H.-C. Effects of various pretreatments on seed germination of Calystegia soldanella (Convolvulaceae), a coastal sand dune plant. J. Plant Biol. 2004, 47, 396–400. [Google Scholar] [CrossRef]
  28. Metsalu, T.; Vilo, J. ClustVis: A web tool for visualizing clustering of multivariate data using Principal Component Analysis and heatmap. Nucleic Acids Res. 2015, 43, W566–W570. [Google Scholar] [CrossRef]
  29. Bueno, M.; Lendinez, M.L.; Aparicio, C.; Cordovilla, M.P. Germination and growth of Atriplex prostrata and Plantago coronopus: Two strategies to survive in saline habitats. Flora 2017, 227, 56–63. [Google Scholar] [CrossRef]
  30. Tabot, P.T.; Adams, J.B. Ecophysiology of salt marsh plants and predicted responses to climate change in South Africa. Ocean Coast. Manag. 2013, 80, 89–99. [Google Scholar] [CrossRef]
  31. Al Hassan, M.; Pacurar, A.; López-Gresa, M.P.; Donat-Torres, M.P.; Llinares, J.V.; Boscaiu, M.; Vicente, O. Effects of salt stress on three ecologically distinct Plantago species. PLoS ONE 2016, 11, e0160236. [Google Scholar]
  32. Ltaelf, H.B.; Sakhraoui, A.; González-Orenga, S.; Faz, A.L.; Boscaiu, M.; Vicente, O.; Rouz, S. Responses to salinity in four Plantago species from Tunisia. Plants 2021, 10, 1392. [Google Scholar]
  33. Al Hassan, M.; Estrelles, E.; Soriano, P.; López-Gresa, M.P.; Bellés, J.M.; Boscaiu, M.; Vicente, O. Unraveling salt tolerance mechanisms in halophytes: A comparative study on four Mediterranean Limonium species with different geographic patterns. Front. Plant Sci. 2017, 8, 1438. [Google Scholar] [CrossRef]
  34. Mi, P.; Yuan, F.; Guo, J.; Han, G.; Wang, B. Salt glans play a pivotal role in the salt resistance of four recretohalophyte Limonium Mill. species. Plant Biol. 2021, 23, 1063–1073. [Google Scholar] [CrossRef] [PubMed]
  35. Kozminska, A.; Al Hassan, M.; Hanus-Fajerska, E.; Naranjo, M.A.; Boscaiu, M.; Vicente, O. Comparative analysis of water deficit and salt tolerance mechanisms in Silene. South Afr. J. Bot. 2017, 117, 193–206. [Google Scholar] [CrossRef]
  36. Ibraheem, F.; Al-Zahrani, A.; Mosa, A. Physiological adaptation of three wild halophytic Suaeda species: Salt tolerance strategies and metal accumulation capacity. Plants 2022, 11, 537. [Google Scholar] [CrossRef] [PubMed]
  37. Köhl, K.I. The effect of NaCl on growth, dry matter allocation and ion uptake in salt marsh and inland populations of Armeria maritima. New Phytol. 1997, 135, 213–225. [Google Scholar] [CrossRef]
  38. Köhl, K.I. NaCl homeostasis as a factor for the survival of the evergreen halophyte Armeria maritima (Mill.) Willd. under salt stress in winter. Plant Cell Environ. 1997, 20, 1253–1263. [Google Scholar] [CrossRef]
  39. Ghoulam, C.; Foursy, A.; Fares, K. Effects of salt stress om growth, imorganic ions and proline accumulation in relation to osmotic adjustment in five sugar beet cultivars. Envrion. Exp. Bot. 2002, 47, 39–50. [Google Scholar] [CrossRef]
  40. Xu, X.; Zhou, Y.; Mi, P.; Wang, B.; Yuan, F. Salt-tolerance screening in Limonium sinuatum varieties with different flower colors. Sci. Rep. 2021, 11, 14562. [Google Scholar] [CrossRef]
  41. Jēkabsone, A.; Andersone-Ozola, U.; Karlsons, A.; Romanovs, M.; Ievinsh, G. Effect of salinity on growth, ion accumulation and mineral nutrition of different accessions of a crop wild relative legume species, Trifolium fragiferum. Plants 2022, 11, 797. [Google Scholar] [CrossRef]
  42. Zörb, C.; Sümer, A.; Sungur, A.; Flowers, T.J.; Özcan, H. Ranking of 11 coastal halophytes from salt marshes in northwest Turkey according their salt tolerance. Turk. J. Bot. 2013, 37, 1125–1133. [Google Scholar] [CrossRef]
  43. Zhao, C.; Zhang, H.; Song, C.; Zhu, J.-K.; Shabala, S. Mechanisms of plant responses and adaptation to soil salinity. Innovation 2020, 1, 100017. [Google Scholar] [CrossRef]
  44. Bazihizina, N.; Barreett-Lennard, E.G.; Colmer, T.D. Plant growth and physiology under heterogeneous salinity. Plant Soil 2012, 354, 1–19. [Google Scholar] [CrossRef]
  45. Valenzuela, F.J.; Reineke, D.; Leventini, D.; Chen, C.C.L.; Barrett-Lennard, E.G.; Colmer, T.D.; Dodd, I.C.; Shabala, S.; Brown, P.; Bazihizina, N. Plant responses to heterogeneous salinity: Agronomic relevance and research priorities. Ann. Bot. 2022, 129, 499–518. [Google Scholar] [CrossRef] [PubMed]
  46. Haak, D.C.; Fukao, T.; Grene, R.; Hua, Z.; Ivanov, R.; Perrella, G.; Li, S. Multilevel regulation of abiotic stress responses in plants. Front. Plant Sci. 2017, 8, 1564. [Google Scholar] [CrossRef] [PubMed]
  47. Gilbert, M.E.; Ripley, B.S. Resolving the differences in plant burial responses. Austral Ecol. 2010, 35, 53–59. [Google Scholar] [CrossRef]
  48. Neubauer, H.F. Die Auslaufertriebe von Calystegia sepium (L.) R. Br. (Convolvulaceae). Angew. Bot. 1988, 62, 221–224. [Google Scholar]
  49. Klimešová, J.; Martínková, J.; Herben, T. Horizontal growth: An overlooked dimension in plant trait space. Perspect. Plant Ecol. Evol. Syst. 2018, 32, 18–21. [Google Scholar] [CrossRef]
  50. White, A.C.; Colmer, T.D.; Cawthray, G.R.; Hanley, M.E. Variable response of three Trifolium repens ecotypes to soil flooding by seawater. Ann. Bot. 2014, 114, 347–355. [Google Scholar] [CrossRef]
  51. Liu, B.; Poolman, B.; Boersma, A.J. Ionic strength sensing in living cells. ACS Chem. Biol. 2017, 12, 2510–2514. [Google Scholar] [CrossRef]
  52. Slama, I.; Abdelly, C.; Bouchereau, A.; Flowers, T.; Savouré, A. Diversity, distribution and roles of osmoprotective compounds accumulated in halophytes under abiotic stress. Ann. Bot. 2015, 115, 433–447. [Google Scholar] [CrossRef]
  53. Belkheiri, O.; Mulas, M. The effects of salt stress on growth, water relations and ion accumulation in two halophyte Atriplex species. Environ. Exp. Bot. 2013, 86, 17–28. [Google Scholar] [CrossRef]
  54. Flowers, T.J.; Munns, R.; Colmer, T.D. Sodium chloride toxicity and the cellular basis of salt tolerance in halophytes. Ann. Bot. 2015, 115, 419–431. [Google Scholar] [CrossRef] [PubMed]
  55. Chaudhary, D.R. Ion accumulation in halophytes. In Halophytes and Climate Change: Adaptive Mechanisms and Potential Uses; Hasanuzzaman, M., Shabala, S., Fujita, M., Eds.; CABI: Wallingford, UK, 2019; pp. 137–151. [Google Scholar]
  56. Pongrac, P.; Vogel-Mikuš, K.; Regvar, M.; Kaligarič, M.; Vavpetič, P.; Kelemen, M.; Grlj, N.; Shelef, O.; Golan-Goldhirsh, A.; Rachmilevitch, S.; et al. On the distribution and evaluation of Na, Mg and Cl in leaves of selected halophytes. Nucl. Instr. Methods Phys. Res. B 2013, 306, 144–149. [Google Scholar]
  57. Kavi Kishor, P.B.; Sangan, S.; Amrutha, R.N.; Sri Laxmi, P.; Naidu, K.R.; Rao, K.R.S.S.; Rao, S.; Reddy, K.J.; Theriappan, P.; Sreenivasulu, N. Regulation of proline biosynthesis, degradation, uptake and transport in higher plants: Implications in plant growth and abiotic stress tolerance. Curr. Sci. 2005, 88, 424–438. [Google Scholar]
  58. Shabala, S.; Shabala, L. Ion transport and osmotic adjustment in plants and bacteria. BiolMol Concepts 2011, 2, 407–419. [Google Scholar]
  59. Murakeözy, É.; Nagy, Z.; Duhazé, C.; Bouchereau, A.; Tuba, Z. Seasonal changes in the levels of compatible solutes in three halophytic species in inland saline vegetation in Hungary. J. Plant Physiol. 2003, 160, 395–401. [Google Scholar] [CrossRef]
  60. Karlsons, A.; Osvalde, A.; Ņečajeva, J.; Ievinsh, G. Changes of nutritional status of coastal plants Hydrocotyle vulgaris and Aster tripolium at elevated soil salinity. Acta Univ. Latv. 2008, 745, 165–177. [Google Scholar]
  61. Ohga, K.; Muroi, M.; Hayakawa, H.; Yokoyama, J.; Ito, K.; Tebayashi, S.-I.; Arakawa, R.; Fukuda, T. Coastal adaptation of Adenophora triphylla var. japonica. Am. J. Plant Sci. 2013, 4, 596–601. [Google Scholar]
  62. Bowsher, A.W.; Kearns, P.J.; Popovic, D.; Lowry, D.B.; Shade, A. Locally adapted Mimulus ecotypes differentially impact rhizosphere bacterial and archaeal communities in an environment-dependent manner. Phytobiomes J. 2020, 4, 53–63. [Google Scholar]
  63. Itoh, M. Phenotypic variation and adaptation in morphology and salt spray tolerance in coastal and inland populations of Setaria viridis in central Japan. Weed Res. 2021, 61, 199–209. [Google Scholar] [CrossRef]
  64. Bruce, T.J.A.; Matthes, M.C.; Napier, J.A.; Pickett, J.A. Stressfull “memories” of plants: Evidence and possible mechanisms. Plant Sci. 2007, 173, 603–608. [Google Scholar] [CrossRef]
  65. Walter, J.; Jentsch, A.; Beierkuhnlein, C.; Kreyling, J. Ecological stress memory and cross stress tolerance in plants in the face of climate extremes. Environ. Exp. Bot. 2013, 94, 3–8. [Google Scholar] [CrossRef]
  66. He, Y.; Li, Z. Epigenetic environmental memories in plants: Establishment, maintenance, and reprogramming. Trends Genet. 2018, 34, 856–866. [Google Scholar] [CrossRef] [PubMed]
  67. Perrone, A.; Martinelli, F. Plant stress biology in epigenomic era. Plant Sci. 2020, 294, 110376. [Google Scholar] [CrossRef] [PubMed]
  68. Holeski, L.M.; Jander, G.; Agrawal, A.A. Transgenerational defense induction and epigenetic inheritance in plants. Trends Ecol. Evol. 2012, 27, 618–626. [Google Scholar] [CrossRef]
  69. Latzel, V.; Rendina González, A.P.; Rosenthal, J. Epigenetic memory as a basis for intelligent behavior in clonal plants. Front. Plant Sci. 2016, 7, 1354. [Google Scholar] [CrossRef] [Green Version]
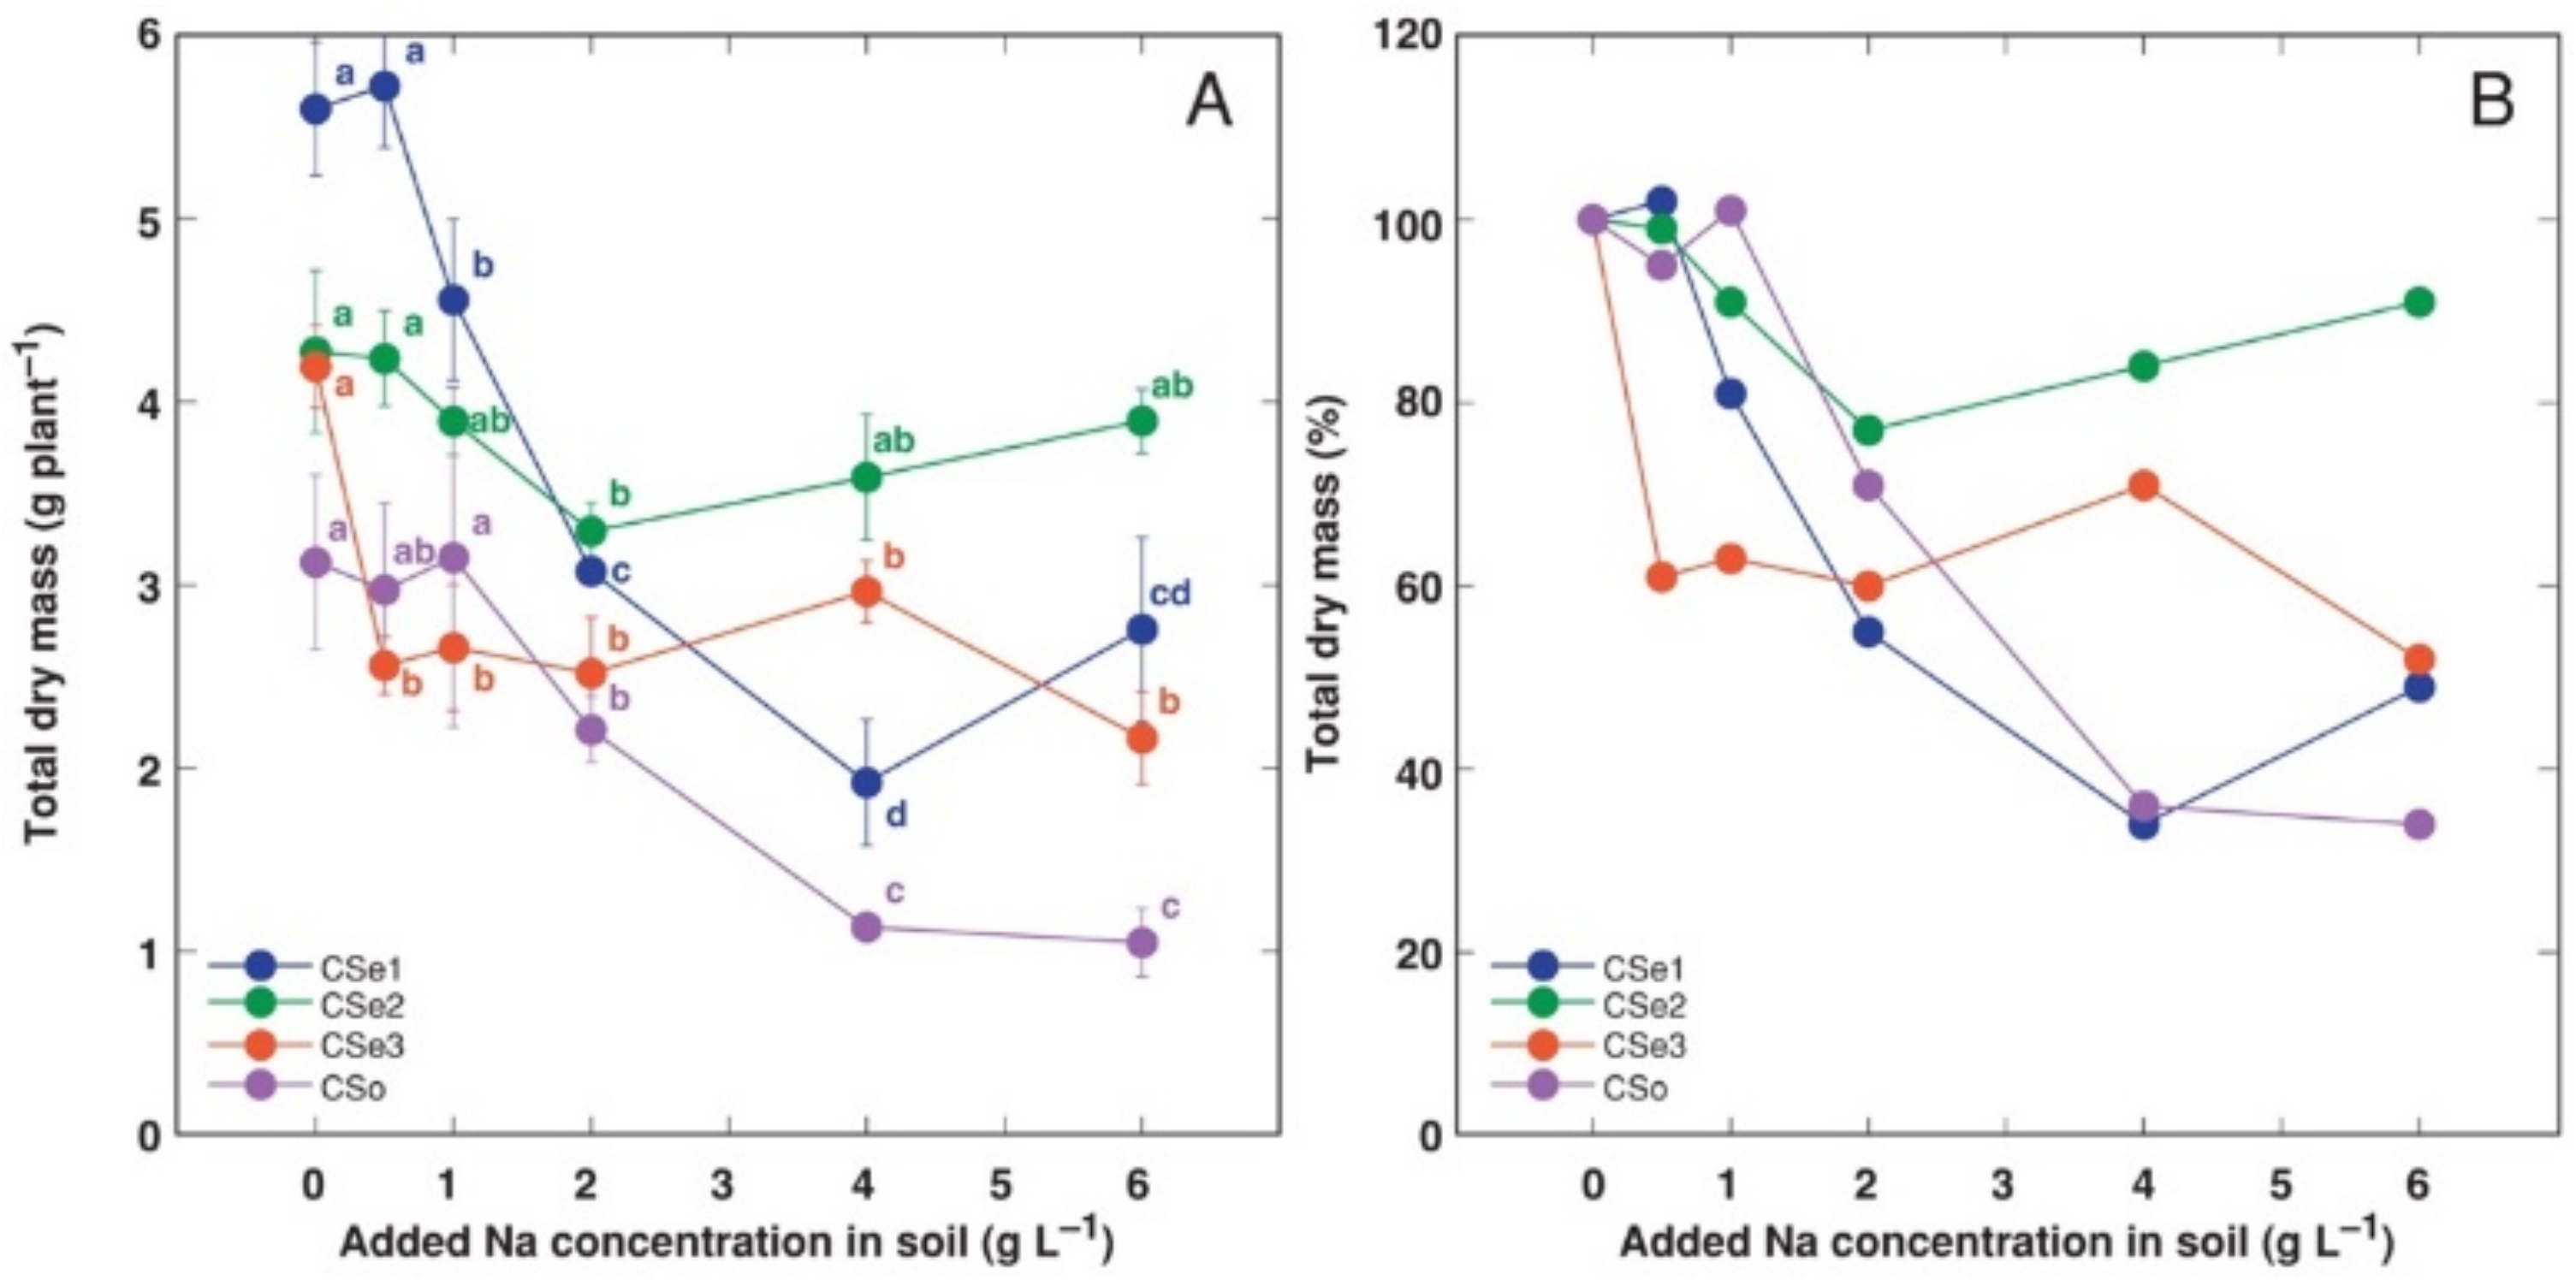
Figure 1. Effect of increasing soil salinity on total dry mass (A) and total dry mass relative to control plants (B) of Calystegia sepium accessions CSe1, CSe2, CSe3 and Calystegia soldanella (CSo). Na+ was added in a form of NaCl. Data are means from five replicates for each concentration ±SE. Different letters of the respective color indicate statistically significant differences (p < 0.05) between treatments for the respective model plant.
Ijpb 13 00032 g001
Figure 2. Relative changes in biomass partitioning in Calystegia sepium plants from accessions CSe1 (A), CSe2 (B), CSe3 (C) and Calystegia soldanella (CSo) (D) plants due to increasing substrate salinity. Na+ was added in a form of NaCl.
Ijpb 13 00032 g002
Figure 3. Effect of increasing soil salinity on the number of stems (A), total stem length (B), and number of leaves (C) of Calystegia sepium accessions CSe1, CSe2, CSe3 and Calystegia soldanella (CSo). Na+ was added in a form of NaCl. Data are means from five replicates for each concentration ±SE. Different letters of the respective color indicate statistically significant differences (p < 0.05) between treatments for the respective model plant.
Ijpb 13 00032 g003
Figure 4. Effect of increasing soil salinity on water content in roots (A) and rhizomes (B) of Calystegia sepium accessions CSe1, CSe2, CSe3 and Calystegia soldanella (CSo). Na+ was added in a form of NaCl. Data are means from five replicates for each concentration ±SE. Different letters of the respective color indicate statistically significant differences (p < 0.05) between treatments for the respective model plant.
Ijpb 13 00032 g004
Figure 5. Changes in Na+ concentration under the effect of increasing soil salinity in different parts of Calystegia sepium accessions CSe1 (A), CSe2 (B), CSe3 (C) and Calystegia soldanella (D). Na+ was added in a form of NaCl. Data are means from three replicates for each concentration ±SE. Asterisks of the respective color indicate statistically significant differences (p < 0.05) from control.
Ijpb 13 00032 g005
Figure 6. Changes in K+ concentration under the effect of increasing soil salinity in different parts of Calystegia sepium accessions CSe1 (A), CSe2 (B), CSe3 (C) and Calystegia soldanella (D). Na+ was added in a form of NaCl. Data are means from three replicates for each concentration ±SE. Asterisks of the respective color indicate statistically significant differences (p < 0.05) from control.
Ijpb 13 00032 g006
Figure 7. Changes in Na+: K+ concentration ratio under the effect of increasing soil salinity in different parts of Calystegia sepium accessions CSe1 (A), CSe2 (B), CSe3 (C) and Calystegia soldanella (D). Na+ was added in a form of NaCl. Data are means from three replicates for each concentration ±SE. Asterisks of the respective color indicate statistically significant differences (p < 0.05) from control.
Ijpb 13 00032 g007
Figure 8. Changes in electrical conductivity under the effect of increasing soil salinity in different parts of Calystegia sepium accessions CSe1 (A), CSe2 (B), CSe3 (C) and Calystegia soldanella (D). Na+ was added in a form of NaCl. Data are means from three replicates for each concentration ±SE. Asterisks of the respective color indicate statistically significant differences (p < 0.05) from control.
Ijpb 13 00032 g008
Figure 9. Changes in total osmotic value under the effect of increasing soil salinity in different parts of Calystegia sepium accessions CSe1 (A), CSe2 (B), CSe3 (C) and Calystegia soldanella (D). Na+ was added in a form of NaCl. Data are means from three replicates for each concentration ±SE. Asterisks of the respective color indicate statistically significant differences (p < 0.05) from control.
Ijpb 13 00032 g009
Figure 10. Changes in non-ionic osmotic value under the effect of increasing soil salinity in different parts of Calystegia sepium accessions CSe1 (A), CSe2 (B), CSe3 (C) and Calystegia soldanella (D). Na+ was added in a form of NaCl. Data are means from three replicates for each concentration ±SE. Asterisks of the respective color indicate statistically significant differences (p < 0.05) from control.
Ijpb 13 00032 g010
Figure 11. Correlation between Na+ + K+ concentration and osmotic value (A), Na+ + K+ concentration and electrical conductivity (B), and electrical conductivity and osmotic values (C) in different parts of Calystegia sepium accessions CSe1, CSe2, CSe3 and Calystegia soldanella (CSo).
Ijpb 13 00032 g011
Figure 12. Principal component analysis on effect of increasing soil salinity on morphological parameters (A), biomass partitioning (B) and ion accumulation (C) in Calystegia sepium accessions CSe1, CSe2, CSe3 and Calystegia soldanella (CSo) plants. Prediction ellipses are such that with probability 0.95, a new observation from the same group will fall inside the ellipse. Unit variance scaling was applied to rows; singular value decomposition with imputation was used to calculate principal components.
Ijpb 13 00032 g012
Table 1. Plant material used in the present study for the establishment of a laboratory culture of Calystegia sepium and Calystegia soldanella.
Species, AccessionCodeHabitatSoil Electrical Conductivity (mS m−1)Establishment of Stock Culture/PropagationCharacteristicsLocality (Coordinates)
Calystegia sepium 1CSe1Coastal, sandy beach with perennial vegetation623 ± 105Rhizome fragments/stem explants with leafWhite flowersMērsrags, Latvia (N 57°21′57″ E 23°7′21″)
Calystegia sepium 2CSe2Inland, mesophytic vegetation on banks of pond86 ± 5Rhizome fragments/stem explants with leafWhite flowersSalaspils, Latvia (N 56°51′32″ E 24°30′38″)
Calystegia sepium 3CSe3Inland, dry grassland vegetation on a steep riverbank83 ± 2Rhizome fragments/stem explants with leafLight pink flowersOgre, Latvia (N 56°48′59″ E 24°36′59″)
Calystegia soldanellaCSoCoastal, sand dunesNASeeds/stem explants with leafNANA
Table 2. Water content, Na+ and K+ concentration and electrical conductivity (EC) in leaf blades of different accessions of Calystegia sepium in natural conditions, expressed either on dry mass or tissue water basis.
ParameterC. sepium 1C. sepium 2C. sepium 3
H2O (g g−1 DM)7.5 ± 0.8 a5.5 ± 0.1 b4.4 ± 0.2 c
Na+ (g kg−1 DM)26.33 ± 1.97 a0.95 ± 0.07 c2.23 ± 0.07 b
K+ (g kg−1 DM)32.8 ± 2.9 b26.6 ± 4.3 c41.0 ± 1.0 a
Na+ (mol L−1)0.156 ± 0.011 a0.008 ± 0.001 c0.022 ± 0.001 b
EC (mS cm−1 kg−1 DM)113 ± 6 a57 ± 5 b60 ± 1 b
K+ (mol L−1)0.115 ± 0.010 b0.123 ± 0.018 b0.237 ± 0.006 a
EC (mS cm−1 L−1)15.4 ± 0.9 a10.2 ± 0.7 b13.5 ± 0.1 a
K:Na (mol)0.8 ± 0.1 c17.2 ± 3.6 a10.8 ± 0.3 b
Data are means from three samples ± SE, at least five leaves each from different shoots. Different letters for a particular parameter indicate statistically significant differences between the accessions (p < 0.05). DM, dry mass.
Publisher’s Note: MDPI stays neutral with regard to jurisdictional claims in published maps and institutional affiliations.