Communication

Comparative Analysis of Cyanotoxins in Fishponds in Nigeria and South Africa

1
Department of Geography & Environment, University of Venda, Thohoyandou 0950, South Africa
2
Department of Earth Sciences, University of Venda, Thohoyandou 0950, South Africa
3
Department of Water & Sanitation, University of Limpopo, Polokwane 0727, South Africa
*
Author to whom correspondence should be addressed.
Microbiol. Res. 2024, 15(2), 447-456; https://doi.org/10.3390/microbiolres15020030
Submission received: 31 January 2024 / Revised: 18 March 2024 / Accepted: 21 March 2024 / Published: 24 March 2024
(This article belongs to the Special Issue Bioactive Secondary Metabolites of Microbial Symbionts)

Abstract

:
Over the decades, the aquaculture sector has witnessed substantial growth, contributing significantly to the nation’s economy. However, the menace of CyanoHABs threatens the sustainability of fish farming. Considering the possible hazards linked to cyanotoxins in food and water, a comparative study design between commercial fish in Nigeria and South Africa was employed to investigate cyanotoxins in the water from fishponds. Six commercial fishponds in Calabar Municipality—Nigeria and Duthuni—South Africa with varying climatic zones were selected. Water samples from the ponds were collected at intervals during different seasons (summer, winter, dry, and wet seasons) to capture climate-induced variation. Liquid chromatography–mass spectrometry (LCMS) in combination with the metabolites database was used for the identification of toxic cyanometabolites in water samples. The molecular networking approach, coupled with the Global Natural Products Social Molecular Networking (GNPS) database and CANOPUS annotation, enabled the putative identification of cyanometabolites. The resulting molecular network unveiled discernible clusters representing related molecule families, aiding in the identification of both known cyanotoxins and unfamiliar analogues. Furthermore, the molecular network revealed that water samples from different fishponds shared specific metabolites, including ethanesulfonic acid, pheophorbide A, cholic acid, phenylalanine, amyl amine, phosphocholine (PC), and sulfonic acid, despite variations in location, local climatic factors, and sampling sites. The fishponds in Nigeria showed the presence of multiple cyanotoxin classes in the dry, wet, and summer seasons in the water. Aflatoxin was identified in all sampling sites in Nigeria (N1, N2, and N3). The Duthuni, South Africa, sampling sites (P1, P2, and P3) exhibited the presence of microginins and microcystins. All the fishponds displayed a widespread occurrence of anabaenopeptins, aplysiatoxins, aflatoxin, microcolins, and marabmids during the selected summer. In conclusion, the untargeted metabolome analysis, guided by GNPS, proved highly effective in identifying both toxic and non-toxic metabolites in fishponds.

1. Introduction

Cyanobacteria, commonly known as blue-green algae, are single-celled or filamentous organisms capable of oxygenic photosynthesis [1,2,3]. They thrive in various environments, such as soils, freshwater bodies, thermal springs, and marine ecosystems [4]. Like plants, cyanobacteria utilize sunlight to convert atmospheric carbon dioxide into organic compounds, potentially serving as a primary food source for other organisms [5,6]. Under favorable environmental conditions characterized by high temperatures, abundant sunlight, and nutrient-rich water, cyanobacteria experience increased growth, leading to the formation of cyanobacterial blooms [7]. This phenomenon may result in the release of toxins, particularly cyanotoxins, into the water [8,9].
Aquaculture ecosystems are particularly susceptible to cyanobacterial blooms, as cyanobacteria play a vital role in the food web as phytoplankton biomass [10,11,12]. Moreover, cyanobacteria easily adapt to environmental conditions commonly encountered in fishponds, such as high temperatures, reduced light conditions, nitrogen depletion in the upper layer, a high degree of eutrophication, and a decline in the number of large phytoplanktivorous filter-feeders [10,13,14].
The toxins released by cyanobacteria during blooms may result in cooperative toxic effects on both animals and humans [15,16]. Fish that encounter these cyanotoxins may experience non-lethal consequences, such as the accumulation of toxins in the liver, leading to liver damage, hepatocyte degradation, and potentially fatal liver hemorrhaging [17].
Exposure to cyanotoxins in animals and humans has been associated with various health issues, including carcinogenicity, gastroenteritis, skin reactions, liver damage, vomiting, headaches, allergic reactions, and even mortality [18,19,20,21]. People can easily encounter these toxins by consuming freshwater, fish, seafood, crops, vegetables, or food supplements containing cyanotoxins, or by ingesting them during recreational activities [18,22,23].
The adverse effects of these toxins originating from fishponds have repercussions on a wider array of products that could face comparable contamination [11,24]. The increasing concern underscores the necessity to scrutinize the possible presence of cyanotoxins in aquaculture fishponds. So far, there is no comparative study that investigates seasonal and site-specific variations in cyanometabolite profiles in fishponds in Nigeria and South Africa. Chia et al. [11,25,26] only focused on microcystin in fishponds in Zaria, Nigeria. Therefore, this study aims to provide a comprehensive analysis of cyanometabolite profiles, including cyanotoxins present in selected fish farming ponds in Nigeria and South Africa. These data can be used as baseline reference values for monitoring metabolites in fish farming ponds and as a prerequisite to ensuring safe products for human and animal well-being.

2. Methodology

2.1. Study Area and Sampling Sites

The study was conducted in commercial aquaculture fishponds situated in the Vhembe District, Limpopo Province, South Africa, and the Calabar Municipality, Cross River State, Nigeria. In Nigeria, sampling locations included Offiong Etim Avenue (4°59′58.92″ N and 8°19′03.97″ E), Essien Town (4°59′15.49″ N and 8°19′40.21″ E), and State Housing (4°59′6.50″ N and 8°20′13.29″ E). The aquaculture fishponds in the Vhembe District were positioned in Duthuni (22°57′56.98″ S and 30°23′43.96″ E). This study utilized a total of six fishponds situated in the Vhembe District (comprising three fishponds) and Calabar (comprising three fishponds). The fishpond types incorporated in this investigation consisted of concrete, tarpaulin, and earthen ponds, as illustrated in Figure 1. It should be noted that the selection of Nigeria and South Africa for the comparative study on cyanotoxins in fishponds was based on several key variables, including environmental diversity, geographical location, and climatic conditions.

2.2. Water Sampling

Water samples were seasonally collected from the fishponds in triplicates during the South African winter and summer and the Nigerian dry and wet seasons, respectively. Approved consent was obtained from the owners of the fishponds in Nigeria and South Africa before sampling.

2.3. Cyanotoxin Extraction in Water Samples

The extraction procedure was modified from Prasannan et al. [27]. Ten milliliters (10 mL) of each collected water sample was transferred into the 50 mL tube. This was followed by sonication for 30 min, and the water samples were freeze-dried. The freeze-dried sample residue was reconstituted in 10 mL of methanol (90% methanol). The mixture was further sonicated for 30 min before transferring 1 mL of the mixture to the microfuge for 10 min at 3000 rpm. This mixture was filtered immediately before being transferred to a 10 mL opaque bottle. The final mixture was placed on the shaker for 12 h at room temperature. The mixture was transferred to glass vials for LCMS analysis using the syringe filter.

2.4. LCMS Analyses

The analysis of cyanometabolites in non-targeted analytes was performed using an LCMS-9030 qTOF (Shimadzu Corporation, Kyoto, Japan) liquid chromatography-quadrupole time-of-flight tandem mass spectrometer. Chromatographic separation employed a Shim-pack Velox C18 column (100 mm × 2.1 mm, 2.7 µm particle size) with an injection volume of 3 µL. A binary mobile phase gradient consisting of solvent A (0.1% formic acid in Milli-Q water, HPLC grade, Merck Darmstadt, Germany) and solvent B (methanol, UHPLC grade, Romil SpS, Cambridge, UK) with 0.1% formic acid was utilized, maintaining a flow rate of 0.3 mL/min over a 20 min gradient. The separation conditions included maintaining 10% B for 3 min, transitioning from 10% to 95% B over 3–20 min, holding 40% B for 7 min, reaching 95% B from 10 to 15 min, returning to initial conditions between 18–20 min, followed by a 3 min column equilibration time. Mass spectra were recorded in positive-ion mode for all samples using the qTOF high-definition mass spectrometer. The MS parameters were as follows: interface voltage of 4.0 kV, interface temperature of 375 °C, nebulization and dry gas flow at 3 L/min, heat block temperature of 400 °C, DL temperature of 280 °C, detector voltage of 1.8 kV, and flight tube temperature of 42 °C. The chromatographic effluents were subjected to further analysis utilizing the qTOF high-definition mass spectrometer, recording mass spectra in positive-ion mode.

2.5. Data Analyses

High-resolution MS/MS spectra data generated from the mass spectrometry was converted to an mzML file before being processed using the Global Natural Product Social Molecular Networking (GNPS) Library database. Putatively identified (LEVEL 3 identification) metabolites generated from the GNPS Library match and CANOPUS-generated annotation [28,29,30,31] were used to produce a molecular network. The molecular network was visualized using Cytoscape 3.10.0. Cyanotoxins’ retention time and intensity were assessed graphically.

3. Results and Discussion

3.1. Molecular Network

The molecular network highlights known metabolites, structural identity, shared clusters, nodes, and edges, matching metabolites (metabolites within the public database), and non-matching metabolites (metabolites not found within the database) [32,33,34]. (Various analytes were grouped into molecular clusters based on the similarity of their fragmentation patterns [35]. This networking aided in identifying both known cyanotoxins and unfamiliar analogues, visually illustrating structural connections. The molecular network showed that water samples from Nigeria (N1, N2, and N3) and South Africa (P1, P2, and P3) shared specific metabolites despite differences in location, local climatic factors, and sampling sites. The molecular networking led to the putative identification of multiple cyanotoxins—aeruginosins, anabaenopeptins, aflatoxin, aplysiatoxins, microcystin, microcolins, and marabmids—during winter, summer, dry, and wet seasons (Figure 2) in water samples. Untargeted metabolome analysis was highly effective for identifying toxic and non-toxic metabolites in the fishponds.

3.2. Cyanobacterial Toxins and Other Bioactive Metabolites

The water samples from the fishpond sampling sites in Nigeria and South Africa shared similar secondary metabolites. including eicosapentaenoic acid (EPA), pentanoic acid, carboxylic acid, octadecanamide, ethanesulfonic acid, and tryptophan, as presented in Figure 3. The polar lipid identified in the water samples was dominated by six main classes: glycolipids, phosphosphingolipids, phospholipids, phosphatidylglycerol (PG), and phosphatidylethanolamine (PE), distributed across fishponds. Cyanobacteria are intrinsically linked to the presence of specific lipid classes such as glycolipids, phosphosphingolipids, and phospholipids, including phosphatidylglycerol (PG) and phosphatidylethanolamine (PE) in surface water [36,37]. These polar lipids constitute the building blocks of cyanobacterial membranes, characterized by molecular structures surrounded by glycerol backbones and ester-linked fatty acids [38,39].
This association elucidates the prevalence of glycerol-based compounds in both water samples. Aflatoxin was detected across all sampling sites in Nigeria (N1, N2, and N3). Microcystins were found in Duthuni (P1, P2, and P3). Aflatoxin, anabaenopeptins, aplysiatoxins, microcolins, and marabmids were widespread in all fishponds. The cyanometabolites in both sampling locations align with the observations in Tri, Var, and Ver lakes [40]. These observations suggest that the increased proliferation of cyanobacteria could be considered an explicative factor in the production of noxious toxins in fishponds.
The cyanotoxins noted in this study are like the recently reported toxins by Zespata et al. [41]. The study detected anabaenopeptins, aeruginosamide, anabaenopeptins, saxitoxin, cylindrospermopsin, and microcystins in the cyanobacterial bloom-dominated Lake of the Woods (low), spanning across Canada and the USA. Similarly, anabaenopeptins, cyanopeptolins, microginins, and cyanobactins were also reported in commercial fishponds in the Czech Republic [42]. Parallel research in the cyanobacterial-rich lakes (Fon, Tri, Var, and Ver) also confirmed the presence of multiple toxins such as microcystins, cyanopeptolins and anabaenopeptins, microginins, and aeruginosins [40]. Zastepa et al. [41] suggested that this pattern is commonly associated with these toxins and cyanobacterial blooms in surface water.

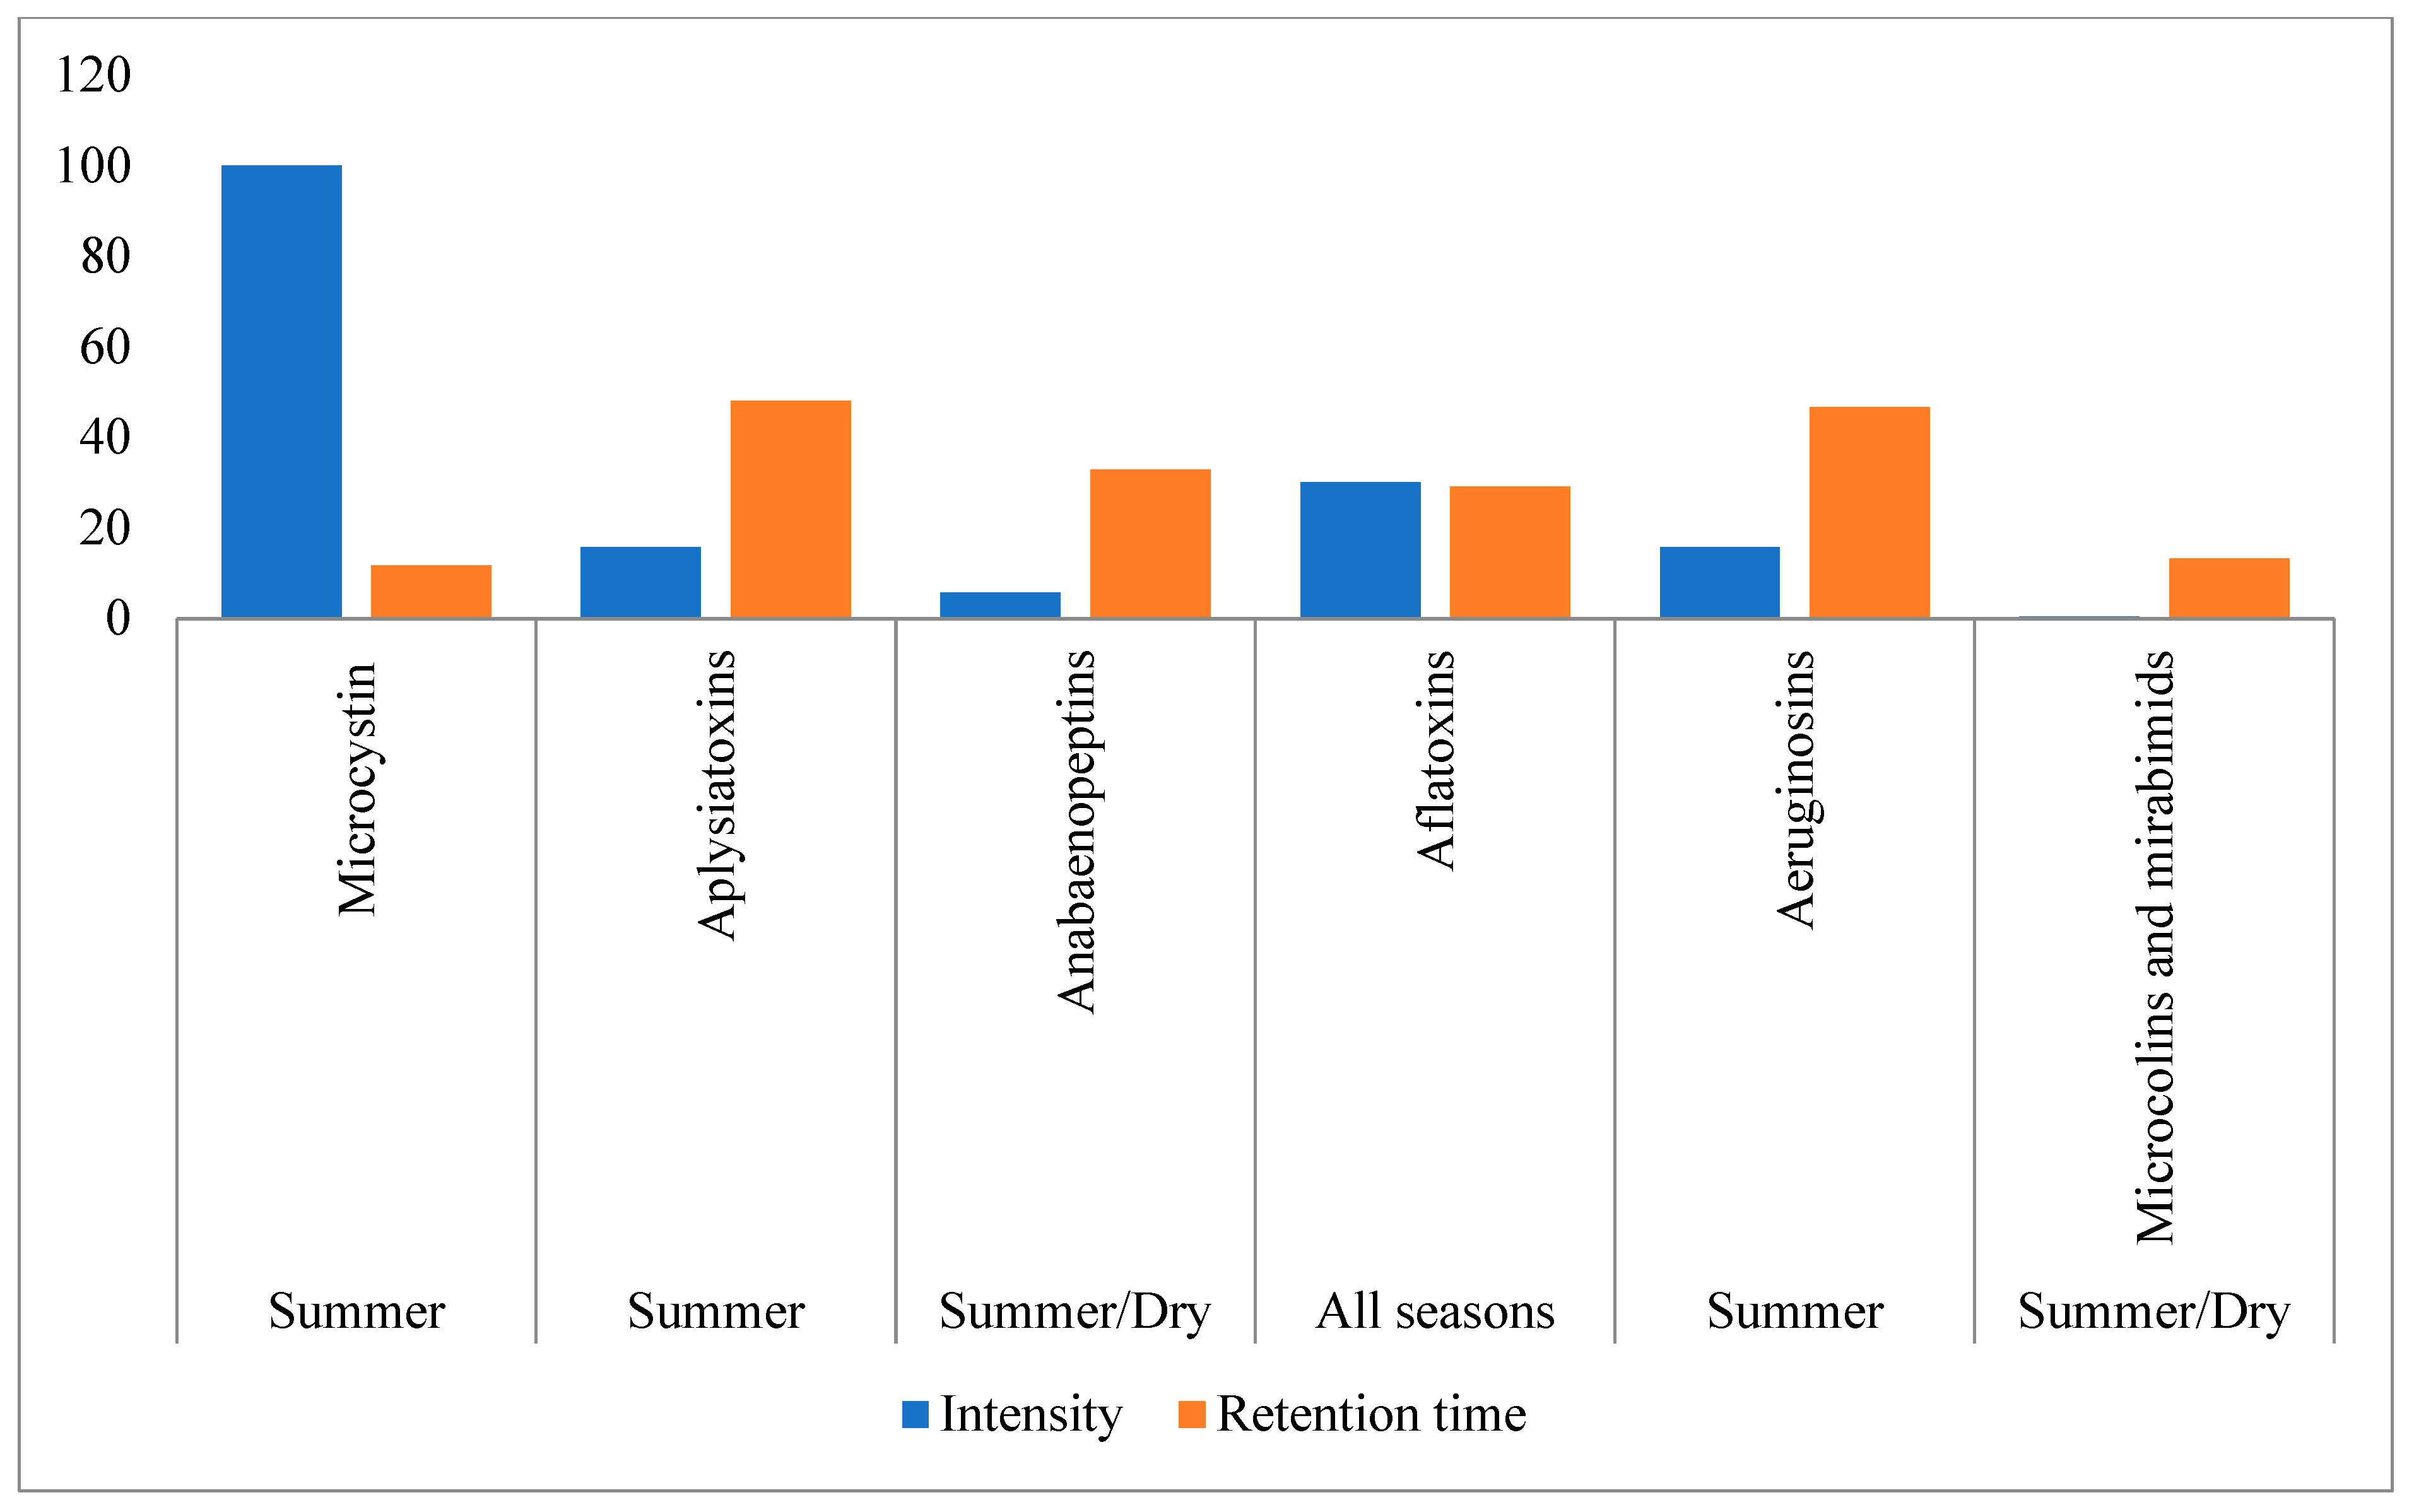
3.3. Seasonal and Regional Dynamics of Cyanotoxins in Fishponds

Principal component analysis of aeruginosins, anabaenopeptins, aflatoxin, aplysiatoxins, microcystin, microcolins, and marabmids based on peak intensity and retention time between different sampling seasons showed variations between each cyanometabolite. The maximum intensity observed is 100% from microcystin, and the minimum is 0.06 from microcolins and mirabimids. Aflatoxins displayed a higher retention time of 49.86 min, while the retention time of microcolins and mirabimids was 11.60 min. The graph displayed in Figure 4 indicates that microcystin microcolins and mirabimids varied the most in intensity in the summer season, while aflatoxins varied the most in the dry season. The greatest similarities in terms of retention and intensity were observed in anabaenopeptins, aplysiatoxins, and aeruginosins. Aflatoxins were observed throughout the seasons, with slight variations in intensity and retention time. Retention time accounted for 28.65% of the variation among cyanotoxins in South Africa. The variation in the peak intensity and retention of each cyanotoxin was significantly influenced by environmental factors at each sampling site.
Cyanobacterial blooms were evident across all fishponds in Nigeria throughout both wet and dry seasons. These seasons were characterized by a prevalence of cyanobacterial peptides, such as anabaenopeptins, aflatoxins, microcolins, and mirabimids, in the fishponds. Specifically, aflatoxin was found in fishponds during the wet season. In Duthuni, South Africa, the summer season witnessed a higher prevalence of various cyanotoxin classes, including aeruginosins, anabaenopeptins, aplysiatoxins, aflatoxin, microginins, microcolins, and marabmids, notably detected in the fishponds’ water samples in Figure 5. The simultaneous presence of cyanotoxin in water during the dry and summer seasons may be linked to the abundance of toxic cells specific to microcystins, micrognins, anabaenopeptins, aflatoxins, microcolins, and mirabimids in the water [43] and the environmental conditions within fishponds. Favorable environmental factors might facilitate the growth of cyanobacteria, leading to the release of cyanotoxins into the water [44,45]. The presence of aflatoxins indicates the persistent occurrence of toxins in water across different seasons [4,46].
Local environmental conditions play a pivotal role in shaping cyanobacterial proliferation within fishponds. In this study, site-specific environmental conditions influenced the production of noxious compounds, which corresponds to Marie and Gallet [40] and Burford et al. [47] findings. Environmental conditions, especially during the warm season, increase daytime temperature, nutrients (from fish feces, feed particles, and anthropogenic activities), and solar radiation, favoring excessive proliferation of cyanobacteria and toxin production [48]. This explains the increased presence of multi-toxins during the dry season in Nigerian fishponds and in the summer in Duthuni (South Africa) fishponds. A similar observation was reported during the dry season in fishponds in Zaria, Nigeria, by Chia et al. [11], and Kust et al. [42] reported the highest diversity of aeruginosins, microginins, cyanopeptolins, and microginins during the summer in South Bohemia, Czech Republic.

4. Implication

Humans are often exposed to cyanotoxins orally through the consumption of freshwater, fish, seafood, crops, vegetables, and cyanotoxin-containing food supplements [18]. These toxins can be harmful to aquatic organisms, animals, water quality, and humans that are exposed to them directly or indirectly. Many cases of lethal poisoning and mortalities in animals and humans attributed to cyanotoxin exposure have been documented. The most severe incident of cyanotoxin-related mortality in humans occurred in Brazil in 2002, when 56 out of 130 patients undergoing hemodialysis succumbed after being treated with water that had been inadvertently contaminated with microcystins [18,49].
Additional incidents occurred in the United States. Specifically, 61 individuals across three states were impacted by waterborne disease outbreaks linked to biotoxins from algal blooms [19]. The health consequences encompass dermatologic, gastrointestinal, respiratory, and neurologic signs and symptoms [19]. Due to the potential risks associated with cyanotoxins present in food and water, the EPA updated its regulations to incorporate monitoring for ten cyanotoxins in Public Water Systems, including microcystins and cylindrospermopsin. The World Health Organization [50] established provisional guidelines of 1.0 microgram per liter (µg/L) for microcystin-LR in drinking water.
Despite the known risks, cyanotoxin production in fishponds has increased over time in these regions due to climate change and increased eutrophication. The contaminated water from the fishponds in these regions is mostly discharged into the environment and used for irrigation. Food products and portable water reservoirs are being exposed to these toxins from contaminated fishpond water. Chia et al. [11] established that irrigated vegetables in northern Nigeria have very high levels of microcystins. Mutoti et al. [51] documented increased levels of microcystins in maize meal in Thohoyandou, South Africa. The concern does not solely revolve around fish in fishponds but extends to a broader range of products that might be similarly contaminated. The implications of this contamination are significant and underscore the need for a deeper comprehension of the potential health risks associated with cyanotoxin exposure from contaminated fishponds.

5. Conclusions

This comparative study sheds light on the varied profiles of cyanotoxins in fishponds between Nigeria and South Africa. The non-targeted analysis of secondary metabolites generated by cyanobacteria species proved to be a successful method for detecting cyanotoxins in commercial fishponds. Given the rapidly increasing cyanobacteria proliferation in fishponds, continued research and vigilant monitoring are imperative to comprehensively address the multifaceted challenges posed by cyanotoxins in fishpond environments. Understanding the diversity, distribution, and seasonal dynamics of cyanotoxins is pivotal for devising effective strategies to mitigate their impact on aquatic ecosystems and safeguard human health.

Author Contributions

Conceptualization, O.J.B. and J.R.G.; methodology, O.J.B.; software, O.J.B.; validation, O.J.B. and J.R.G.; formal analysis, O.J.B.; investigation, O.J.B.; resources, O.J.B. and J.R.G.; data curation, O.J.B.; writing—original draft preparation, O.J.B.; writing—review and editing, J.R.G. and A.A.; visualization, O.J.B.; supervision, J.R.G., M.M., A.A. and F.D.; project administration, O.J.B.; funding acquisition, O.J.B. and J.R.G. All authors have read and agreed to the published version of the manuscript.

Funding

This research was funded by National Research Foundation grant number [SFH150715126382], Association of African Universities and Research Publication Committee (RPC) [SES/18/ERM/08/] of the University of Venda.

Institutional Review Board Statement

The animal study protocol was approved by the Institutional Ethics Committee of University of Venda [SES/18/ERM/08/ 0905] approved on 18 May 2018).

Informed Consent Statement

Informed consent was obtained from all subjects involved in the study.

Data Availability Statement

The raw data supporting the conclusions of this article will be made available by the authors on request.

Acknowledgments

The authors would like to acknowledge the University of Venda, Department of Food Science and Technology and the LCMS Research group for access to the SHIMADZU LCMS-9030 qTOF.

Conflicts of Interest

The authors declare no conflict of interest.

References

  1. Ciebiada, M.; Kubiak, K.; Daroch, M. Modifying the Cyanobacterial Metabolism as a Key to Efficient Biopolymer Production in Photosynthetic Microorganisms. Int. J. Mol. Sci. 2020, 21, 7204. [Google Scholar] [CrossRef]
  2. Huertas, M.J.; Mallén-Ponce, M.J. Dark side of cyanobacteria: Searching for strategies to control blooms. Microb. Biotechnol. 2022, 15, 1321–1323. [Google Scholar] [CrossRef]
  3. Zuo, Z. Emission of cyanobacterial volatile organic compounds and their roles in blooms. Front. Microbiol. 2023, 14, 1097712. [Google Scholar] [CrossRef]
  4. Bhardwaj, A.; Singh, P.; Gupta, N.; Bhattacharjee, S.; Srivastava, A.; Parida, A.; Mishra, A.K. Cyanobacteria: A Key Player in Nutrient Cycling. In Cyanobacteria; Academic Press: Cambridge, MA, USA, 2024; pp. 579–596. [Google Scholar] [CrossRef]
  5. Arora, K.; Kumar, P.; Bose, D.; Li, X.; Kulshrestha, S. Potential applications of algae in biochemical and bioenergy sector. 3 Biotech 2021, 11, 296. [Google Scholar] [CrossRef]
  6. Keller, R.J.; Porter, W.; Goli, K.; Rosenthal, R.; Butler, N.; Jones, J.A. Biologically-Based and Physiochemical Life Support and In Situ Resource Utilization for Exploration of the Solar System—Reviewing the Current State and Defining Future Development Needs. Life 2021, 11, 844. [Google Scholar] [CrossRef]
  7. Wang, Z.; Akbar, S.; Sun, Y.; Gu, L.; Zhang, L.; Lyu, K.; Huang, Y.; Yang, Z. Cyanobacterial dominance and succession: Factors, mechanisms, predictions, and managements. J. Environ. Manag. 2021, 297, 113281. [Google Scholar] [CrossRef]
  8. He, X.; Liu, Y.-L.; Conklin, A.; Westrick, J.; Weavers, L.K.; Dionysiou, D.D.; Lenhart, J.J.; Mouser, P.J.; Szlag, D.; Walker, H.W. Toxic cyanobacteria and drinking water: Impacts, detection, and treatment. Harmful Algae 2016, 54, 174–193. [Google Scholar] [CrossRef] [PubMed]
  9. Metcalf, J.S.; Codd, G.A. Co-Occurrence of Cyanobacteria and Cyanotoxins with Other Environmental Health Hazards: Impacts and Implications. Toxins 2020, 12, 629. [Google Scholar] [CrossRef]
  10. Drobac, D.; Tokodi, N.; Lujić, J.; Marinović, Z.; Subakov-Simić, G.; Dulić, T.; Važić, T.; Nybom, S.; Meriluoto, J.; Codd, G.A.; et al. Cyanobacteria and cyanotoxins in fishponds and their effects on fish tissue. Harmful Algae 2016, 55, 66–76. [Google Scholar] [CrossRef]
  11. Chia, M.A.; Abdulwahab, R.; Ameh, I.; Balogun, J.K.; Auta, J. Farmed tilapia as an exposure route to microcystins in Zaria-Nigeria: A seasonal investigation. Environ. Pollut. 2021, 271, 116366. [Google Scholar] [CrossRef]
  12. de Almeida, C.; Passos, L.S.; de Freitas, P.N.N.; de Souza, A.O.; Pinto, E. Impacts of cyanobacterial metabolites on fish: Socioeconomic and environmental considerations. Rev. Aquac. 2024. [Google Scholar] [CrossRef]
  13. de Lima Pinheiro, M.M.; Santos, B.L.T.; Filho, J.V.D.; Pedroti, V.P.; Cavali, J.; dos Santos, R.B.; Nishiyama, A.C.O.C.; Guedes, E.A.C.; de Vargas Schons, S. First monitoring of cyanobacteria and cyanotoxins in freshwater from fish farms in Rondônia state, Brazil. Heliyon 2023, 9, e18518. [Google Scholar] [CrossRef]
  14. Vrba, J.; Šorf, M.; Nedoma, J.; Benedová, Z.; Kröpfelová, L.; Šulcová, J.; Tesařová, B.; Musil, M.; Pechar, L.; Potužák, J.; et al. Top-down and bottom-up control of plankton structure and dynamics in hypertrophic fishponds. Hydrobiologia 2023, 851, 1095–1111. [Google Scholar] [CrossRef]
  15. Jones, M.R.; Pinto, E.; Torres, M.A.; Dörr, F.; Mazur-Marzec, H.; Szubert, K.; Tartaglione, L.; Dell’Aversano, C.; Miles, C.O.; Beach, D.G.; et al. CyanoMetDB, a comprehensive public database of secondary metabolites from cyanobacteria. Water Res. 2021, 196, 117017. [Google Scholar] [CrossRef]
  16. Pei, Y.; Xu, R.; Hilt, S.; Chang, X. Effects of Cyanobacterial Secondary Metabolites on Phytoplankton Community Succession. In Co-Evolution of Secondary Metabolites; Springer: Berlin/Heidelberg, Germany, 2020; pp. 323–344. [Google Scholar] [CrossRef]
  17. Passos, L.S.; Jacinavicius, F.R.; Geraldes, V.; de Freitas, P.N.N.; Da Silva, G.H.; de Almeida, C.; do Carmo Alves, A.P.; Orlando, T.M.; da Silva Cerozi, B.; Martinez, D.S.T.; et al. Ecotoxicological assessment of guanitoxin-producing cyanobacteria in Danio rerio and Daphnia similis. Chemosphere 2023, 332, 138846. [Google Scholar] [CrossRef]
  18. Buratti, F.M.; Manganelli, M.; Vichi, S.; Stefanelli, M.; Scardala, S.; Testai, E.; Funari, E. Cyanotoxins: Producing organisms, occurrence, toxicity, mechanism of action and human health toxicological risk evaluation. Arch. Toxicol. 2017, 91, 1049–1130. [Google Scholar] [CrossRef]
  19. Hilborn, E.D.; Roberts, V.A.; Backer, L.; DeConno, E.; Egan, J.S.; Hyde, J.B.; Nicholas, D.C.; Wiegert, E.J.; Billing, L.M.; DiOrio, M.; et al. Algal bloom-associated disease outbreaks among users of freshwater lakes-United States, 2009–2010. Centers for Disease Control and Prevention (CDC). Morb. Mortal. Wkly Rep. 2014, 10, 11–15. [Google Scholar]
  20. Lad, A.; Breidenbach, J.D.; Su, R.C.; Murray, J.; Kuang, R.; Mascarenhas, A.; Najjar, J.; Patel, S.; Hegde, P.; Youssef, M.; et al. As We Drink and Breathe: Adverse Health Effects of Microcystins and Other Harmful Algal Bloom Toxins in the Liver, Gut, Lungs and Beyond. Life 2022, 12, 418. [Google Scholar] [CrossRef]
  21. Niture, S.; Gadi, S.; Qi, Q.; Rios-Colon, L.; Khatiwada, S.; Vandana; Fernando, R.A.; Levine, K.E.; Kumar, D. Cyanotoxins Increase Cytotoxicity and Promote Nonalcoholic Fatty Liver Disease Progression by Enhancing Cell Steatosis. Toxins 2023, 15, 411. [Google Scholar] [CrossRef]
  22. Funari, E.; Testai, E. Human Health Risk Assessment Related to Cyanotoxins Exposure. Crit. Rev. Toxicol. 2008, 38, 97–125. [Google Scholar] [CrossRef]
  23. Lee, J.; Lee, S.; Jiang, X. Cyanobacterial Toxins in Freshwater and Food: Important Sources of Exposure to Humans. Annu. Rev. Food Sci. Technol. 2017, 8, 281–304. [Google Scholar] [CrossRef]
  24. Gärtner, G.; Stoyneva-Gärtner, M.; Uzunov, B. Algal Toxic Compounds and Their Aeroterrestrial, Airborne and other Extremophilic Producers with Attention to Soil and Plant Contamination: A Review. Toxins 2021, 13, 322. [Google Scholar] [CrossRef]
  25. Chia, M.A.; Kwaghe, M.J. Microcystins contamination of surface water supply sources in Zaria-Nigeria. Environ. Monit. Assess. 2015, 187, 606. [Google Scholar] [CrossRef]
  26. Chia, A.M.; Oniye, S.J.; Ladan, Z.; Lado, Z.; Pila, A.E.; Inekwe, V.U.; Mmerole, J.U. A Survey for the Presence of Microcystins in Aquaculture ponds in Zaria, Northern-Nigeria: Possible Public Health Implication. Afr. J. Biotechnol. 2009, 8, 22. [Google Scholar] [CrossRef]
  27. Prasannan, C.B.; Jaiswal, D.; Davis, R.; Wangikar, P.P. An improved method for extraction of polar and charged metabolites from cyanobacteria. PLoS ONE 2018, 13, e0204273. [Google Scholar] [CrossRef] [PubMed]
  28. Dührkop, K.; Shen, H.; Meusel, M.; Rousu, J.; Böcker, S. Searching molecular structure databases with tandem mass spectra using CSI:FingerID. Proc. Natl. Acad. Sci. USA 2015, 112, 12580–12585. [Google Scholar] [CrossRef] [PubMed]
  29. Dührkop, K.; Fleischauer, M.; Ludwig, M.; Aksenov, A.A.; Melnik, A.V.; Meusel, M.; Dorrestein, P.C.; Rousu, J.; Böcker, S. SIRIUS 4: A rapid tool for turning tandem mass spectra into metabolite structure information. Nat. Methods 2019, 16, 299–302. [Google Scholar] [CrossRef]
  30. Dührkop, K.; Nothias, L.-F.; Fleischauer, M.; Reher, R.; Ludwig, M.; Hoffmann, M.A.; Petras, D.; Gerwick, W.H.; Rousu, J.; Dorrestein, P.C.; et al. Systematic classification of unknown metabolites using high-resolution fragmentation mass spectra. Nat. Biotechnol. 2021, 39, 462–471. [Google Scholar] [CrossRef] [PubMed]
  31. Kim, H.W.; Wang, M.; Leber, C.A.; Nothias, L.F.; Reher, R.; Kang, K.B.; van der Hooft, J.J.J.; Dorrestein, P.C.; Gerwick, W.H.; Cottrell, G.W. NPClassifier: A Deep Neural Network-Based Structural Classification Tool for Natural Products. J. Nat. Prod. 2021, 84, 2795–2807. [Google Scholar] [CrossRef] [PubMed]
  32. Damiani, T.; Heuckeroth, S.; Smirnov, A.; Mokshyna, O.; Brungs, C.; Korf, A.; Smith, J.; Stincone, P.; Dreolin, N.; Nothias, L.-F.; et al. Mass spectrometry Data Processing in MZmine 3: Feature detection and annotation. ChemRxiv 2023. [Google Scholar] [CrossRef]
  33. Libis, V.; Antonovsky, N.; Zhang, M.; Shang, Z.; Montiel, D.; Maniko, J.; Ternei, M.A.; Calle, P.Y.; Lemetre, C.; Owen, J.G.; et al. Uncovering the biosynthetic potential of rare metagenomic DNA using co-occurrence network analysis of targeted sequences. Nat. Commun. 2019, 10, 3848. [Google Scholar] [CrossRef]
  34. Narduzzi, L.; Stanstrup, J.; Mattivi, F. Comparing Wild American Grapes with Vitis vinifera: A Metabolomics Study of Grape Composition. J. Agric. Food Chem. 2015, 63, 6823–6834. [Google Scholar] [CrossRef]
  35. Ibrahim, M.; Chen, D.; Ibrahim, S.S.; Danjaji, H.A.; Tian, R. Microalgal bloom and cyanotoxin proliferation in freshwaters: Cycle and dynamics, impacts and remediation strategies. IRESPUB J. Environ. Mater. Sci. 2022, 2, 1–10. [Google Scholar]
  36. Ali, O.; Szabó, A. Review of Eukaryote Cellular Membrane Lipid Composition, with Special Attention to the Fatty Acids. Int. J. Mol. Sci. 2023, 24, 15693. [Google Scholar] [CrossRef]
  37. Wardhan, R.; Mudgal, P. Introduction to Biomembranes. In Textbook of Membrane Biology; Springer: Singapore; pp. 1–28. [CrossRef]
  38. Gull, M.; Pasek, M.A. The Role of Glycerol and Its Derivatives in the Biochemistry of Living Organisms, and Their Prebiotic Origin and Significance in the Evolution of Life. Catalysts 2021, 11, 86. [Google Scholar] [CrossRef]
  39. Summers, K.M.; Krempa, H.M.; Garrett, J.D. Central Midwest Water Science Center—Harmful Algal Blooms team. US Geol. Surv. Fact Sheet 2022, 3011, 4. [Google Scholar] [CrossRef]
  40. Marie, B.; Gallet, A. Fish metabolome from sub-urban lakes of the Paris area (France) and potential influence of noxious metabolites produced by cyanobacteria. Chemosphere 2022, 296, 134035. [Google Scholar] [CrossRef] [PubMed]
  41. Zastepa, A.; Westrick, J.A.; Liang, A.; Birbeck, J.A.; Furr, E.; Watson, L.C.; Stockdill, J.L.; Ramakrishna, B.S.; Crevecoeur, S. Broad screening of toxic and bioactive metabolites in cyanobacterial and harmful algal blooms in Lake of the Woods (Canada and USA), 2016–2019. J. Great Lakes Res. 2023, 49, 134–146. [Google Scholar] [CrossRef]
  42. Kust, A.; Řeháková, K.; Vrba, J.; Maicher, V.; Mareš, J.; Hrouzek, P.; Chiriac, M.-C.; Benedová, Z.; Tesařová, B.; Saurav, K. Insight into Unprecedented Diversity of Cyanopeptides in Eutrophic Ponds Using an MS/MS Networking Approach. Toxins 2020, 12, 561. [Google Scholar] [CrossRef] [PubMed]
  43. Wood, J.D.; Franklin, R.B.; Garman, G.; McIninch, S.; Porter, A.J.; Bukaveckas, P.A. Exposure to the Cyanotoxin Microcystin Arising from Interspecific Differences in Feeding Habits among Fish and Shellfish in the James River Estuary, Virginia. Environ. Sci. Technol. 2014, 48, 5194–5202. [Google Scholar] [CrossRef] [PubMed]
  44. Chorus, I.; Fastner, J.; Welker, M. Cyanobacteria and Cyanotoxins in a Changing Environment: Concepts, Controversies, Challenges. Water 2021, 13, 2463. [Google Scholar] [CrossRef]
  45. Massey, I.Y.; Al Osman, M.; Yang, F. An overview on cyanobacterial blooms and toxins production: Their occurrence and influencing factors. Toxin Rev. 2022, 41, 326–346. [Google Scholar] [CrossRef]
  46. Filatova, D.; Picardo, M.; Núñez, O.; Farré, M. Analysis, levels and seasonal variation of cyanotoxins in freshwater ecosystems. Trends Environ. Anal. Chem. 2020, 26, e00091. [Google Scholar] [CrossRef]
  47. Burford, M.; Carey, C.; Hamilton, D.; Huisman, J.; Paerl, H.; Wood, S.; Wulff, A. Perspective: Advancing the research agenda for improving understanding of cyanobacteria in a future of global change. Harmful Algae 2020, 91, 101601. [Google Scholar] [CrossRef]
  48. Mohamed, Z.; Ahmed, Z.; Bakr, A.; Hashem, M.; Alamri, S. Detection of free and bound microcystins in tilapia fish from Egyptian fishpond farms and its related public health risk assessment. J. Consum. Prot. Food Saf. 2020, 15, 37–47. [Google Scholar] [CrossRef]
  49. Azevedo, S.M.F.O.; Carmichael, W.W.; Jochimsen, E.M.; Rinehart, K.L.; Lau, S.; Shaw, G.R.; Eaglesham, G.K. Human intoxication by microcystins during renal dialysis treatment in Caruaru—Brazil. Toxicology 2002, 181–182, 441–446. [Google Scholar] [CrossRef] [PubMed]
  50. World Health Organization. Cyanobacterial Toxins: Microcystins; World Health Organization: Geneve, Switzerland, 2020. [Google Scholar]
  51. Mutoti, M.; Gumbo, J.; Jideani, A.I.O. Occurrence of cyanobacteria in water used for food production: A review. Phys. Chem. Earth Parts A/B/C 2022, 125, 103101. [Google Scholar] [CrossRef]
Figure 1. (A) Earthen aquaculture fishpond in Duthuni, South Africa, and (B) tarpaulin fishpond in Calabar Municipality, Nigeria.
Microbiolres 15 00030 g001
Figure 2. The molecular network of cyanotoxins extracted from fishpond water samples.
Microbiolres 15 00030 g002
Figure 3. Representative compounds for non-toxic bioactive metabolites present in fishpond water.
Microbiolres 15 00030 g003
Figure 4. Cyanotoxins’ spectra intensity and retention time.
Microbiolres 15 00030 g004
Figure 5. Cyanotoxins retention time and intensity in different seasons.
Microbiolres 15 00030 g005
Disclaimer/Publisher’s Note: The statements, opinions and data contained in all publications are solely those of the individual author(s) and contributor(s) and not of MDPI and/or the editor(s). MDPI and/or the editor(s) disclaim responsibility for any injury to people or property resulting from any ideas, methods, instructions or products referred to in the content.

