Article

Tannin-Tolerant Saccharomyces cerevisiae Isolated from Traditional Fermented Tea (Miang) of Northern Thailand and Its Feasible Applications

by
Kridsada Unban
1,
Natchanon Muangkajang
2,
Pratthana Kodchasee
2,
Apinun Kanpiengjai
3,
Kalidas Shetty
4 and
Chartchai Khanongnuch
2,5,6,*
1
Division of Food Science and Technology, School of Agro-Industry, Faculty of Agro-Industry, Chiang Mai University, Muang, Chiang Mai 50100, Thailand
2
Division of Biotechnology, School of Agro-Industry, Faculty of Agro-Industry, Chiang Mai University, Muang, Chiang Mai 50100, Thailand
3
Division of Biochemistry and Biochemical Innovation, Department of Chemistry, Faculty of Science, Chiang Mai University, Muang, Chiang Mai 50200, Thailand
4
Global Institute of Food Security and International Agriculture (GIFSIA), Department of Plant Sciences, North Dakota State University, Fargo, ND 58108, USA
5
Research Center for Multidisciplinary Approaches to Miang, Science and Technology Research Institute, Chiang Mai University, Muang, Chiang Mai 50100, Thailand
6
Research Center of Microbial Diversity and Sustainable Utilization, Chiang Mai University, Muang, Chiang Mai 50100, Thailand
*
Author to whom correspondence should be addressed.
Microbiol. Res. 2023, 14(4), 1969-1983; https://doi.org/10.3390/microbiolres14040133
Submission received: 3 October 2023 / Revised: 12 November 2023 / Accepted: 17 November 2023 / Published: 20 November 2023

Abstract

:
This study evaluated the ability of a yeast strain isolated from traditional fermented tea leaves (Camellia sinensis var. assamica), Miang from northern Thailand, to grow and produce ethanol in the presence of tannin. Among 43 Miang samples, 25 yeast isolates displayed gas-forming character in the presence of 1% (w/v) tannin, but only ML1-1 and ML1-2 isolates were confirmed as ethanol-producing yeast capable of tannin tolerance. These isolates were further identified to be Pichia occidentalis and Saccharomyces cerevisiae, respectively, based on D1/D2 domain sequence analysis. S. cerevisiae ML1-2 was selected for further studies and exhibited growth at 20–35 °C, pH 4–7, and tolerance to high sugar concentrations of up to 350 g/L. Supplementation of 1% (w/v) tannin had no effect on sugar utilization and ethanol production, while delayed sugar consumption and ethanol production were observed in the reference strain S. cerevisiae TISTR 5088. However, 5 and 10% (w/v) tannin showed inhibitory effects on the growth and ethanol production of the selected yeast isolates. During the fermentation under high tannin conditions derived by mixing Java plum fruit with ground seed, S. cerevisiae ML1-2 showed significant advantages in growth and enhanced the content of ethanol, polyphenols, tannin, and flavonoids compared to S. cerevisiae TISTR 5088. This indicated its potential for high-tannin substrate-based bioconversion for the production of either fuel ethanol or functional alcoholic beverages.

1. Introduction

It is known that there are various microorganisms capable of naturally converting glucose or other simple sugars to ethanol. Among ethanol-producing microbes, Saccharomyces cerevisiae is the most well-known yeast that can rapidly ferment glucose into ethanol under anaerobic conditions [1,2]. A variety of S. cerevisiae strains play an important role in providing the qualitative properties of alcoholic beverages leading to acceptance following positive sensory evaluation of the final product [3]. In practical applications, the ethanol-producing yeasts that are capable of withstanding stress conditions such as high osmotic pressure or the environment containing growth inhibitors, are required for the high efficacy of ethanol fermentation from special substrates [4]. There are recent reports on strategies for the development of yeast strains capable of resistance to stress conditions, which provide the foundation to screen for qualities towards high-efficacy fermentation; for instance, developing yeast to be able to withstand high temperatures and still be able to produce ethanol in the required amount [5]. Other reports include yeast strain development through genetic engineering to obtain yeast that can ferment rice straw as a strategy to reduce the amount of agricultural waste [6]. The selection of yeast capable of tannin tolerance for reducing the astringent taste in the wine production process was also reported [7,8]. Moreover, several studies have focused on identifying and characterizing yeast strains that exhibit enhanced tolerance to tannins, which are often isolated from environments rich in tannin-containing materials, such as Miang (fermented tea) and tannin-rich persimmon fruits [9,10].
Miang, an ethnic fermented tea from leaves of Camellia sinensis var. assamica, is mostly produced in the mountainous regions of northern provinces of Thailand (ancient eastern and western Lanna Kingdom) such as Chiang Mai, Chiang Rai, Nan, Phrae, Mae Hong Son, and Lampang [11]. It can be produced either from young or mature tea leaves depending on the type of fermentation process, which includes the filamentous fungi growth-based process and the non-filamentous fungi growth-based process. Tea leaves contain significant amounts of tannins, which are considered inhibitors of certain microorganisms [9,12]. Moreover, the tannin contents of Miang were significantly increased around two times following fermentation compared to their starting tea leaf materials [13]. Therefore, the living microorganisms in Miang are interesting because of their survival ability in tannin-rich substances, while also containing essential fermentation potential. Previously, research studies demonstrated the involvement of lactic acid bacteria and yeast in Miang fermentation [14,15]. In 2016, Candida ethanolica was reported as the dominant species found in Miang, and all yeast isolates including Debaryomyces hansenii, Cyberlindnera rhodanensis, and Spoidiobolus ruineniae, showed their tannin-tolerant capability when cultivated on yeast malt agar containing 50 g/L tannin, and some of these yeasts were positive for tannase activity [9]. However, the potential of yeast strains isolated from Miang for ethanol fermentation under high tannin conditions must be investigated further. Therefore, this study aims to evaluate the ability of a yeast strain isolated from Miang to grow and produce ethanol in the presence of high tannin to advance strategies for application in ethanol fermentation or developing alcoholic beverages from high tannin substrates.

2. Materials and Methods

2.1. Isolation and Screening of Tannin-Tolerant Yeast Capable of Ethanol Production

Miang samples of 10 g each were purchased from local markets of five northern Thailand provinces including Chiang Rai, Chiang Mai, Lampang, Phrae, and Nan, and then were mixed with 90 mL of sterile 0.85% (w/v) NaCl solution. Subsequently, the contents were homogenized using a Masticator homogenizer blender (Barcelona, Spain) for 5 min. Then, 2 mL of homogenate solution was transferred into 10 mL of yeast peptone dextrose (YPD) broth containing 10 g/L of yeast extract, 20 g/L of peptone, and 20 g/L of glucose and incubated at 30 °C for 24 h. Then, 1 mL of gas formation sample was transferred into diluent for serial dilution preparation, and 0.1 mL of each dilution was plated on YPD agar supplemented with 100 mg/L chloramphenicol and incubated at 30 °C for 48 h. The yeast colonies with morphologically different visual qualities were isolated and purified by streak plating on YPD agar before being stored in 25% (v/v) glycerol and kept at 80 °C. A single colony of isolated yeast was cultured in YPD broth containing 1% (w/v) tannin and incubated at 30 °C for 48 h. The sample was taken at 0, 24, and 48 h for analysis of sugar consumption and ethanol production.

2.2. Molecular Identification

Molecular identification of yeast isolate was performed by nucleotide sequencing of the D1/D2 region of the 26S rRNA gene as described by Kanpiengjai et al., 2016 [9]. Briefly, genomic DNA was extracted by using a Wizard Genomic DNA purification kit (Promega Corp., Madison, WI, USA) according to the manufacturer’s instructions. The 26S rDNA (D1/D2) region amplification was performed according to Kurtzman and Robnett, 1997 [16] methods through polymerase chain reaction (PCR) using two universal primer pairs NL1 (5′-GCATATCAATAAGCGGAGGAAAAG-3′) and NL4 (5′-GGTCCGTGTTTCAAGACGG-3′). The PCR products were purified and sequenced by a sequencing service provider (1st BASE Pte Ltd., Singapore). Sequence data alignment and phylogenetic tree construction were performed using the BioEdit program (Isis Pharmaceuticals, Carlsbad, CA, USA) and MEGA6 software [17], respectively. The identified sequences were deposited in GenBank under the accession numbers OR284308 and OR284309.

2.3. Effect of Carbon Sources on Ethanol Production

The seed inoculum was prepared by inoculating a loop of isolated yeast in 20 mL of YPD broth and incubating at 30 °C under agitation at 150 rpm for 24 h. Then, the yeast cells were washed with 0.85% (w/v) NaCl, centrifuged, and diluted until an optical density of 1.0 at 600 nm (approximately 7 logCFU/mL) was reached. Subsequently, 10% (v/v) of seed inoculum was transferred to the sterilized 100 mL of growth medium consisting of 10 g/L yeast extract, 20 g/L peptone, and glucose, lactose, or sucrose as carbon sources at 20 g/L as a final concentration (initial pH 7.0) in a 250 mL laboratory bottle. The bottles were incubated at 30 °C under an anaerobic condition for 72 h. Samples were collected every 24 h for viable cell count determination by plating on YPD agar. After incubating at 30 °C for 24 h, viable cell count was determined and expressed as log value of colony-forming units per milliliter (logCFU/mL). The ethanol and sugar concentrations were also analyzed.

2.4. Effect of pH and Temperature on Ethanol Production

To investigate the optimal pH and temperature for ethanol production, YPD broth containing 20 g/L glucose as a carbon source was prepared with the initial pH of 4, 5, 6, 7, and 8, prior to autoclaving. Then, seed inoculum of 10% (v/v) was transferred to all treatments and incubated at 30 °C under anaerobic conditions for 72 h. For the study on the effect of temperature on ethanol production, 10% (v/v) of seed inoculum was transferred into YPD broth containing 20 g/L of glucose as a carbon source (pH 7.0) and incubated at various temperatures (25, 30, 35, 37, and 40 °C) in anaerobic conditions. The samples were collected every 24 h for 72 h. Yeast growth was measured through a plate counting technique on the YPD agar medium. The ethanol and glucose were measured via HPLC.

2.5. Effect of Tannin and Sugar Concentrations on Ethanol Production

The selected yeast strain was investigated for its ability to produce ethanol under various concentrations of tannin and sugar at an incubation temperature of 30 °C. YPD broths containing the carbon source, glucose, at the concentration of 20 g/L, were supplemented with tannin at the concentrations of 1, 5, and 10% (w/v), and the pH value of all treatments was adjusted to 7.0 with 10 M NaOH prior to autoclaving. To study the effect of sugar concentrations on ethanol production, 10% (v/v) of selected yeast strains seed inoculum was transferred to a 250 mL laboratory bottle containing 200 mL YPD broth, with the varied glucose concentrations ranging from 20, 50, 150, 250, and 350 g/L. Then, 10% (v/v) of seed inoculum was transferred into sterilized media. The samples were collected every 24 h for 120 h for measuring viable cell growth, glucose, and ethanol concentration.

2.6. Ethanol Fermentation by Selected Tannin-Tolerant Yeast

Seed inoculums of the selected tannin-tolerant yeast and S. cerevisiae TISTR 5088 (ethanol-producing strain) were prepared by cultivating the yeast strains in 20 mL of YPD broth at 30 °C for 24 h on a 150 rpm rotary shaker. The yeast cells were harvested by centrifugation at 6000× g for 5 min at 4 °C, washed twice, and resuspended in 0.85% (w/v) NaCl. YPD broth containing the carbon source, glucose, at 350 g/L, was supplemented with tannin at the concentrations of 1, 5, and 10% (w/v) and prepared with pH adjustment to 7.0 using 10 N NaOH in a 500 mL laboratory bottle with a final volume of 300 mL, prior to sterilization. The fermentation was carried out with 10% (v/v) seed inoculum (approximately 6.5 logCFU/mL) and incubated at 30 °C. The samples were taken every 24 h for 12 days to determine the viable cell counts, glucose, and ethanol concentration.

2.7. Java Plum Fruit Wine Fermentation

The ripened fruits of the Java plum, Syzygium cumini (Linn.), were obtained from a local market in Chiang Mai, Thailand. The Java plum fruits were de-stemmed, cleaned, and washed in water. The Java plum pulp was separated manually from the seeds. Java plum pulps, with seed and without seed, were mixed with sterilized water in a ratio of 2:1 and crushed using a sterilized grinder. After grinding, musts were mixed with sucrose to achieve the initial sugar content of 350 g/L. A total volume of 300 mL of the mixture was transferred to a 500 mL laboratory bottle and sterilized at 121 °C for 15 min. Fermentation was carried out with and without ground seeds. The comparison of the fermentation process was initiated by adding a 10% (v/v) seed inoculum consisting of S. cerevisiae ML1-2 (a selected tannin-tolerant yeast strain) or S. cerevisiae TISTR 5088 (an ethanol-producing yeast strain) and incubated at 30 °C for 12 days. Throughout the fermentation period, samples were periodically collected and subjected to various analyses, including measurement of ethanol concentration, total sugar content, viable cell counts, pH level, total polyphenols, total tannins, total flavonoid, and DPPH radical scavenging activity.

2.8. Analytical Methods

2.8.1. Ethanol and Glucose Analysis

Ethanol and glucose were analyzed by high-performance liquid chromatography (HPLC) according to Kodchasee et al., 2021 [15], with slight modifications. Briefly, a sample was centrifuged at 10,000× g for 10 min at 4 °C, then the aliquot was filtered through 0.45 μm nylon membranes (Whatman Inc., Clifton, NJ, USA), and injected into the HPLC (Agilent 1000 series, Agilent Technologies Inc., Palo Alto, CA, USA) equipped with Aminex HPX-87H Column (300 × 7.8 mm, Bio-Rad, Hercules, CA, USA). A mobile phase of 5 mM H2SO4 with a flow rate of 0.75 mL/min was run, equipped with a refractive index (RI) detector at 40 °C temperature control.

2.8.2. Total Sugar Determination

The determination of total sugar was performed using the phenol–sulfuric acid method [18]. In summary, 0.25 mL of the sample was mixed with 0.25 mL of a 5% (w/v) phenol solution. Subsequently, 1.25 mL of sulfuric acid was added to the mixture and thoroughly mixed. The reaction was allowed to proceed at room temperature (25 °C) for 30 min, and then the absorbance was measured at 490 nm. Glucose was used as the standard.

2.8.3. Total Polyphenol, Total Tannin, and Total Flavonoid Contents

The total polyphenol (TP), total tannin (TT), and total flavonoid contents (TF) were determined using the following methods described by Abdullahi et al., 2021 [13]. TP was determined using the Folin–Ciocalteu method, with some modifications. In brief, 250 μL of the sample was diluted with 1625 μL of DI water. Then, 125 μL of Folin–Ciocalteu reagent (2 M) was added to the mixture and vortexed using a Vortex-Genie 2 (Scientific Industries, Bohemia, NY, USA). Subsequently, 250 μL of sodium carbonate solution (10%, w/v) was added to the mixture, followed by a vortexing step. The sample solution was adjusted to a final volume of 2.5 mL by adding 250 μL of DI water. DI water was used as the blank, while gallic acid (GA) served as the standard. The absorbance of all samples was measured at 750 nm, and the results of total polyphenols were expressed as milligrams of gallic acid equivalent per milliliter of the sample (mg GAE/mL).
TT was measured using a modified version of the Folin–Ciocalteu method, with the utilization of polyvinylpolypyrrolidone (PVPP) to separate tannins from other phenols. Briefly, 1 mL of sample was combined with 1 mL of 10% (w/v) PVPP, followed by vortexing. The mixture was then incubated at 4 °C for 15 min. Subsequently, the reaction mixture was centrifuged at 3000× g for 10 min, and the resulting supernatant was collected. The remaining TP content of the PVPP-precipitated supernatant was measured using the Folin–Ciocalteu reagent, and the TT was calculated using the formula TT = TP × PVPP precipitated supernatant. The absorbance of all samples was measured at 750 nm. The results were expressed as milligrams of tannic acid equivalent per milliliter of the sample (mg TAE/mL).
TF was determined following a modified version of the aluminum chloride method. In brief, 250 μL of the sample was mixed with 50 μL of aluminum nitrate 10% (w/v) and 50 μL of potassium acetate (1 M). The mixture was then adjusted to a total volume of 2 mL by adding 1650 μL of 80% (v/v) methanol. The mixture was vortexed and allowed to stand for 40 min. The absorbance of all samples was measured at 415 nm. A solution of 80% (v/v) methanol solution was used as the control blank, while quercetin (QE) was employed as the standard flavonoid. The results were expressed as micrograms of quercetin equivalent per milliliter of the sample (μg QE/mL).

2.8.4. 1,1-Diphenyl-2-picrylhydrazyl (DPPH) Radical Scavenging Activity

The 1,1-diphenyl-2-picrylhydrazyl radical scavenging activity of all samples was determined based on the method described by Sánchez-Moreno et al., 1998 [19], with certain modifications. A DPPH solution at a concentration of 0.15 mM was prepared using 80% methanol. Then, 400 μL of the DPPH solution was mixed with 100 μL of different concentrations of each sample. The sample mixture was incubated in the dark for 30 min and the absorbance values were measured at 517 nm. The IC50 (μg/mL) values were calculated for all samples using a plot of inhibition against extract concentrations, following the provided equation:
Inhibition (%) = (Acontrol − Asample/Acontrol) × 100
where Acontrol represents the absorbance of the mixture excluding the sample and Asample is the absorbance of the DPPH solution containing the sample.

2.9. Statistical Analysis

All experiments were performed in triplicate and the data of each variable were analyzed using a completely randomized design. The normality of distribution was checked with the Shapiro–Wilk test. An analysis of variance (ANOVA) was carried out in data with normal distribution and the differences between mean values were performed using Duncan’s multiple range test at a significant level of p < 0.05. Meanwhile, in data without normal distribution, a Kruskal–Wallis analysis was performed and the groups were compared through Dunn’s test with Bonferroni correction. All analyses were performed using SPSS Statistics software version 17.0 (SPSS Inc., Chicago, IL, USA).

3. Results and Discussion

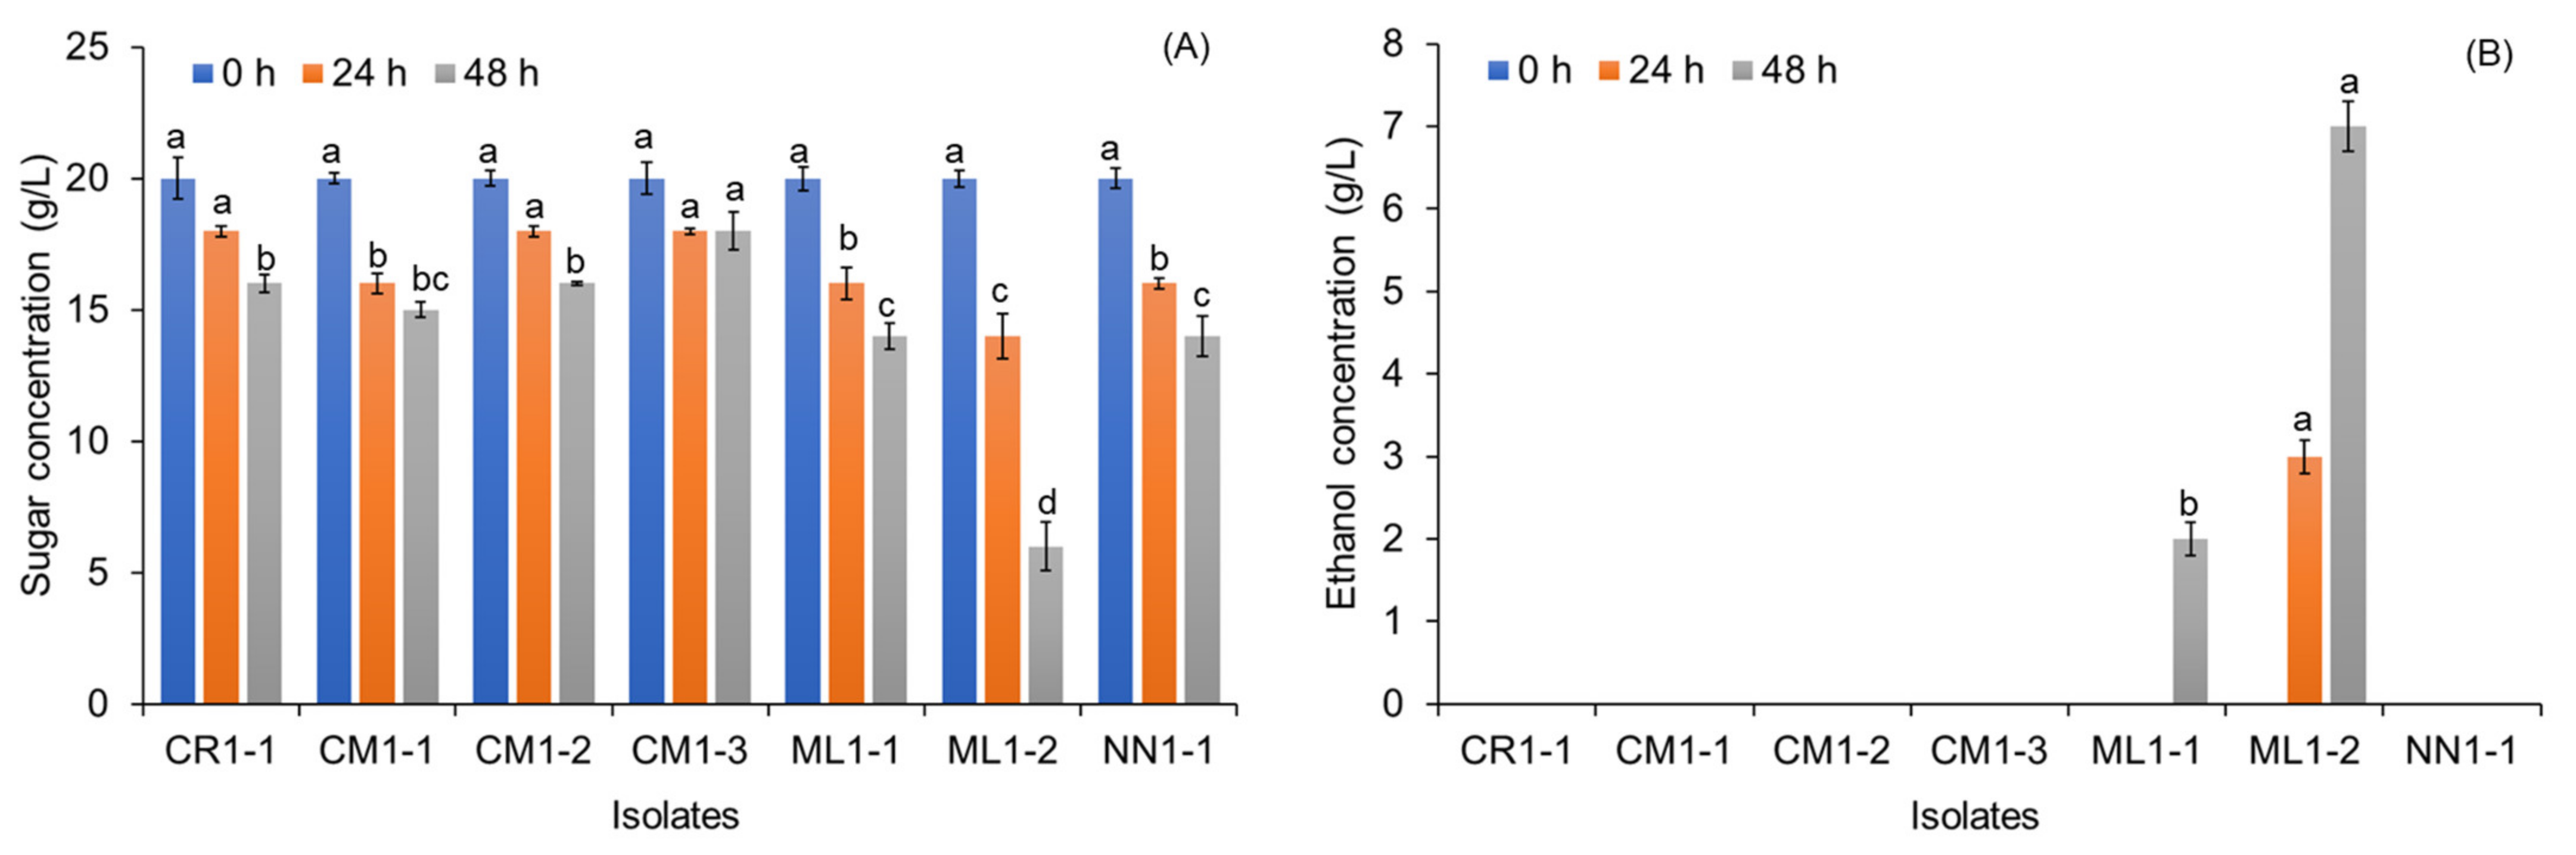
3.1. Isolation and Screening of Tannin-Tolerant Yeast Capable of Ethanol Production

Miang samples were collected from 43 local markets of five northern Thailand provinces, which included the following: Chiang Rai (CR), 4 samples; Chiang Mai (CM), 10 samples; Lampang (LP), 2 samples; Phare (ML), 17 samples; and Nan (NN), 10 samples (Table 1). Among 43 samples, 25 samples showed positive gas formation when growing on YPD broth at 30 °C for 24 h. However, after spreading gas-forming culture broths on the YPD agar plate supplemented with 100 mg/L chloramphenicol, only four samples continued to form yeast colonies on the YPD agar plates. A total of seven different colonies with distinct morphology were selected and transferred into YPD broth supplemented with 1% (w/v) tannic acid to confirm their ability for tannin tolerance and ethanol production (Figure 1).
The results indicated that all seven isolated yeasts were able to consume sugar within 24 h, but the highest sugar consumption was detected in ML1-2 isolate after 48 h of fermentation time. However, only two isolates (ML1-1 and ML1-2) were observed to be ethanol producers with ethanol yields observed at levels of 0.12 and 0.35 g/g substrate, respectively, during a 48 h fermentation period. Due to Miang being naturally fermented tea leaves without other ingredients added, microorganisms grown in the Miang sample are naturally enriched within the steamed tea leaves, which have high tannin and phenolic compound conditions. Therefore, the microbes capable of growth under this condition have been expected to be tannin-tolerant microbes. From previous studies, lactic acid bacteria, yeast, and filamentous fungi play an important role in Miang fermentation and tannin-tolerance ability is one of the most important characteristics of these microorganisms for surviving in the tannin-rich substrate [9,14,15,20]. In 2016, previous research studies demonstrated that a hundred and seven yeasts isolated from Miang were all able to tolerate a high concentration of tannins. Candida ethanolica was determined to be the dominant species that was frequently found in Miang, followed by Pichia manshurica and Pichia occidentalis [9]. According to our previous research studies, most of the reported yeast strains isolated from Miang are non-Saccharomyces yeasts, and the commonly used ethanol-producing yeast such as Saccharomyces sp. are not typically found in Miang samples. These correspond with previous reports of yeast isolates from post-fermented tea products, such as Fu blick tea, Awa-bancha tea, and Laphet, in which the predominant genera are Candida sp., Cyberlindnera sp., and Debaryomyces sp. [21,22,23].

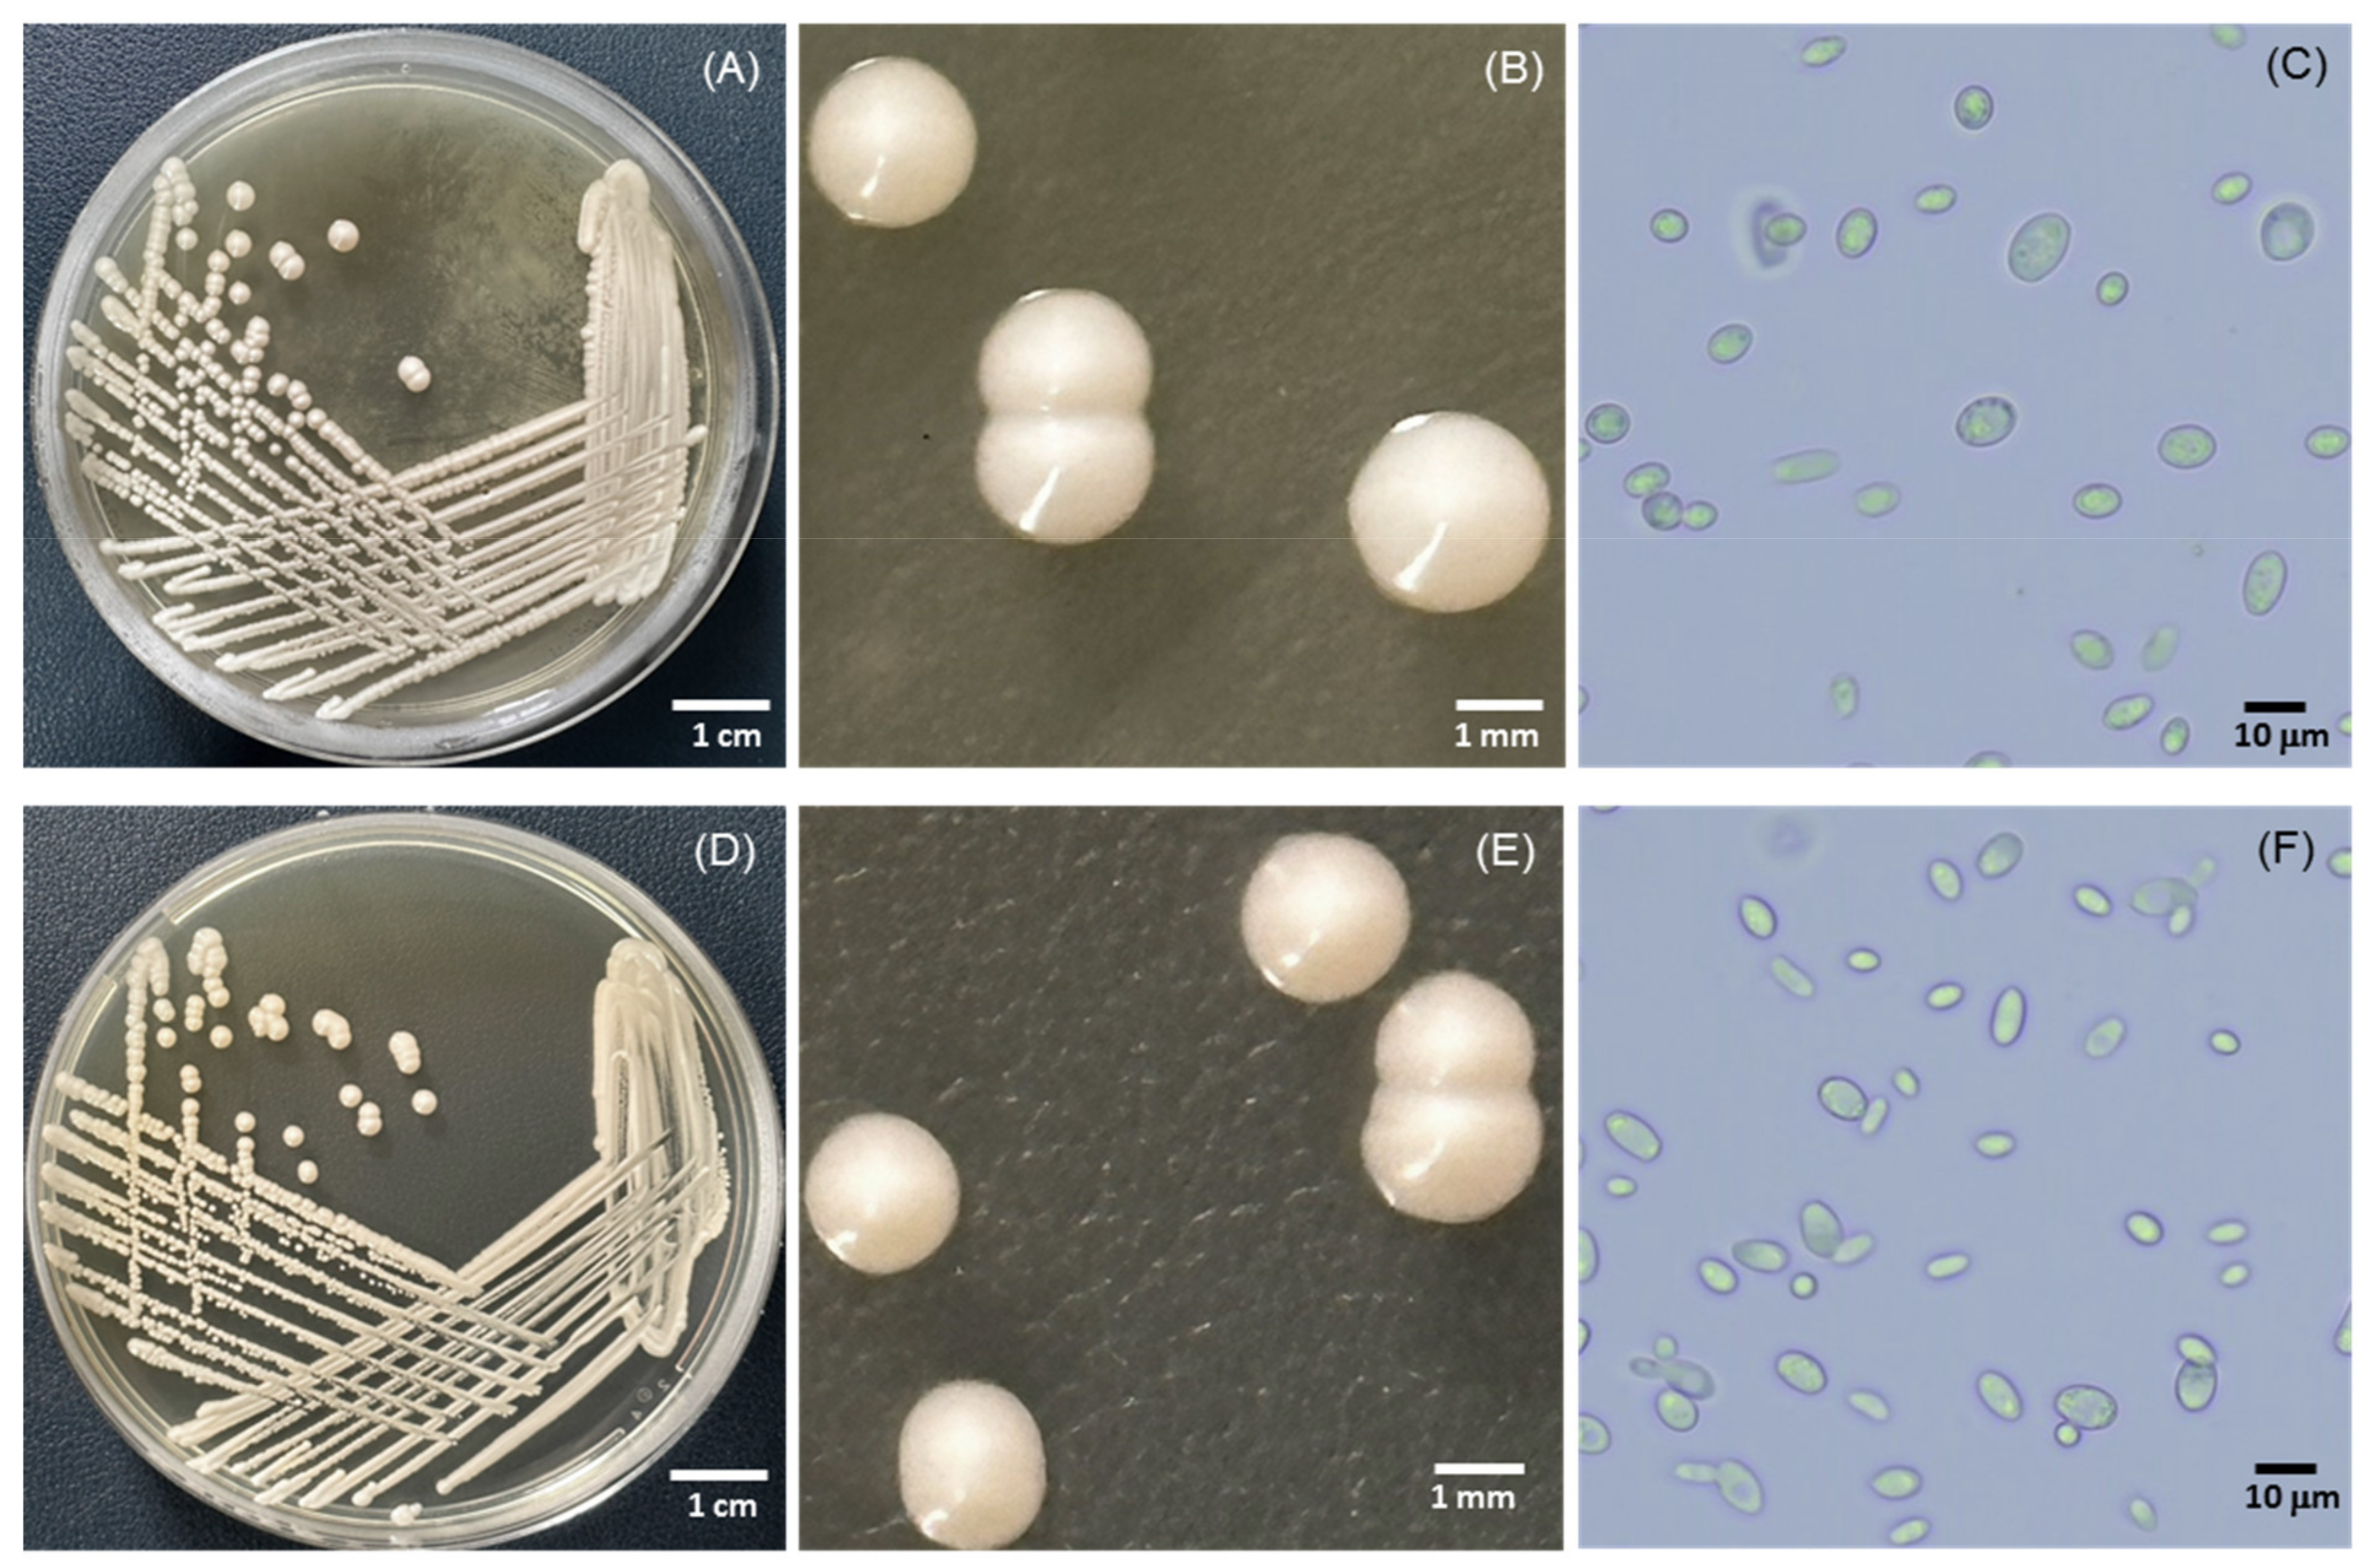
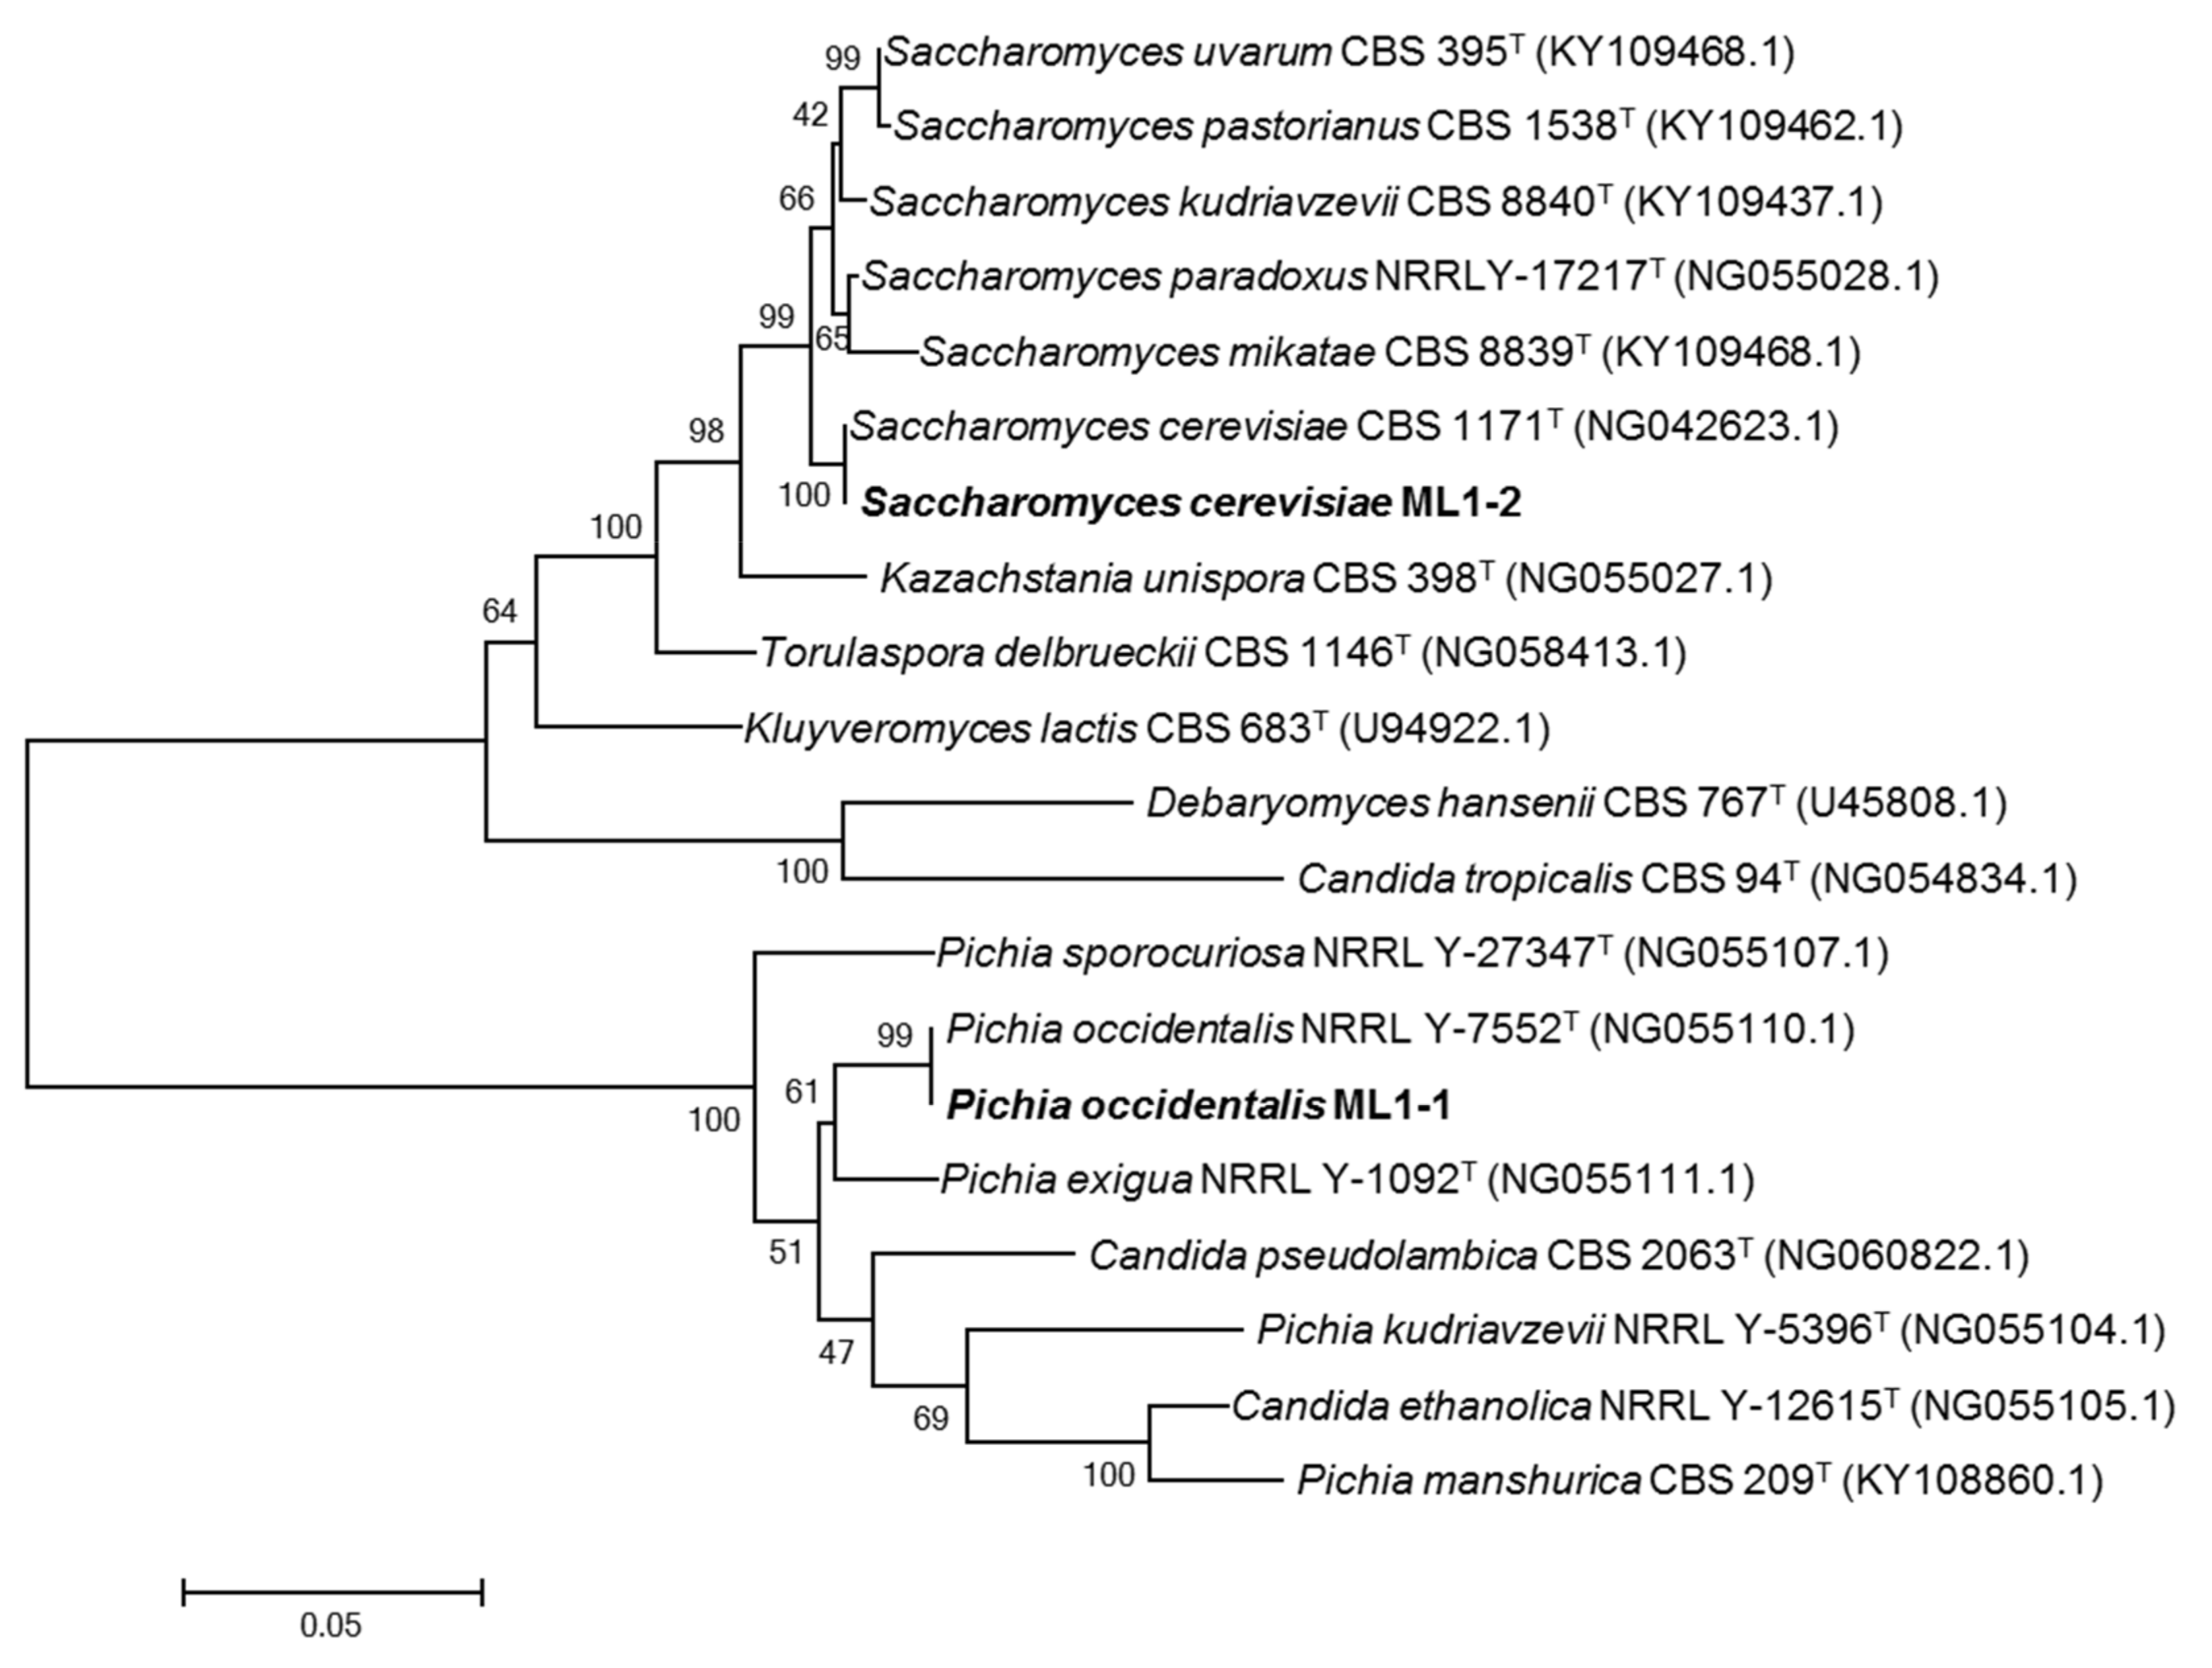
3.2. Identification and Phylogenetic Analyses of Yeasts

Colony morphology of isolates ML1-1 and ML1-2 were investigated after incubation for 48 h at 30 °C (Figure 2). All yeast isolates were identified using the comparison of D1/D2 region sequences with those of the closest species from the CBS culture collection. It was found that isolates ML1-1 and ML1-2 were identified to be Pichia occidentalis and Saccharomyces cerevisiae, respectively, sharing 100% similarity with the type strains. These results followed phylogenetic analysis, which was constructed by the neighbor-joining method (Figure 3).
Pichia species (P. fermentans, P. membranifaciens, P. occidentalis, P. terricola, P. manshurica, P. kudriavzevii, and P. kluyveri) are included in the non-Sacchromyces group and often associated with fruits, grape must, and other naturally fermented foods [24]. Most non-Sacchromyces yeasts can positively influence quality parameters to improve the composition of aromatic compounds, such as thiols, terpenes, and fruity esters [24]. On the other hand, S. cerevisiae strains were preferred by winemakers because such strains adapt easily to regional conditions with the production of high alcohol yields. S. cerevisiae was observed to be most abundant in seasonal green table olives, while P. occidentalis was the second most abundant species [25]. Since the anamorph of some Pichia species are Candida species, applying P. occidentalis ML1-1 in alcoholic beverages or other food-related applications should be further evaluated for other characteristics and safety concerns. Therefore, S. cerevisiae ML1-2 was selected for further experiments in this study, since the Saccharomyces cerevisiae has been recognized as generally recognized as safe (GRAS) microbes and the isolate ML1-2 isolated in this research showed the higher capability in ethanol production even in the high tannin-supplemented media.

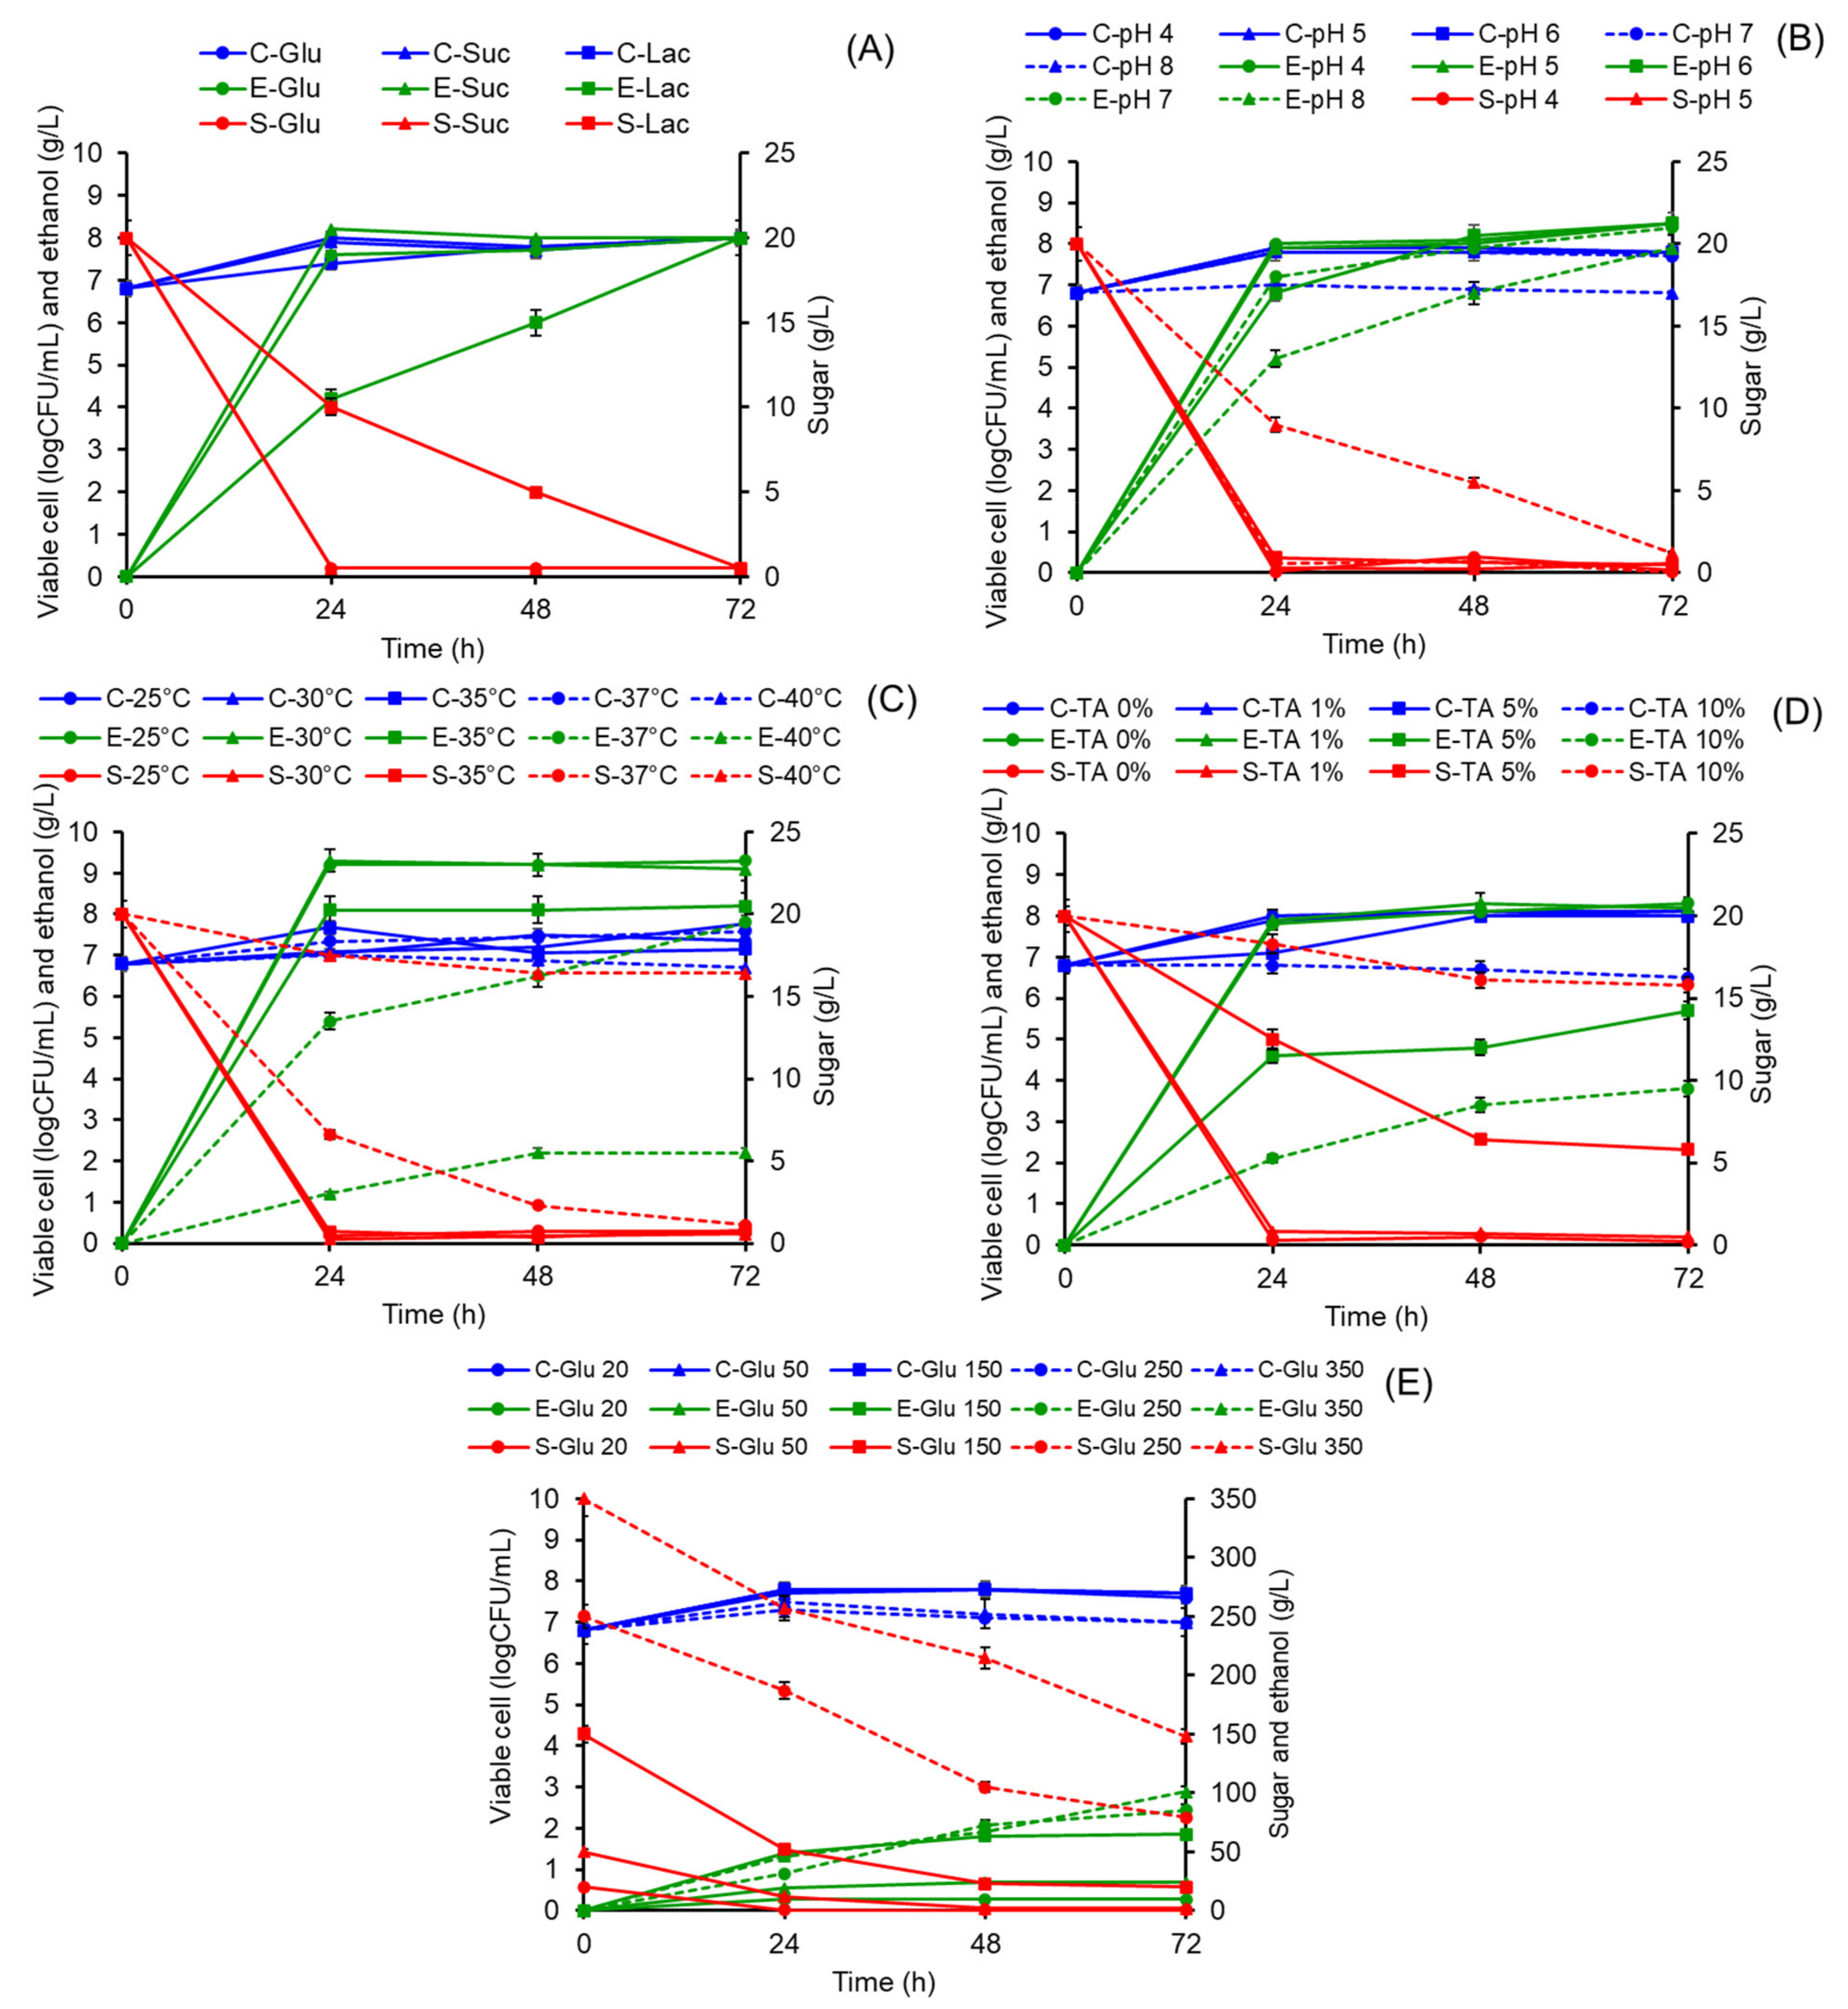
3.3. Effects of Carbon Sources on Ethanol Production

The potential characteristics of S. cerevisiae ML1-2 related to ethanol production were investigated in various conditions, including the type of sugar, pH, temperature, tannin concentration, and sugar concentration, and the results are presented in Figure 4. The results showed that S. cerevisiae ML1-2 was able to utilize glucose, lactose, and sucrose as carbon sources (Figure 4A). The viable cell counts of 8.00 ± 0.08 and 7.90 ± 0.12 logCFU/mL were observed when using glucose and sucrose as substrate, respectively, higher than lactose (7.40 ± 0.06 logCFU/mL) at 24 h. These results corresponded with the lactose consumption and ethanol production rates, which were slower than other sugars when around 60.5, and 75% of lactose were utilized at 24 and 48 h, respectively. However, at 72 h of fermentation, the sugar utilization and ethanol production from all sugars were not significantly different. S. cerevisiae is the principal yeast used for alcoholic beverage production. S. cerevisiae is regarded as an ethanologenic yeast that can readily ferment glucose, fructose, mannose, galactose, sucrose, and maltose into ethanol and carbon dioxide [1]. S. cerevisiae cannot metabolize lactose, which must be hydrolyzed before the resultant glucose and galactose can be utilized, while some yeast strains such as Candida spp. and Klyveromyces spp. are capable of directly metabolizing lactose [26].

3.4. Effects of pH and Temperature on Ethanol Production

The ethanol fermentation on YPD liquid medium with the initial pH of 4, 5, 6, 7, and 8 was conducted at 30 °C for 72 h, and the results showed that S. cerevisiae ML1-2 was able to grow in pH ranging from 4 to 7, but at pH 8, the viable cell of yeast gradually increased (Figure 4B). Sugar utilization by ML1-2 in pH 8 was only 55%, which was also lower than other pH values, and approximately 90% of sugar was consumed within 24 h at pH 4–7. High titers of ethanol of around 8.5 ± 0.2 g/L were produced at pH 4–7 at 72 h. Therefore, the pH range of 4–7 was concluded to be the suitable initial pH for ethanol production of S. cerevisiae ML1-2 since the pH 8 was not suitable for the growth of yeast. The ML1-2 was incubated under various temperatures (25, 30, 35, 37, and 40 °C) and the results presented in Figure 4C showed that viable cells of S. cerevisiae ML1-2 increased when incubated under temperatures ranging from 20 to 35 °C. However, high titer of ethanol around 9.1 ± 0.2 and 9.3 ± 0.1 g/L were found at 25 and 30 °C, respectively, at 72 h of fermentation. Therefore, the optimum pH for growth and ethanol fermentation was 4–7, while the optimum temperature was 25 to 30 °C. Our results from studies of S. cerevisiae ML1-2 were similar to most S. cerevisiae strains for alcoholic fermentation where they were able to grow well in warm (between 20 and 30 °C) and acidic environments (pH 4.5 and 6.5) [1].

3.5. Effects of Tannin Supplementation and Sugar Concentration on Ethanol Production

Variations in viable cell count, sugar consumption, and ethanol production of S. cerevisiae ML1-2 in the medium supplemented with tannin ranging from 0 to 10% (w/v) are shown in Figure 4D. It was found that the increase of viable cell number was observed in 1–5% (w/v) tannic acid-supplemented medium. At 1% (w/v) tannic acid, the cell number of ML1-2 increased from 6.50 ± 0.2 to 7.90 ± 0.07 logCFU/mL at only 24 h and was stable until the end of the fermentation period, and a similar trend was observed in the non-tannin-added medium. The final ethanol titers at 72 h of medium without tannin added and 1% (w/v) tannin added were 8.3 ± 0.3 and 8.2 ± 0.1 g/L, respectively. It was concluded that this concentration of tannin had no effect on sugar utilization and ethanol production. However, supplementation of tannin concentration at 5% and 10% (w/v) showed negative influences on growth and ethanol production of S. cerevisiae ML1-2. The viable cell counts slowly increased (from 6.80 ± 0.05 to 8.10 ± 0.12 logCFU/mL at 72 h) in 5% (w/v) tannin, whereas the decrease of viable cell number from 6.80 ± 0.08 to 6.50 ± 0.1 logCFU/mL at 72 h was observed in medium with 10% (w/v) of tannin. This also corresponded with the sugar consumption efficiency, as only 71 and 21% of sugar were utilized by ML1-2 in the medium supplemented with 5 and 10% (w/v) tannin, respectively. Ethanol production also decreased along with sugar consumption, whereby only 6.8 ± 0.3 and 4.1 ± 0.2 g/L ethanol was detected in 5 and 10% (w/v) tannin at 72 h, respectively. There is only limited information concerning the impact of tannin on yeast metabolism. Li et al., 2011 [27] studied the effect of crude tannin (0.1 and 1.0 g/L) on the metabolism of yeast during fermentation and the result showed that membrane enzyme H+ATPase was inhibited during the initial phase of the fermentation, along with a decrease in cell growth, CO2 released, sugar consumption and ethanol production. Interestingly, after three days of fermentation, an adaptation of yeast cells was observed through the enhancement of the enzyme activities involved in the glycolysis pathway [28].
The investigation of osmotic tolerance induced by glucose in S. cerevisiae ML1-2 was conducted and the results are presented in Figure 4E. The viable cell counts of S. cerevisiae ML1-2 increased towards the end of fermentation time (from 6.8 ± 0.03 to 7.3 ± 0.05 and 6.80 ± 0.09 to 7.20 ± 0.12 logCFU/mL) in 250 and 350 g/L glucose, respectively. This was confirmed by the growth capability in high sugar conditions. However, the increase in glucose levels resulted in a reduction of cell growth and leading to a decrease in sugar consumption and ethanol production. This reduction in yield conversion efficiency of ethanol from 20, 50, 150, 250, and 350 g/L of glucose calculated at 72 h fermentation were 0.49, 0.48, 0.43, 0.34, and 0.28 g/g substrate, respectively, while the greater difference in ethanol yield was observed at 24 h, 0.48, 0.37, 0.33, 0.12, and 0.14, respectively. Under high initial sugar concentrations, yeast cells must resist the stress in order to start growing and there is a potential loss in sugar transport activity, consequently resulting in less ethanol production [29,30,31]. Dodić et al., 2009 [32] studied the bioethanol production from sugar beet by S. cerevisiae and the result showed that the optimal maximal ethanol yield was found at 200 g/L sugar and the ethanol yields dropped from 67 to 56% when the fermentable sugar content was increased from 200 to 250 g/L. In addition to reducing the inhibition effects of high concentrations of substrate on yeast growth, sugar consumption, and ethanol production, the fed-batch or continuous modes are proposed. Stepwise and continuous feeding was previously reported to enhance the ethanol yield under high gravity of sugar (>200 g/L) [33,34].

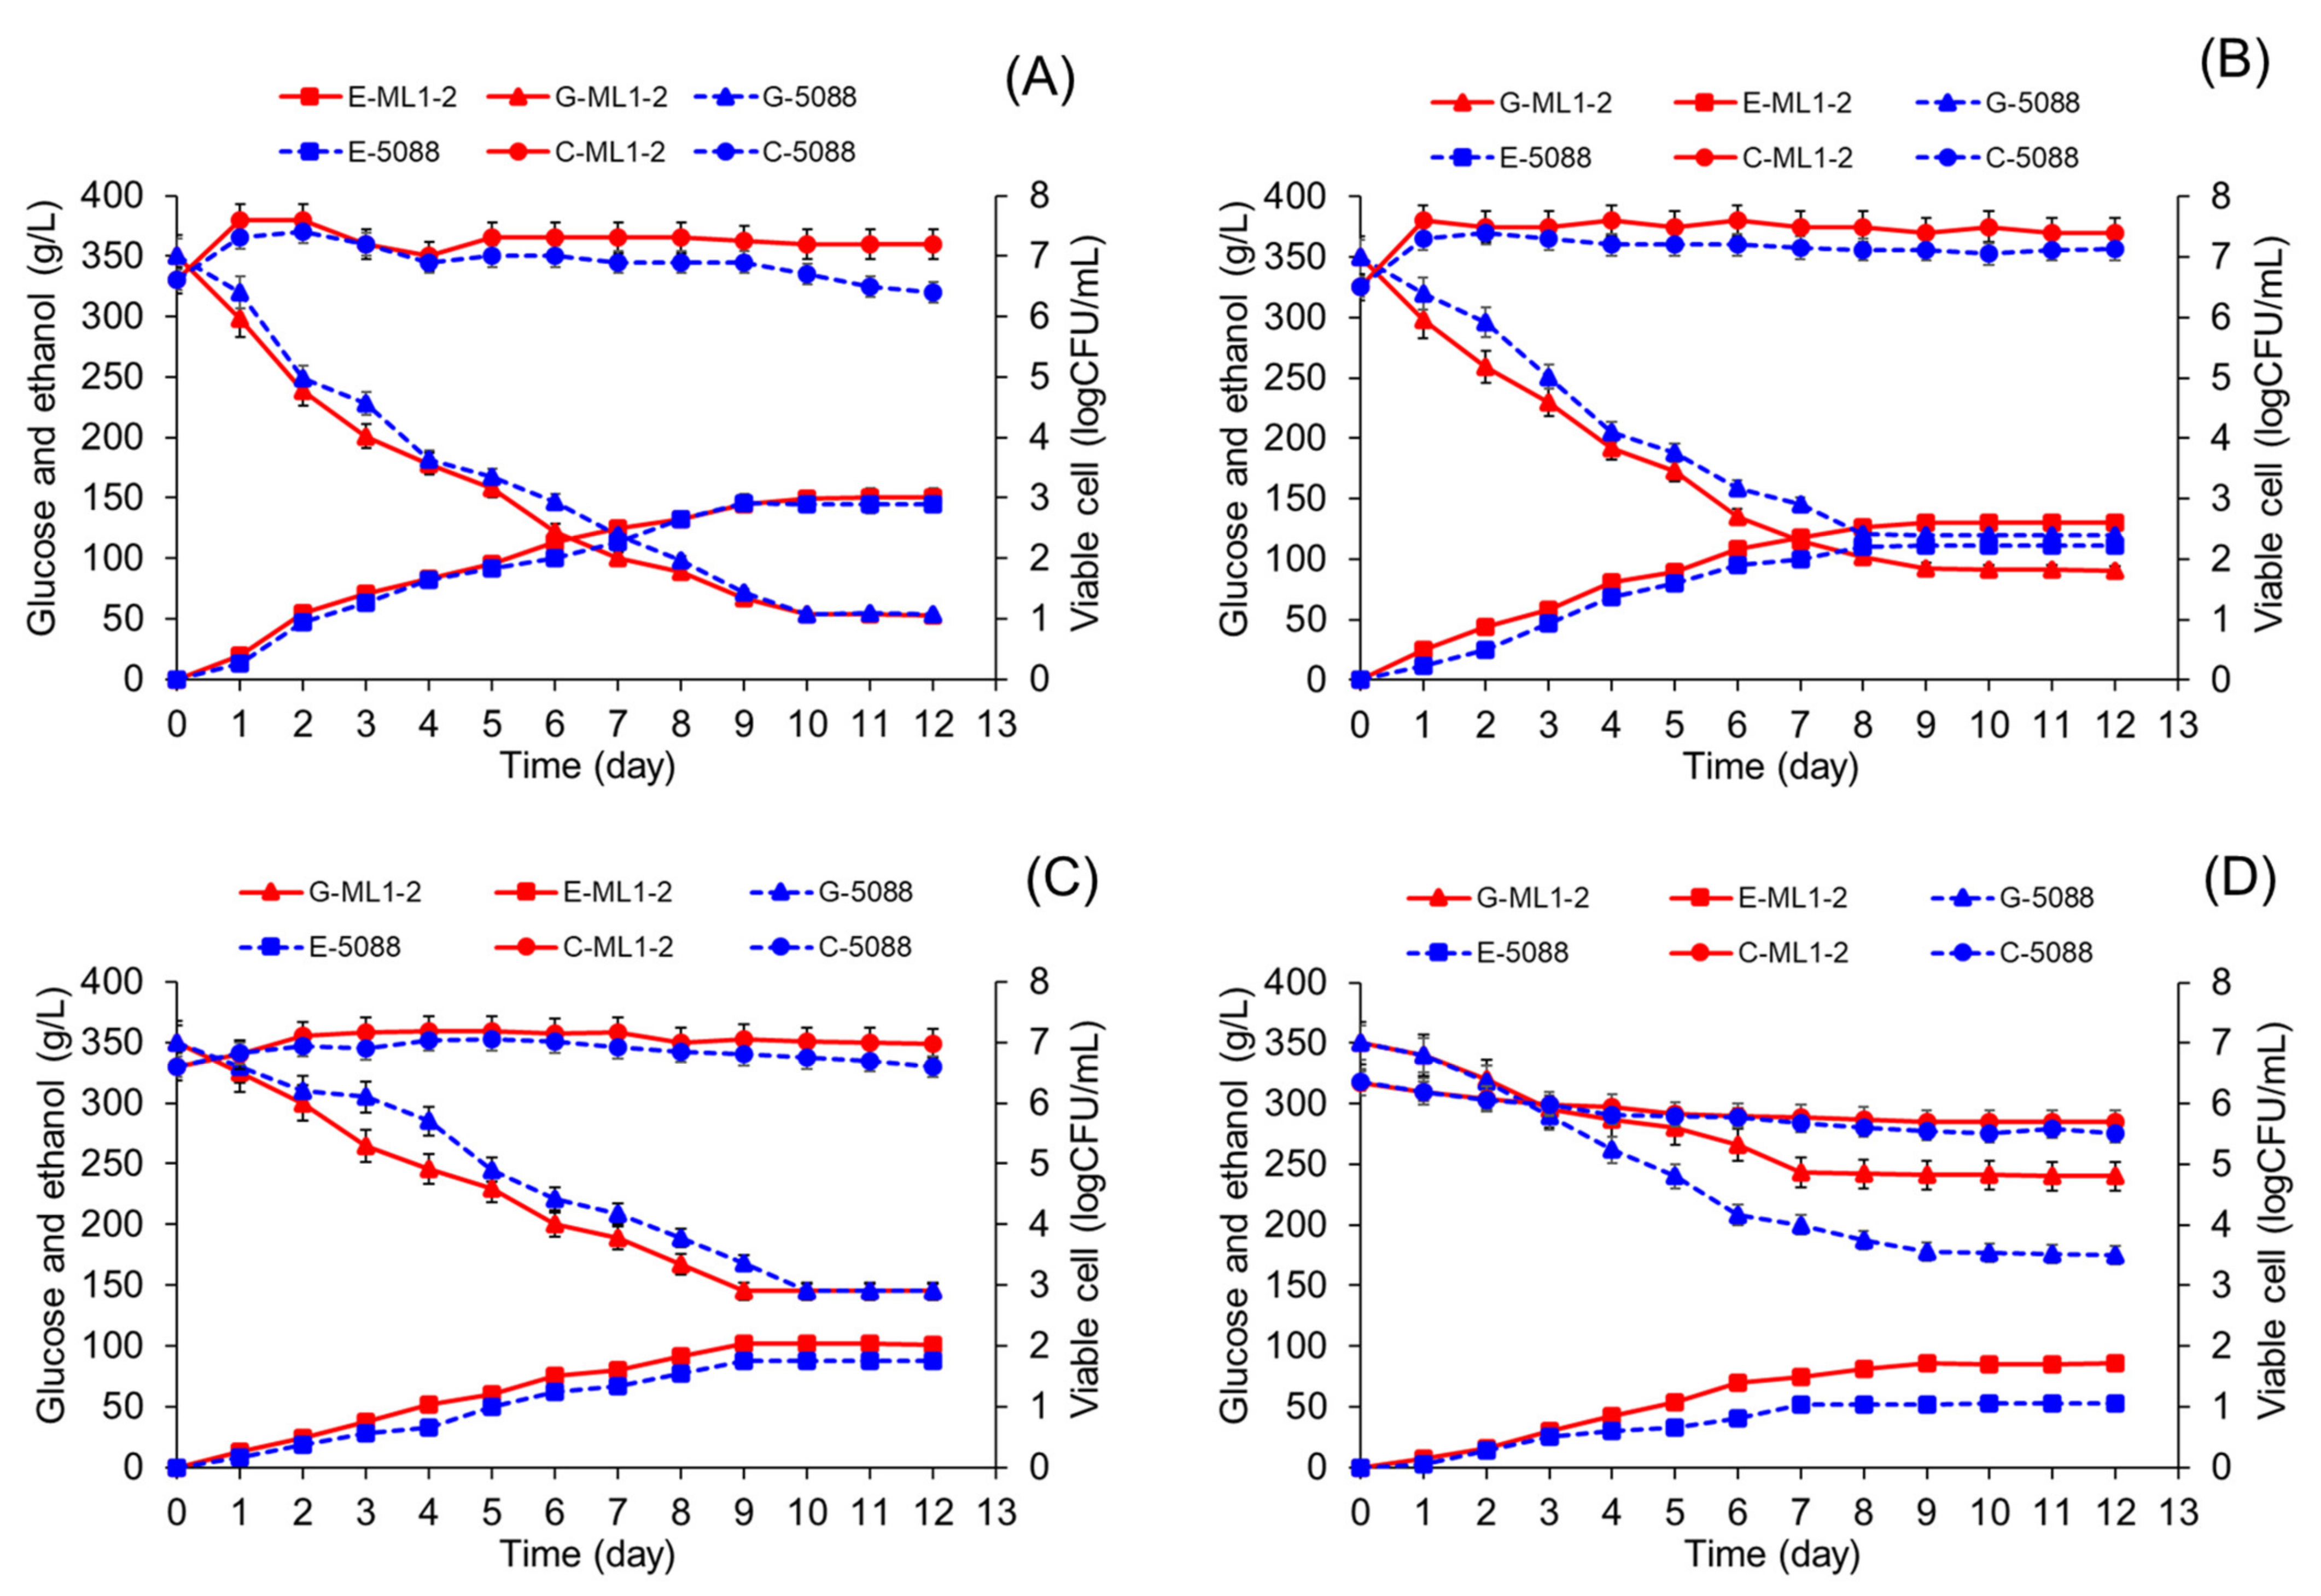
3.6. Ethanol Fermentation by Tannin-Tolerant Selected Yeast

S. cerevisiae ML1-2 and S. cerevisiae TISTR 5088 were grown in a YPD medium supplemented with 350 g/L glucose, as a carbon source, and various tannin concentrations of 1–10% (w/v), and the results are shown in Figure 5. In the YPD medium without the addition of tannin, the ethanol production observed from ML1-2 and TISTR 5088 was not different. Maximum alcohol was produced after 9 days of fermentation (around 145.7 ± 2.7 and 149 ± 1.4 g/L, respectively). In 1% (w/v) tannin-supplemented condition, sugar consumption and ethanol production of TISTR 5088 were delayed when compared to ML1-2. The ethanol titer obtained from TISTR 5088 on days 3, 5, and 7 were 47.1 ± 1.8, 80.3 ± 0.9, and 101.4 ± 1.2 g/L, respectively, whereas 58.7 ± 0.2, 92.3 ± 1.7, and 118.5 ± 0.4 g/L were observed from ML1-2, respectively. The maximum ethanol titer was obtained in 9 days of fermentation (around 110.2 ± 1.3 and 130.1 ± 0.6 g/L, respectively). The addition of 5% (w/v) tannin showed stronger inhibitory effects on the growth of both yeast strains. However, the utilization of sugar and ethanol production was also observed in both yeast strains. The maximum ethanol titer was obtained in 10 days of fermentation (around 87 ± 1.5 and 101 ± 1.1 g/L, respectively). The ability of tannin tolerance by S. cerevisiae ML1-2 was observed in a 10% (w/v) tannin medium. The viable cells of ML1-2 and TISTR 5088 decreased from 6.30 ± 0.12 to 5.50 ± 0.07 logCFU/mL and 6.30 ± 0.19 to 5.70 ± 0.21 logCFU/mL, respectively, at the end of fermentation. Interestingly, the slow rate of sugar consumption can be observed with the sugar remaining around 175 ± 1.8 and 240 ± 2.2 g/L, respectively. The maximum ethanol titer of ML 1-2 and TISTR 5088 were obtained in 9 days of fermentation with 81 ± 2.6 g/L and 52.1 ± 1.8 g/L, respectively.
The application of tannin-tolerant yeast has shown significant potential in ethanol production from tannin-rich substrates, such as grape pomace, high tannin-containing fruit, or other agricultural residues. By using tannin-tolerant yeast strains, it is possible to achieve higher ethanol yields and better fermentation efficiency, even in the presence of high tannin concentrations. This can be particularly beneficial in the production of alcoholic beverages, such as wine or fruit wine, and certain types of beer, where tannins are important contributors to flavor and mouthfeel [35,36]. Moreover, Kanpiengjai et al., 2020 [37] reported the co-production of gallic acid from tannic acid and tannase by tannin-tolerant yeast, Sporidiobolus suineniae A45.2, which can be considered as an integrated production strategy for feed additive applications.

3.7. Java Plum Fruit Wine Fermentation by Tannin-Tolerant Selected Yeast

In this study, we investigated the changes in bioactive compounds and chemical composition of Java plum fruit wine samples during fermentation using S. cerevisiae ML1-2 and TISTR 5088 strains. The results are presented in Table 2. Before fermentation, the Java plum pulp (JP) showed lower levels of total polyphenols (TP), total tannins (TT), total flavonoids (TF), and DPPH antioxidant scavenging activity compared to JP mixed with ground seeds (JPS). The TP, TT, and TF values of JP were 0.13 ± 0.01 mg GAE/mL, 0.02 ± 0.00 mg TAE/mL, and 9.05 ± 0.15 μg QE/mL, respectively, whereas JPS had higher values (1.72 ± 0.07 mg GAE/mL, 2.21 ± 0.03 mg TAE/mL, and 45.11 ± 0.73 μg QE/mL). These findings were consistent with the antioxidant scavenging activity, where JP showed lower activity compared to JPS. During fermentation, the total sugar content of JP fermented with ML1-2 gradually decreased to 88.9 ± 0.29 g/L, while JP fermented with TISTR 5088 had a total sugar content of 90.1 ± 0.73 g/L at the end of the 12-day fermentation. Ethanol production was higher in the ML1-2 fermentation (132.8 ± 0.34 g/L) compared to the TISTR 5088 fermentations (130.7 ± 0.24 g/L). TP content increased during fermentation for both JP and JPS, while TT and TF remained relatively stable.
In the JPS fermentation treatment, the total sugar concentration decreased rapidly in the ML1-2 fermentation, reaching 108.7 ± 0.78 g/L by day 6, whereas 193.7 ± 0.35 g/L of total sugar was detected in the TISTR 5088 fermentation. Ethanol production was also higher in the ML1-2 fermentation (122.7 ± 0.51 g/L) compared to the TISTR 5088 fermentations (80.2 ± 0.62 g/L) on day 6. TP content increased from 1.72 ± 0.07 to 3.54 ± 0.13 mg GAE/mL in the JPS fermented with ML1-2, while JPS fermented with TISTR 5088 showed an increase from 1.72 ± 0.07 to 2.65 ± 0.19 mg GAE/mL. TT and TF values remained relatively stable throughout the fermentation period. The DPPH antioxidant scavenging activity expressed as 1/IC50, was found to be higher in the JPS fermented with ML1-2 compared to the uninoculated JPS, with an approximately 5-fold increase at the end of fermentation. Meanwhile, the 1/IC50 value of the JPS fermented with TISTR 5088 increased by around 2.5 times. Nonetheless, the main studies should be carried out to evaluate the influence of sucrose added to the Java plum fruit wine bioactive compounds and antioxidant activity, as well as to monitor cell growth and ethanol production. Java plum fruit is a valuable indigenous plant with medicinal applications due to its rich content of carbohydrates, vitamins, and important minerals [38,39]. Furthermore, the seed of Java plum contains various phenolic compounds, including lignans, tannins, coumarins, gallic acid, ferulic acid, phloroglucinol derivatives, and flavonoids [40,41]. Fruit wine production from Java plum has been previously reported, and the presence of ground seeds was found to enhance the phenolic content of the wine. However, the content of phenolic compounds tends to decrease during aging [42]. In summary, our findings demonstrate the potential of S. cerevisiae ML1-2 fermentation for enhancing the bioactive compounds and antioxidant activity of Java plum fruit wine, particularly when the ground seeds are included in the fermentation process.

4. Conclusions

Tannin-tolerant Saccharomyces cerevisiae and Pichia occidentalis were isolated from Miang, a traditional fermented tea from northern Thailand. S. cerevisiae ML1-2 was selected for further investigation based on its ability for ethanol production, which revealed that S. cerevisiae ML1-2 showed the ability to grow and produce ethanol between 20 and 35 °C, at the pH range of 4–7, and tolerance to high sugar concentration of up to 350 g/L. This is the first report that describes tannin-tolerant Saccharomyces cerevisiae that is able to tolerate tannin concentration up to 10% (w/v), but growth and ethanol-producing performances were not negatively affected by tannin levels of at 1% (w/v). The yeast strain ML1-2 also showed the capability to ferment Java plum juice mixed with ground seed and obtained fermented products with higher nutritional components, especially with higher antioxidant properties. This newly isolated S. cerevisiae ML1-2 showed high potential to be applied both for the production of fuel bioethanol and functional alcoholic beverages.

Author Contributions

Conceptualization: K.U. and C.K. Methodology: N.M. and C.K. Formal analysis: N.M. Investigation: N.M. and P.K. Writing—original draft preparation: K.U., A.K. and C.K. Writing—review and editing: K.U., A.K., K.S. and C.K. Supervision: C.K. All authors have read and agreed to the published version of the manuscript.

Funding

This research work was supported by CMU Junior Research Fellowship Program and the National Research Council of Thailand (NRCT).

Institutional Review Board Statement

Not applicable.

Informed Consent Statement

Not applicable.

Data Availability Statement

The 16S rRNA gene sequences of identified bacteria were deposited in GenBank with accession numbers OR284308 and OR284309.

Acknowledgments

The authors would like to thank the Faculty of Agro-Industry, Chiang Mai University for research facilities.

Conflicts of Interest

The authors declare no conflict of interest.

References

  1. Walker, G.M.; Stewart, G.G. Saccharomyces cerevisiae in the production of fermented beverages. Beverages 2016, 2, 30. [Google Scholar] [CrossRef]
  2. Walker, G.M.; Walker, R.S. Enhancing yeast alcoholic fermentations. Adv. Appl. Microbiol. 2018, 105, 87–129. [Google Scholar] [PubMed]
  3. Saranraj, P.; Sivasakthivelan, P.; Naveen, M. Fermentation of fruit wine and its quality analysis: A review. Aust. J. Sci. Technol. 2017, 1, 85–97. [Google Scholar]
  4. Matallana, E.; Aranda, A. Biotechnological impact of stress response on wine yeast. Lett. Appl. Microbiol. 2017, 64, 103–110. [Google Scholar] [CrossRef]
  5. Abdel-Banat, B.M.; Hoshida, H.; Ano, A.; Nonklang, S.; Akada, R. High-temperature fermentation: How can processes for ethanol production at high temperatures become superior to the traditional process using mesophilic yeast? Appl. Microbiol. Biotechnol. 2010, 85, 861–867. [Google Scholar] [CrossRef] [PubMed]
  6. Nuanpeng, S.; Thanonkeo, S.; Klanrit, P.; Thanonkeo, P. Ethanol production from sweet sorghum by Saccharomyces cerevisiae DBKKUY-53 immobilized on alginate-loofah matrices. Braz. J. Microbiol. 2018, 49, 140–150. [Google Scholar] [CrossRef] [PubMed]
  7. Rinaldi, A.; Blaiotta, G.; Aponte, M.; Moio, L. Effect of yeast strain and some nutritional factors on tannin composition and potential astringency of model wines. Food Microbiol. 2016, 53, 128–134. [Google Scholar] [CrossRef] [PubMed]
  8. Bindon, K.A.; Kassara, S.; Solomon, M.; Bartel, C.; Smith, P.A.; Barker, A.; Curtin, C. Commercial Saccharomyces cerevisiae yeast strains significantly impact Shiraz tannin and polysaccharide composition with implications for wine colour and astringency. Biomolecules 2019, 9, 466. [Google Scholar] [CrossRef]
  9. Kanpiengjai, A.; Chui-Chai, N.; Chaikaew, S.; Khanongnuch, C. Distribution of tannin-tolerant yeasts isolated from Miang, a traditional fermented tea leaf (Camellia sinensis var. assamica) in northern Thailand. Int. J. Food Microbiol. 2016, 238, 121–131. [Google Scholar] [CrossRef] [PubMed]
  10. Taskin, M. Co-production of tannase and pectinase by free and immobilized cells of the yeast Rhodotorula glutinis MP-10 isolated from tannin-rich persimmon (Diospyros kaki L.) fruits. Bioprocess Biosyst. Eng. 2013, 36, 165–172. [Google Scholar] [CrossRef]
  11. Khanongnuch, C.; Unban, K.; Kanpiengjai, A.; Saenjum, C. Recent research advances and ethno-botanical history of miang, a traditional fermented tea (Camellia sinensis var. assamica) of Northern Thailand. J. Ethn. Foods 2017, 4, 135–144. [Google Scholar] [CrossRef]
  12. Hamilton-Miller, J. Antimicrobial properties of tea (Camellia sinensis L.). Antimicrob. Agents Chemother. 1995, 39, 2375–2377. [Google Scholar] [CrossRef] [PubMed]
  13. Abdullahi, A.D.; Kodchasee, P.; Unban, K.; Pattananandecha, T.; Saenjum, C.; Kanpiengjai, A.; Shetty, K.; Khanongnuch, C. Comparison of phenolic contents and scavenging activities of Miang extracts derived from filamentous and non-filamentous fungi-based fermentation processes. Antioxidants 2021, 10, 1144. [Google Scholar] [CrossRef]
  14. Unban, K.; Khatthongngam, N.; Pattananandecha, T.; Saenjum, C.; Shetty, K.; Khanongnuch, C. Microbial community dynamics during the non-filamentous fungi growth-based fermentation process of Miang, a traditional fermented tea of north Thailand and their product characterizations. Front. Microbiol. 2020, 11, 1515. [Google Scholar] [CrossRef]
  15. Kodchasee, P.; Nain, K.; Abdullahi, A.D.; Unban, K.; Saenjum, C.; Shetty, K.; Khanongnuch, C. Microbial dynamics-linked properties and functional metabolites during Miang fermentation using the filamentous fungi growth-based process. Food Biosci. 2021, 41, 100998. [Google Scholar] [CrossRef]
  16. Kurtzman, C.; Robnett, C. Identification of clinically important ascomycetous yeasts based on nucleotide divergence in the 5′end of the large-subunit (26S) ribosomal DNA gene. J. Clin. Microbiol. 1997, 35, 1216–1223. [Google Scholar] [CrossRef] [PubMed]
  17. Tamura, K.; Dudley, J.; Nei, M.; Kumar, S. MEGA4: Molecular evolutionary genetics analysis (MEGA) software version 4.0. Mol. Biol. Evol. 2007, 24, 1596–1599. [Google Scholar] [CrossRef] [PubMed]
  18. Dubois, M.; Gilles, K.A.; Hamilton, J.K.; Rebers, P.A.; Smith, F. Colorimetric method for determination of sugars and related substances. Anal. Chem. 1956, 28, 350–356. [Google Scholar] [CrossRef]
  19. Sánchez-Moreno, C.; Larrauri, J.A.; Saura-Calixto, F. A procedure to measure the antiradical efficiency of polyphenols. J. Sci. Food Agric. 1998, 76, 270–276. [Google Scholar] [CrossRef]
  20. Chaikaew, S.; Baipong, S.; Sone, T.; Kanpiengjai, A.; Chui-chai, N.; Asano, K.; Khanongnuch, C. Diversity of lactic acid bacteria from Miang, a traditional fermented tea leaf in northern Thailand and their tannin-tolerant ability in tea extract. J. Microbiol. 2017, 55, 720–729. [Google Scholar] [CrossRef]
  21. Li, Q.; Huang, J.; Li, Y.; Zhang, Y.; Luo, Y.; Chen, Y.; Lin, H.; Wang, K.; Liu, Z. Fungal community succession and major components change during manufacturing process of Fu brick tea. Sci. Rep. 2017, 7, 6947. [Google Scholar] [CrossRef] [PubMed]
  22. Okada, S.; Takahashi, N.; Ohara, N.; Uchimura, T.; Kozaki, M. Microorganisms involving in the fermentation of Japanese fermented tea leaves, 2: Microorganisms in fermentation of Goishi-cha, Japanese fermented tea leaves. J. Jpn. Soc. Food. Sci. Technol. 1996, 43, 1019–1027. [Google Scholar] [CrossRef]
  23. Bo, B.; Kim, S.A.; Han, N.S. Bacterial and fungal diversity in Laphet, traditional fermented tea leaves in Myanmar, analyzed by culturing, DNA amplicon-based sequencing, and PCR-DGGE methods. Int. J. Food Microbiol. 2020, 320, 108508. [Google Scholar] [CrossRef]
  24. Vicente, J.; Calderón, F.; Santos, A.; Marquina, D.; Benito, S. High potential of Pichia kluyveri and other Pichia species in wine technology. Int. J. Mol. Sci. 2021, 22, 1196. [Google Scholar] [CrossRef]
  25. Arroyo-López, F.; Querol, A.; Bautista-Gallego, J.; Garrido-Fernández, A. Role of yeasts in table olive production. Int. J. Food Microbiol. 2008, 128, 189–196. [Google Scholar] [CrossRef]
  26. Okamoto, K.; Nakagawa, S.; Kanawaku, R.; Kawamura, S. Ethanol production from cheese whey and expired milk by the brown rot fungus Neolentinus lepideus. Fermentation 2019, 5, 49. [Google Scholar] [CrossRef]
  27. Li, J.-Y.; Du, G.; Yang, X.; Huang, W.-D. Effect of proanthocyanidins on yeast metabolism, H+-ATPase activity, and wine fermentation. Am. J. Enol. Vitic. 2011, 62, 512–518. [Google Scholar] [CrossRef]
  28. Li, J.; Zhao, H.; Huang, W. Mechanism of proanthocyanidins-induced alcoholic fermentation enhancement in Saccharomyces cerevisiae. J. Ind. Microbiol. Biotechnol. 2014, 41, 1793–1802. [Google Scholar] [CrossRef]
  29. Salmon, J.M.; Mauricio, J.C. Relationship between sugar uptake kinetics and total sugar consumption in different industrial Saccharomyces cerevisiae strains during alcoholic fermentation. Biotechnol. Lett. 1994, 16, 89–94. [Google Scholar] [CrossRef]
  30. Bauer, F.; Pretorius, I.S. Yeast stress response and fermentation efficiency: How to survive the making of wine. S. Afr. J. Enol. Vitic. 2000, 21, 27–51. [Google Scholar] [CrossRef]
  31. Attfield, P.V. Stress tolerance: The key to effective strains of industrial baker’s yeast. Nat. Biotechnol. 1997, 15, 1351–1357. [Google Scholar] [CrossRef]
  32. Dodić, S.; Popov, S.; Dodić, J.; Ranković, J.; Zavargo, Z.; Mučibabić, R.J. Bioethanol production from thick juice as intermediate of sugar beet processing. Biomass Bioenergy 2009, 33, 822–827. [Google Scholar] [CrossRef]
  33. Phukoetphim, N.; Salakkam, A.; Laopaiboon, P.; Laopaiboon, L. Improvement of ethanol production from sweet sorghum juice under batch and fed-batch fermentations: Effects of sugar levels, nitrogen supplementation, and feeding regimes. Electron. J. Biotechnol. 2017, 26, 84–92. [Google Scholar] [CrossRef]
  34. Joannis-Cassan, C.; Riess, J.; Jolibert, F.; Taillandier, P. Optimization of very high gravity fermentation process for ethanol production from industrial sugar beet syrup. Biomass Bioenergy 2014, 70, 165–173. [Google Scholar] [CrossRef]
  35. Swiegers, J.; Bartowsky, E.; Henschke, P.; Pretorius, I. Yeast and bacterial modulation of wine aroma and flavour. Aust. J. Grape Wine Res. 2005, 11, 139–173. [Google Scholar] [CrossRef]
  36. Ning, Z.; Jiang, J.-C.; Jing, Y.; Min, W.; Jian, Z.; Hao, X.; Xie, J.-C.; Tong, Y.-J. Ethanol production from acorn starch by tannin tolerance mutant Pachysolen tannophilus. Energy Sources 2018, 40, 572–578. [Google Scholar] [CrossRef]
  37. Kanpiengjai, A.; Khanongnuch, C.; Lumyong, S.; Haltrich, D.; Nguyen, T.-H.; Kittibunchakul, S. Co-production of gallic acid and a novel cell-associated tannase by a pigment-producing yeast, Sporidiobolus ruineniae A45. 2. Microb. Cell Fact. 2020, 19, 95. [Google Scholar] [CrossRef] [PubMed]
  38. Das, G.; Nath, R.; Das Talukdar, A.; Ağagündüz, D.; Yilmaz, B.; Capasso, R.; Shin, H.-S.; Patra, J.K. Major bioactive compounds from java plum seeds: An investigation of its extraction procedures and clinical effects. Plants 2023, 12, 1214. [Google Scholar] [CrossRef]
  39. Baliga, M.S.; Bhat, H.P.; Baliga, B.R.V.; Wilson, R.; Palatty, P.L. Phytochemistry, traditional uses and pharmacology of Eugenia jambolana Lam.(black plum): A review. Food Res. Int. 2011, 44, 1776–1789. [Google Scholar] [CrossRef]
  40. Tak, Y.; Kaur, M.; Jain, M.C.; Samota, M.K.; Meena, N.K.; Kaur, G.; Kumar, R.; Sharma, D.; Lorenzo, J.M.; Amarowicz, R. Jamun seed: A review on bioactive constituents, nutritional value and health benefits. Pol. J. Food Nutr. Sci. 2022, 72, 211–228. [Google Scholar] [CrossRef]
  41. Raharjo, S.; Falah, I.; Santoso, U. Methanolic extract of Java Plum (Syzygium cumini Linn.) seeds as a natural antioxidant on lipid oxidation of oil-in-water emulsions. Int. Food Res. J. 2017, 24, 1636. [Google Scholar]
  42. VenuGopal, K.; Anu-Appaiah, K. Seed incorporation during vinification and its impact on chemical and organoleptic properties in Syzygium cumini wine. Food Chem. 2017, 237, 693–700. [Google Scholar] [CrossRef]
Figure 1. Sugar consumption (A) and ethanol production (B) of seven isolated yeasts from Miang. Lowercase alphabets of each fermentation time represent significantly different mean values (p < 0.05) (n = 3). CR: Chiang Rai province; CM: Chiang Mai province; LP: Lampang province; ML: Phrae province; NN: Nan province.
Microbiolres 14 00133 g001
Figure 2. Cell morphology of P. occidentalis ML1-1 (AC) and S. cerevisiae ML1-2 (DF) on YPD agar after incubation at 30 °C for 48 h.
Microbiolres 14 00133 g002
Figure 3. Phylogenetic tree of P. occidentalis ML1-1 and S. cerevisiae ML1-2 based on the D1/D2 domain of 26S rRNA gene sequences. Sequences obtained from this study are presented in bold. The superscript “T” indicates the type species.
Microbiolres 14 00133 g003
Figure 4. Cultivation of S. cerevisiae ML1-2 in YPD broth containing various sugars as a sole carbon source (A), incubating in various pH (B), various temperatures (C), various tannin concentrations (D), and various glucose concentrations (E). The error bars represent the standard deviations (n = 3). C: viable cell count; E: ethanol concentration; S: sugar concentration.
Microbiolres 14 00133 g004
Figure 5. The profiles of ethanol, glucose, and viable cell count during fermentation of YPD broth containing various tannin concentrations ((A): 0%; (B): 1%; (C): 5%; (D): 10%) by S. cerevisiae ML1-2 and S. cerevisiae TISTR 5088 at 30 °C for 12 days. The error bars represent the standard deviations (n = 3). C: viable cell count; E: ethanol concentration; G: glucose concentration.
Microbiolres 14 00133 g005
Table 1. Miang sampling sites and number of yeast isolates from different locations.
Provinces (Code)No. of Miang SamplesNo. of Gas FormationNo. of Yeast Isolates
Chiang Rai (CR)421
Chiang Mai (CM)1083
Lampang (LP)210
Phrae (ML)1792
Nan (NN)1051
Total43257
Table 2. The fermentation parameters of Java plum fruit wine fermented with two yeast isolates, Saccharomyces cerevisiae ML1-2 and Saccharomyces cerevisiae TISTR 5088 at 30 °C for 12 days.
ParametersJava Plum Fruit Wine Fermented without Ground SeedJava Plum Fruit Wine Fermented with Ground Seed
Before InoculatingS. cerevisiae
ML1-2
S. cerevisiae
TISTR 5088
Before InoculatingS. cerevisiae
ML1-2
S. cerevisiae
TISTR 5088
6 Days12 Days6 Days12 Days6 Days12 Days6 Days12 Days
Total sugar (g/L)350 ± 0.58 a145.9 ± 0.92 b88.9 ± 0.29 d140.8 ± 0.94 c90.1 ± 0.73 d350 ± 0.31 a108.7 ± 0.78 c15.1 ± 0.66 e193.7 ± 0.35 b20.2 ± 0.62 d
Ethanol (g/L)-70.5 ± 0.36 c132.8 ± 0.34 a69.4 ± 0.28 d130.7 ± 0.24 b-122.7 ± 0.51 c168.6 ± 0.38 a80.2 ± 0.62 d165.3 ± 0.82 b
Viable cell (logCFU/mL)-8.23 ± 0.08 a7.75 ± 0.05 c7.98 ± 0.05 b7.67 ± 0.04 c-8.02 ± 0.06 a7.61 ± 0.03 c7.78 ± 0.08 b7.64 ± 0.05 c
pH3.63 ± 0.01 ab3.56 ± 0.03 bc3.67 ± 0.11 a3.49 ± 0.02 c3.73 ± 0.02 a3.67 ± 0.05 c3.83 ± 0.04 b3.98 ± 0.03 a3.79 ± 0.01 b3.96 ± 0.02 a
Total polyphenol
(mg GAE/mL)
0.13 ± 0.01 e0.32 ± 0.02 c0.67 ± 0.05 a0.21 ± 0.01 d0.55 ± 0.05 b1.72 ± 0.07 c3.32 ± 0.02 a3.54 ± 0.13 a2.53 ± 0.25 b2.65 ± 0.19 b
Total tannin
(mg TAE/mL)
0.02 ± 0.00 d0.02 ± 0.01 d0.09 ± 0.00 a0.04 ± 0.02 c0.07 ± 0.00 b2.21 ± 0.03 bc2.54 ± 0.11 a2.34 ± 0.07 ab2.04 ± 0.21 c2.11 ± 0.08 c
Total flavonoid
(μg QE/mL)
9.05 ± 0.15 a9.32 ± 0.19 a9.45 ± 0.56 a9.87 ± 0.23 a9.54 ± 0.82 a45.11 ± 0.73 a45.34 ± 0.11 a43.21 ± 0.27 b42.33 ± 0.21 c41.21 ± 0.38 d
1/IC500.17 ± 0.02 d0.32 ± 0.01 b0.41 ± 0.01 a0.25 ± 0.02 c0.35 ± 0.03 b1.67 ± 0.22 e8.92 ± 0.09 b9.54 ± 0.10 a3.54 ± 0.02 d4.42 ± 0.17 c
Note: Data show mean ± standard deviation (n = 3). Different superscript letters in each row of each raw material indicate significantly different mean values (p < 0.05).
Disclaimer/Publisher’s Note: The statements, opinions and data contained in all publications are solely those of the individual author(s) and contributor(s) and not of MDPI and/or the editor(s). MDPI and/or the editor(s) disclaim responsibility for any injury to people or property resulting from any ideas, methods, instructions or products referred to in the content.

