Article

Analysis of the Virulence and Inflammatory Markers Elicited by Enteroaggregative Escherichia coli Isolated from Clinical and Non-Clinical Sources in an Experimental Infection Model, India

1
Department of Medical Microbiology, Postgraduate Institute of Medical Education and Research (PGIMER), Chandigarh 160012, India
2
Department of Biosciences, School of Basics and Applied Sciences, Galgotias University, Plot No. 2, Sector-17A, Yamuna Expressway, Gautam Buddh Nagar, Greater Noida 201310, India
3
Department of Experimental Medicine & Biotechnology, Postgraduate Institute of Medical Education and Research (PGIMER), Chandigarh 160012, India
*
Author to whom correspondence should be addressed.
Microbiol. Res. 2022, 13(4), 882-897; https://doi.org/10.3390/microbiolres13040062
Submission received: 25 August 2022 / Revised: 8 October 2022 / Accepted: 14 October 2022 / Published: 4 November 2022

Abstract

:
Enteroaggregative Escherichia coli (EAEC) is highly heterogeneous in virulence; we wanted to understand the pathogenic potential of EAEC isolated from various clinical and non-clinical sources in an animal model. We infected male BALB/c mice in six mice/groups with 50 EAEC isolates isolated from clinical and non-clinical sources. We studied colonization, weight loss, stool shedding, and inflammatory markers and their relationship with 21 virulence genes and phylogroups, EAEC organ burden, and histopathological changes. We detected significantly more inflammatory changes and fecal lactoferrin and calprotectin levels in mice infected with EAEC isolated from symptomatic cases. In clinical EAEC isolates, the presence of chromosomal genes (aap (46%), aaiC (23.3%), SPATEs (pet (13.3%), sat (20%), sigA, and pic (6.6%)), the adhesive variantsof EAEC (agg4A (53.3%), aggA (53.3%), aafA (36.6%), andagg3A (40%)), and the master regulator gene aggR (66.6%) were associated with higher levels of lactoferrin and calprotectin. Additionally, 70% (9/13) of EAEC isolated from acute diarrheal cases bearing chuA (70%) in our study were assigned to groups B2 (4 isolates) and D (5 isolates). Real-time PCR analysis revealed that colonization by EAEC strains from different clinical and non-clinical sources occurs up to 10–15 days of life. Even from non-diarrheal stools and non-clinical sources, EAEC strainshad the potential to cause prolonged colonization, weight loss, and inflammation in the intestine, though the degree varied. Moreover, a better understanding of EAEC pathogenic pathways is desperately needed in different clinical scenarios.

1. Introduction

Diarrheal illnesses are a major cause of childhood mortality worldwide. Among different pathotypes of diarrheagenic Escherichia coli (DEC), enteroaggregative E. coli (EAEC) is gaining importance as it causes persistent and acute diarrhea in both developing and developed countries [1,2,3]. EAEC is increasingly recognized as a common cause of diarrhea in healthy, malnourished, and immune-deficient adults and children [4,5,6,7]. The pathogenesis of EAEC is not completely understood. Several in vitro and in vivo models have been used to study the pathogenesis of EAEC [8,9]. EAEC strains express several virulence factors encoded on the chromosome or on the EAEC-specific pAA plasmid [1,10,11]. Most EAEC strains harbor a transcriptional activator called AggR that activates several factors encoded on the pAA plasmid and chromosome [12]. Based on the presence or absence of the transcriptional regulator AggR, EAEC strains are classified into typical and atypical groups, respectively. The genes under AggR control include those that encode the aggregative adherence fimbriae (AAF), of which at least five variants exist [13,14]. AAFs are necessary for adherence to human intestinal explants and elicit both cytokine release and the opening of epithelial cell tight junctions [15]. Among toxins, serine protease autotransporters of Enterobacteriaceae (SPATEs) comprise a diverse group of trypsin-like serine proteases, which are produced by all of the DEC pathotypes and Shigella strains. SPATEs have been categorized phylogenetically into two classes. Class 1 SPATEs are cytotoxic to epithelial cells and include toxins, such as plasmid-encoded toxin (Pet), and its two homologs, Shigella IgA-like protease homolog (SigA) and a secreted autotransporter toxin (Sat) [16,17]. Class 2, or non-cytotoxic SPATEs, contain Pic, which is a mucinase that facilitates EAEC intestinal colonization, and SepA, which is a cryptic membrane protein originally identified in Shigella and contributes to intestinal inflammation [18]. SepA is widespread among EAEC strains [19].
EAEC may also cause inflammatory diarrhea [20] and have been shown to produce inflammatory markers, such as fecal lactoferrin, interleukin (IL)-8, calprotectin, and IL-1β, which are markers of intestinal inflammation [20,21]. Lactoferrin is an 80 kDa iron-binding glycoprotein and is a major constituent in the secondary granules of neutrophilic leukocytes [21,22]. Its presence in body fluids, including the intestinal lumen, is proportional to the flux of neutrophils, and its assessment can provide a reliable biomarker for inflammation [23]. Calprotectin is a protein found in white blood cells, which is activated when inflammation occurs, and, thus, can be used as a diagnostic indicator. Many factors, such as demographics, phylogroups, pathogenesis, host-EAEC interactions, and the clinical presentation of EAEC, are associated with a variation in the production of pro-inflammatory immune responses [24]. It has been observed that E. coli harboring the chuA gene, and belonging to the phylogenetic groups B2 and D, are mostly able to colonize the gastrointestinal tract (GIT) mucosa and survive inside the cells [25]. A recent study has demonstrated that the presence of specific E. coli (both belonging to groups B2 and D), in colonic biopsies is associated with inflammatory bowel disease (IBD) [26].
The cellular and molecular mechanisms underlying the initiation, progression, and the outcomes of EAEC-associated inflammation are largely unknown [27]. This lack of understanding could be due to strain heterogeneity and the unavailability of appropriate animal models [28]. As a result, highly reproducible animal models that enable researchers to analyze cellular responses in the intestinal mucosa during EAEC infection are still urgently needed [24]. Since EAEC virulence is highly heterogeneous, and no isolate presents all the EAEC-associated virulence factors, we want to understand the pathophysiology of EAEC isolated from various clinical and non-clinical sources in an animal model, to determine colonization, weight loss, stool shedding, intestinal inflammatory markers, and histopathological changes induced by diverse EAEC strains. We also assess the relationship of inflammatory markers with virulence genes and phylogroups.

2. Materials and Methods

2.1. Ethics Statement

This study was approved bythe Postgraduate Institute of Medical Education and Research (PGIMER) Ethics Committee (INT/IEC/2017/173). All animal experiments were conducted according to the ethical guidelines approved by the institutional animal ethics committee (Ref. No. 93/IAEC/650) of PGIMER, Chandigarh, India.

2.2. Animals Used

Six-week-old male BALB/c mice were provided with sterilized water and food before and during the experiments. For each isolate, 6 mice were used.

2.3. Selection of EAEC Strains

A total of fifty EAEC strains isolated from human, animal, and environmental sources were selected for animal study from our strain collection in a previously published study [3]. The pCVD432 primer was used in this study for the detection of EAEC. Among 50 EAEC strains, 30EAEC strains were isolated from humans (20 from diarrheal patients and 10 from healthy). The strains from non-human origin included 10 strains, each isolated from animal and environmental sources. The reference strain EAEC 042 was used as a control strain (Table S3 of Supplementary Data).

2.4. Defining EAEC Strains

The EAEC strains used in this study were detected by using pCVD432 primer by using multiplex PCR (M-PCR), which amplified the 630 bp region from start position 65 to the end position 694 of the CVD432 gene.

2.5. Infection of the Mice

The infection was given to each group by following the standard protocol described by Myhal et al. [29]. Mice were given drinking water containing streptomycin sulfate (5 g/L sterilized water) for one day to clear their intestines of streptomycin-sensitive gut bacteria. After one day of streptomycin treatment, the number of facultative anaerobic bacteria per gram of feces dropped from approximately 1 × 10⁸ to an undetectable number on agar plates (i.e., less than 102 cells/g feces). After overnight starvation, each group was inoculated intragastrically with 1 × 10¹⁰ cells (0.2 mL) of the EAEC strains isolated from different sources by using a 1 mL tuberculin syringe fitted with a 20 gauge needle [30]. The mice were closely observed to ensure that they did not regurgitate or aspirate the given inoculum. Six mice were inoculated separately with 0.2 mL of filter-sterilized phosphate-buffered saline (PBS) and were used as a control. Mice were closely monitored, and stool samples were collected daily for bacteriological analysis.

2.6. Mice Colonization Experiments

Bodyweight measurements and quantitative determination of bacterial loads were conducted.
The bodyweight before and after the oral infection was monitored on days (0, 1, 2, 4, 6, 10, 12, and 15), and the percentage change in the body weight was calculated. Briefly, the stool sample from each group was serially diluted from 10−1 to 10−7 using sterile PBS as a diluent. A 100 µL of the sample was aliquoted from each tube and plated using a flame-sterilized L-shaped glass rod on MacConkey agar. Plates were incubated at 37 °C for 24 h, and the bacterial count was reported as CFU/mL.

2.7. Analysis of Inflammation Markers

The detection of fecal lactoferrin and calprotectin was conducted.
Stool samples of infected mice from each group were pooled after 24 h of infection and were dissolved in one ml of PBS. Samples were centrifuged at 1000 g at 2–8 °C for 20 min to remove insoluble impurities and cell debris at 1000 g at 2–8 °C. The clear supernatant was collected in the fresh vial, and the presence of fecal lactoferrin was detected using an immune chromatographic detection kit (Mouse LTF/LF (Lactoferrin) based on sandwich enzyme-linked immune-sorbent assay technology. Anti-LTF/LF antibody pre-coated 96-well plates and the biotin-conjugated anti-LTF/LF antibodies were used as detection antibodies. Similarly, calprotectin in mice stool samples was detected by using an immune chromatographic detection kit (S100 calcium-binding protein A9) in the pre-coated Anti-S100A9 antibody 96-well plates, and the biotin-conjugated anti-S100A9 antibodies were used as detection antibodies.

2.8. Analysis of Stool for Bacterial Burden by Real-Time PCR

The stool samples of each group of BALB/c mice infected with EAEC strains from different sources were collected on the 1st, 5th, 10th, and 15th days and cultured on MacConkey agar, and colonies of E. coli were identified by matrix-assisted laser desorption/ionization–time-of-flight (MALDI-TOF) (Bruker Daltonik GmbH, Bremen, Germany). Identified E. coli was further subcultured on sterile MacConkey agar and subjected to DNA extraction. The DNA extraction was performed using an optimized heat shock method. Briefly, E. coli strains were grown on MacConkey agar at 37 °C overnight. A loopful colony of bacteria was added into 100 µL TE buffer and incubated at 100 °C for 10 min. After incubation, samples were centrifuged, and 70 µL of supernatant was stored at −20 °C as template DNA [31]. Detection and quantification of EAEC were conducted using a real-time PCR detection system throughthe use of the attA gene. The forward and reverse oligonucleotide primers for the attA gene, as used for real-time PCR, were as follows: forward, 5′-AGGTTTGATATTGATGTCCTTGAGGA-3′; reverse, 5′-TCAGCTAATAA TGTATAGAAATCCGCTGTT-3. The reaction was performed using the real-time PCR system (Step-OneTM Applied biosystem). Each 40 µL reaction mixture contained 25 µL SYBR Green master mix (Power SYBR Green PCR master mix Applied biosystem), 2 µL of template DNA, and 0.5 mM of forward and reverse primer of the target and housekeeping gene (16S rRNA). The forward and reverse oligonucleotide primers for the 16S rRNA gene used for real-time PCR were as follows: forward, 5′-CATTGACGTTACCCGCAG AAT-3′; reverse 5′-CGCTTTACGCCCAGTAATTCC-3′. The reaction mixture was subjected to 50 °C for 2 min, 95 °C for 10 min, and 45 cycles of 95 °C for 15 s and 60 °C for 60 s. After 45 cycles, a melting curve with a ramp speed of 2.0 °C/s between 70 °C and 95 °C was determined with a reading every 0.2 °C using SYBR green fluorescence. Melting curves were analyzed using the applied biosystem software (version 2.0). Melting analysis showed a distinct peak for the target gene with melting temperatures.

2.9. Detection of Virulence Factors by M-PCR

E. coli strains confirmed as EAEC were further investigated for virulence genes. M-PCR was conducted for the detection of virulence genes, including aap, pet, sigA, pic, sepA, sat, aaiC, agg4A, aafA, astA, sepA, sat, ORF3, aggA, agg3A, aafC, ORF61, eilA, capU, air, espY2, and rmoA [19]. The list of primers used, product size, and their primer sequences are provided in Table S1 (Supplementary Data).

2.10. Phylogenetic Analysis via M-PCR

A triplex PCR was used to detect phylogenetic groups A, B1, B2, and D by amplifying the following gene targets:chuA, yjaA, and a cryptic DNA fragment, TspE4C2 [32]. The classification was correlated with Clermont dichotomous decision tree [33]. The list of primers used, product size, and their primer sequences are provided in Table S2 (Supplementary data).

2.11. Histopathological Analysis

To understand the pathogenesis of EAEC, one mouse from each group was sacrificed every 1st, 5th, and 10th day after infection. The rest of the mice were sacrificed on the 15th day. The intestinal tissue of each group of mice was preserved in 10% buffered formalin and then dehydrated in gradient ethanol (30–100%) for histopathological analysis. Paraffin wax blocks were prepared, and thin sections were stained by hematoxylin and eosin. The pathological observation of all tissues was performed through microscopy analysis [34].

2.12. Statistical Analysis

A two-tailed chi-square test was used tocompare groups. If low predicted values constrained the study, Fisher’s exact test was used. Odds ratio (OR) and 95% confidence intervals (CIs) were calculated using the GraphPad PRISM software.

3. Results

3.1. Mice Colonization Experiment

The measurement of body weight changes and bacterial shedding through the mouse gastrointestinal tract in BALB/c mice:
Streptomycin-treated BALB/c mice were intragastrically garaged with EAEC strains. The bodyweight of each mouse was measured on days (0, 1, 2, 4, 6, 10, 12, and 15), and the percentage change in the body weight was calculated. The colonization of EAEC strains in BALB/c mice resulted in weight loss, which continued upto days 5–6. Stool samples were collected over days 1–10, and CFU was calculated. It revealed that prolonged colonization and maximum fecal shedding of the organism were noted on day one after infection, which decreased after the fifth day of infection (Figures S1–S3 of Supplementary Data).

3.2. Virulence-Related Markers and Phylogeny among EAEC Isolate from Clinical and Non-Clinical Sources Used in the Animal Model

Among clinical EAEC strains, the prevalence of chromosomal genes (aap (46%), aaiC (23.3%), and SPATEs toxins), adhesive variants (agg4A (53.3%), aggA (53.3%), agg3A (40%), aafA (36.6%), and affC (33.3%))and the master regulator gene aggR (66.6%) was higher than EAEC isolates from non-clinical sources, as shown in Table 1. In phylogeny, 70% (9/13) of the EAEC strains isolated from the human source belonged to group B2 (10 isolates) and D (11 isolates), whereas the EAEC strains from animal sources belonged to phylogroup B1 (30%) and D (30%) (Table 1). Statistically, a significant difference was observed for the following virulence genes:astA (p = 0.01), aaiC (0.03), aggA (0.008), aafA (0.001), agg3A (0.001), aafC (0.003), espY (0.03), and rmo (0.005), among clinical and non-clinical EAEC isolates. However, there was no significant association among clinical and non-clinical EAEC isolates (Table 1). The virulence genes’ content, phylogroups, colonization, and the concentration of inflammatory markers of each strain from clinical and non-clinical sources are shown in Table 2, Table 3 and Table 4. The mean virulence score of human, animal, and environmental EAEC strains was 7, 3, and 4, respectively. Additionally, we concluded that the gene combination astA, aggR was present in 25/30 (83.3%) of the EAEC isolates of human origin, whereas this gene combination was detected in 2/10 (20%) of the isolates from animal sources and 5/10 (50%) of the isolates of environmental origin.

3.3. Analysis of Inflammatory Markers

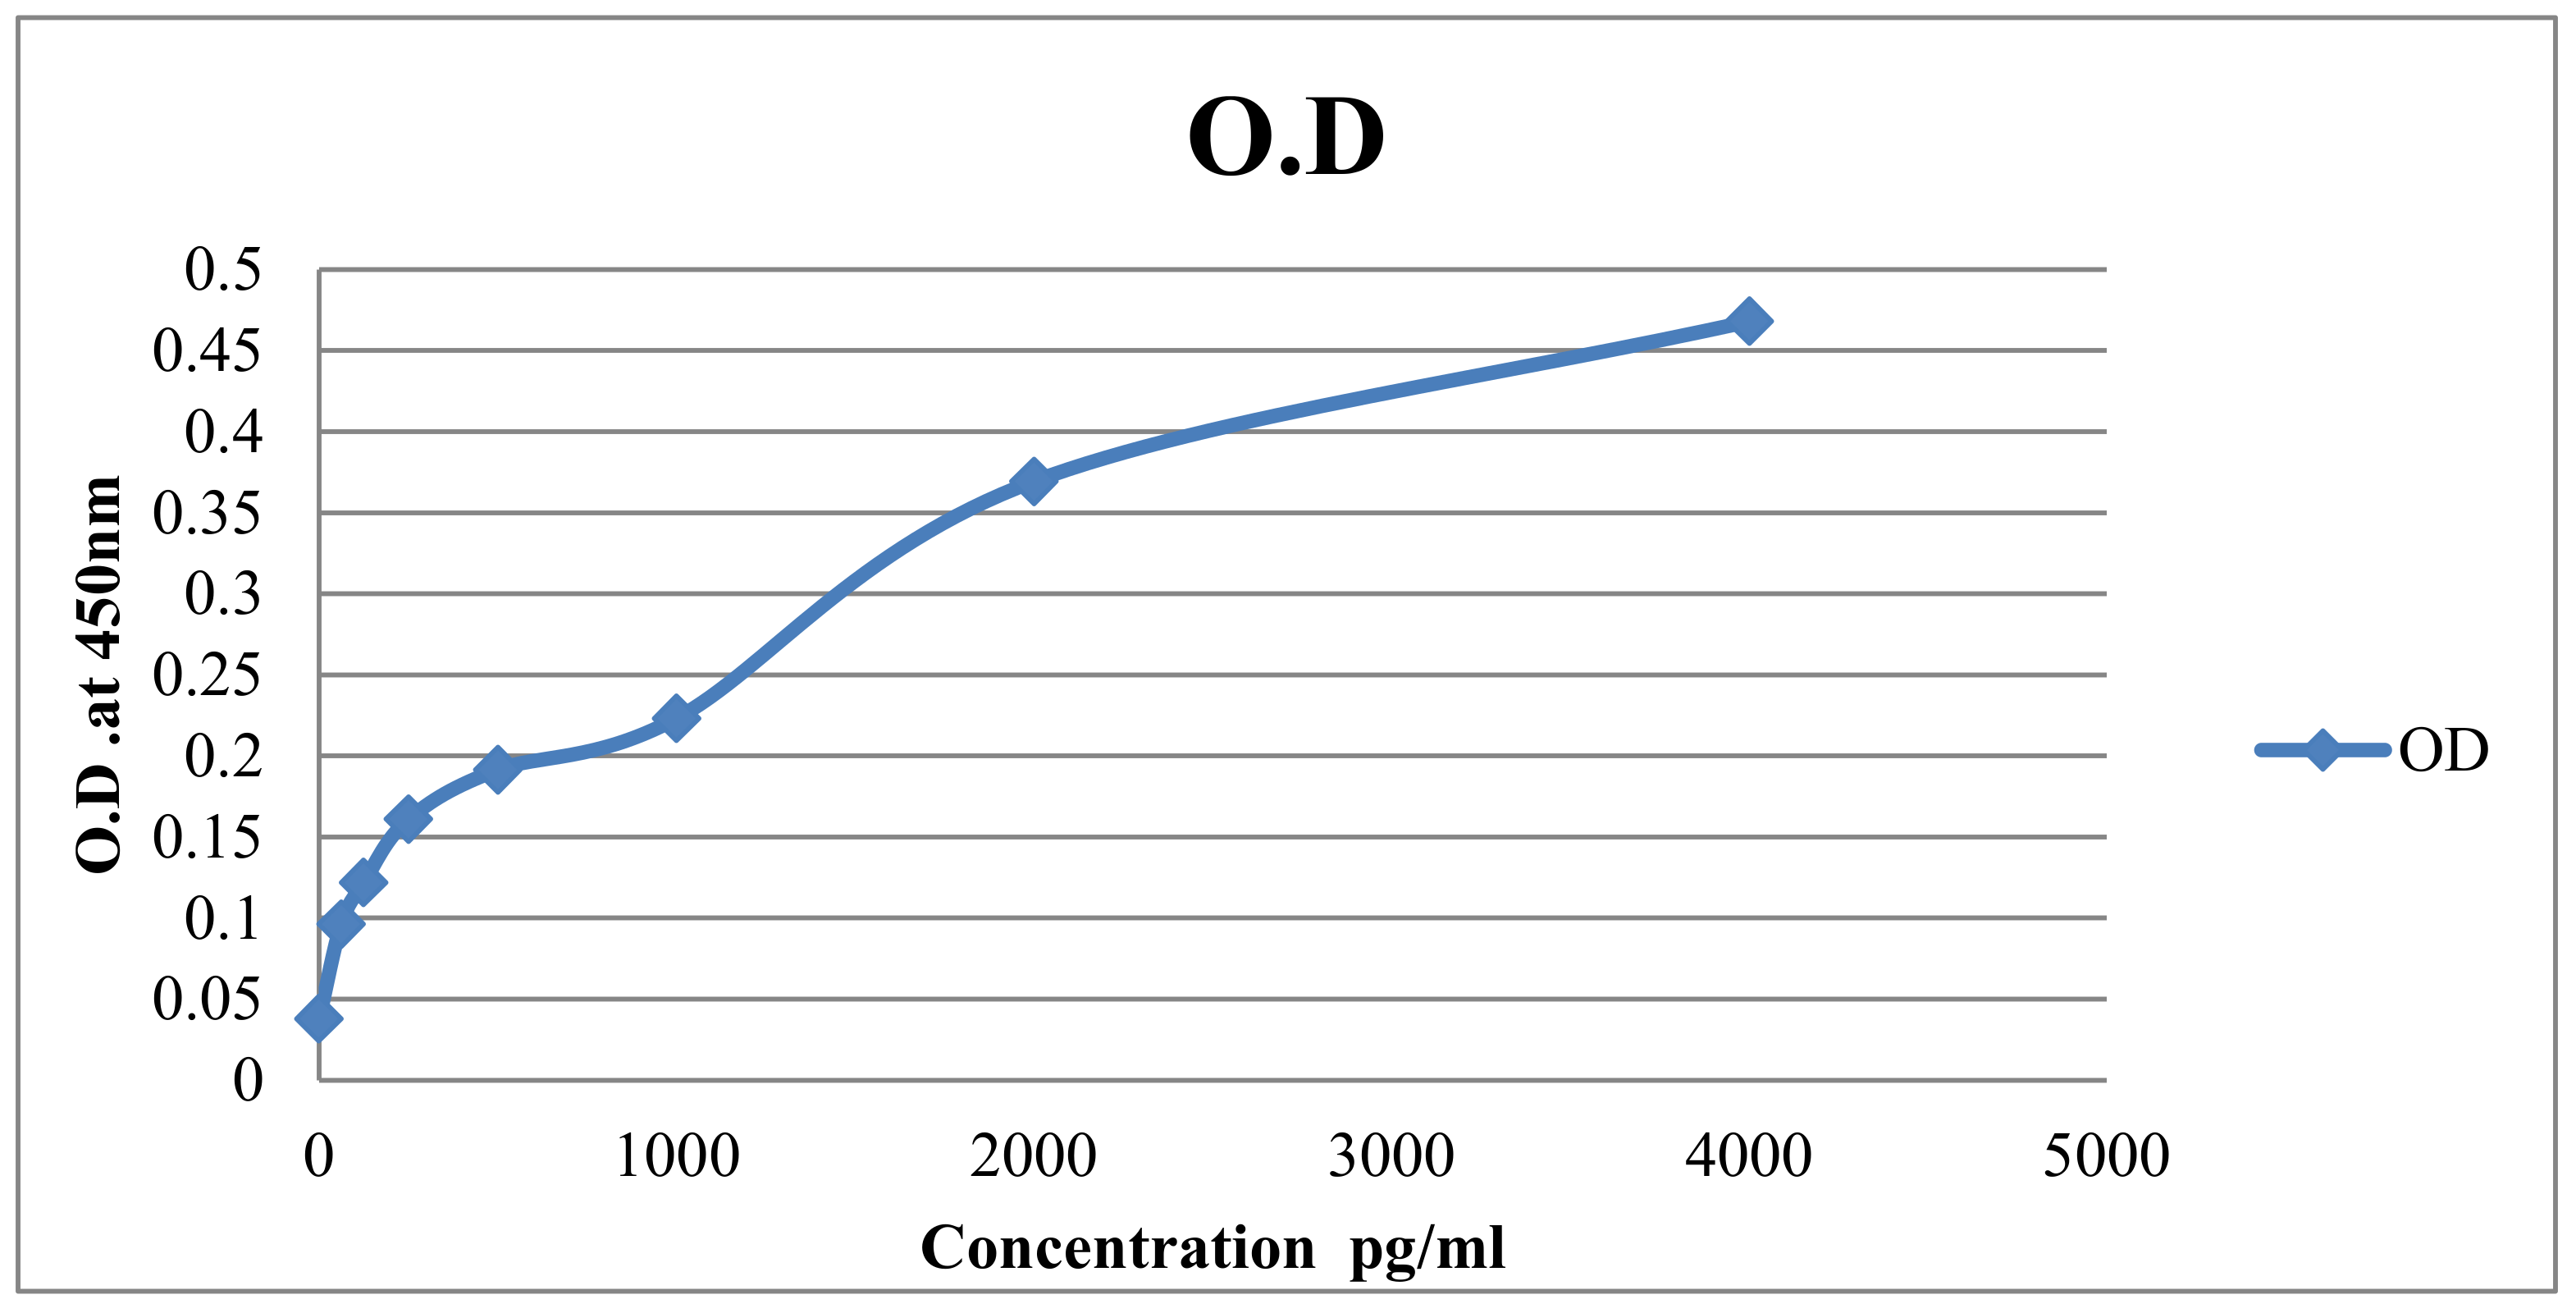
3.3.1. Standard Curve

The presence of lactoferrin in the stool samples of infected mice was detected by using a lactoferrin ELISA kit, and the standard curve was plotted from the absorbance taken at 450 nm, as shown in Figure 1.

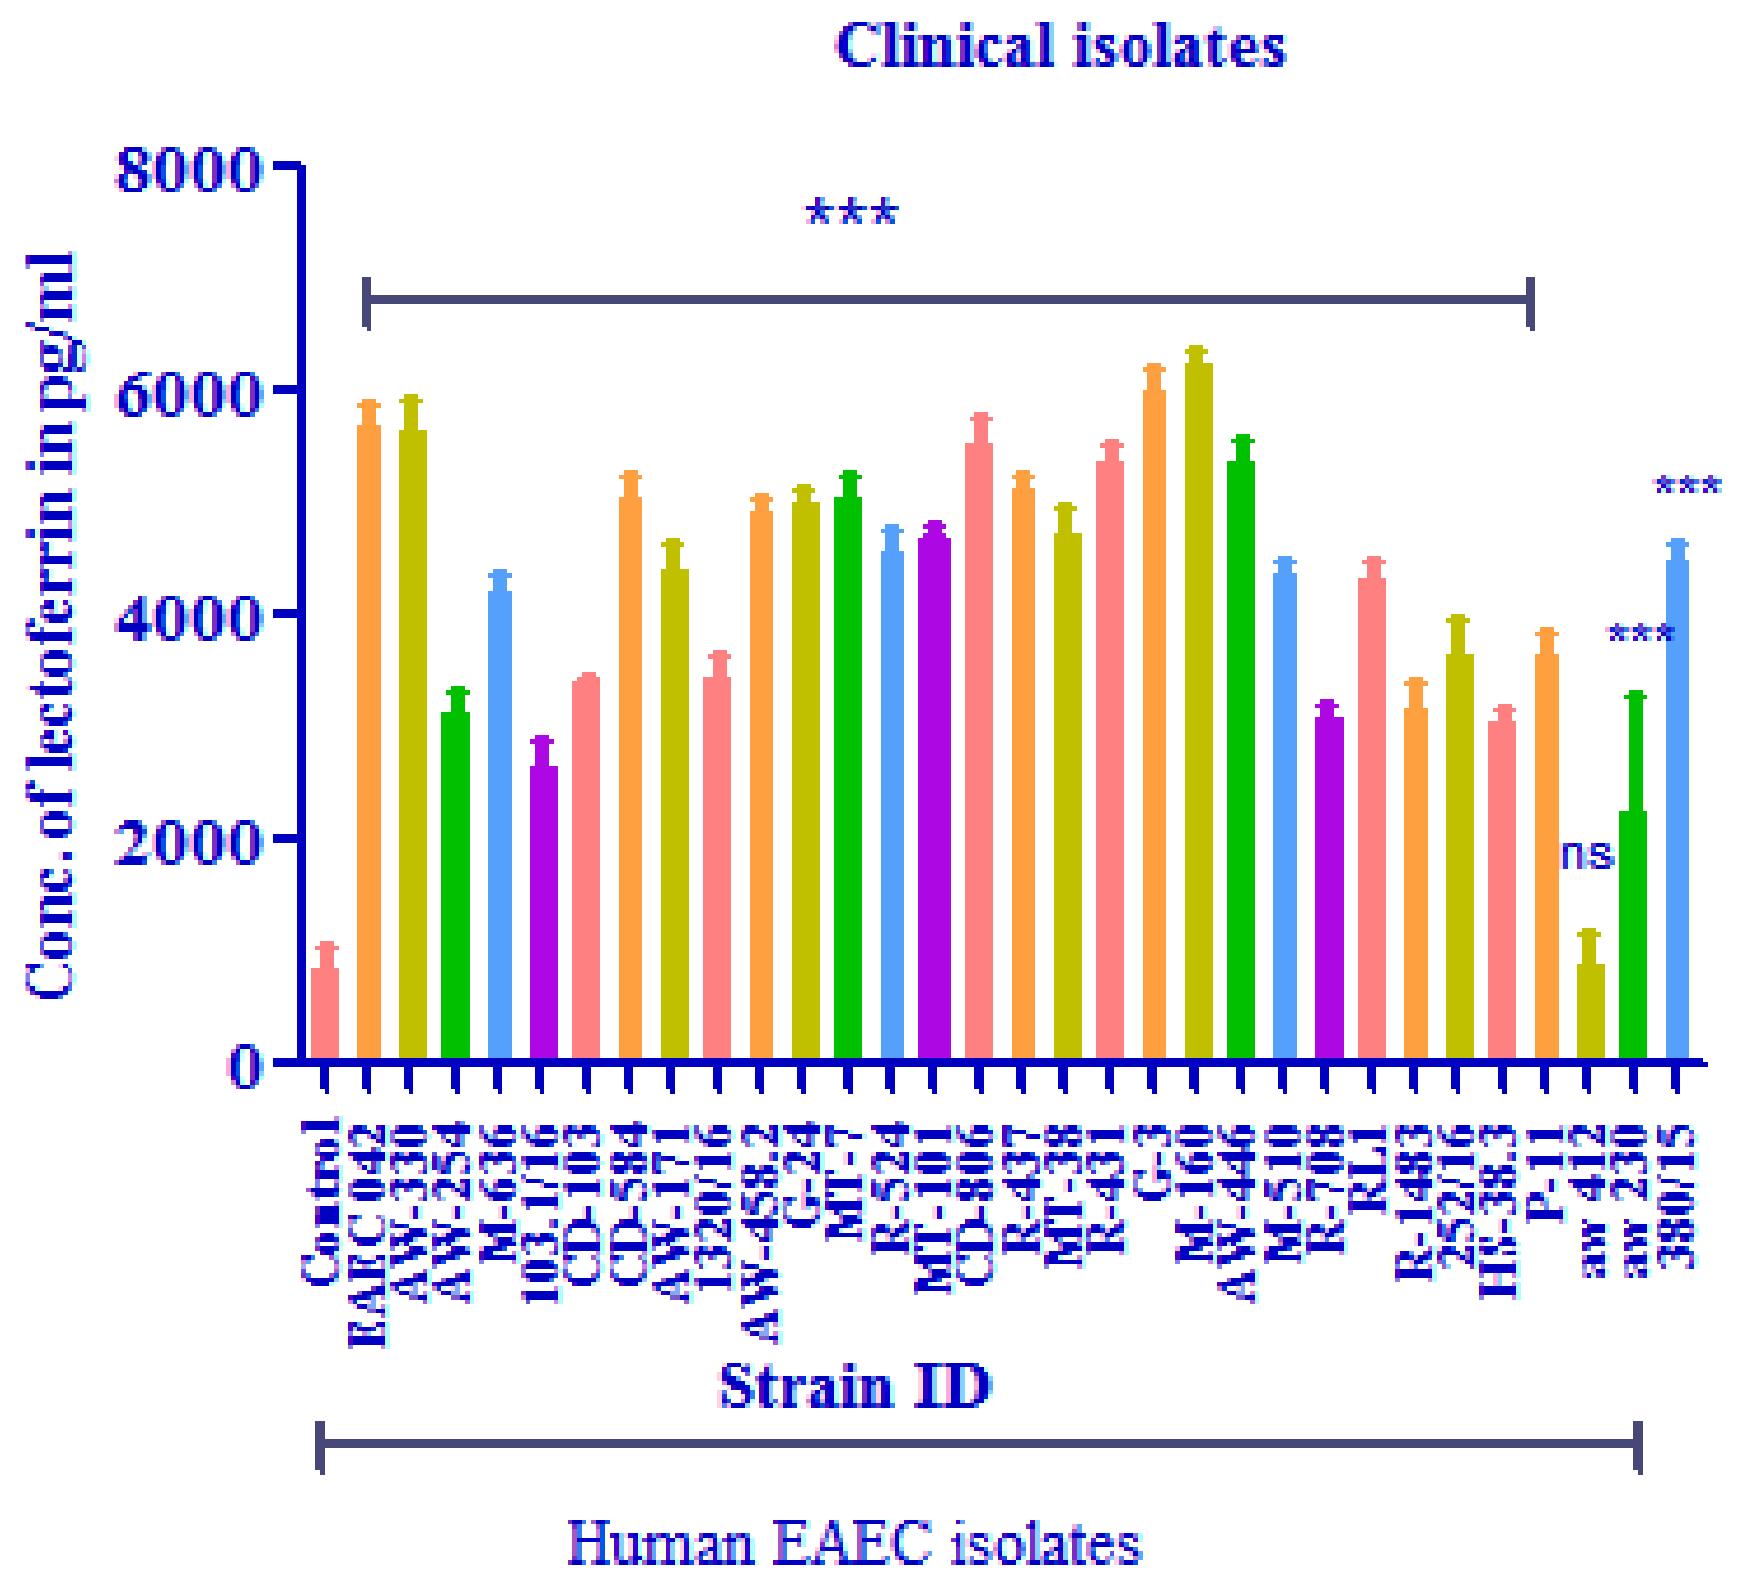
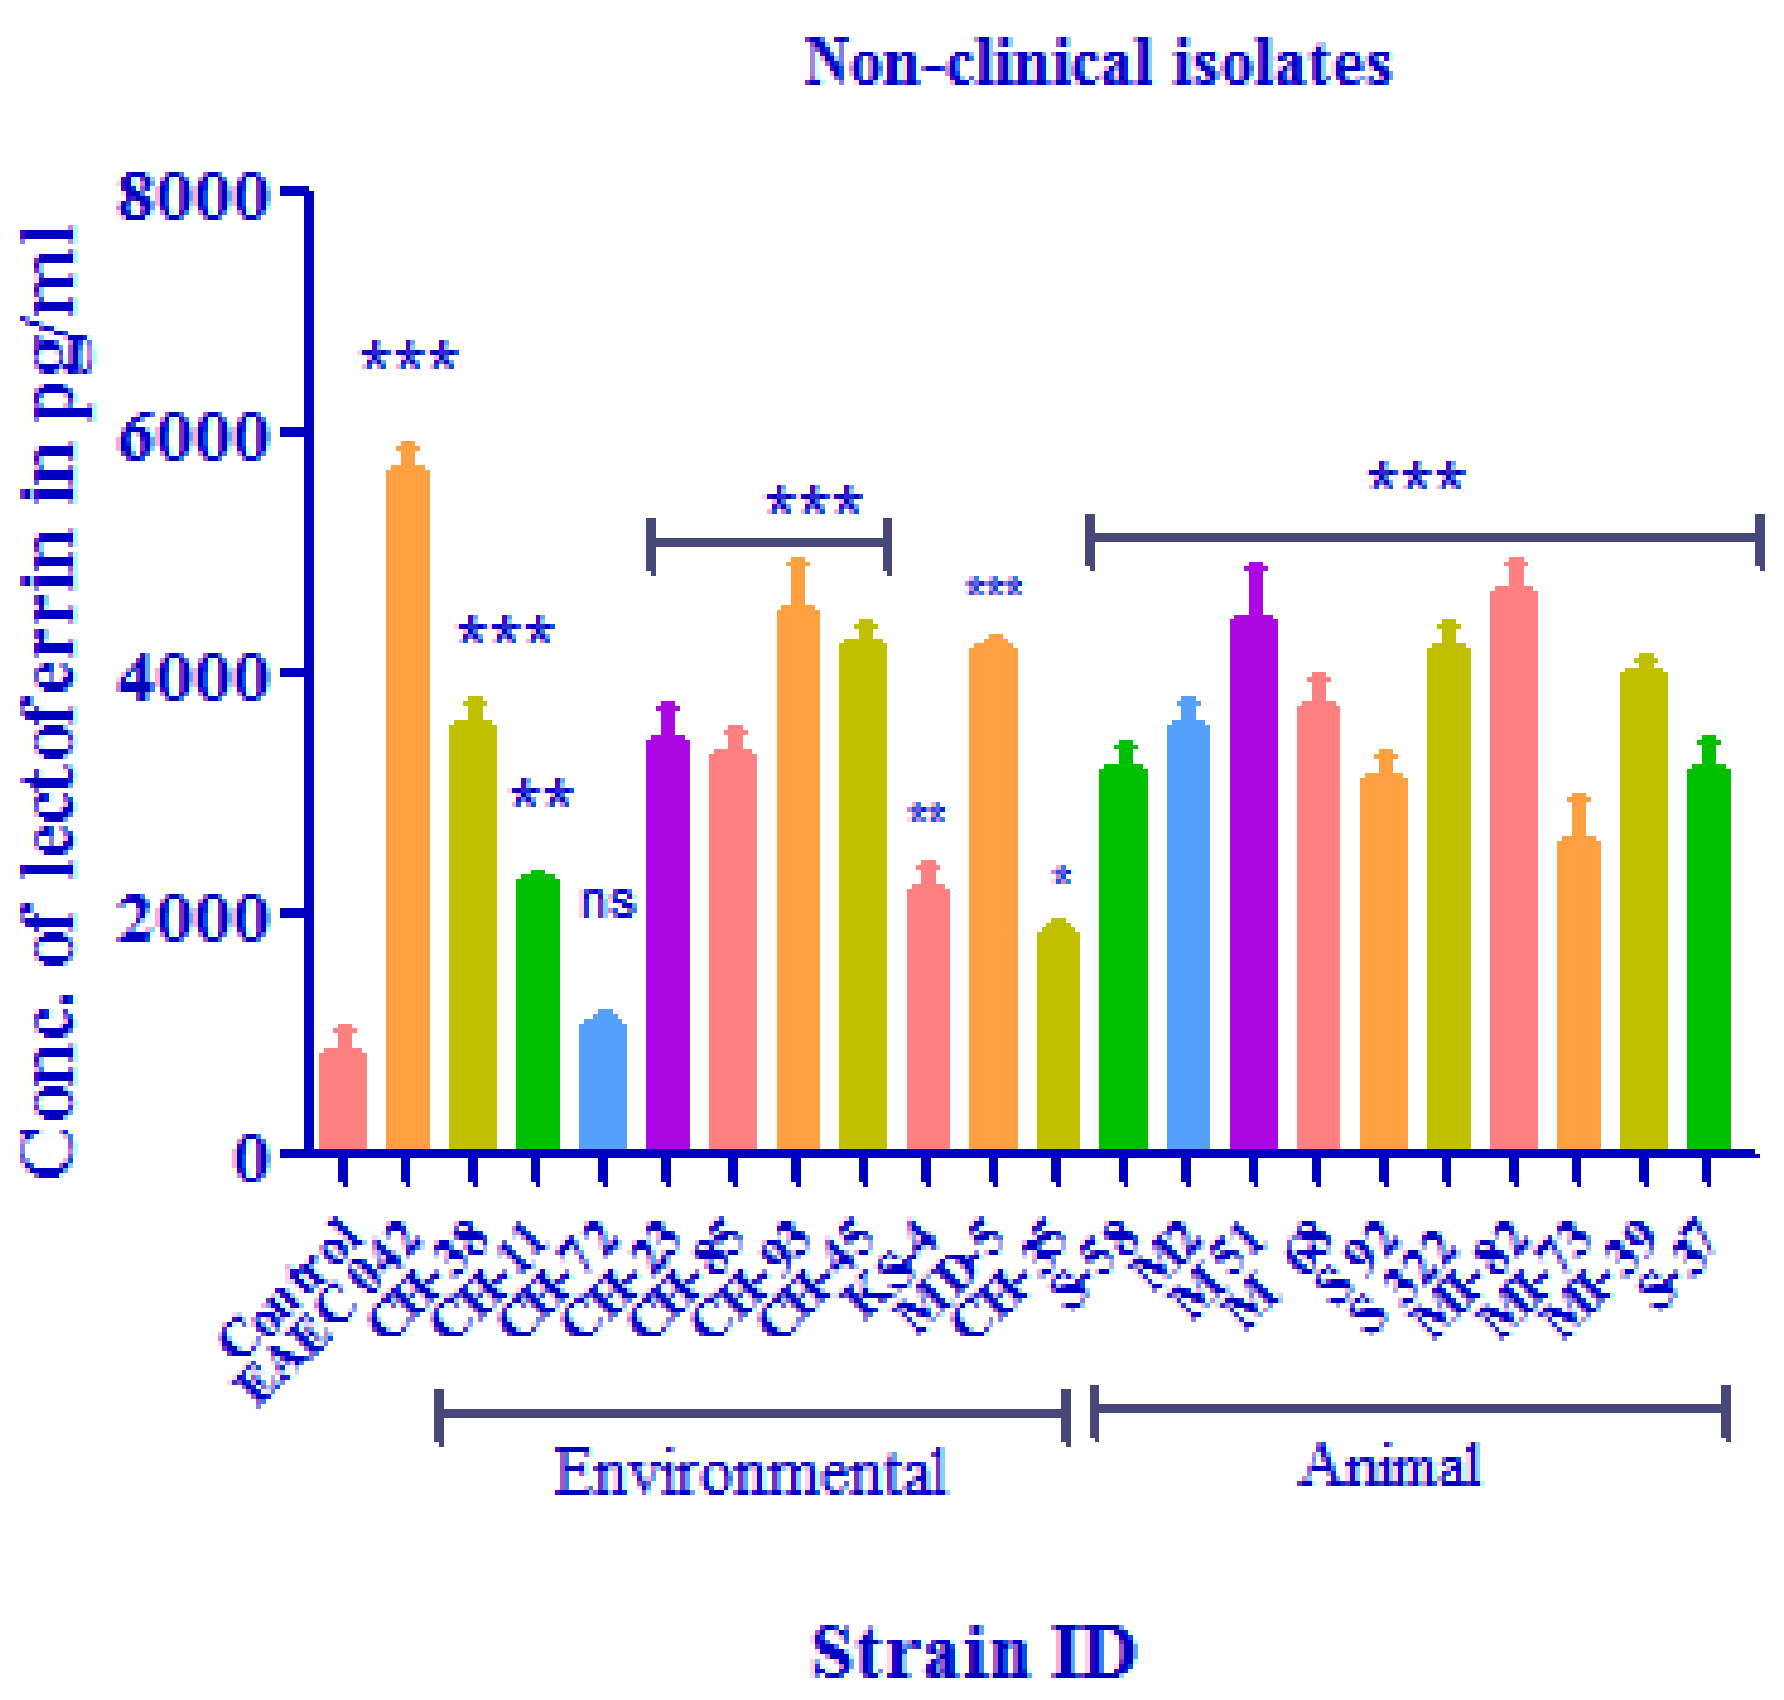
3.3.2. Lactoferrin Levels

The inflammatory analysis revealed that all the EAEC strains isolated from the different sources of human origin sources released lactoferrin to varying concentrations after 24 h of EAEC infection. Lactoferrin is bactericidal to enteric pathogens, modulates the intestinal immune response, and is released by neutrophils into the stool in response to infection.
The concentration of lactoferrin was detected in all groups infected with the EAEC isolates of human origin, except for one strain from a healthy child (AW-412). Similarly, the concentration of lactoferrin was detected in all groups infected with the EAEC isolates of animal and environmental origin, except for one strain from an environmental source (Chutney) (CH-72), as shown in Figure 2 and Figure 3.

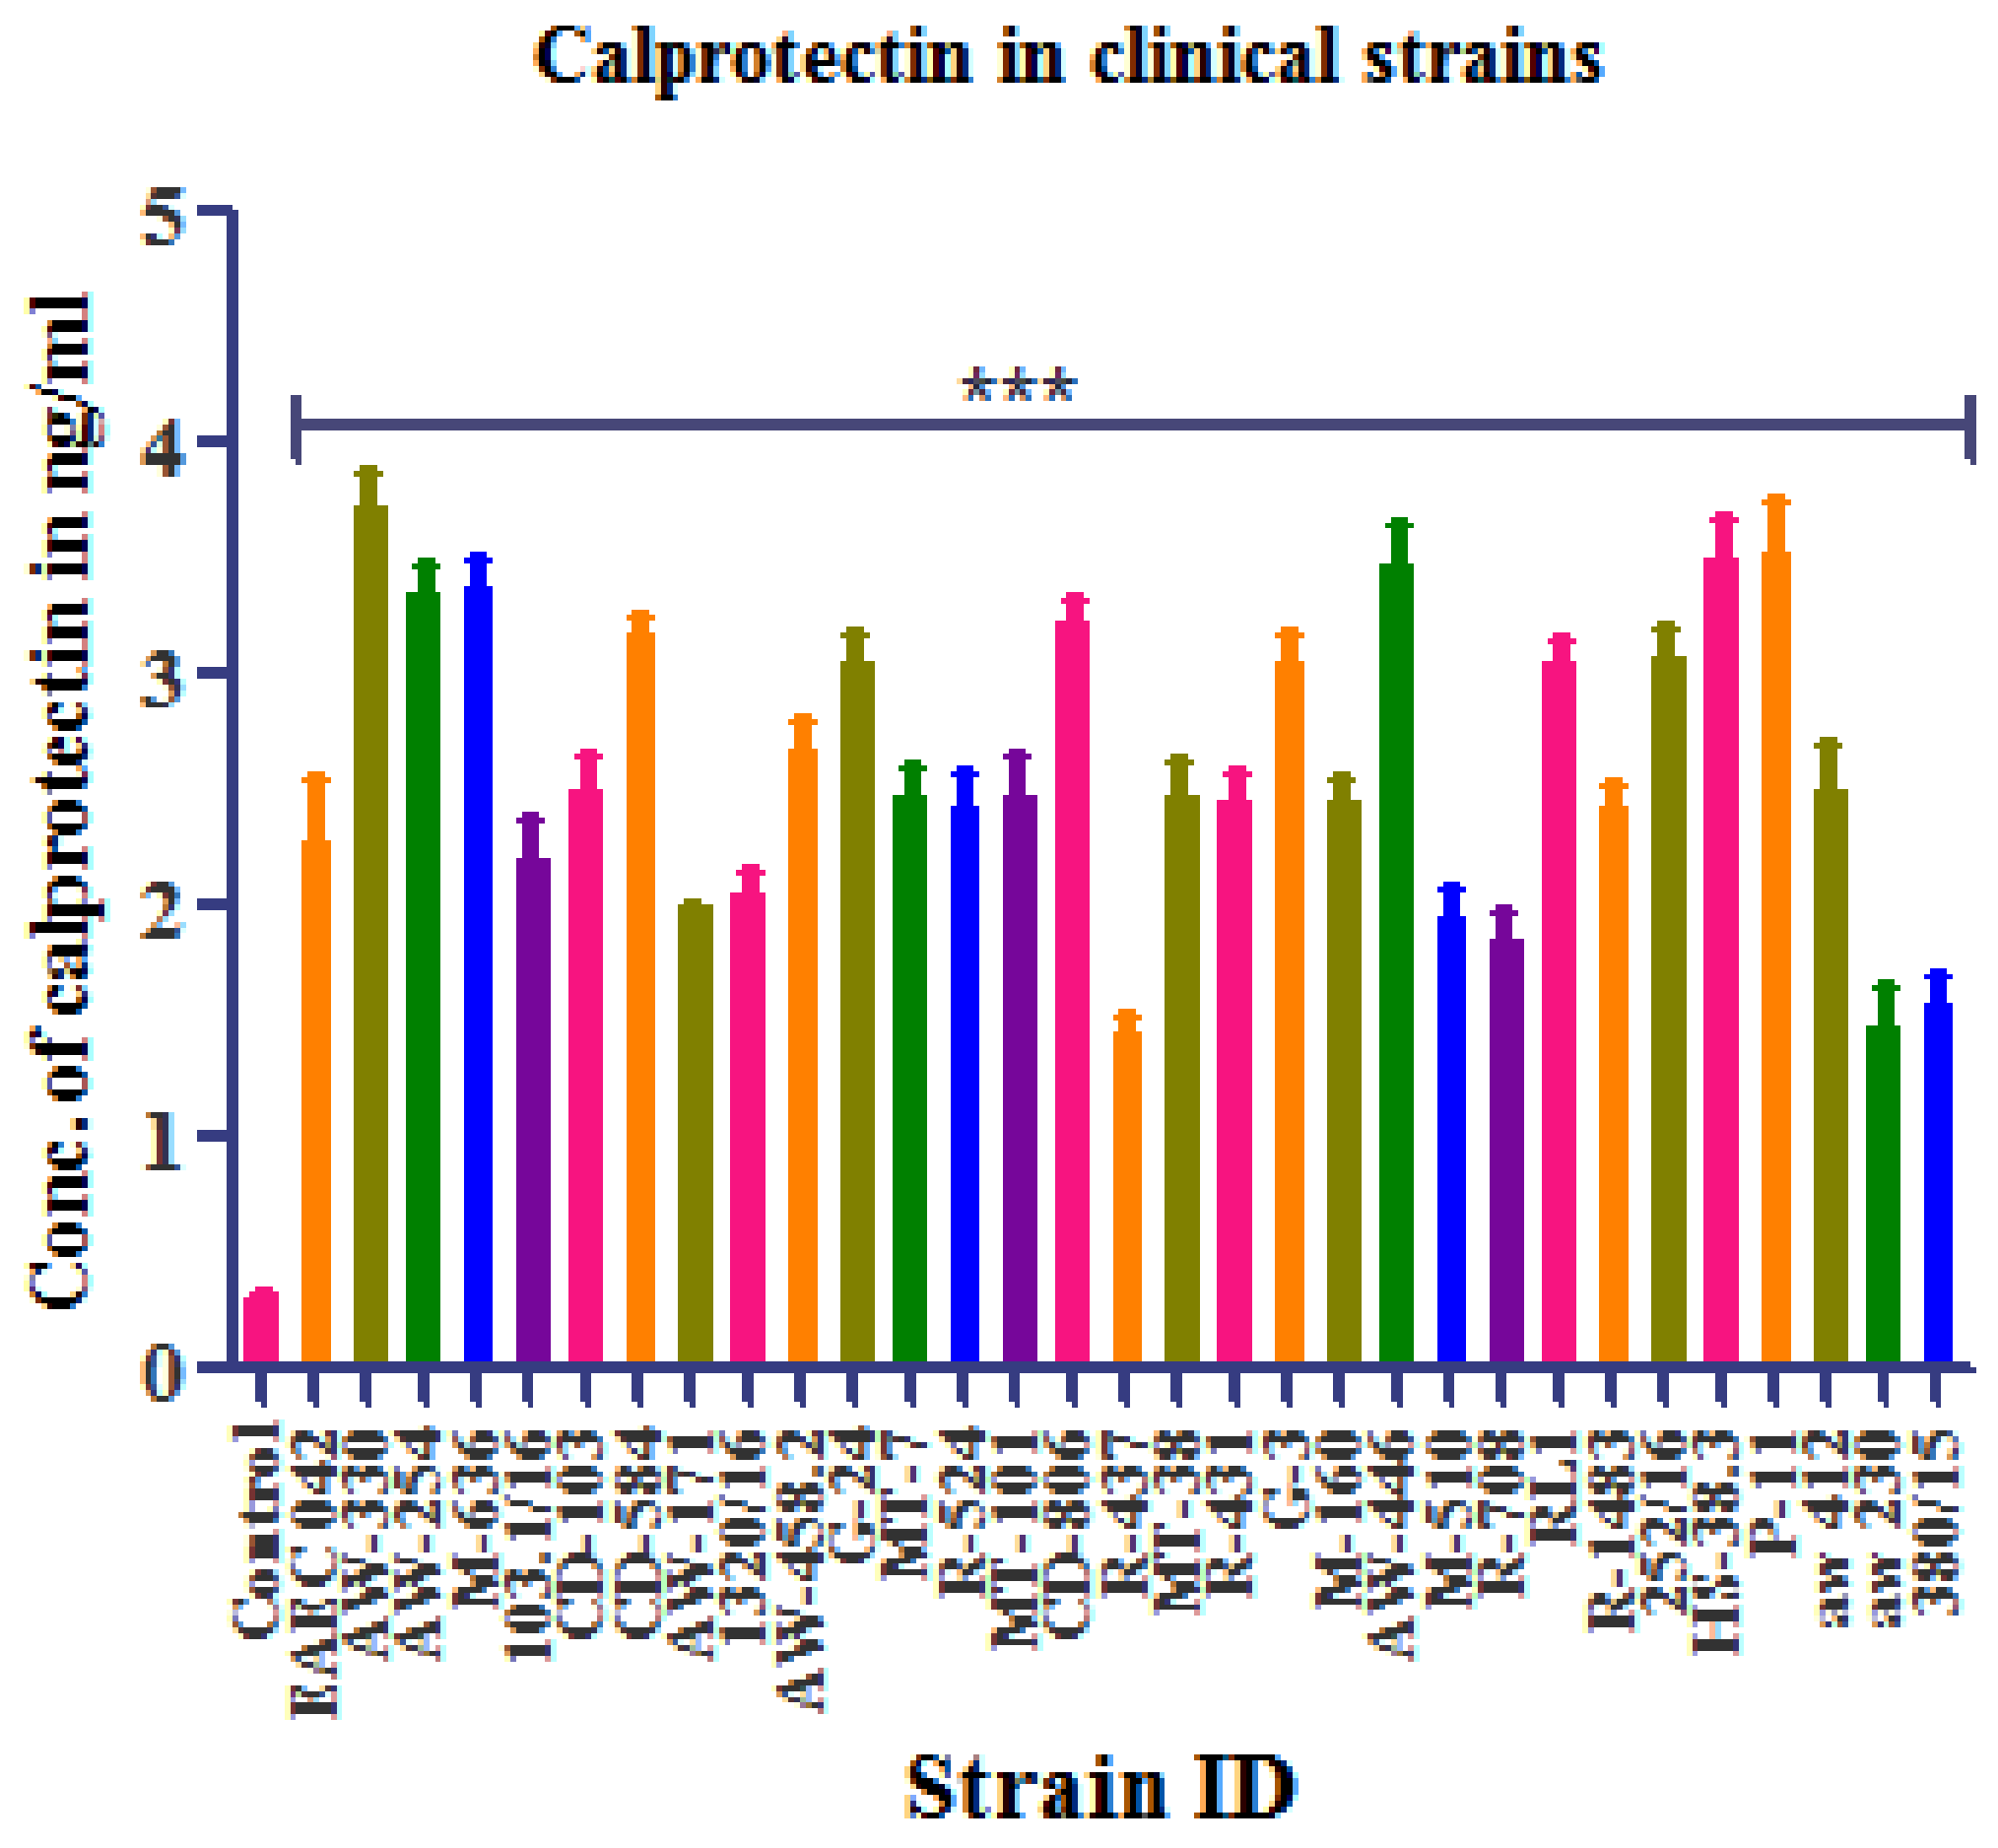
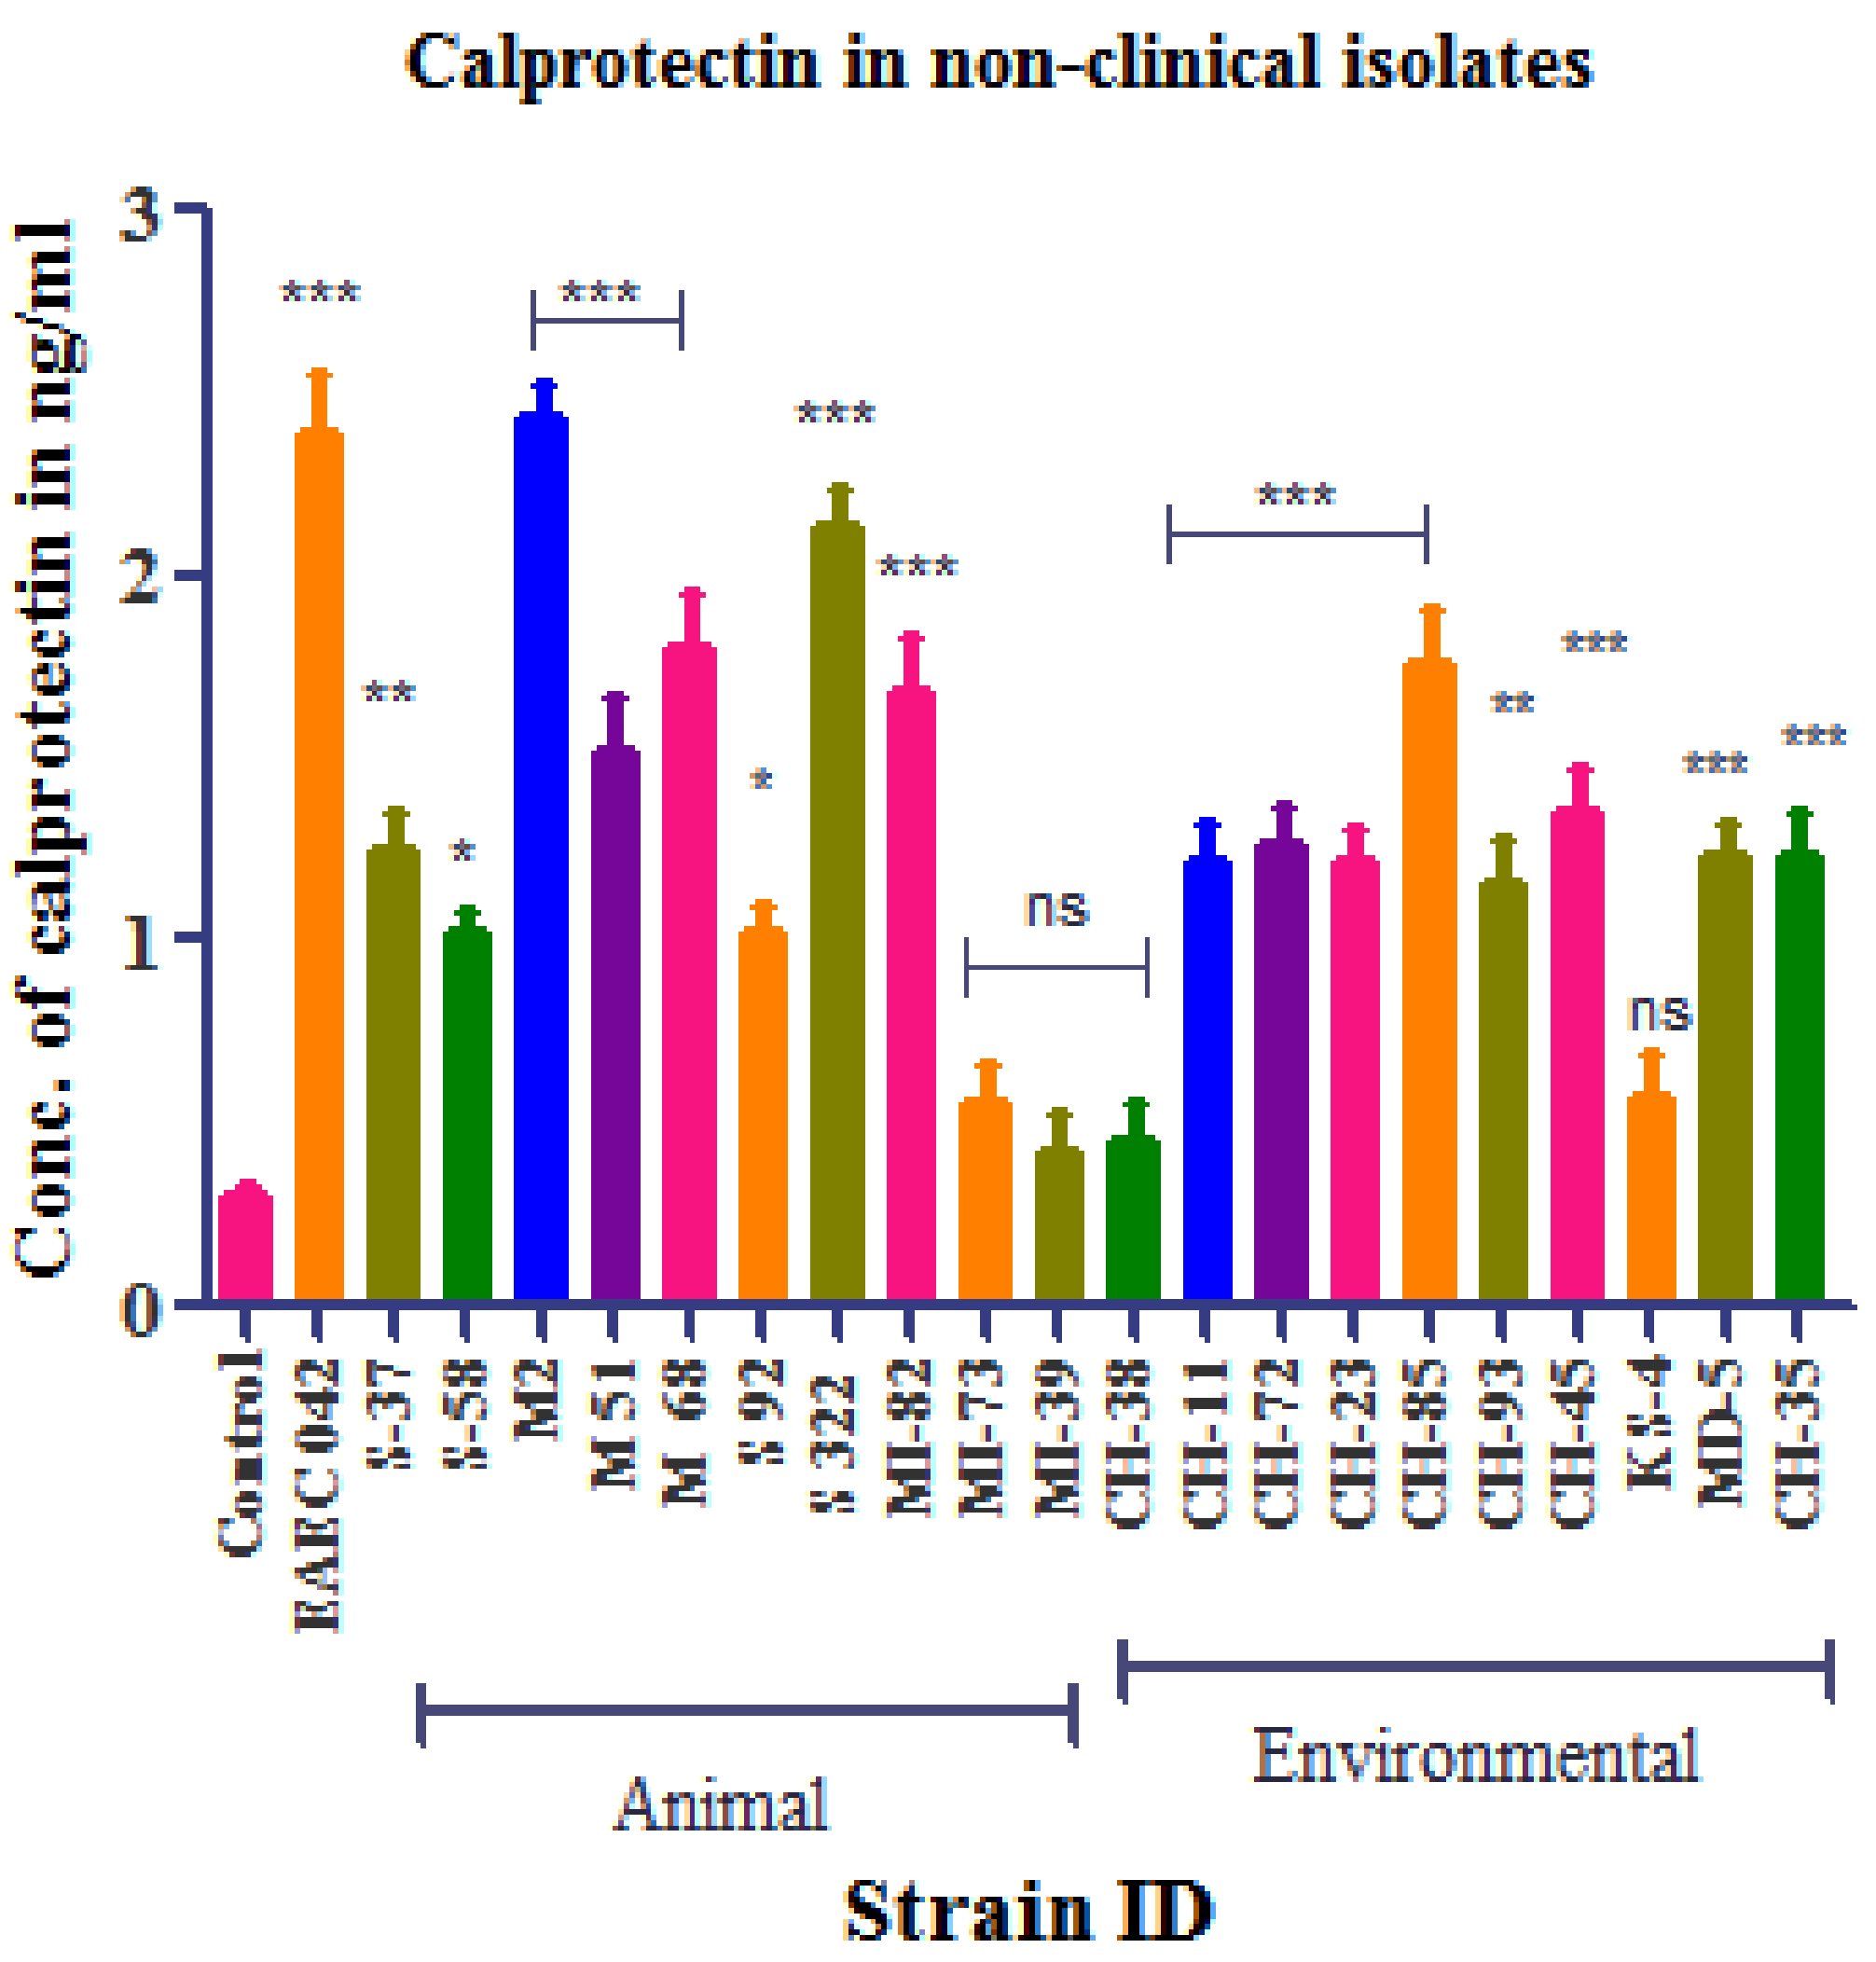
3.4. Calprotectin Detection
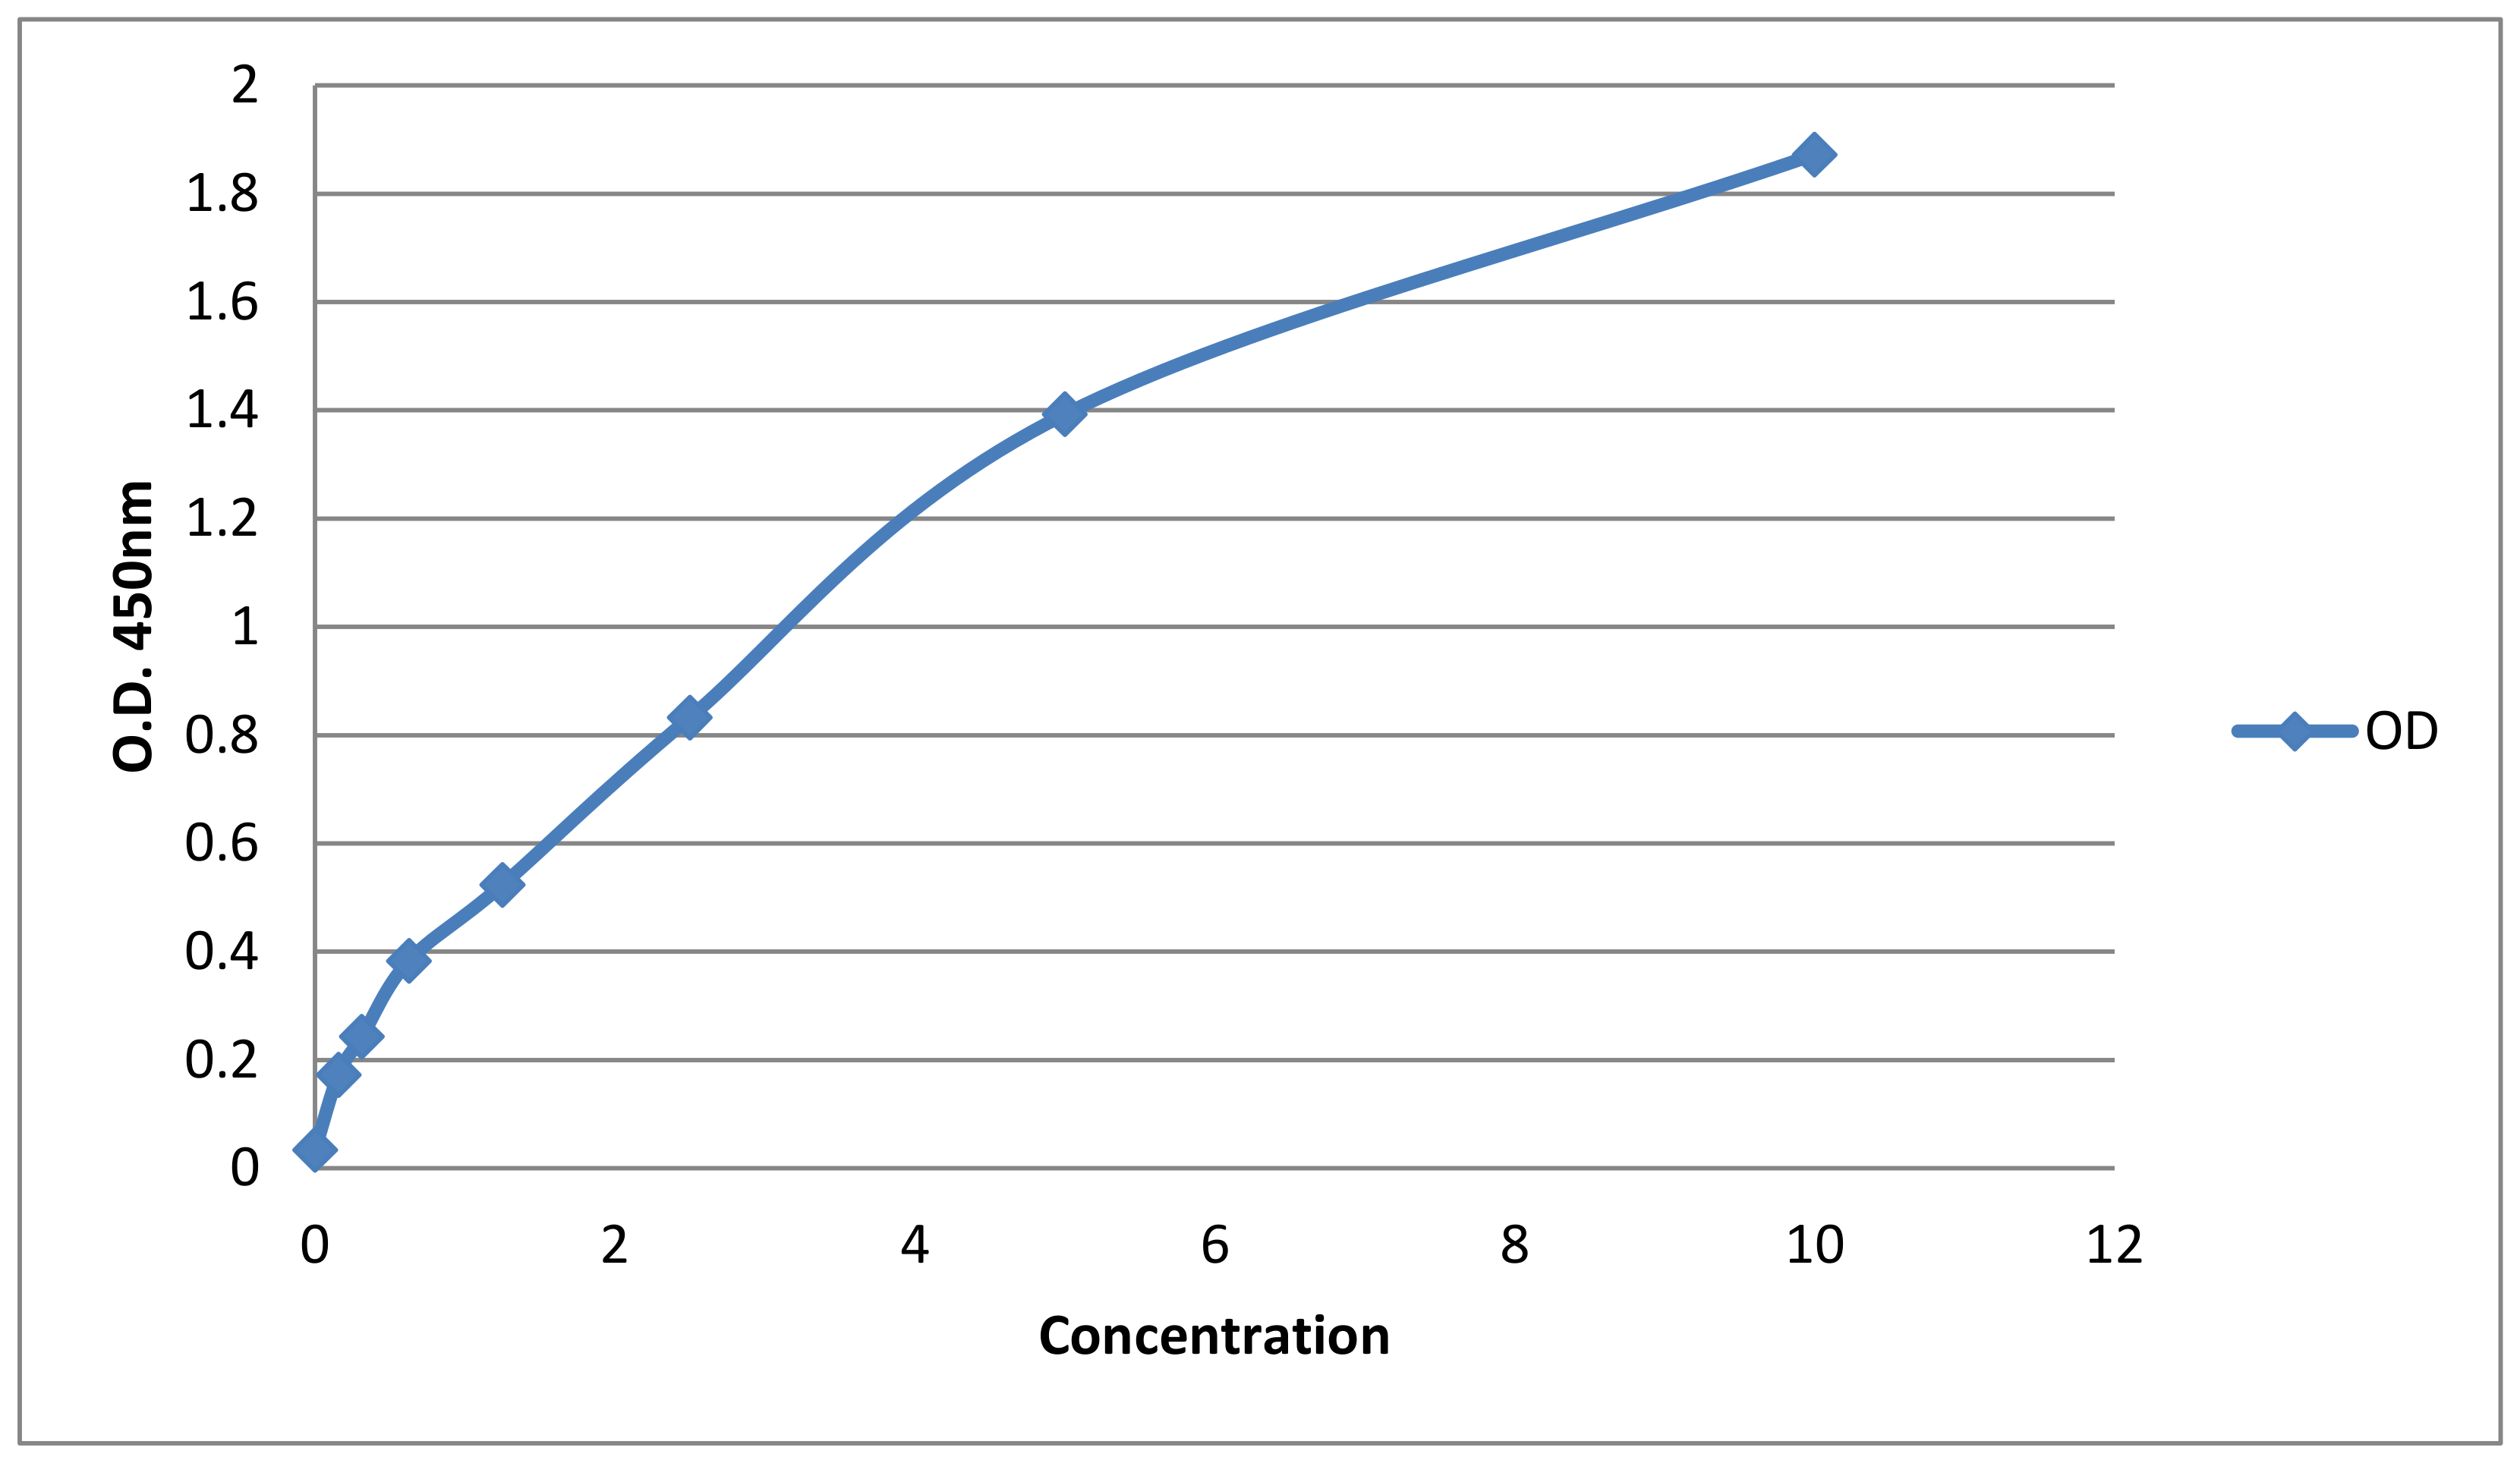
Standard Curve

The results of a typical standard run of calprotectin ELISA kit are shown below. The X-axis shows the concentration of calprotectin, and the y-axis shows the O.D value (Figure 4).
The concentration of calprotectin was detected in all groups infected with the EAEC isolates of human origin. Similarly, the concentration of calprotectin was detected in all groups infected with the EAEC isolates of animal and environmental origin, except for two strains from environmental sources and two strains from animal sources, as shown in Figure 5 and Figure 6.

3.5. Association of EAEC with Intestinal Tissue

Despite its occurrence in stool, the quantification and time course of EAEC associated with intestinal mucosa in vivo is unclear. Therefore, the stool samples from mice infected with EAEC strains from different sources on days 1, 5, 10, and 15 were examined for the presence of attA by RT-PCR. In human and animal EAEC-challenged mice, the attA gene was detected in stool up to 15 days after the challenge, as compared to 10 days in mice challenged with EAEC from environmental sources, as shown in Figure S4 (Supplementary Data). Taken together, these results suggest that colonization by EAEC strains from different sources (human and animal) occurs up to 10–15 days after the challenge.

3.6. Histopathological Analysis:

In order to understand the pathogenesis of EAEC in the BALB/c mice, the intestinal histopathological changes of the ileum region were analyzed on day 1 and day 15 after being challenged by infection with the EAEC strain. Histopathological analysis revealed that the ileum showed disrupted surface epithelium and exudates and grossly widened villous lamina propria with inflammatory cellular infiltrates. The histomorphology of ileal tissue on the 15th day showed a normal appearance, which was almost similar to that of the control, as shown in Figure 7A,C.

4. Discussion

EAECs are usually transmitted feco-orally via contaminated food or water [35]. The clinical manifestations of EAEC gastroenteritis include watery, mucoid, low-grade secretory diarrhea, occasionally grossly bloody stools, and little to no vomiting, as evidenced in sporadic cases, outbreaks, and volunteer studies [1,36,37]. Not all EAECs are pathogenic. Various animal models of EAEC infection have been used to elucidate EAEC pathogenesis. Studies ofthe isolated ligated intestinal loops of NZB rabbits, Fischer 344 rats, and 24-h-old gnotobiotic piglets [8,9] observed the multiple layers of aggregated bacteria coating an intact surface epithelium. An animal study using BALB/c mice in Kolkata, India, revealed that EAEC causes typical inflammation in the gut microvilli. The study also shows that mice could be a convenient and effective model for the further study of EAEC pathogenesis. However, the study was limited to a smaller number of mice and EAEC strains. Additionally, longitudinal studies of the growth velocity of the host, the intensity and duration of stool shedding of the bacterium, and the total duration of bacterial association with tissue were not analyzed for EAEC, thereby causing various clinical manifestations from non-clinical sources. In our study, we have used the same model to understand and compare the virulence of EAEC isolates from human, animal, and other diverse sources. We have assessed and compared the colonization and inflammatory markers produced by EAEC.
Various reports from Brazilian children infected with EAEC [20,21,38] have shown the presence of fecal lactoferrin, pro-inflammatory cytokines, IL-1β, and interleukin (IL)-8. Nataro et al., also reported thatinfection with EAEC inpatients leads to higher IL-1β to IL-1ra ratiosthan control subjects [39]. The elevated fecal levels of IL-8, IL-1β, and IL-1ra have been observed with EAEC-associated diarrhea in travelers from India [40]. In the present study, when we looked at the related fecal lactoferrin and calprotectin levels, a symptomatic EAEC infection was associated with the most severe inflammatory response in mice. Moreover, EAEC strains from non-diarrheal children also had elevated fecal lactoferrin and calprotectin concentrations, except for one strain. Our results are supported by a study from Southern Ghana, where a high lactoferrin level was detected in diarrheal and non-diarrheal children who had EAEC infection [40]. However, the mean levels of lactoferrin and calprotectin in non-diarrheal EAEC-isolated strains were lower than in diarrheal EAEC in our study. Our results were contradictory to the analysis of inflammatory markers in travelers returning from India, where no inflammatory markers were detected in commensal EAEC from stools [41]. It has been postulated that the presence of EAEC in the stool significantly impairs growth, regardless of the presence or absence of diarrhea [4]. This is proved experimentally by Roche et al. in the neonatal and weaned mice model, where EAEC infection causes growth shortfalls and triggers severe under nutrition [4]. In our study, similar colonization and weight loss were produced by EAEC isolated from non-diarrheal stools.
In our findings, non-clinical EAEC isolates had a lower concentration of fecal lactoferrin and calprotectin than EAEC from clinical sources. One possible cause for the difference in the gastrointestinal markers of EAEC-associated diarrhea infection is that not all strains are infective [21]. An earlier study has shown that virulent species elicit a particular inflammatory response throughout infection, while less pathogenic strains do not elicit a particular inflammatory response during the disease [38]. Many plasmid-coded virulence factors that clarify the pathogenic ability of EAEC strains have recently been identified [21]. These include: adhesive variants (AAF/I-IV), which are known to play a role in the adhesion of the mucosa; pet (a plasmid-coded toxin); aaiC (a secreted protein); EAST-1 (a heat-stable enterotoxin); and aggR (a master regulator gene), which are found to cause inflammation [42]. We found that between diarrhea and non-diarrhea stool isolates, the presence of chromosomal genes (aap, aaiC, and SPATEs), the adhesive variants of EAEC, and the master regulator gene aggR were associated with higher levels of lactoferrin and calprotectin. Additionally, more virulence EAEC genes detected in diarrheal EAEC isolates corresponded to a rise in fecal lactoferrin and calprotectin levels. In the non-clinical EAEC isolates, the presence of a lower number of virulence genes could be responsible for lower virulence in our mice model. In Nigerian children with EAEC infection, differing levels of virulence were also seen, where more EAEC virulence genes corresponded to an increase in fecal lactoferrin level [43]. Virulence factors are associated with elevated levels of fecal cytokines and inflammatory markers, such as interleukin (IL)-1ra, IL-1β, IL-8, interferon (INF)-γ, lactoferrin, fecal leukocytes, and occult blood [20]. EAEC carrying virulence factors are not always associated with the disorder. Factors, such as host genetic susceptibility, host immune response, heterogeneity of virulence among EAEC strains, and the number of bacteria consumed by the infected host, are responsible for the myriad variations of EAEC inflammation.
In IBDpatients, a correlation between E. coli containing the chuA gene has been identified. These strains were mostly able to colonize the GIT mucosa and survive inside the epithelial cells [25]. Seventy percent (9/13) of EAEC isolated from acute diarrheal cases in our study was assigned to groups B2 (4 isolates) and D (5 isolates). In addition, 85% (12/14) of EAEC strains from clinical and non-clinical sources, which show colonization upto10–15 days, belonged to phylogroups B2 (4 isolates) and D (7 isolates). Furthermore, a previous study confirmed that the mean calprotectin levels were significantly increased in IBD patients colonized with the E. coli of the B2 phylogenetic group. It also demonstrated that patients colonized with E. coli belonging to phylogroups B2 and D had significantly increased inflammation when compared to patients colonized with the E. coli of group A [44]. These results were in agreement with the results of the present study, where a high level of inflammatory markers was found with group D, followed by group B2, group B1, and then group A [45]. However, the results of our study demonstrated higher virulence scores with group B2 in the clinical isolates. Smaller numbers of isolates in non-clinical isolates belonging to phylogroup B2, and which carry fewer virulence genes, may be responsible for lower virulence in the animal model.
Concurrently, we find that some of the isolates that were obtained from animal and environmental sources do not cause severe disease in our mice model. EAEC infection results in functional and anatomical changes in intestinal epithelial cells following invasion and adherence to the gut of BALB/c mice. Using this mice model, the oral challenge with EAEC strains was associated with growth shortfalls and the persistent shedding of organisms over 14 days. We found that the ability of EAEC strains to infect mice with EAEC, thereby resulting in growth shortfalls and prolonged stool shedding, is similar to the Baltimore study [4]. The appearance of inflammatory markers in the stool is indicative of intrusive etiology, and inflammatory diarrhea can be calculated on the basis of this assessment. Defective surface mucosa with inflammatory infiltrates in lamina propria and sub mucosa was revealed by the histological sections of ileal tissue. On the 5th day after infection, maximum fecal shedding was noted, and histopathological changes confirmed this observation. In the mice model, fecal shedding of the organisms and histological modifications encourage moderate inflammation. After the 7th day after the infection, the normal recovery of animals occurred in due course of time.
In conclusion, this study revealed that EAEC, even from non-diarrheal stools and non-clinical sources, had the potential to cause prolonged colonization, weight loss, and inflammation in the intestine, though the degree varied. Moreover, a better understanding of EAEC pathogenic pathways is desperately needed in different clinical scenarios. The animal model of EAEC infection used in this study would be a significant step in this effort.

Supplementary Materials

The following supporting information can be downloaded at: https://www.mdpi.com/article/10.3390/microbiolres13040062/s1, Figure S1: Mean weight change (gram) in Balb/C mice challenged with EAEC isolates from the human; Figure S2: Mean weight change (gram) in Balb/C mice challenged with EAEC isolates from non-clinical (animal and environment) sources; Figure S3: Stool shedding of EAEC in treated Balb/C mice infected with EAEC isolates of (A) human, (B) animal and (C) environmental origin; Figure S4: Colonization and persistence of EAEC (detected by attA gene of EAEC) isolate in Balb/C mice from (A) human origin, (B) animal origin and (C) environmental origin; Table S1: Primers with description of the target gene, product size in base pairs, and annealing temperature, used for the 4 multiplex polymerase chain reactions (M-PCRs) and 3 monoplex PCRs; Table S2: Primers used for the triplex polymerase chain reactions target gene description, base-pair size, annealing temperature, and primers concentration; Table S3: Shows the group of mice to be tested.

Author Contributions

V.M. and N.T. participated in the data interpretation, as well as drafting and reviewing the manuscript. C.N., H.K., V.K.Y., N.C., V.K., B.M. and A.B. participated in the methodology and data interpretation. All authors have read and agreed to the published version of the manuscript.

Funding

This research was supported by the University Grant Commission (UGC) (Sr. No. 20614305077, Ref No: 22/06/2014(i)EU-V).

Institutional Review Board Statement

The study was conducted in accordance with the declaration of Helsinki, and approved by the Institutional Ethics Committee of the Postgraduate Institute of Medical Education and Research (PGIMER), Chadigarh, India (INT/IEC/2017/173). The animal study protocol was approved by the institutional animal ethics committee (Ref. No. 93/IAEC/650) of PGIMER, Chandigarh, India.

Informed Consent Statement

Informed consent was obtained from all subjects involved in the study.

Data Availability Statement

The datasets generated and/or analyzed during the current study are available from the corresponding author on reasonable request.

Acknowledgments

We acknowledge the kind support of animal house authorities for facilitating the animal work.

Conflicts of Interest

The authors have declared that no conflict of interest exist.

References

  1. Elias, W.P.; Navarro-Garcia, F. Enteroaggregative Escherichia coli (EAEC). Escherichia coli Am. 2016. [Google Scholar] [CrossRef]
  2. Huang, D.B.; Mohanty, A.; DuPont, H.L.; Okhuysen, P.C.; Chiang, T. A review of an emerging enteric pathogen: Enteroaggregative Escherichia coli. J. Med. Microbiol. 2006, 55, 1303–1311. [Google Scholar] [CrossRef] [PubMed] [Green Version]
  3. Modgil, V.; Mahindroo, J.; Narayan, C.; Kalia, M.; Yousuf; Shahi, V.; Koundal, M.; Chaudhary, P.; Jain, R.; Sandha, K.S.; et al. Comparative analysis of virulence determinants, phylogroups, and antibiotic susceptibility patterns of typical versus atypical enteroaggregative, E. coli in India. PLoS Negl. Trop. Dis. 2020, 14, e0008769. [Google Scholar] [CrossRef] [PubMed]
  4. Roche, J.K.; Cabel, A.; Sevilleja, J.; Nataro, J.; Guerrant, R.L. Enteroaggregative Escherichia coli (EAEC) impairs growth while malnutrition worsens EAEC infection: A novel murine model of the infection malnutrition cycle. J. Infect. Dis. 2010, 202, 506–514. [Google Scholar] [CrossRef] [Green Version]
  5. Mathewson, J.J.; Jiang, Z.D.; Zumla, A.; Chintu, C.; Luo, N.; Calamari, S.R.; Genta, R.M.; Steephen, A.; Schwartz, P.; DuPont, H.L. HEp-2 cell-adherent Escherichia coli in patients with human immunodeficiency virus-associated diarrhea. J. Infect. Dis. 1995, 171, 1636–1639. [Google Scholar] [CrossRef]
  6. Huang, D.B.; Mohamed, J.A.; Nataro, J.P.; DuPont, H.L.; Jiang, Z.-D.; Okhuysen, P.C. Virulence characteristics and the molecular epidemiology of enteroaggregative Escherichia coli isolates from travellers to developing countries. J. Med. Microbiol. 2007, 56, 1386–1392. [Google Scholar] [CrossRef] [Green Version]
  7. Modgil, V.; Chaudhary, P.; Bharti, B.; Mahindroo, J.; Yousuf; Koundal, M.; Mohan, B.; Taneja, N. Prevalence, Virulence Gene Profiling and Characterization of Enteroaggregative Escherichia coli from Acute Diarrhea, Asymptomatic Nourished and Malnourished Children Less Than 5 Years of Age in India. J. Pediatr. 2021, 234, 106–114.e5. [Google Scholar] [CrossRef]
  8. Tzipori, S.; Montanaro, J.; Robins-Browne, R.M.; Vial, P.; Gibson, R.; Levine, M.M. Studies with enteroaggregative Escherichia coli in the gnotobiotic piglet gastroenteritis model. Infect. Immun. 1992, 60, 5302–5306. [Google Scholar] [CrossRef] [Green Version]
  9. Vial, P.A.; Robins-Browne, R.; Lior, H.; Prado, V.; Kaper, J.B.; Nataro, J.P.; Maneval, D.; Elsayed, A.-E.-D.; Levine, M.M. Characterization of enteroadherent-aggregative Escherichia coli, a putative agent of diarrheal disease. J. Infect. Dis. 1988, 158, 70–79. [Google Scholar] [CrossRef] [Green Version]
  10. Rüttler, M.E.; Renna, N.F.; Balbi, L.; García, B.; Guidone, L.; Fernández, R.; Puig, O.; Ortiz, A. Characterization of enteroaggregative Escherichia coli strains isolated from children with acute diarrhea, in Mendoza, Argentina. Rev. Argent Microbiol. 2002, 34, 167–170. [Google Scholar]
  11. Nezarieh, R.; Shakibaie, M.R.; Nave, H.H.; Norouzi, A.; Salajegheh, G.; Hayatbakhsh, M. Distribution of virulence genes, enterotoxin and biofilm formation among enteroaggregative Escherichia coli (EAEC) strains isolated from stools of children with diarrhea in South East Iran. Arch. Pediatr. Infect. Dis. 2015, 3. [Google Scholar] [CrossRef]
  12. Sarantuya, J.; Nishi, J.; Wakimoto, N.; Erdene, S.; Nataro, J.P.; Sheikh, J.; Iwashita, M.; Manago, K.; Tokuda, K.; Yoshinaga, M.; et al. Typical Enteroaggregative Escherichia coli Is the Most Prevalent Pathotype among E. coli Strains Causing Diarrhea in Mongolian Children. J. Clin. Microbiol. 2004, 42, 133–139. [Google Scholar] [CrossRef] [PubMed] [Green Version]
  13. Boisen, N.; Struve, C.; Scheutz, F.; Krogfelt, K.A.; Nataro, J.P. New adhesin of enteroaggregative Escherichia coli related to the Afa/Dr/AAF family. Infect. Immun. 2008, 76, 3281–3292. [Google Scholar] [CrossRef] [PubMed] [Green Version]
  14. Nataro, J.P.; Yikang, D.; Giron, J.A.; Savarino, S.J.; Kothary, M.H.; Hall, R. Aggregative adherence fimbria I expression in enteroaggregative Escherichia coli requires two unlinked plasmid regions. Infect. Immun. 1993, 61, 1126–1131. [Google Scholar] [CrossRef]
  15. Elias, W.P.; Czeczulin, J.R.; Henderson, I.R.; Trabulsi, L.R.; Nataro, J.P. Organization of biogenesis genes for aggregative adherence fimbria II defines a virulence gene cluster in enteroaggregative Escherichia coli. J. Bacteriol. 1999, 181, 1779–1785. [Google Scholar] [CrossRef] [Green Version]
  16. Ruiz-Perez, F.; Wahid, R.; Faherty, C.S.; Kolappaswamy, K.; Rodriguez, L.; Santiago, A.; Murphy, E.; Cross, A.; Sztein, M.B.; Nataro, J.P. Serine protease autotransporters from Shigella flexneri and pathogenic Escherichia coli target a broad range of leukocyte glycoproteins. Proc. Natl. Acad. Sci. USA 2011, 108, 12881–12886. [Google Scholar] [CrossRef] [Green Version]
  17. Boisen, N.; Ruiz-Perez, F.; Scheutz, F.; Krogfelt, K.A.; Nataro, J.P. Short report: High prevalence of serine protease autotransporter cytotoxins among strains of enteroaggregative Escherichia coli. Am. J. Trop. Med. Hyg. 2009, 80, 294–301. [Google Scholar] [CrossRef] [Green Version]
  18. Navarro-Garcia, F.; Gutierrez-Jimenez, J.; Garcia-Tovar, C.; Castro, L.A.; Salazar-Gonzalez, H.; Cordova, V. Pic, an autotransporter protein secreted by different pathogens in the Enterobacteriaceae family, is a potent mucus secretagogue. Infect. Immun. 2010, 78, 4101–4109. [Google Scholar] [CrossRef] [Green Version]
  19. Boisen, N.; Scheutz, F.; Rasko, D.A.; Redman, J.C.; Persson, S.; Simon, J.; Kotloff, K.L.; Levine, M.M.; Sow, S.; Tamboura, B.; et al. Genomic Characterization of Enteroaggregative Escherichia coli From Children in Mali. J. Infect. Dis. 2012, 205, 431–444. [Google Scholar] [CrossRef]
  20. Bouckenooghe, A.R.; Rodrigues, S.; Steffen, R.; Dupont, H.L.; Jiang, Z.D.; Mathewson, J.J.; Adachi, J.; Verenkar, M.P. Markers of enteric inflammation in enteroaggregative Escherichia coli diarrhea in travelers. Am. J. Trop. Med. Hyg. 2000, 62, 711–713. [Google Scholar] [CrossRef] [Green Version]
  21. Greenberg, D.E.; Jiang, Z.-D.; Steffen, R.; Verenker, M.P.; DuPont, H.L. Markers of inflammation in bacterial diarrhea among travelers, with a focus on enteroaggregative Escherichia coli pathogenicity. J. Infect. Dis. 2002, 185, 944–949. [Google Scholar] [CrossRef]
  22. Farnaud, S.; Evans, R.W. Lactoferrin—A multifunctional protein with antimicrobial properties. Mol. Immunol. 2003, 40, 395–405. [Google Scholar] [CrossRef]
  23. Legrand, D.; Elass, E.; Carpentier, M.; Mazurier, J. Lactoferrin: A modulator of immune and inflammatory responses. Cell Mol. Life Sci. 2005, 62, 2549–2559. [Google Scholar] [CrossRef] [PubMed]
  24. Philipson, C.W.; Bassaganya-Riera, J.; Hontecillas, R. Animal models of enteroaggregative Escherichia coli infection. Gut Microbes 2013, 4, 282–291. [Google Scholar] [CrossRef] [PubMed] [Green Version]
  25. Mirsepasi-Lauridsen, H.C.; Halkjaer, S.I.; Mortensen, E.M.; Lydolph, M.C.; Nordgaard-Lassen, I.; Krogfelt, K.A.; Petersen, A.M. Extraintestinal pathogenic Escherichia coli are associated with intestinal inflammation in patients with ulcerative colitis. Sci. Rep. 2016, 6, 31152. [Google Scholar] [CrossRef] [PubMed] [Green Version]
  26. Kotlowski, R.; Bernstein, C.N.; Sepehri, S.; Krause, D.O. High prevalence of Escherichia coli belonging to the B2+D phylogenetic group in inflammatory bowel disease. Gut 2007, 56, 669–675. [Google Scholar] [CrossRef] [Green Version]
  27. Harrington, S.M.; Dudley, E.G.; Nataro, J.P. Pathogenesis of enteroaggregative Escherichia coli infection. FEMS Microbiol. Lett. 2006, 254, 12–18. [Google Scholar] [CrossRef] [Green Version]
  28. Jafari, A.; Aslani, M.M.; Bouzari, S. Enteroaggregative Escherichia coli, a heterogenous, underestimated and under-diagnosed, E. coli pathotype in Iran. Gastroenterol. Hepatol. Bed. Bench 2013, 6, 71. [Google Scholar] [CrossRef]
  29. Myhal, M.L.; Laux, D.C.; Cohen, P.S. Relative colonizing abilities of human fecal and K 12 strains of Escherichia coli in the large intestines of streptomycin-treated mice. Eur. J. Clin. Microbiol. 1982, 1, 186–192. [Google Scholar] [CrossRef]
  30. Saha, D.R.; Guin, S.; Krishnan, R.; Nag, D.; Koley, H.; Shinoda, S.; Ramamurthy, T. Inflammatory diarrhea due to enteroaggregative Escherichia coli: Evidence from clinical and mice model studies. Gut Pathog. 2013, 5, 36. [Google Scholar] [CrossRef] [Green Version]
  31. Tarchouna, M.; Ferjani, A.; Ben-Selma, W.; Boukadida, J. Distribution of uropathogenic virulence genes in Escherichia coli isolated from patients with urinary tract infection. Int. J. Infect. Dis. 2013, 17, e450–e453. [Google Scholar] [CrossRef] [PubMed]
  32. Clermont, O.; Christenson, J.K.; Denamur, E.; Gordon, D.M. The Clermont Escherichia coli phylo-typing method revisited: Improvement of specificity and detection of new phylo-groups. Environ. Microbiol. Rep. 2013, 5, 58–65. [Google Scholar] [CrossRef] [PubMed]
  33. Clermont, O.; Bonacorsi, S.; Bingen, E. Rapid and simple determination of the Escherichia coli phylogenetic group. Appl. Environ. Microbiol. 2000, 66, 4555–4558. [Google Scholar] [CrossRef] [PubMed] [Green Version]
  34. Srinivasan, R.; Mohankumar, R.; Kannappan, A. Exploring the Anti-quorum Sensing and Antibiofilm Efficacy of Phytol against Serratia marcescens Associated Acute Pyelonephritis Infection in Wistar Rats. Front. Cell. Infect. Microbiol. 2017, 7, 498. [Google Scholar] [CrossRef] [PubMed] [Green Version]
  35. Jiang, Z.-D.; Greenberg, D.; Nataro, J.P.; Steffen, R.; DuPont, H.L. Rate of occurrence and pathogenic effect of enteroaggregative Escherichia coli virulence factors in international travelers. J. Clin. Microbiol. 2002, 40, 4185–4190. [Google Scholar] [CrossRef] [PubMed] [Green Version]
  36. Jenkins, C. Enteroaggregative Escherichia coli. Curr. Top. Microbiol. Immunol. 2018, 416, 27–50. [Google Scholar] [CrossRef]
  37. Chattaway, M.A.; Dallman, T.; Okeke, I.N.; Wain, J. Enteroaggregative E. coli O104 from an outbreak of HUS in Germany 2011, could it happen again? J. Infect. Dev. Ctries 2011, 5, 425–436. [Google Scholar] [CrossRef] [Green Version]
  38. Steiner, T.S.; Lima, A.A.M.; Nataro, J.P.; Guerrant, R.L. Enteroaggregative Escherichia coli Produce Intestinal Inflammation and Growth Impairment and Cause Interleukin-8 Release from Intestinal Epithelial Cells. J. Infect. Dis. 1998, 177, 88–96. [Google Scholar] [CrossRef] [Green Version]
  39. Nataro, J.P.; Kaper, J.B.; Robins-Browne, R.; Prado, V.; Vial, P.; Levine, M.M. Patterns of adherence of diarrheagenic Escherichia coli to HEp-2 cells. Pediatr. Infect. Dis. J. 1987, 6, 829–831. [Google Scholar] [CrossRef]
  40. Opintan, J.A.; Nataro, J.P.; Gepi-Attee, R.; Newman, M.J.; Guerrant, R.L.; Roche, J.K.; Affrim, R.; Sevilleja, J.E.A.D.; Ayeh-Kumi, P.F.; Warren, C.A. Pediatricdiarrhea in Southern Ghana: Etiology and association with intestinal inflammation and malnutrition. Am. J. Trop. Med. Hyg. 2010, 83, 936–943. [Google Scholar] [CrossRef] [Green Version]
  41. Canizalez-Roman, A.; Navarro-García, F. FodrinCaM-binding domain cleavage by Pet from enteroaggregative Escherichia coli leads to actin cytoskeletal disruption. Mol. Microbiol. 2003, 48, 947–958. [Google Scholar] [CrossRef] [PubMed]
  42. Morin, N.; Tirling, C.; Ivison, S.M.; Kaur, A.P.; Nataro, J.P.; Steiner, T.S. Autoactivation of the AggR regulator of enteroaggregative Escherichia coli in vitro and in vivo. FEMS Immunol. Med. Microbiol. 2010, 58, 344–355. [Google Scholar] [CrossRef] [PubMed]
  43. Okeke, I.N.; Lamikanra, A.; Czeczulin, J.; Dubovsky, F.; Kaper, J.B.; Nataro, J.P. Heterogeneous Virulence of Enteroaggregative Escherichia coli Strains Isolated from Children in Southwest Nigeria. J. Infect. Dis. 2000, 181, 252–260. [Google Scholar] [CrossRef] [PubMed] [Green Version]
  44. Micenková, L.; Frankovičová, L.; Jaborníková, I.; Bosák, J.; Dítě, P.; Šmarda, J.; Vrba, M.; Ševčíková, A.; Kmeťová, M.; Šmajs, D. Escherichia coli isolates from patients with inflammatory bowel disease: ExPEC virulence- and colicin-determinants are more frequent compared to healthy controls. Int. J. Med. Microbiol. 2018, 308, 498–504. [Google Scholar] [CrossRef]
  45. De La Fuente, M.; Franchi, L.; Araya, D.; Díaz-Jiménez, D.; Olivares, M.; Álvarez-Lobos, M.; Golenbock, U.; González, M.-J.; López-Kostner, F.; Quera, R.; et al. Corrigendum to “Escherichia coli isolates from inflammatory bowel diseases patients survive in macrophages and activate NLRP3 inflammasome”. Int. J. Med. Microbiol. 304 (3–4) (2014) 384–392. Int. J. Med. Microbiol. 2015, 305, 434. [Google Scholar] [CrossRef]
Figure 1. Standard curve: Results of a typical standard run of lactoferrin ELISA kit is shown above. The X-axis shows the concentration of lactoferrin, and the y-axis shows the O.D value.
Microbiolres 13 00062 g001
Figure 2. The concentration of lactoferrin (pg/mL) in BALB/c mice infected with the EAEC strain of human origin. *** p, 0.001; comparison by one-way ANOVA with Dunnett’s multiple comparison tests. NS = non-significant.
Microbiolres 13 00062 g002
Figure 3. The concentration of lactoferrin (pg/mL) in BALB/c mice infected with the EAEC strain of environmental and animal origin. * p, 0.05; ** p, 0.01; *** p, 0.001; comparison by one-way ANOVA with Dunnett’s multiple comparison tests. NS = non-significant.
Microbiolres 13 00062 g003
Figure 4. Standard curve: Results of a typical standard run of calprotectin ELISA kit is shown below. The X-axis shows the concentration of calprotectin, and the y-axis shows the O.D value.
Microbiolres 13 00062 g004
Figure 5. The concentration of calprotectin (ng/mL) in BALB/c mice infected with the EAEC strain of human origin. *** p, 0.001;comparison by one-way ANOVA with Dunnett’s multiple comparison tests. NS = non-significant.
Microbiolres 13 00062 g005
Figure 6. The concentration of calprotectin (ng/mL) in BALB/c mice infected with the EAEC strain of environmental and animal origin. * p, 0.05; ** p, 0.01; *** p, 0.001; comparison by one-way ANOVA with Dunnett’s multiple comparison tests. NS = non-significant.
Microbiolres 13 00062 g006
Figure 7. Shows mice intestine treated with PBS as control (A) EAEC strain-infected mice intestinal mucosa on 1st day showing disrupted surface epithelium (black arrows) and inflammatory cells (red arrows) (B) and mice intestine almost coming back to normal on 15th day after the challenge with the EAEC strain (C).
Microbiolres 13 00062 g007
Table 1. Distribution of virulence-related markers and phylogeny among EAEC isolates from clinical and non-clinical sources used in the animal model.
Clinical IsolatesNon-Clinical Isolates
EAEC Virulence GeneHuman EAEC
n = 30 (%)
Animal EAEC
n = 10 (%)
Environmental and Chutney EAEC
n = 10 (%)
p Value
astA29 (96.6)5 (50)9 (90)0.01 *
sigA2 (6.6)2 (20)00.3
Pic2 (6.6)01 (10)1.0
SepA4 (13.3)000.14
Sat6 (20)000.06
pet4 (13.3)1 (10)00.6
aap14 (46)2 (20)5 (50)0.5
aaiC7 (23.3)000.03 *
agg4A16 (53.3)1 (10)5 (50)0.14
aggA16 (53.3)03 (30)0.008 *
aafA11 (36.6)000.001 *
agg3A12 (40)000.001 *
affC10 (33.3)000.003 *
ORF619 (30)3 (30)3 (30)1.0
eilA103 (30)00.19
capU8 (26.6)1 (10)1 (10)0.2
air5 (16.6)000.07
espY10 (33.3)1 (10)00.03 *
rmo15 (50)1 (10)1 (10)0.005 *
shiA4 (13.3)1 (10)1 (10)1.0
aggR20 (66.6)5 (50)5 (50)0.2
Phylogroups
A3 (10)2 (20)01.0
B16 (20)3 (30)2 (20)0.7
B210 (33.3)2 (20)2 (20)0.5
D11 (36.6)3 (30)6 (60)0.5
* Statistically significant (p < 0.05) when clinical and non-clinical isolates were compared. Fischer’s exact test was used.
Table 2. The virulence genes’ content and phylogroups. Inflammatory markers and colonization of each strain from human sources.
Strain IDSource of EAEC Isolateast Asig Apicsep AsatpetORF 3aapaai Cagg Ragg4AaggAaafAagg3AaafCORF61eilAcapUairespY2rmoAshiAPhylogroupVirulence ScoreLactoferrin Conc.Calprotectin Conc.Colonization upto (Days)
AW-330Healthy++-------+--++--+---+-B165942.333.865th
AW-254Healthy+-----+++++---+++--++-B183346.623.475th
M-636Diarrhea+-++--++++++---+-+-++-B144375.163.5110th
G-3Diarrhea+--------++-+------+--B262896.22.3815th
CD-103Diarrhea+------+---++-+-----+-B2103465.52.665th
CD-584Diarrhea+--++-++-++---++-++---D105249.93.215th
AW-171Healthy+--------+++++------+-B264629.32.0110th
1320/16Diarrhea+---++---+++++-----+--B273642.872.1610th
AW-458.2Healthy+---+----+++++------+-D75058.582.85th
G-24Diarrhea+--+--+--++--------+ +D115139.193.1815th
MT-7Healthy+--------+++++-----+ -B1135249.022.65th
R-524Diarrhea+------ +++ +-----+-B254778.462.515th
MT-101Healthy+-----+----+---+-+--+-B264814.732.645th
CD-806Diarrhea+----+------++--+-+-+-D115767.953.3215th
R-437Diarrhea+-----++++++---+-+--+-D75258.01.5210th
MT-38Healthy+---+----+++-+-----+--B194954.792.645th
R-431Diarrhea+------+-++---+-++-++-D75902.532.55th
R-708Diarrhea+--------+++++------+-B272453.701.810th
M-160Diarrhea+---+--+-+++-+------+-B286202.233.175th
AW-446Healthy+-------+---++-------+A66365.472.55th
M-510Diarrhea+-----+-++-+---+++---+A45574.483.655th
RL1Diarrhea+----+-+-++-++------+-B164803.382.85th
R-1483Diarrhea++-------+--++--+---+-D102456.572.25th
103.1/16Diarrhea+-----+++++---+++--++-D72352.542.115th
252/16Diarrhea+-++--++++++---+-+-++-B283389.952.5315th
HS-38.3Diarrhea+--------++-+------+ B273947.173.205th
P-11Diarrhea+------+---++-+-----+-A83157.193.695th
AW 412Healthy+--++-++-++---++-++ --D53836.33.741st
AW 230Healthy+--------+++++------+-B181276.962.695th
380/15Diarrhea+---++---+++++-----+--D83423.21.655th
Mean virulence score of human EAEC isolates7Median Conc. = 4703.34Median Conc. = 2.65
In EAEC markers: (+) means the presence of a gene and (-) means the absence of the gene. Here, the mean virulence score is calculated by adding all virulence scores and dividing the virulence score bythe total number of strains, and the median is calculated by finding the average of the two middle numbers by adding them together and dividing the sum by two.
Table 3. The virulence genes’ content and phylogroups. Inflammatory markers and colonization from animal sources.
Strain IDSourceast Asig Apicsep AsatpetORF 3aapaai Cagg Ragg4AaggAaafAagg3AaafCORF61eilAcapUairespY2rmoAshiAPhylogroupVirulence ScoreLactoferrin Conc.Calprotectin Conc.Colonization upto (Days)
S-37Animal-+------------------+-A23443.361.341st
S-58Animal+------+--------------B123403.051.085th
M2Animal---------++- --+------D33785.952.515th
M 51Animal+-----++-+- ---+---+--D64874.181.665th
M 68Animal+-----+--++-----------B243967.321.945th
S 92Animal---------+-----+------B223342.591.095th
S 322Animal---------+------+-----D24420.752.235th
MI-82Animal++-----+--------+----+A54934.641.815th
MI-73Animal+----+---------+++----B152949.620.665th
MI-39Animal----------+----+------B124138.60.525th
Mean virulence score of animal EAEC isolates3Median Conc. = 3876.63Median Conc. = 1.5
In EAEC markers: (+) means the presence of a gene and (-) means the absence of the gene. Here, the mean virulence score is calculated by adding all virulence scores and dividing the virulence score by the total number of strains, and the median is calculated by finding the average of the two middle numbers by adding them together and dividing the sum by two.
Table 4. The virulence genes’ content, phylogroups, inflammatory markers, and colonization from environment sources.
Strain IDSourceast Asig Apicsep AsatpetORF 3aapaai Cagg Ragg4AaggAaafAagg3AaafCORF61eilAcapUairespY2rmoAshiAPhylogroupVirulence ScoreLactoferrin Conc.Calprotectin Conc.Colonization upto (Days)
CH-38Environment+----------+-+-++-----D53755.70.555th
CH-11Environment+--------+++--------+-D52254.361.325th
CH-72Environment+-+-------+++---------B151176.201.365th
CH-23Environment+---------+-----------B223745.641.301st
CH-85Environment+--------+++---++-----D63544.121.9010th
CH-93Environment+-------+----+--+-----B144934.641.275th
CH-45Environment+------ -+++---+------D44420.751.475th
KS-4Environment+--------+++---++-----D62415.580.685th
MD-5Environment------+------------++-B234269.611.31st
CH-35Environment+--------++---++------D51942.001.345th
Mean virulence score of animal EAEC isolates4Median Conc. = 3644.88Median Conc. = 1.3
In EAEC markers: (+) means the presence of a gene and (-) means the absence of the gene. Here, the mean virulence score is calculated by adding all virulence scores and dividing the virulence score by the total number of strains, and the median is calculated by finding the average of the two middle numbers by adding them together and dividing the sum by two.
Publisher’s Note: MDPI stays neutral with regard to jurisdictional claims in published maps and institutional affiliations.

