
The Influence of COVID-19 on Influenza and Respiratory Syncytial Virus Activities


Abstract
:1. Introduction
2. Materials and Methods
2.1. Data Collection
2.2. Data Analysis
- (a)
- Flu activity was reflected on the CDC website on a severity-based scale with 13 levels. In comparison, RSV activity was reported as the number of new cases. We normalized RSV cases on a “1–13 scale” to match with the flu activity and run comparative analysis. The flu vaccine acceptance rate represented the percentage of the immunized population (individuals aged six months or above). The flu immunization season lasts from July of the given year to May of the following year. The flu vaccine acceptance rate (percentage of the population) increased cumulatively in every passing month.
- (b)
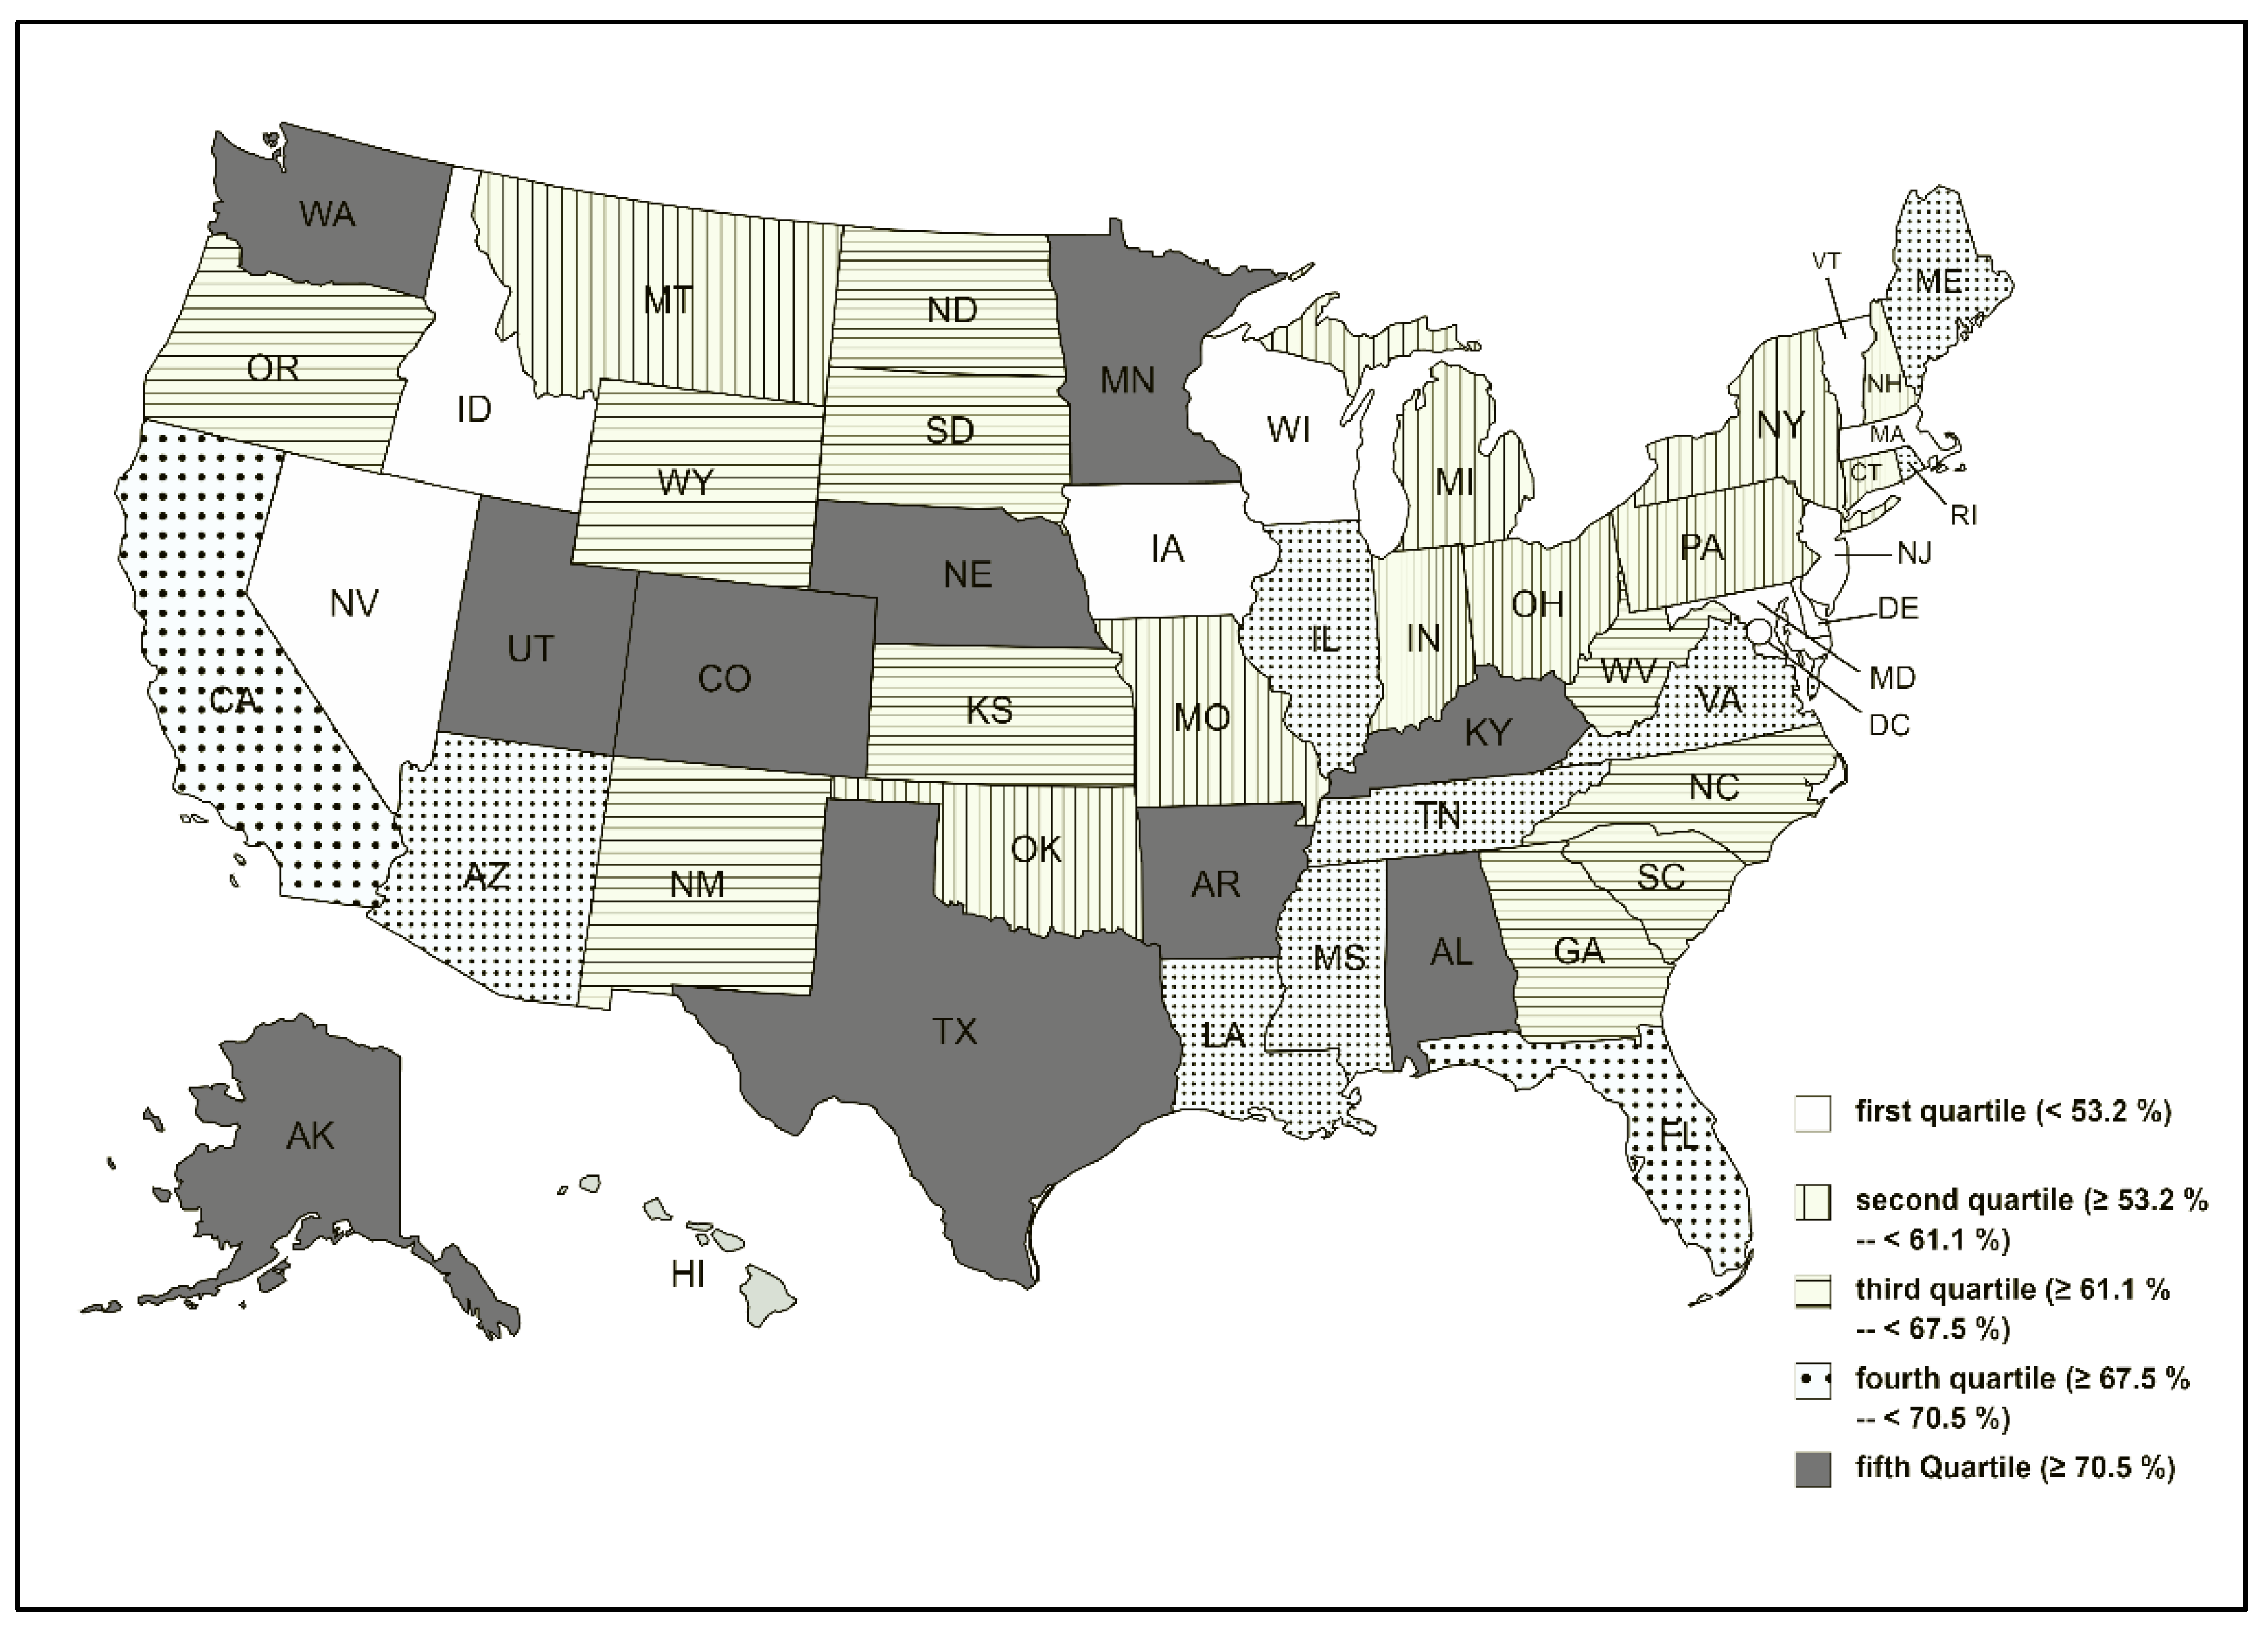
- The difference between pre- (from April 2019 to March 2020) and post-pandemic (from April 2020 to March 2021) flu activity between individual states were compared using Wilcoxon signed-rank test (nonparametric data). Fifty US states were divided into five quartiles (cohorts) depending on the decline in flu activity. An online graphics tool was used to build a US political map [22] demonstrating five cohorts of US states based on the decline in flu activity.
- (c)
- Spearman’s correlation analysis (nonparametric data) estimated the association between monthly flu activity and flu vaccination rates.
- (d)
- We compared both RSV and flu activities between the peak season in 2021 with the corresponding weeks of 2020.
- (e)
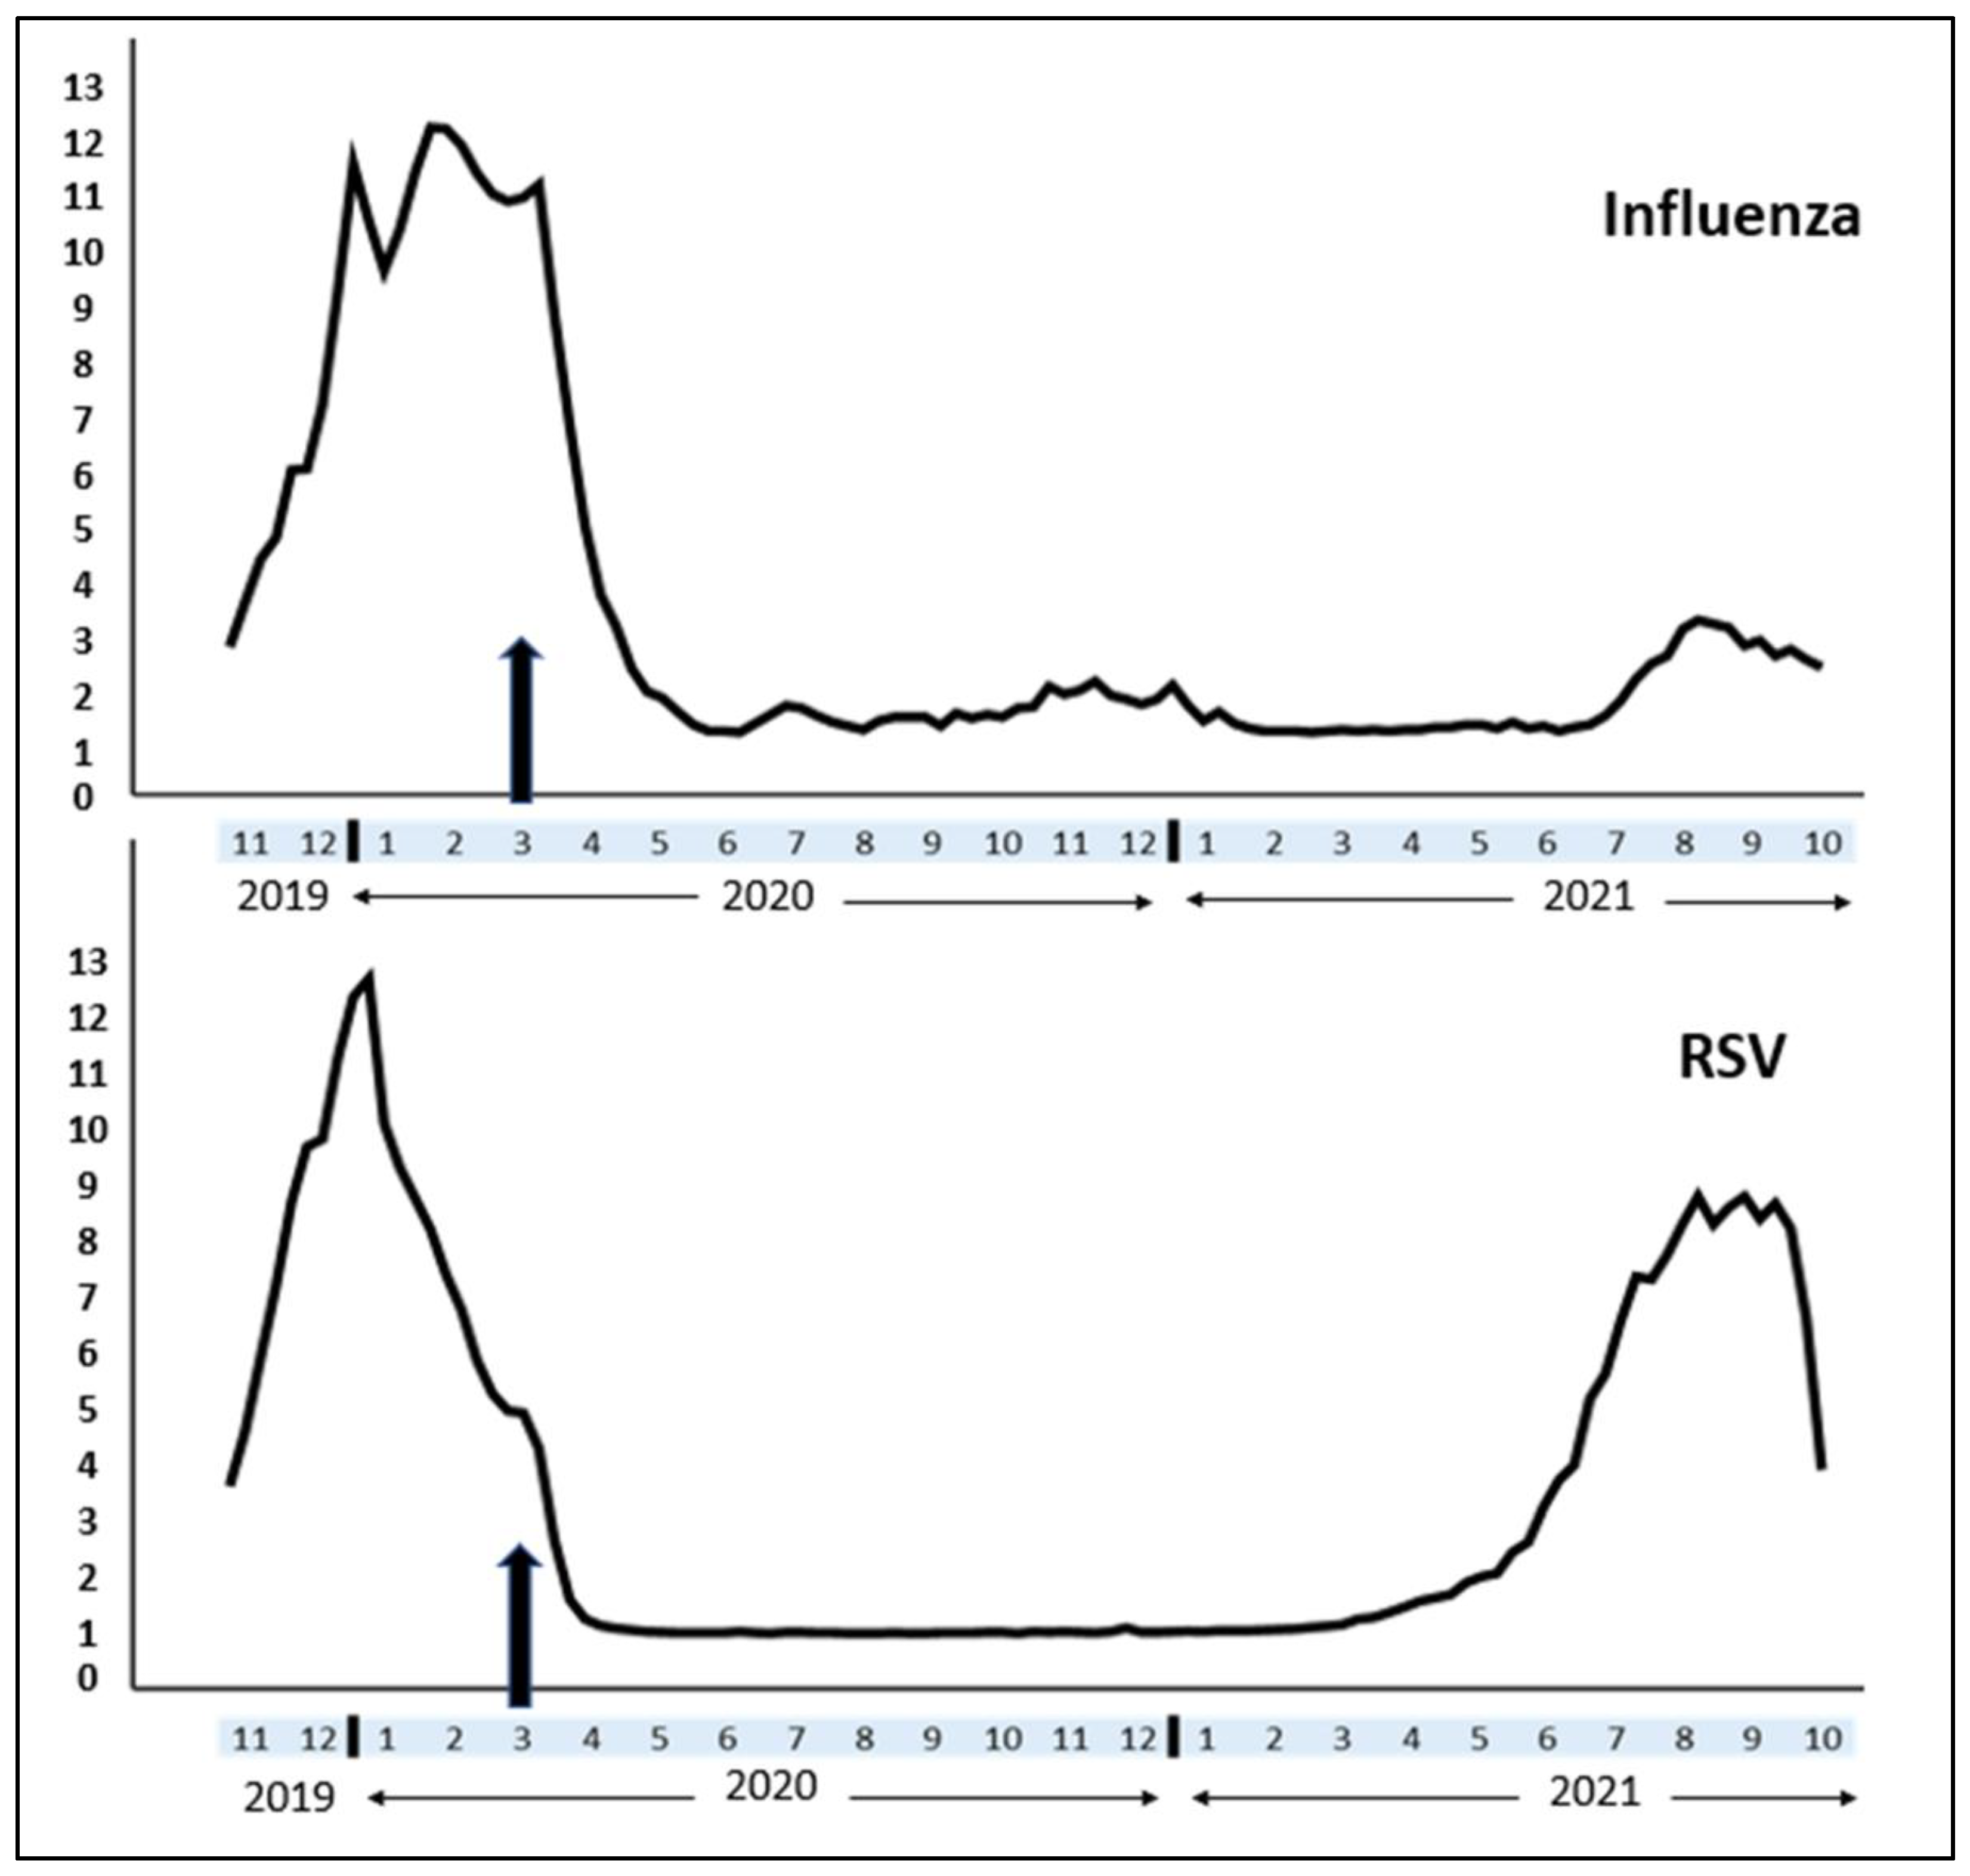
- Time trend analysis: since the incidence of respiratory viral infections has changed considerably since the COVID-19 outbreak, a time trend analysis was conducted for flu and RSV activities (between November 2019 and October 2021). We used the SPSS time series modeler [23] to generate a time trend graph for the parallel representation of both viral diseases.
3. Results
- (a)
- The median (IQR) value of monthly flu activity during the pre-COVID months (from April 2019 to March 2020) was 4.10 (1.38) compared to the post-COVID months’ (from April 2020 to March 2021) activity of 1.38 (0.71). The difference was statistically significant (Wilcoxon test: p-value < 0.001). Table 1 demonstrates pre- vs. post-COVID-19 flu activity in all US states, while Figure 1 categorizes the US states based on the rate of decline in flu activity. The variations between the states were random, and we did not find a trend according to the US regions.
- (b)
- Pre-COVID-19 flu vaccination rate (% of the population) 45.50% (39.10%) was identical to the post-COVID-19 vaccine acceptance rate 45.00% (19.84%), and the difference was not statistically significant (Wilcoxon test: p-value > 0.05).
- (c)
- Flu activity and vaccination rates did not have an association either during the pre-COVID-19 (Spearman’s correlation coefficient = −0.141, p = 0.329) or post-COVID-19 period (Spearman’s correlation coefficient = 0.023, p = 0.875).
- (d)
- Peak activity season: RSV activity considerably increased since mid-June 2021 (Figure 2). The mean (SD) weekly RSV activity between June 2021 and October 2021 was 6.24 (2.34) higher compared to the RSV activity (0.02 (0.01)) of the corresponding weeks of 2020. However, the average flu activity between June and October 2021 (1.90 (0.62)) was relatively stable compared to the corresponding weeks in 2020 (1.17 (0.12)).
- (e)
- Time trend analysis: since COVID-19 hit the USA, both flu and RSV cases declined significantly in 2020. While flu incidence continued to remain low till October 2021, an untimely RSV peak occurred earlier than the traditional RSV season and remained elevated till October 2021 (Figure 2).
4. Discussion
5. Conclusions
Author Contributions
Funding
Institutional Review Board Statement
Informed Consent Statement
Data Availability Statement
Conflicts of Interest
References
- WHO Director-General’s Opening Remarks at the Media Briefing on COVID-19—11 March 2020. Available online: https://www.who.int/director-general/speeches/detail/who-director-general-s-opening-remarks-at-the-media-briefing-on-covid-19---11-march-2020 (accessed on 11 December 2021).
- Girum, T.; Lentiro, K.; Geremew, M.; Migora, B.; Shewamare, S. Global strategies and effectiveness for COVID-19 prevention through contact tracing, screening, quarantine, and isolation: A systematic review. Trop. Med. Health 2020, 48, 91. [Google Scholar] [CrossRef] [PubMed]
- Which Countries Are Requiring Face Masks? Available online: https://www.cfr.org/in-brief/which-countries-are-requiring-face-masks (accessed on 23 January 2022).
- Dadras, O.; Alinaghi, S.A.S.; Karimi, A.; MohsseniPour, M.; Barzegary, A.; Vahedi, F.; Pashaei, Z.; Mirzapour, P.; Fakhfouri, A.; Zargari, G. Effects of COVID-19 prevention procedures on other common infections: A systematic review. Eur. J. Med. Res. 2021, 26, 67. [Google Scholar] [CrossRef] [PubMed]
- Agca, H.; Akalin, H.; Saglik, I.; Hacimustafaoglu, M.; Celebi, S.; Ener, B. Changing epidemiology of influenza and other respiratory viruses in the first year of COVID-19 pandemic. J. Infect. Public Health 2021, 14, 1186–1190. [Google Scholar] [CrossRef] [PubMed]
- Boncristiani, H.; Criado, M.; Arruda, E. Respiratory Viruses. Encycl. Microbiol. 2009, 500. Available online: https://www.ncbi.nlm.nih.gov/pmc/articles/PMC7149556/ (accessed on 10 February 2022).
- Disease Burden of Flu. Available online: https://www.cdc.gov/flu/about/burden/index.html (accessed on 23 January 2022).
- Respiratory Syncytial Virus Infection (RSV). Available online: https://www.cdc.gov/rsv/index.html (accessed on 23 January 2022).
- Pollack, P.F.; Groothuis, J.R.; Barbarotto, G. Development and use of palivizumab (Synagis): A passive immunoprophylactic agent for RSV. J. Infect. Chemother. 2002, 8, 201–206. [Google Scholar] [CrossRef]
- CDC Seasonal Flu Vaccine Effectiveness Studies. Available online: https://www.cdc.gov/flu/vaccines-work/effectiveness-studies.htm (accessed on 23 January 2022).
- Mondal, P.; Sinharoy, A.; Su, L. Sociodemographic predictors of COVID-19 vaccine acceptance: A nationwide US-based survey study. Public Health 2021, 198, 252–259. [Google Scholar] [CrossRef]
- Sun, J.; Shi, Z.; Xu, H. Non-pharmaceutical interventions used for COVID-19 had a major impact on reducing influenza in China in 2020. J. Travel Med. 2020, 27, taaa064. [Google Scholar] [CrossRef]
- Fricke, L.M.; Glöckner, S.; Dreier, M.; Lange, B. Impact of non-pharmaceutical interventions targeted at COVID-19 pandemic on influenza burden—A systematic review. J. Infect. 2021, 82, 1–35. [Google Scholar] [CrossRef]
- Marcus, R.E.; Kolade, V.O. Influenza Vaccination during COVID-19 in a Rural Community: A Cross-sectional Survey. J. Community Health 2021, 1–6. Available online: https://pubmed.ncbi.nlm.nih.gov/34647201/ (accessed on 10 February 2022). [CrossRef]
- Rubin, R. Influenza’s unprecedented low profile during COVID-19 pandemic leaves experts wondering what this flu season has in store. JAMA 2021, 326, 899–900. [Google Scholar] [CrossRef]
- Van Summeren, J.; Meijer, A.; Aspelund, G.; Casalegno, J.S.; Erna, G.; Hoang, U.; Lina, B.; de Lusignan, S.; Teirlinck, A.C.; Thors, V. Low levels of respiratory syncytial virus activity in Europe during the 2020/21 season: What can we expect in the coming summer and autumn/winter? Eurosurveillance 2021, 26, 2100639. [Google Scholar] [CrossRef] [PubMed]
- Agha, R.; Avner, J.R. Delayed seasonal RSV surge observed during the COVID-19 pandemic. Pediatrics 2021, 148, e2021052089. [Google Scholar] [CrossRef] [PubMed]
- Leung, N.H.L. Transmissibility and transmission of respiratory viruses. Nat. Rev. Microbiol. 2021, 19, 528–545. [Google Scholar] [CrossRef]
- Flu Activity & Surveillance. Available online: https://www.cdc.gov/flu/weekly/pastreports.htm (accessed on 9 December 2021).
- The Weekly National Influenza (Flu) Vaccination Dashboard. Available online: https://www.cdc.gov/flu/fluvaxview/index.htm (accessed on 9 December 2021).
- RSV National Trends. Available online: https://www.cdc.gov/surveillance/nrevss/images/trend_images/RSV124PP_Nat.htm (accessed on 31 January 2022).
- Mapchart. Available online: https://mapchart.net/usa.html (accessed on 22 January 2022).
- SPSS Statistics. Time Series Modeler. Available online: https://www.ibm.com/docs/en/spss-statistics/24.0.0?topic=option-time-series-modeler (accessed on 23 January 2022).
- Olsen, S.J.; Winn, A.K.; Budd, A.P.; Prill, M.M.; Steel, J.; Midgley, C.M.; Kniss, K.; Burns, E.; Rowe, T.; Foust, A. Changes in influenza and other respiratory virus activity during the COVID-19 pandemic—United States, 2020–2021. Morb. Mortal. Wkly. Rep. 2021, 70, 1013. [Google Scholar] [CrossRef] [PubMed]
- Parums, D.V. A decline in influenza during the COVID-19 pandemic and the emergence of potential epidemic and pandemic influenza viruses. Med. Sci. Monit. Int. Med. J. Exp. Clin. Res. 2021, 27, e934949-1. [Google Scholar] [CrossRef] [PubMed]
- Lei, H.; Xu, M.; Wang, X.; Xie, Y.; Du, X.; Chen, T.; Yang, L.; Wang, D.; Shu, Y. Nonpharmaceutical interventions used to control COVID-19 reduced seasonal influenza transmission in China. J. Infect. Dis. 2020, 222, 1780–1783. [Google Scholar] [CrossRef] [PubMed]
- Zipfel, C.M.; Colizza, V.; Bansal, S. The missing season: The impacts of the COVID-19 pandemic on influenza. Vaccine 2021, 39, 3645–3648. [Google Scholar] [CrossRef] [PubMed]
- Stamm, P.; Sagoschen, I.; Weise, K.; Plachter, B.; Münzel, T.; Gori, T.; Vosseler, M. Influenza and RSV incidence during COVID-19 pandemic—An observational study from in-hospital point-of-care testing. Med. Microbiol. Immunol. 2021, 210, 277–282. [Google Scholar] [CrossRef]
- Tempia, S.; Walaza, S.; Bhiman, J.N.; McMorrow, M.L.; Moyes, J.; Mkhencele, T.; Meiring, S.; Quan, V.; Bishop, K.; McAnerney, J.M. Decline of influenza and respiratory syncytial virus detection in facility-based surveillance during the COVID-19 pandemic, South Africa, January to October 2020. Eurosurveillance 2021, 26, 2001600. [Google Scholar] [CrossRef]
- Bachtiger, P.; Adamson, A.; Chow, J.-J.; Sisodia, R.; Quint, J.K.; Peters, N.S. The impact of the COVID-19 pandemic on the uptake of influenza vaccine: UK-wide observational study. JMIR Public Health Surveill. 2021, 7, e26734. [Google Scholar] [CrossRef]
- Ferrero, F.; Ossorio, M.F.; Rial, M.J. The return of RSV during the COVID-19 pandemic. Pediatr. Pulmonol. 2021. Available online: https://onlinelibrary.wiley.com/doi/abs/10.1002/ppul.25802 (accessed on 22 January 2022). [CrossRef] [PubMed]
- Spicknall, I.H.; Koopman, J.S.; Nicas, M.; Pujol, J.M.; Li, S.; Eisenberg, J.N. Informing optimal environmental influenza interventions: How the host, agent, and environment alter dominant routes of transmission. PLoS Comput. Biol. 2010, 6, e1000969. [Google Scholar] [CrossRef] [PubMed]
- Goldmann, D.A. Transmission of viral respiratory infections in the home. Pediatr. Infect. Dis. J. 2000, 19, S97–S102. [Google Scholar] [CrossRef] [PubMed]
- Belser, J.A.; Maines, T.R.; Tumpey, T.M.; Katz, J.M. Influenza A virus transmission: Contributing factors and clinical implications. Expert Rev. Mol. Med. 2010, 12, E39. [Google Scholar] [CrossRef] [Green Version]
- Brankston, G.; Gitterman, L.; Hirji, Z.; Lemieux, C.; Gardam, M. Transmission of influenza A in human beings. Lancet Infect. Dis. 2007, 7, 257–265. [Google Scholar] [CrossRef]
- Key Facts about Influenza (Flu). Available online: https://www.cdc.gov/flu/about/keyfacts.htm (accessed on 11 December 2021).
- Pica, N.; Bouvier, N.M. Environmental factors affecting the transmission of respiratory viruses. Curr. Opin. Virol. 2012, 2, 90–95. [Google Scholar] [CrossRef]
- Wright, M.; Piedimonte, G. Respiratory syncytial virus prevention and therapy: Past, present, and future. Pediatr. Pulmonol. 2011, 46, 324–347. [Google Scholar] [CrossRef]
- RSV Transmission. Available online: https://www.cdc.gov/rsv/about/transmission.html (accessed on 31 January 2022).
- Di Mattia, G.; Nenna, R.; Mancino, E.; Rizzo, V.; Pierangeli, A.; Villani, A.; Midulla, F. During the COVID-19 pandemic where has respiratory syncytial virus gone? Pediatr. Pulmonol. 2021, 56, 3106–3109. [Google Scholar] [CrossRef]
- Why Did RSV See a Summer Surge in Australia This Year? Available online: https://www1.racgp.org.au/newsgp/clinical/why-did-rsv-see-a-summer-surge-in-australia-this-y (accessed on 23 January 2022).
- Respiratory Infection RSV Surges in South as Mask Use, Distancing Decline. Available online: https://www.medscape.com/viewarticle/953881 (accessed on 13 December 2021).
- Increase in Respiratory Syncytial Virus (RSV) Cases. 2020. Available online: https://www.nicd.ac.za/increase-in-respiratory-syncytial-virus-rsv-cases-2020/ (accessed on 13 February 2022).
- Dangerous Flu Comeback Expected atop COVID This Winter. Available online: https://www.scientificamerican.com/article/dangerous-flu-comeback-expected-atop-covid-this-winter1/ (accessed on 29 January 2022).


| State | Pre-COVID-19 Flu Activity | Post-COVID-19 Flu Activity | Decline in Flu Activity (%) |
|---|---|---|---|
| Alabama | 5.36 | 1.21 | 77.43 |
| Alaska | 3.13 | 0.84 | 73.16 |
| Arizona | 3.73 | 1.16 | 68.90 |
| Arkansas | 4.44 | 1.06 | 76.13 |
| California | 3.79 | 1.21 | 68.07 |
| Colorado | 5.15 | 1.27 | 75.34 |
| Connecticut | 4.59 | 1.80 | 60.78 |
| Delaware | 2.01 | 1.05 | 47.76 |
| District of Columbia | 3.39 | 2.02 | 40.41 |
| Florida | 4.12 | 1.32 | 67.96 |
| Georgia | 5.62 | 2.04 | 63.70 |
| Idaho | 1.80 | 2.30 | −27.78 |
| Illinois | 4.46 | 1.45 | 67.50 |
| Indiana | 3.22 | 1.34 | 58.39 |
| Iowa | 3.28 | 2.39 | 27.13 |
| Kansas | 4.43 | 1.63 | 63.21 |
| Kentucky | 4.67 | 1.28 | 72.59 |
| Louisiana | 7.42 | 2.19 | 70.49 |
| Maine | 3.58 | 1.07 | 70.11 |
| Maryland | 4.38 | 2.19 | 50.00 |
| Massachusetts | 4.08 | 1.91 | 53.19 |
| Michigan | 2.57 | 1.00 | 61.09 |
| Minnesota | 4.07 | 1.00 | 75.43 |
| Mississippi | 4.77 | 1.51 | 68.34 |
| Missouri | 3.30 | 1.51 | 54.24 |
| Montana | 2.57 | 1.10 | 57.20 |
| Nebraska | 4.50 | 1.16 | 74.22 |
| Nevada | 2.47 | 1.50 | 39.27 |
| New Hampshire | 2.43 | 1.00 | 58.85 |
| New Jersey | 4.65 | 2.56 | 44.95 |
| New Mexico | 5.13 | 1.88 | 63.35 |
| New York | 4.25 | 1.85 | 56.47 |
| North Carolina | 4.15 | 1.35 | 67.47 |
| North Dakota | 3.81 | 1.48 | 61.15 |
| Ohio | 2.42 | 1.11 | 54.13 |
| Oklahoma | 4.95 | 2.18 | 55.96 |
| Oregon | 4.05 | 1.57 | 61.23 |
| Pennsylvania | 4.05 | 1.80 | 55.56 |
| Rhode Island | 3.60 | 1.02 | 71.67 |
| South Carolina | 5.75 | 1.89 | 67.13 |
| South Dakota | 3.02 | 1.05 | 65.23 |
| Tennessee | 5.07 | 1.41 | 72.19 |
| Texas | 5.71 | 1.20 | 78.98 |
| Utah | 4.45 | 1.12 | 74.83 |
| Vermont | 3.28 | 1.65 | 49.70 |
| Virginia | 5.46 | 1.52 | 72.16 |
| Washington | 4.71 | 1.22 | 74.10 |
| West Virginia | 3.65 | 1.25 | 65.75 |
| Wisconsin | 4.29 | 3.11 | 27.51 |
| Wyoming | 3.31 | 1.15 | 65.26 |
Publisher’s Note: MDPI stays neutral with regard to jurisdictional claims in published maps and institutional affiliations. |
© 2022 by the authors. Licensee MDPI, Basel, Switzerland. This article is an open access article distributed under the terms and conditions of the Creative Commons Attribution (CC BY) license (https://creativecommons.org/licenses/by/4.0/).
Share and Cite
Mondal, P.; Sinharoy, A.; Gope, S. The Influence of COVID-19 on Influenza and Respiratory Syncytial Virus Activities. Infect. Dis. Rep. 2022, 14, 134-141. https://doi.org/10.3390/idr14010017
Mondal P, Sinharoy A, Gope S. The Influence of COVID-19 on Influenza and Respiratory Syncytial Virus Activities. Infectious Disease Reports. 2022; 14(1):134-141. https://doi.org/10.3390/idr14010017
Chicago/Turabian StyleMondal, Pritish, Ankita Sinharoy, and Suparna Gope. 2022. "The Influence of COVID-19 on Influenza and Respiratory Syncytial Virus Activities" Infectious Disease Reports 14, no. 1: 134-141. https://doi.org/10.3390/idr14010017
APA StyleMondal, P., Sinharoy, A., & Gope, S. (2022). The Influence of COVID-19 on Influenza and Respiratory Syncytial Virus Activities. Infectious Disease Reports, 14(1), 134-141. https://doi.org/10.3390/idr14010017