The Prognostic Utility of KRAS Mutations in Tissue and Circulating Tumour DNA in Colorectal Cancer Patients
Abstract
1. Introduction
2. Materials and Methods
2.1. Sample Collection and Ethics
2.2. DNA Extraction
2.3. KRAS-Mutation Testing Using ddPCR
2.4. Calculation of the LoD and LoB
2.5. Statistical Analysis
3. Results
3.1. KRAS Mutation in ctDNA and Prognosis
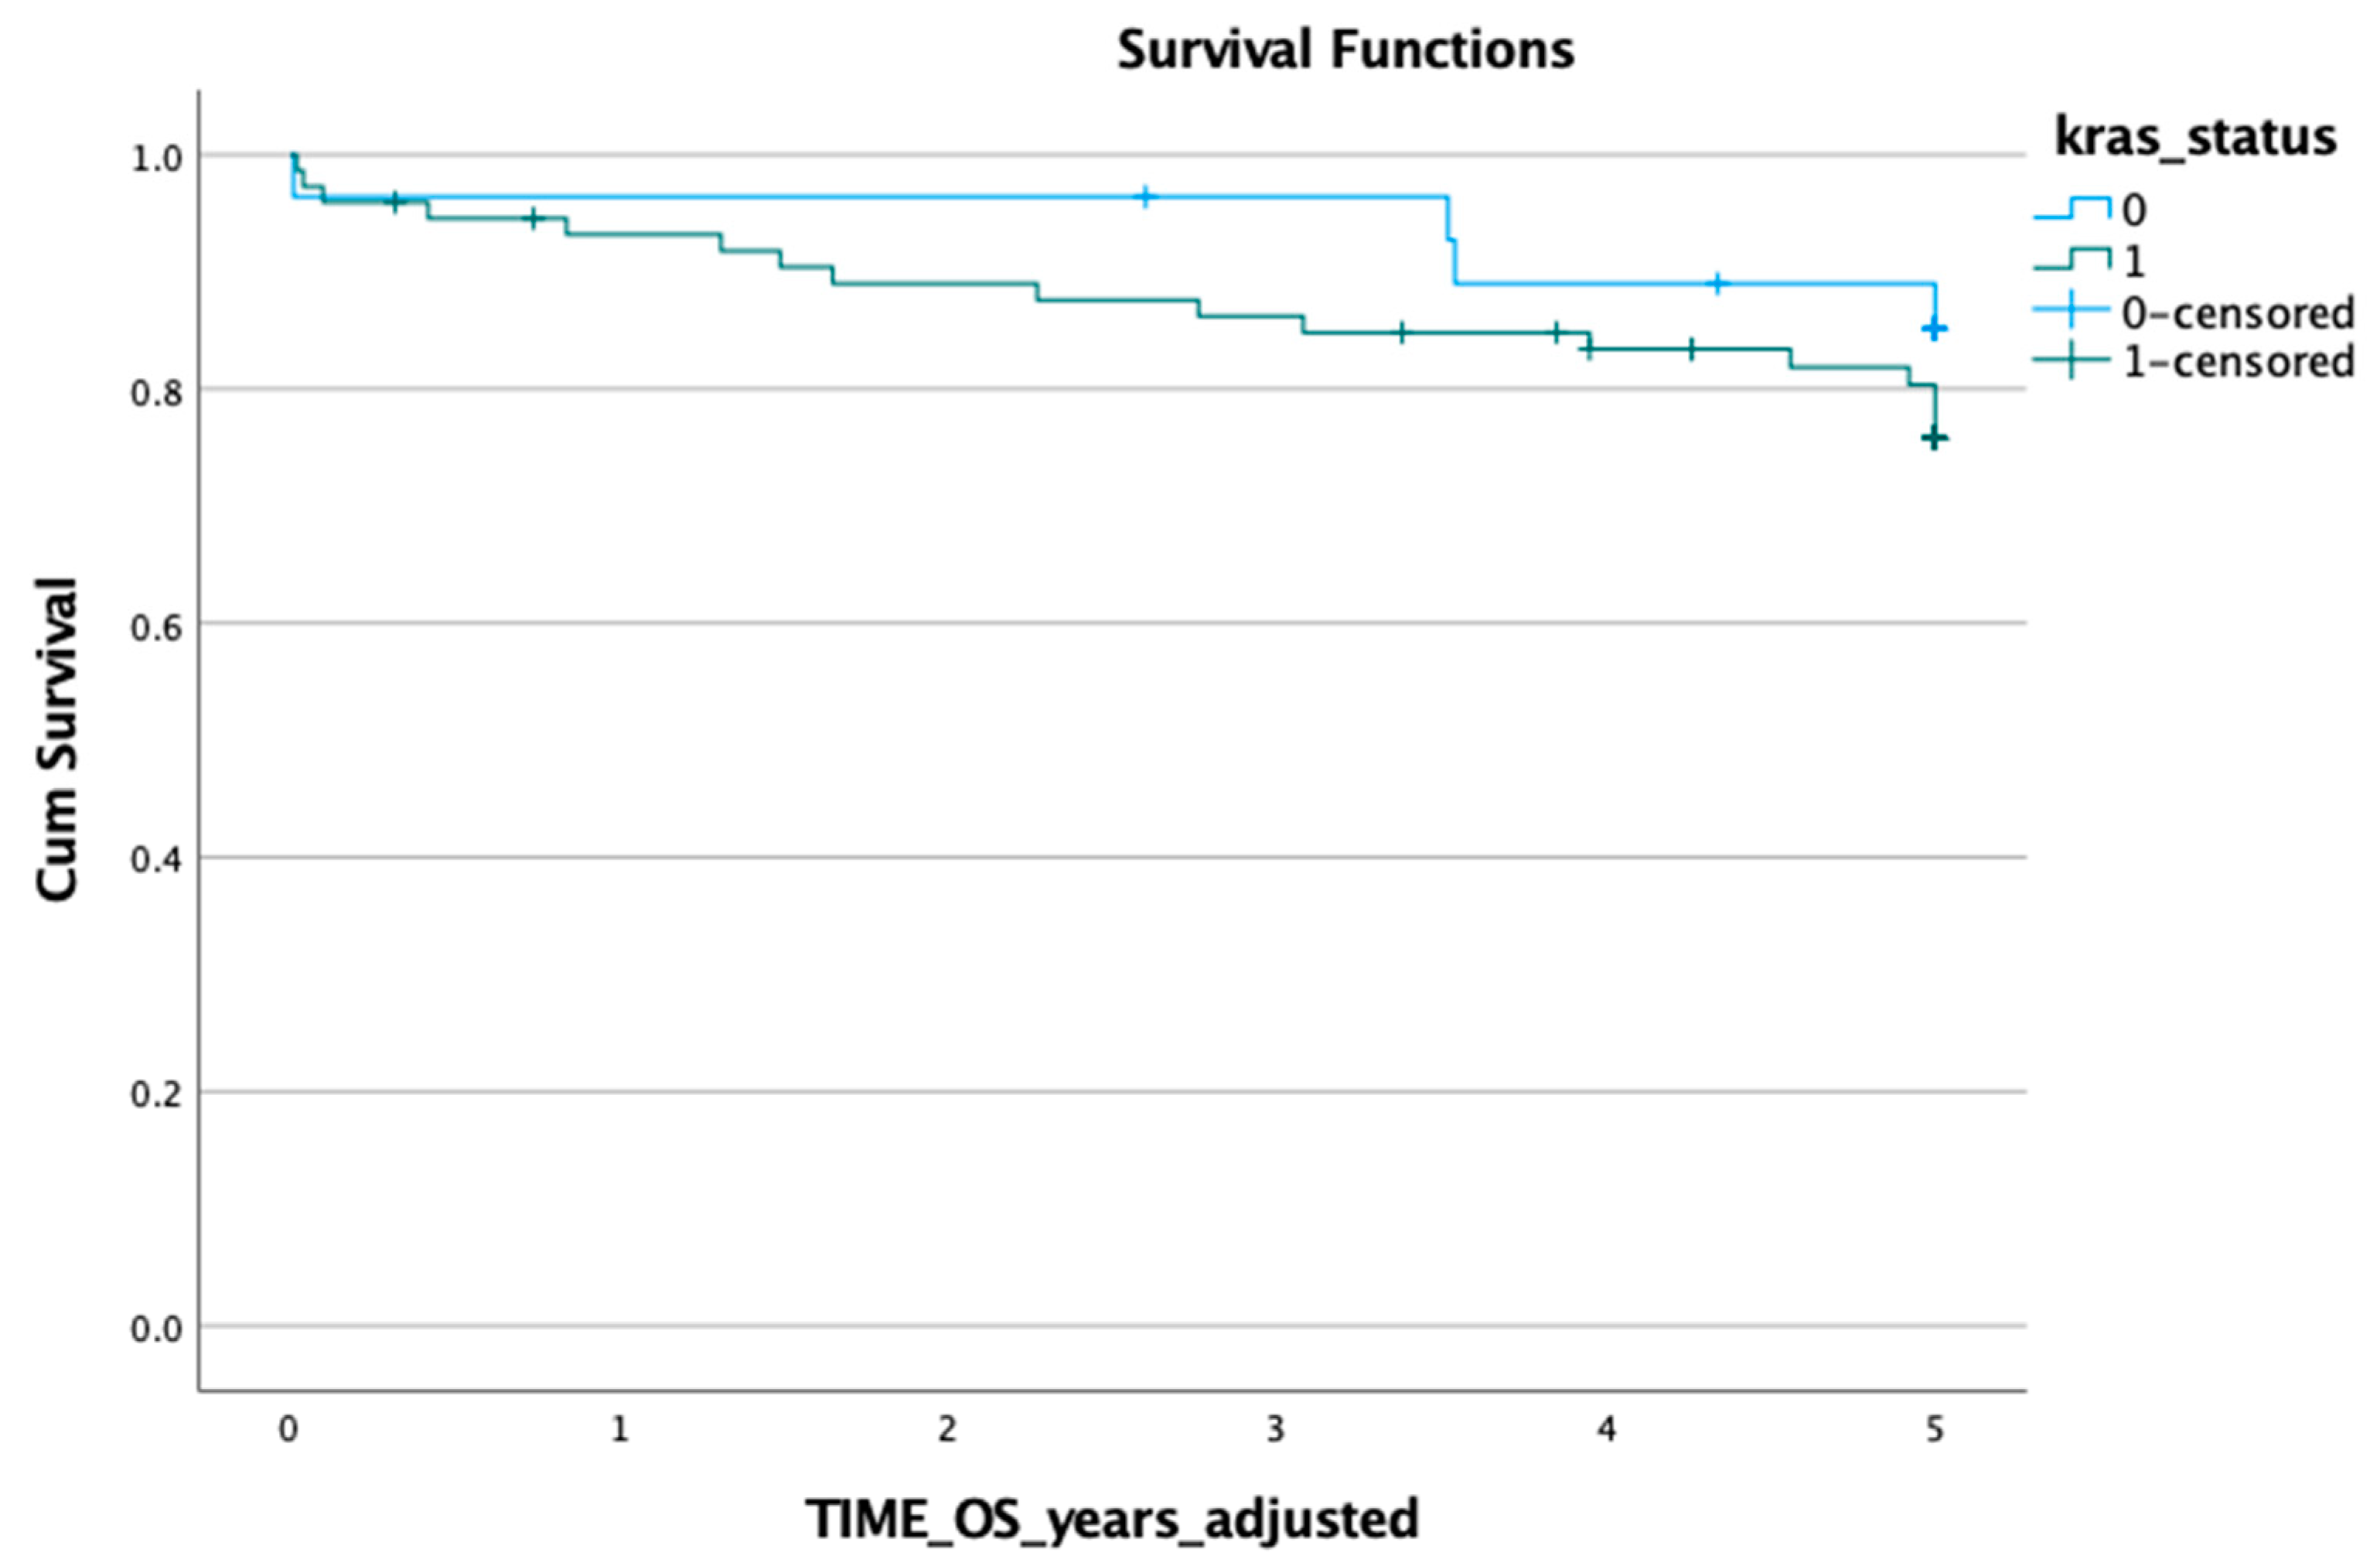
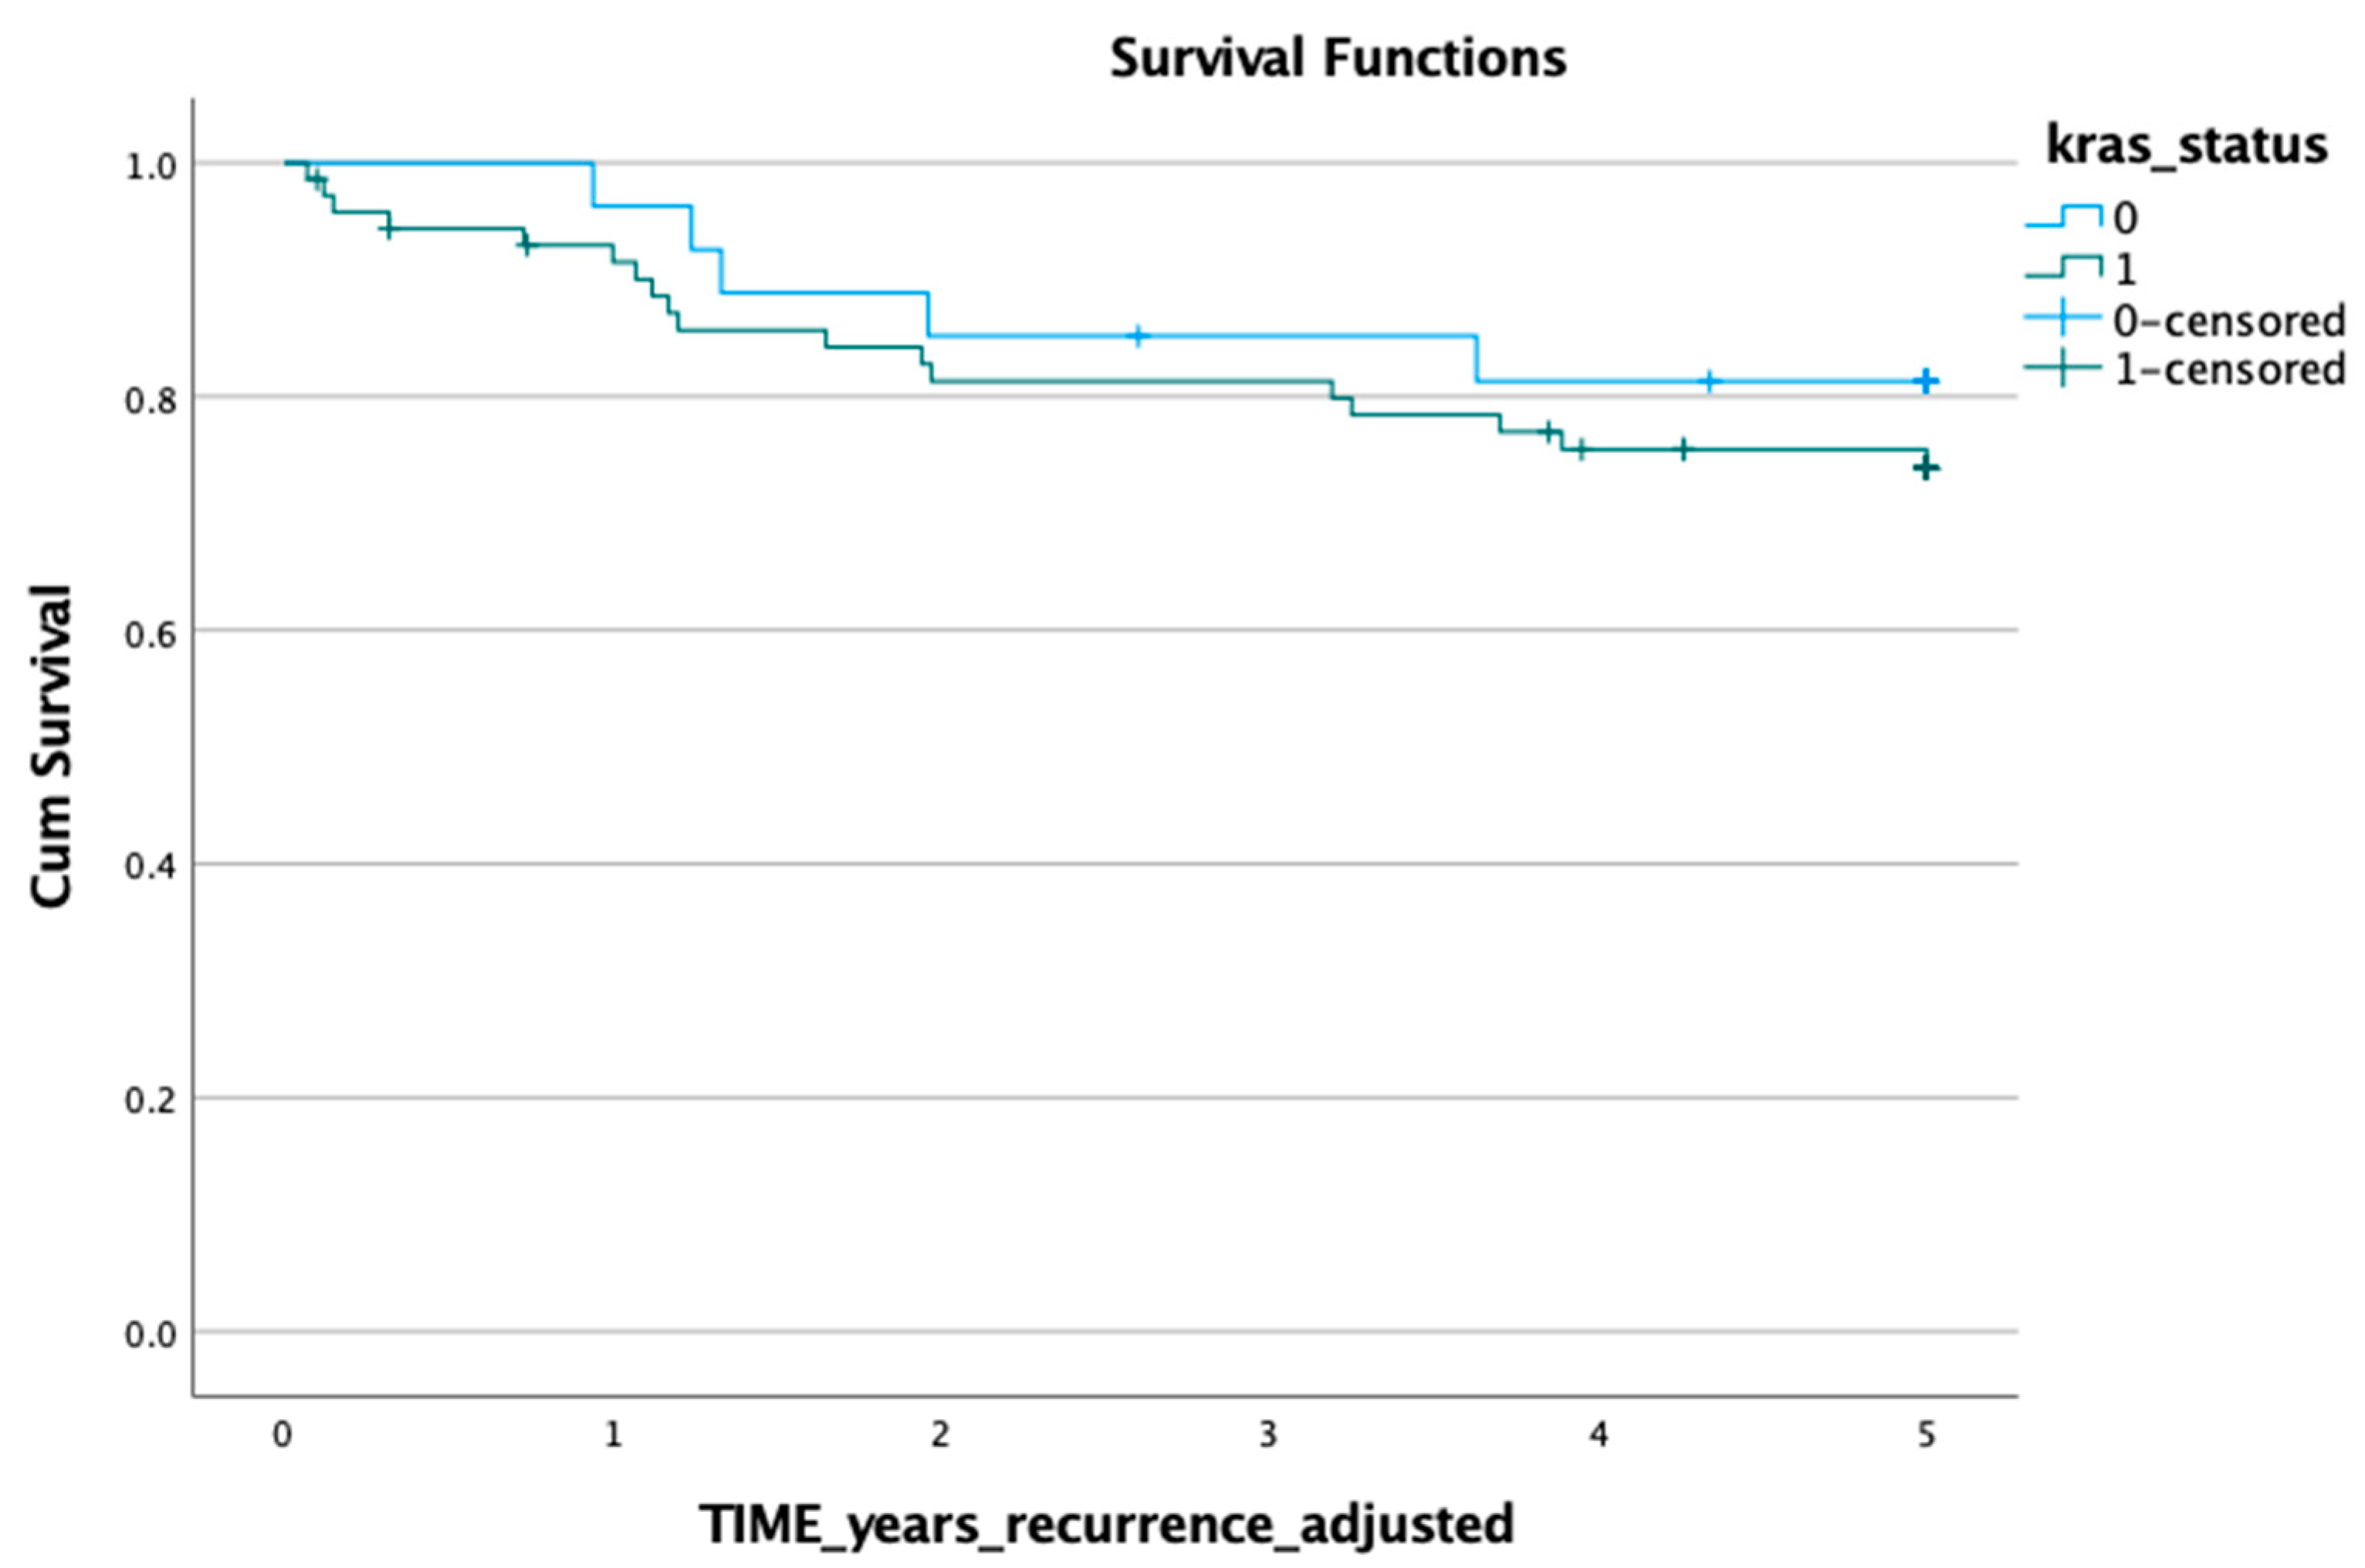
3.2. KRAS Mutation in Tumour Tissue and Prognosis
4. Discussion
5. Conclusions
Supplementary Materials
Author Contributions
Funding
Institutional Review Board Statement
Informed Consent Statement
Data Availability Statement
Acknowledgments
Conflicts of Interest
References
- Bray, F.; Ferlay, J.; Soerjomataram, I.; Siegel, R.L.; Torre, L.A.; Jemal, A. Global cancer statistics 2018: GLOBOCAN estimates of incidence and mortality worldwide for 36 cancers in 185 countries. CA-Cancer J. Clin. 2018, 68, 394–424. [Google Scholar] [CrossRef]
- Australian Institute of Health and Welfare. Colorectal and Other Digestive-Tract Cancers; Cancer series no. 114. Cat. no. 117; AIHW: Canberra, Australia, 2018. [Google Scholar]
- Andre, T.; Boni, C.; Navarro, M.; Tabernero, J.; Hickish, T.; Topham, C.; Bonetti, A.; Clingan, P.; Bridgewater, J.; Rivera, F.; et al. Improved overall survival with oxaliplatin, fluorouracil and leucovorin as adjuvant treatment in stage II or III colon cancer in the MOSAIC Trial. J. Clin. Oncol. 2009, 27, 3109–3116. [Google Scholar] [CrossRef]
- Tie, J.; Cohen, J.; Lahouel, K.; Lo, S.; Wang, Y.; Kosmider, S.; Wong, R.; Shapiro, J.; Lee, M.; Harris, S.; et al. Circulating tumour DNA analysis guiding adjuvant therapy in stage II colon cancer. NEJM 2022, 386, 2261–2272. [Google Scholar] [CrossRef]
- Benhattar, J.; Losi, L.; Chaubert, P.; Givel, J.C.; Costa, J. Prognostic significance of K-ras mutations in colorectal carcinoma. Gastroenterology 1993, 104, 1044–1048. [Google Scholar] [CrossRef]
- Lee, J.C.; Wang, S.T.; Lai, M.D.; Lin, Y.J.; Yang, H.b. K-ras gene mutation is a useful predictor of the survival of early stage colorectal cancers. Anticancer Res. 1996, 16, 3839–3844. [Google Scholar] [PubMed]
- Dinu, D.; Dobre, M.; Panaitescu, E.; Bîrla, R.; Losif, C.; Hoara, P.; Caragui, A.; Boeriu, M.; Constantinoiu, S.; Ardeleanu, C. Prognostic significance of KRAS gene mutations in colorectal cancer–preliminary study. J. Med. Life 2014, 7, 581–587. [Google Scholar]
- Spindler, K.; Pallisgaard, N.; Appelt, A.; Andersen, R.; Schou, J.; Nielsen, D.; Pfeiffer, P.; Yilmaz, M.; Johansen, J.; Hoegdall, E.; et al. Clinical utility of KRAS status in circulating plasma DNA compared to archival tumour tissue from patients with metastatic colorectal cancer treated with anti-epidermal growth factor receptor therapy. Eur. J. Cancer 2015, 51, 2678–2685. [Google Scholar] [CrossRef]
- Li, Z.; Chen, Y.; Wang, D.; Wang, G.; He, L.; Suo, J. Detection of KRAS mutations and their associations with clinicopathological features and survival in Chinese colorectal cancer patients. J. Int. Med. Res. 2012, 40, 1589–1598. [Google Scholar] [CrossRef] [PubMed]
- Tanaka, M.; Omura, K.; Watanabe, Y.; Oda, Y.; Nakanishi, I. Prognostic factors of colorectal-cancer: K-ras mutation, overexpression of the P53-protein, and cell proliferative activity. J. Surg. Oncol. 1994, 57, 57–64. [Google Scholar] [CrossRef] [PubMed]
- Dix, B.R.; Robbins, P.; Soong, R.; Jenner, D.; House, A.K.; Iacopetta, B.J. The common molecular genetic alterations in Dukes’ B and C colorectal carcinomas are not short-term prognostic indicators of survival. Int. J. Cancer 1994, 59, 747–751. [Google Scholar] [CrossRef]
- Zlobec, I.; Kovac, M.; Erzberger, P.; Molinari, F.; Bihl, M.P.; Rufle, A.; Foerster, A.; Frattini, M.; Terracciano, L.; Heinimann, K.; et al. Combined analysis of specific KRAS mutation, BRAF and microsatellite instability identifies prognostic subgroups of sporadic and hereditary colorectal cancer. Int. J. Cancer 2010, 127, 2569–2575. [Google Scholar] [CrossRef]
- Shen, H.; Yuan, Y.; Hu, H.G.; Zhong, X.; Ye, X.X.; Li, M.D.; Feng, W.J.; Zheng, S. Clinical significance of K-ras and BRAF mutations in Chinese colorectal cancer patients. World J. Gastroenterol. 2011, 17, 809–816. [Google Scholar] [CrossRef]
- Won, D.D.; Lee, J.I.; Lee, I.K.; Oh, S.T.; Jung, E.S.; Lee, S.H. The prognostic significance of KRAS and BRAF mutation status in Korean colorectal cancer patients. BMC Cancer 2017, 17, 403. [Google Scholar] [CrossRef] [PubMed]
- Andreyev, H.J.; Norman, A.R.; Cunningham, D.; Oates, J.R.; Clarke, P.A. Kirsten ras mutations in patients with colorectal cancer: The multicenter “RASCAL” study. J. Natl. Cancer Inst. 1998, 90, 675–684. [Google Scholar] [CrossRef] [PubMed]
- Ryan, B.M.; Lefort, F.; McManus, R.; Daly, J.; Keeling, P.W.N.; Weir, D.G.; Kelleher, D. A prospective study of circulating mutant KRAS2 in the serum of patients with colorectal neoplasia: Strong prognostic indicator in postoperative follow up. J. Clin. Pathol.-Mol. Pathol. 2003, 56, 172–179. [Google Scholar] [CrossRef]
- Lecomte, T.; Berger, A.; Zinzindohoue, F.; Micard, S.; Landi, B.; Blons, H.; Beaune, P.; Cugnenc, P.H.; Laurent-Puig, P. Detection of free-circulating tumor-associated DNA in plasma of colorectal cancer patients and its association with prognosis. Int. J. Cancer 2002, 100, 542–548. [Google Scholar] [CrossRef] [PubMed]
- Bazan, V.; Bruno, L.; Augello, C.; Agnese, V.; Calo, V.; Corsale, S.; Gargano, G.; Terrasi, M.; Schiro, V.; Fede, G.; et al. Molecular detection of TP53, Ki-Ras and p16INK4A promoter methylation in plasma of patients with colorectal cancer and its association with prognosis. Results of a 3-year GOIM (Gruppo Oncologico dell’Italia Meridionale) prospective study. Ann. Oncol. 2006, 17 (Suppl. 7), vii84–vii90. [Google Scholar] [CrossRef] [PubMed]
- Lindforss, U.; Zetterquist, H.; Papadogiannakis, N.; Olivecrona, H. Persistence of K-ras mutations in plasma after colorectal tumor resection. Anticancer Res. 2005, 25, 657–661. [Google Scholar] [PubMed]
- Wang, J.Y.; Hsieh, J.S.; Chang, M.Y.; Huang, T.J.; Chen, F.M.; Cheng, T.L.; Alexandersen, K.; Huang, Y.S.; Tzou, W.S.; Lin, S.R. Molecular detection of APC, K-ras, and p53 mutations in the serum of colorectal cancer patients as circulating biomarkers. World J. Surg. 2004, 28, 721–726. [Google Scholar] [CrossRef]
- Trevisiol, C.; Di Fabio, F.; Nascimbeni, R.; Peloso, L.; Salbe, C.; Ferruzzi, E.; Salerni, B.; Gion, M. Prognostic value of circulating KRAS2 gene mutations in colorectal cancer with distant metastases. Int. J. Biol. Markers 2006, 21, 223–228. [Google Scholar] [CrossRef]
- Sefrioui, D.; Sarafan-Vasseur, N.; Beaussire, L.; Baretti, M.; Gangloff, A.; Blanchard, F.; Clatot, F.; Sabourin, J.; Sesboüé, R.; Frebourg, T.; et al. Clinical value of chip-based digital-PCR platform for the detection of circulating DNA in metastatic colorectal cancer. Dig. Liver Dis. 2015, 47, 884–890. [Google Scholar] [CrossRef]
- Tie, J.; Kinde, I.; Wang, Y.; Wong, H.L.; Skinner, I.; Wong, R.; Steel, M.; Diaz, L.; Papadopoulos, N.; Kosmider, S.; et al. Circulating tumor DNA (ctDNA) as a marker of recurrence risk in stage II colon cancer (CC). J. Clin. Oncol. 2014, 32 (Suppl. 15), 11015. [Google Scholar] [CrossRef]
- Tie, J.; Wang, Y.; Tomasetti, C.; Li, L.; Springer, S.; Kinde, I.; Silliman, N.; Tacey, M.; Wong, H.L.; Christie, M.; et al. Circulating tumor DNA analysis detects minimal residual disease and predicts recurrence in patients with stage II colon cancer. Sci. Transl. Med. 2016, 8, 346ra92. [Google Scholar] [CrossRef]
- El Messaoudi, S.; Mouliere, F.; Du Manoir, S.; Bascoul-Mollevi, C.; Gillet, B.; Nouaille, M.; Fiess, C.; Crapez, E.; Bibeau, F.; Theillet, C.; et al. Circulating DNA as a Strong Multimarker Prognostic Tool for Metastatic Colorectal Cancer Patient Management Care. Clin. Cancer Res. Off. J. Am. Assoc. Cancer Res. 2016, 22, 3067–3077. [Google Scholar] [CrossRef]
- Spindler, K.G.; Appelt, A.L.; Pallisgaard, N.; Andersen, R.F.; Jakobsen, A. KRAS-mutated plasma DNA as predictor of outcome from irinotecan monotherapy in metastatic colorectal cancer. Br. J. Cancer 2013, 109, 3067–3072. [Google Scholar] [CrossRef]
- Bai, Y.Q.; Liu, X.J.; Wang, Y.; Ge, F.J.; Zhao, C.H.; Fu, Y.L.; Lin, L.; Xu, J.M. Correlation analysis between abundance of K-ras mutation in plasma free DNA and its correlation with clinical outcome and prognosis in patients with metastatic colorectal cancer. Zhonghua Zhong Liu Za Zhi 2013, 35, 666–671. [Google Scholar] [PubMed]
- Xu, J.M.; Liu, X.J.; Ge, F.J.; Lin, L.; Wang, Y.; Sharma, M.R.; Liu, Z.Y.; Tommasi, S.; Paradiso, A. KRAS mutations in tumour tissue and plasma by different assays predict survival of patients with metastatic colorectal cancer. J. Exp. Clin. Cancer Res. 2014, 33, 104. [Google Scholar] [CrossRef] [PubMed]
- Kim, S.T.; Chang, W.J.; Jin, L.; Sung, J.S.; Choi, Y.J.; Kim, Y.H. Can serum be used for analyzing the KRAS mutation status in patients with advanced colorectal cancer? Cancer Res. Treat. 2015, 47, 796–803. [Google Scholar] [CrossRef] [PubMed]
- Lin, J.K.; Lin, P.C.; Lin, C.H.; Jiang, J.K.; Yang, S.H.; Liang, W.Y.; Chen, W.S.; Chang, S.C. Clinical relevance of alterations in quantity and quality of plasma DNA in colorectal cancer patients: Based on the mutation spectra detected in primary tumors. Ann. Surg. Oncol. 2014, 21 (Suppl. 4), S680–S686. [Google Scholar] [CrossRef] [PubMed]
- Edge, S.; Byrd, D.; Compton, C.; Fritz, A.; Greene, F.; Trotti, A. AJCC Cancer Staging Manual, 7th ed.; Springer: New York, NY, USA, 2010. [Google Scholar]
- Armbruster, D.; Pry, T. Limit of blank, limit of detection and limit of quantification. Clin. Biochem. Rev. 2008, 9 (Suppl. 1), S49–S52. [Google Scholar]
- Cefali, M.; Epistolio, S.; Palmarocchi, M.; Frattini, M.; De Dosso, S. Research progress on KRAS mutations in colorectal cancer. J. Cancer Metastasis Treat. 2021, 7, 26. [Google Scholar] [CrossRef]
- Sefrioui, D.; Beaussire, L.; Clatot, F.; Delacour, J.; Perdrix, A.; Frebourg, T.; Michel, P.; Di Fiore, F.; Sarafan-Vasseur, N. Heparinase enables reliable quantification of circulating tumour DNA from heparinized plasma samples by droplet digital PCR. Clin. Chem. Acta 2017, 472, 75–79. [Google Scholar] [CrossRef] [PubMed]
- Dingle, T.; Sedlak, R.; Cook, L.; Jerome, K. Tolerance of droplet-digital PCR versus real-time quantitative PCR to inhibitory substances. Clin. Chem. 2013, 59, 1670–1672. [Google Scholar] [CrossRef] [PubMed]
- Kojabad, A.; Farzanehpour, M.; Galeh, H.; Dorostkar, R.; Jafarpour, A.; Bolandian, M.; Nodooshan, M. Droplet digital PCR of viral DNA/RNA, current progress, challenges, and future perspectives. J. Med. Virol. 2021, 93, 4182–4197. [Google Scholar] [CrossRef]
- Jones, R.; Sutton, P.; Evans, J.; Clifford, R.; McAvoy, A.; Lewis, J.; Rousseau, A.; Mountford, R.; McWhirter, D.; Malik, H. Specific mutations in KRAS codon 12 are associated with worse overall survival in patients with advanced and recurrent colorectal cancer. BJC 2017, 116, 923–929. [Google Scholar] [CrossRef] [PubMed]
- Imamura, Y.; Morikawa, T.; Liao, X.; Lochhead, P.; Kuchiba, A.; Yamauchi, M.; Qian, Z.; Nishihara, R.; Meyerhardt, J.; Haigis, K.; et al. Specific mutations in KRAS codons 12 and 13, and patient prognosis in 1075 BRAF-wild-type colorectal cancers. Clin Cancer Res. 2012, 18, 4753–4763. [Google Scholar] [CrossRef]
- Modest, D.; Ricard, I.; Heinemann, V.; Hegewisch-Becker, S.; Schmiegel, W.; Porschen, R.; Stintzing, S.; Graeven, U.; Arnold, D.; Weikersthal, L.; et al. Outcome according to KRAS-, NRAS- and BRAF-mutation as well as KRAS mutation variants: Pooled analysis of five randomized trials in metastatic colorectal cancer by the AIO colorectal cancer study group. Ann. Oncol. 2016, 27, 1746–1753. [Google Scholar] [CrossRef]
- Mendoza-Moreno, F.; Diez-Alonso, M.; Matias-Garcia, B.; Ovejero-Merino, E.; Gómez-Sanz, R.; Blázquez-Martin, A.; Quiroga-Valcárcel, A.; Molina, R.; San-Juan, A.; Barrena-Blázquez, S.; et al. Prognostic factors of survival in patients with peritoneal metastasis from colorectal cancer. J. Clin. Med. 2022, 11, 4922. [Google Scholar] [CrossRef]
- Alkader, M.; Altaha, R.; Badwan, S.; Halalmeh, A.; Al-Khawaldeh, M.; Atmeh, M.; Jabali, E.; Attieh, O.; Al-Soudi, H.; Alkhatib, L.; et al. Impact of KRAS mutation on survival outcome of patients with metastatic colorectal cancer in Jordan. Cureus 2023, 15, e33736. [Google Scholar] [CrossRef]
- Kidess, E.; Heirich, K.; Wiggin, M.; Vysotskaia, V.; Visser, B.; Marziali, A.; Wiedenmann, B.; Norton, J.; Lee, M.; Jeffrey, S.; et al. Mutation profiling of tumour DNA from plasma and tumour tissue of colorectal cancer patients with a novel, high-sensitivity multiplexed mutation detection platform. Oncotarget 2014, 6, 2549–2561. [Google Scholar] [CrossRef]
- Pedersen, S.; Symonds, E.; Baker, R.; Murray, D.; McEvoy, A.; Van Doorn, S.; Mundt, M.; Cole, S.; Gopalsamy, G.; Mangira, D.; et al. Evaluation of an assay for methylated BCAT1 and IKZF1 in plasma for detection of colorectal neoplasia. BMC Cancer 2015, 15, 654. [Google Scholar] [CrossRef]
- Church, T.; Wandell, M.; Lofton-Day, C.; Mongin, S.; Burger, M.; Payne, S.; Castanos-Vélez, E.; Blumenstein, B.; Rösch, T.; Osborn, N.; et al. Prospective evaluation of methylated SEPT9 in plasma for detection of asymptomatic colorectal cancer. Gut 2014, 63, 317–325. [Google Scholar] [CrossRef]
- Diaz, L.; Williams, R.; Wu, J.; Kinde, I.; Hecht, J.R.; Berlin, J.; Allen, B.; Bozic, I.; Reiter, J.; Nowak, M.; et al. The molecular evolution of acquired resistance to targeted EGFR blockade in colorectal cancers. Nature 2012, 486, 537–540. [Google Scholar] [CrossRef]
- Misale, S.; Yaeger, R.; Hobor, S.; Scala, E.; Janakiraman, M.; Liska, D.; Valtorta, E.; Schiavo, R.; Buscarino, M.; Siravegna, G.; et al. Emergence of KRAS mutations and acquired resistance to anti-EGFR therapy in colorectal cancer. Nature 2012, 486, 532–536. [Google Scholar] [CrossRef]
- Van Emburgh, B.; Arena, S.; Siravegna, G.; Lazzari, L.; Crisafulli, G.; Corti, G.; Mussolin, B.; Baldi, F.; Buscarino, M.; Bartolini, A.; et al. Acquired RAS or EGFR mutations and duration of response to EGFR blockade in colorectal cancer. Nat. Commun. 2016, 7, 13665. [Google Scholar] [CrossRef]
- Tougeron, D.; Lecomte, T.; Pagès, J.; Villalve, C.; Collin, C.; Ferru, A.; Tourani, J.; Silvain, C.; Levillain, P.; Karayan-Tapon, L. Effect of low-frequency KRAS mutations on the response to anti-EGFR therapy in metastatic colorectal cancer. Ann. Oncol. 2013, 24, 1267–1273. [Google Scholar] [CrossRef]
- Karapetis, C.; Khambata-Ford, S.; Jonker, D.; O’Callaghan, C.; Tu, D.; Tebbutt, N.; Simes, R.; Chalchal, H.; Shapiro, J.; Robitaille, S.; et al. K-ras mutations and benefit from Cetuximab in advanced colorectal cancer. NEJM 2008, 359, 1757–1765. [Google Scholar] [CrossRef]
- Troiani, T.; Napolitano, S.; Vitagliano, D.; Morgillo, F.; Capasso, A.; Sforza, V.; Nappi, A.; Ciardiello, D.; Ciardiello, F.; Martinelli, E. Primary and acquired resistance of colorectal cancer cells to anti-EGFR antibodies converge on MEK/ERK pathway activation and can be overcome by combined MEK/EGFR inhibition. Clin. Cancer Res. 2014, 20, 3775–3786. [Google Scholar] [CrossRef]
- Zhou, J.; Ji, Q.; Li, Q. Resistance to anti-EGFR therapies in metastatic colorectal cancer: Underlying mechanisms and reversal strategies. J. Exp. Clin. Cancer Res. 2021, 40, 328. [Google Scholar] [CrossRef]
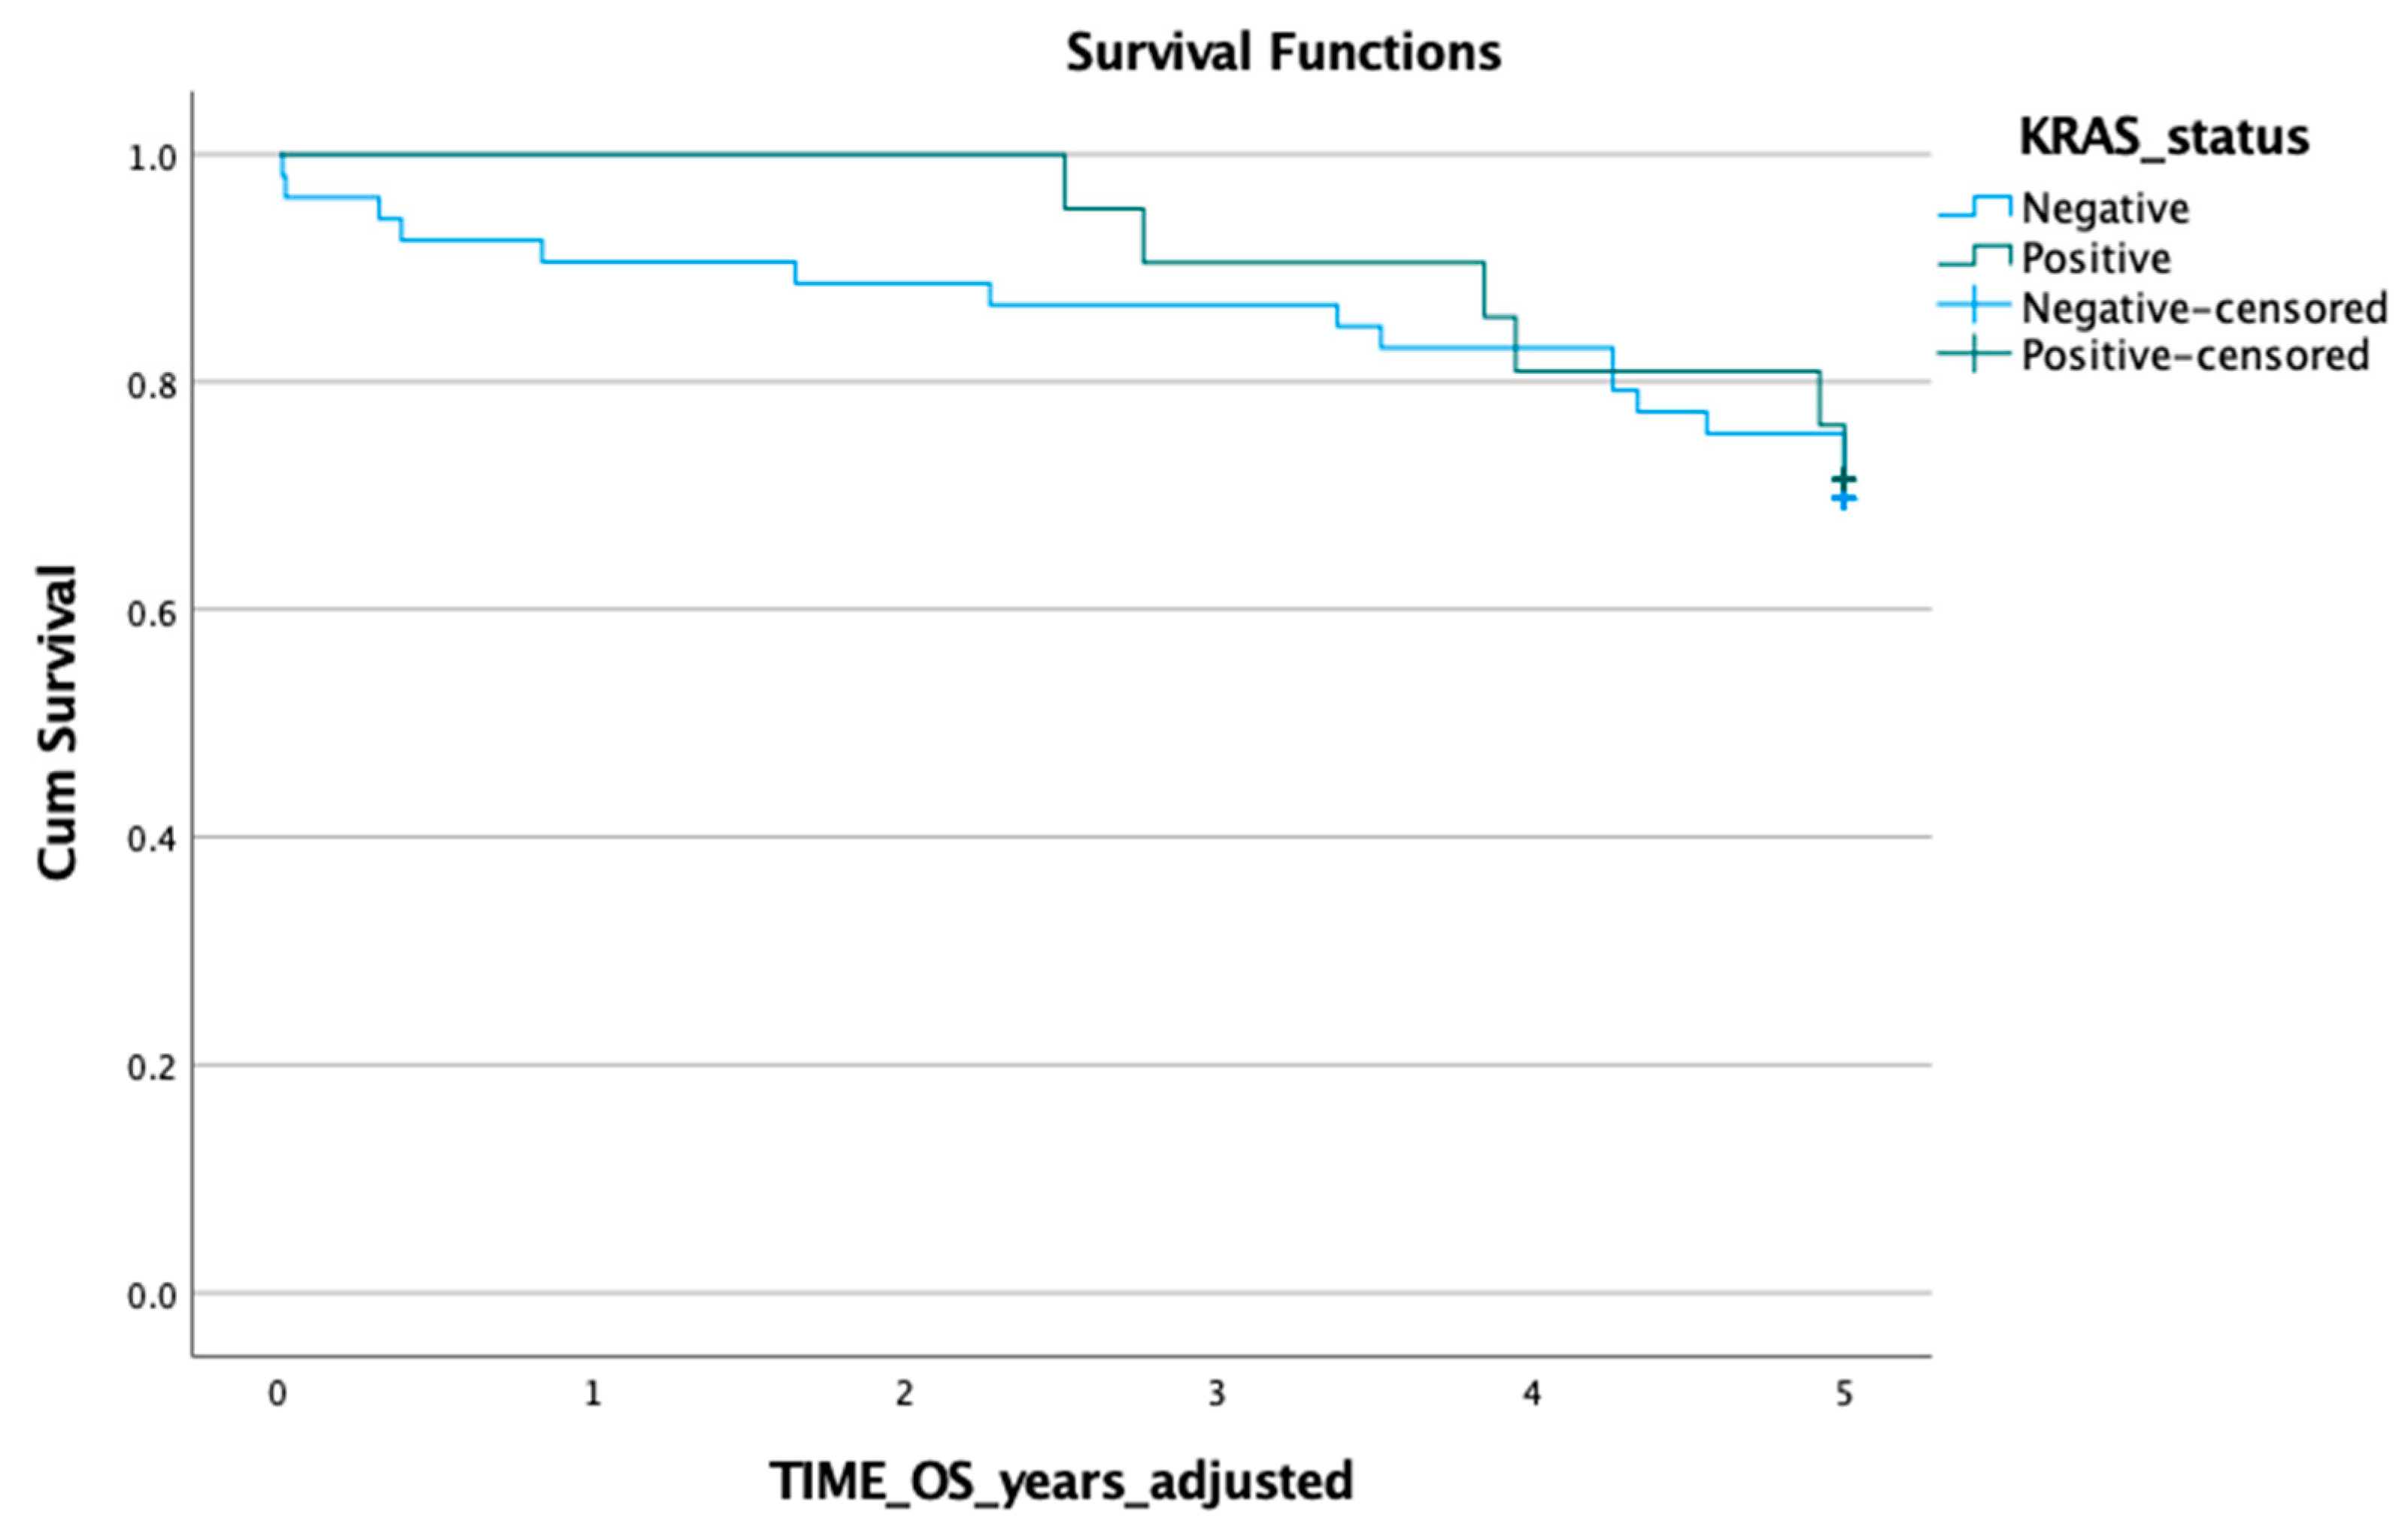
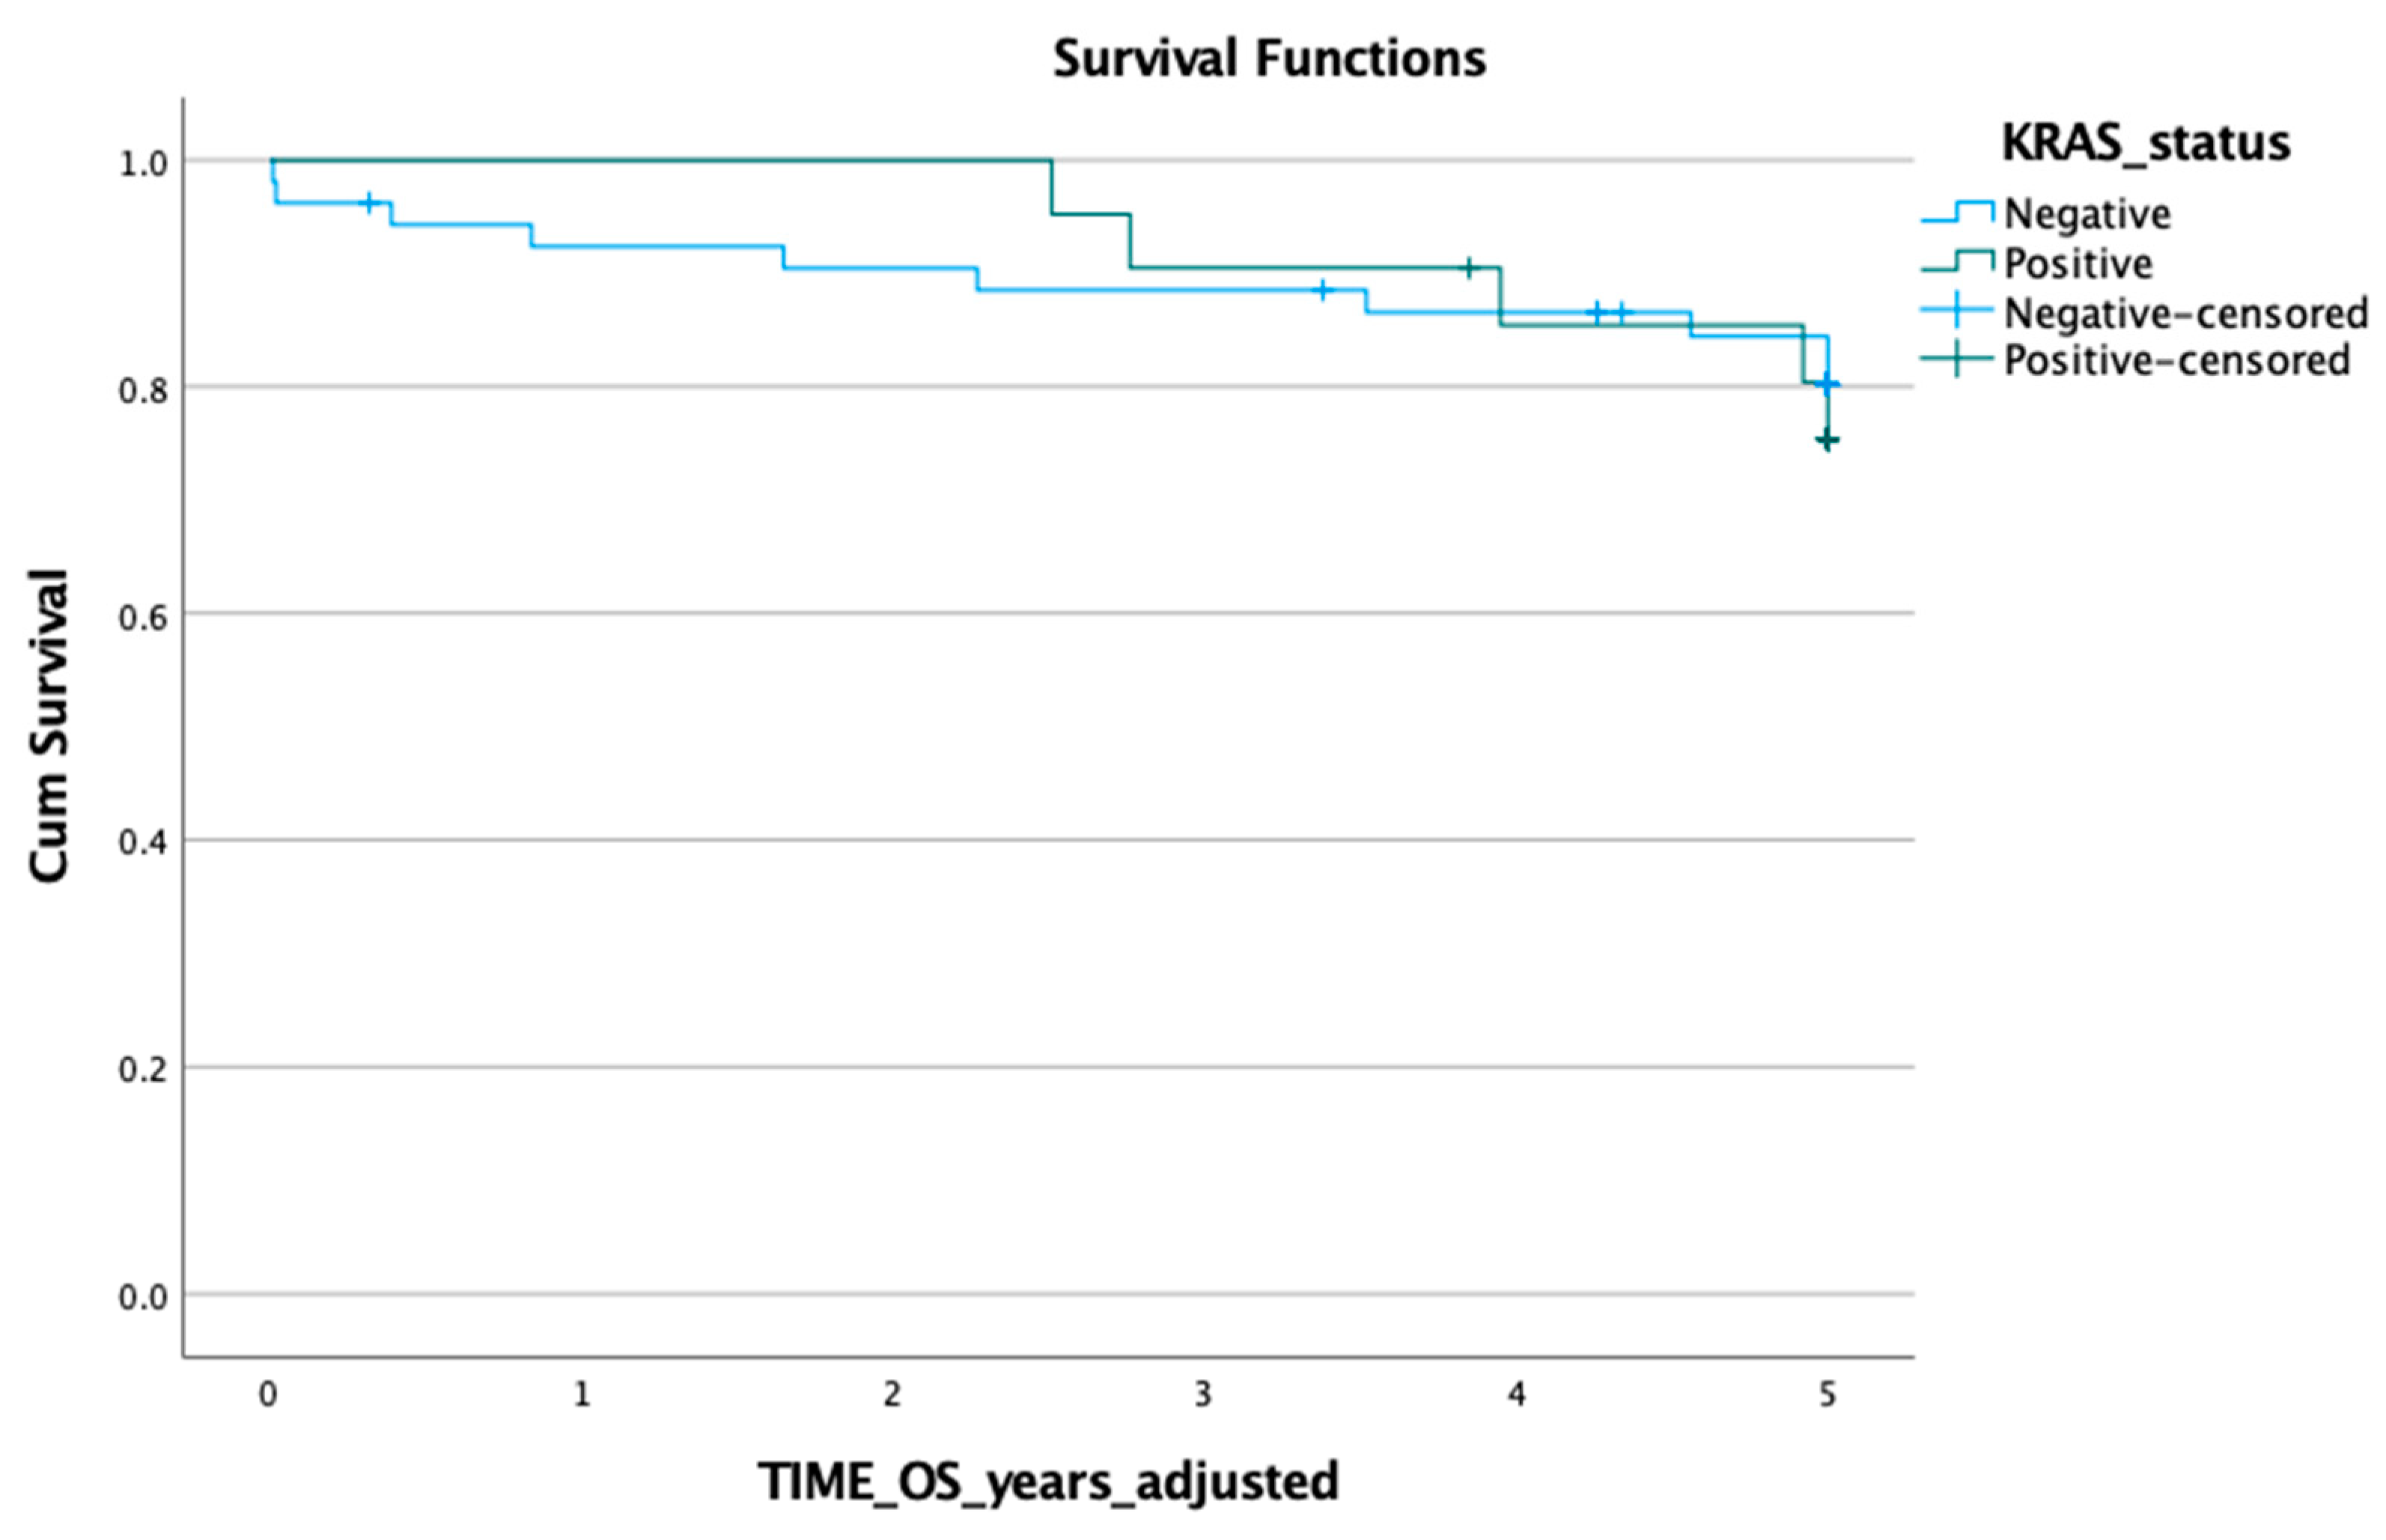
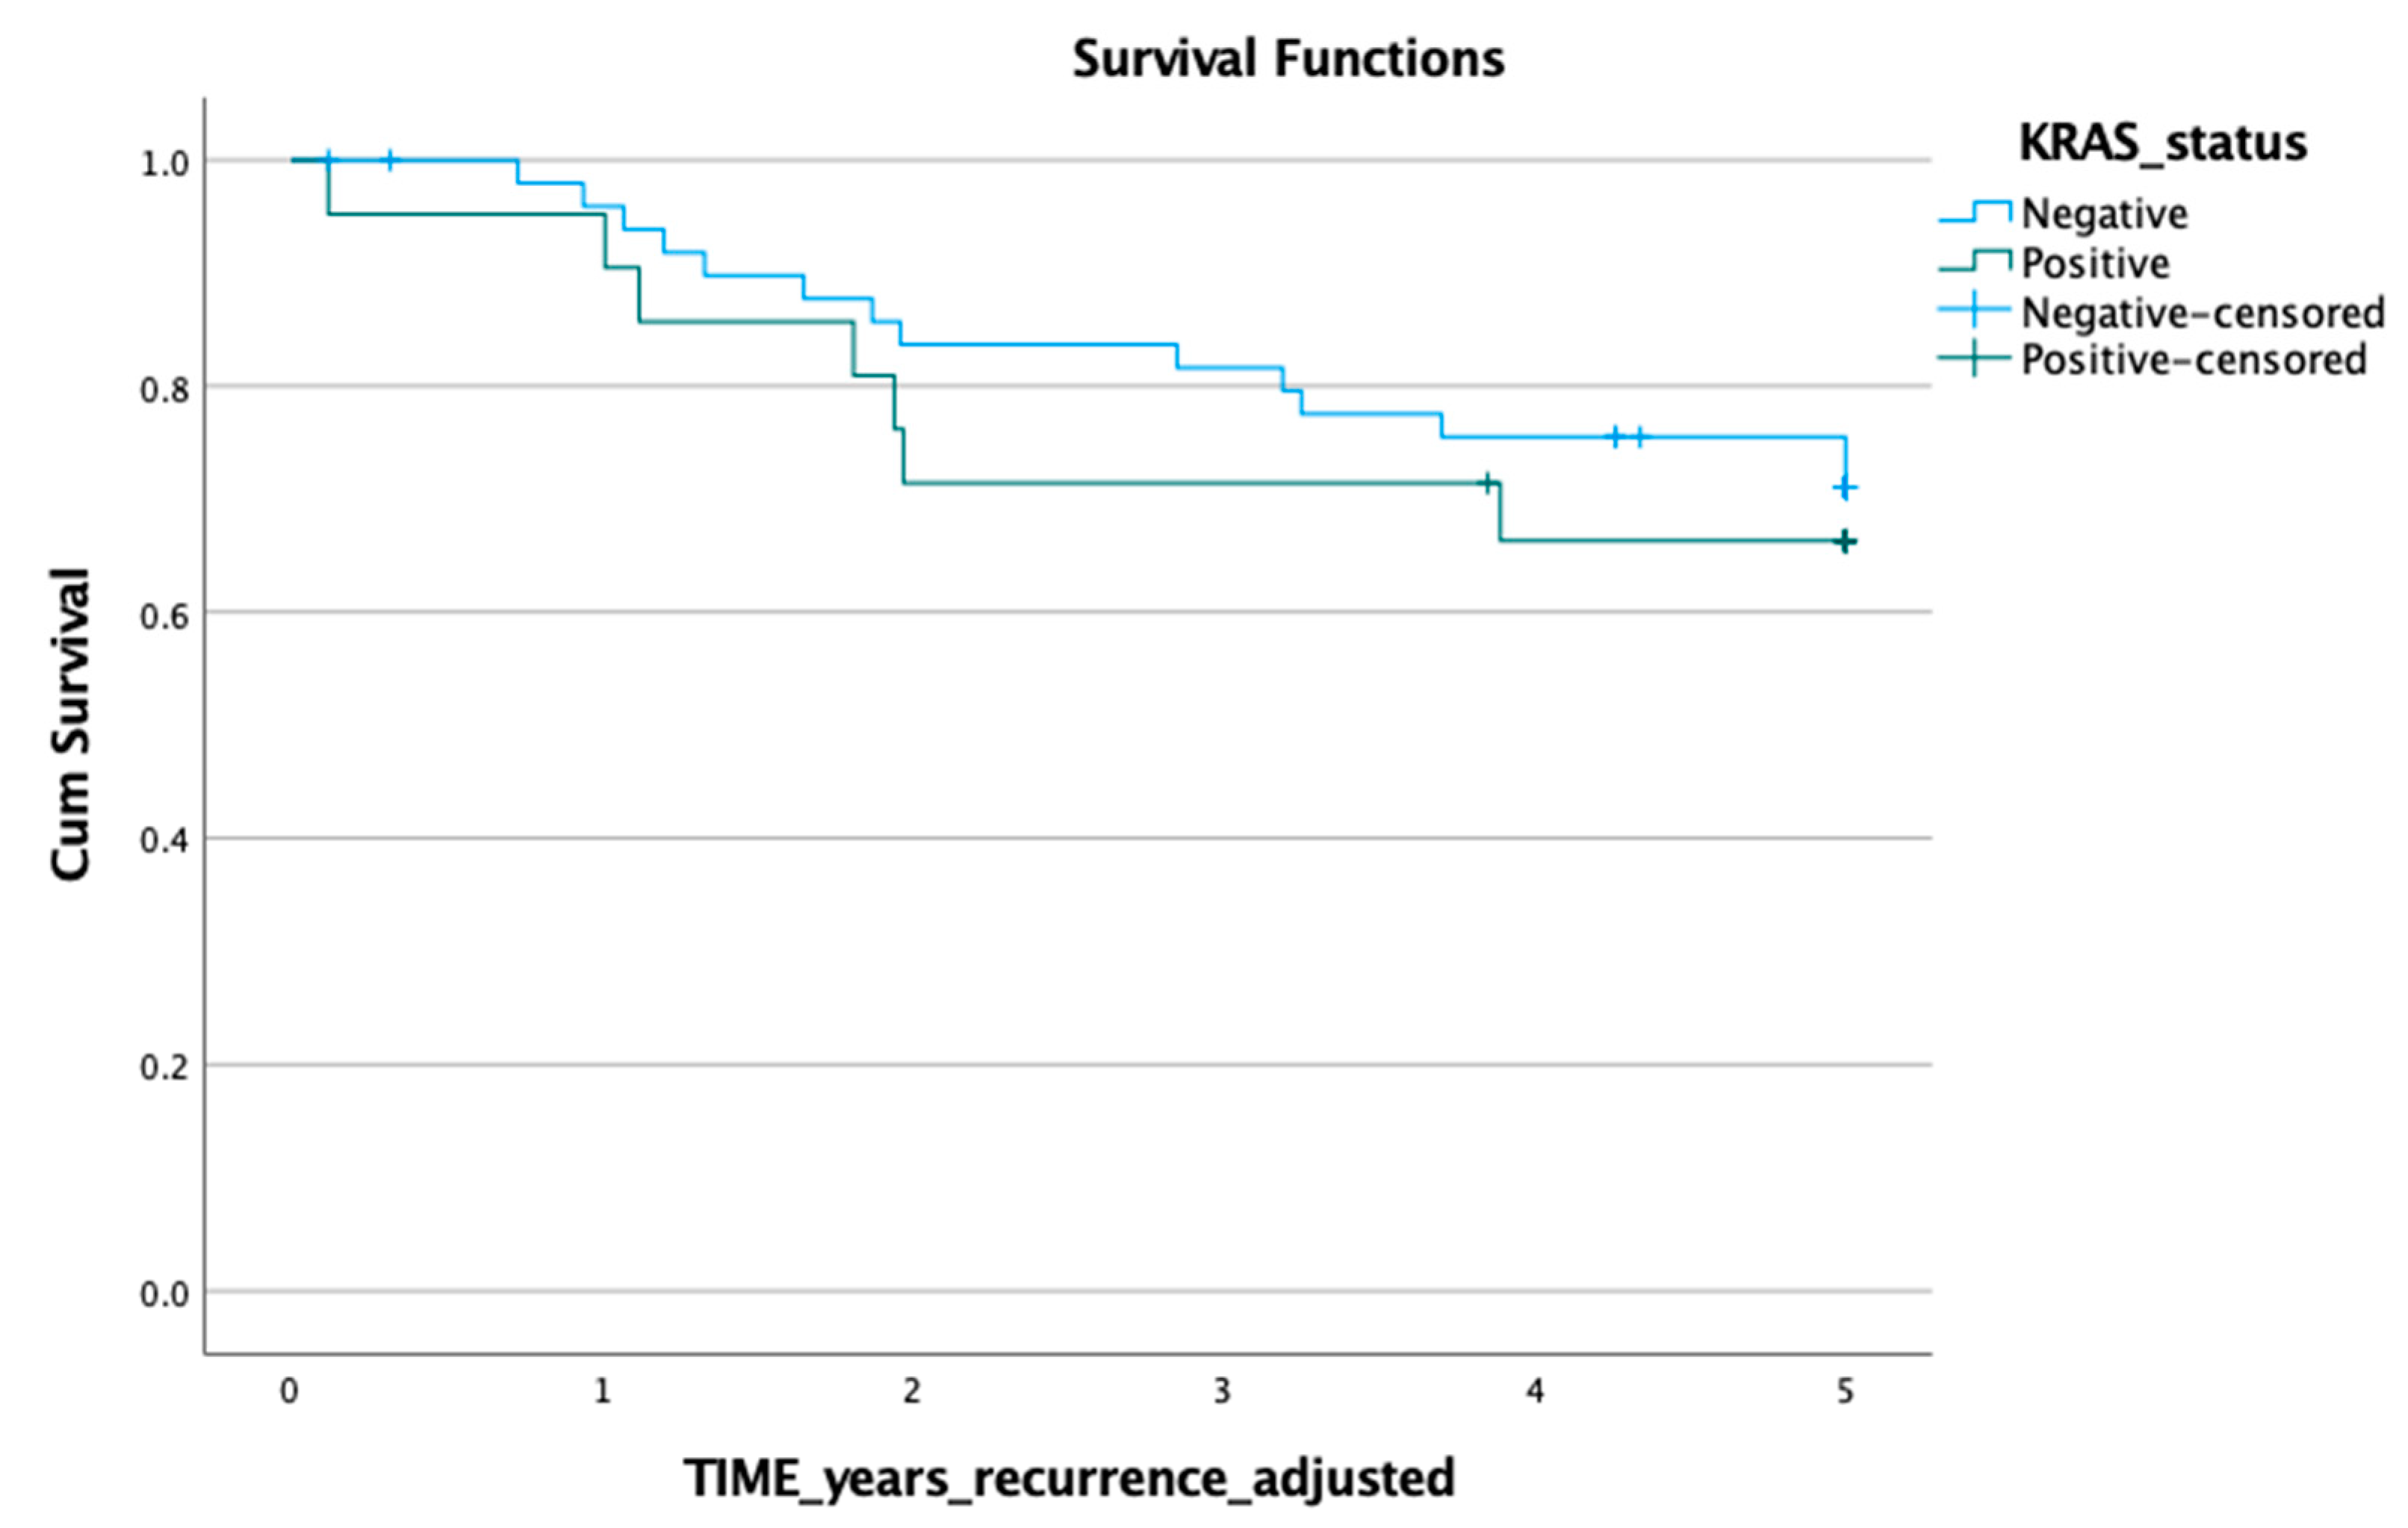
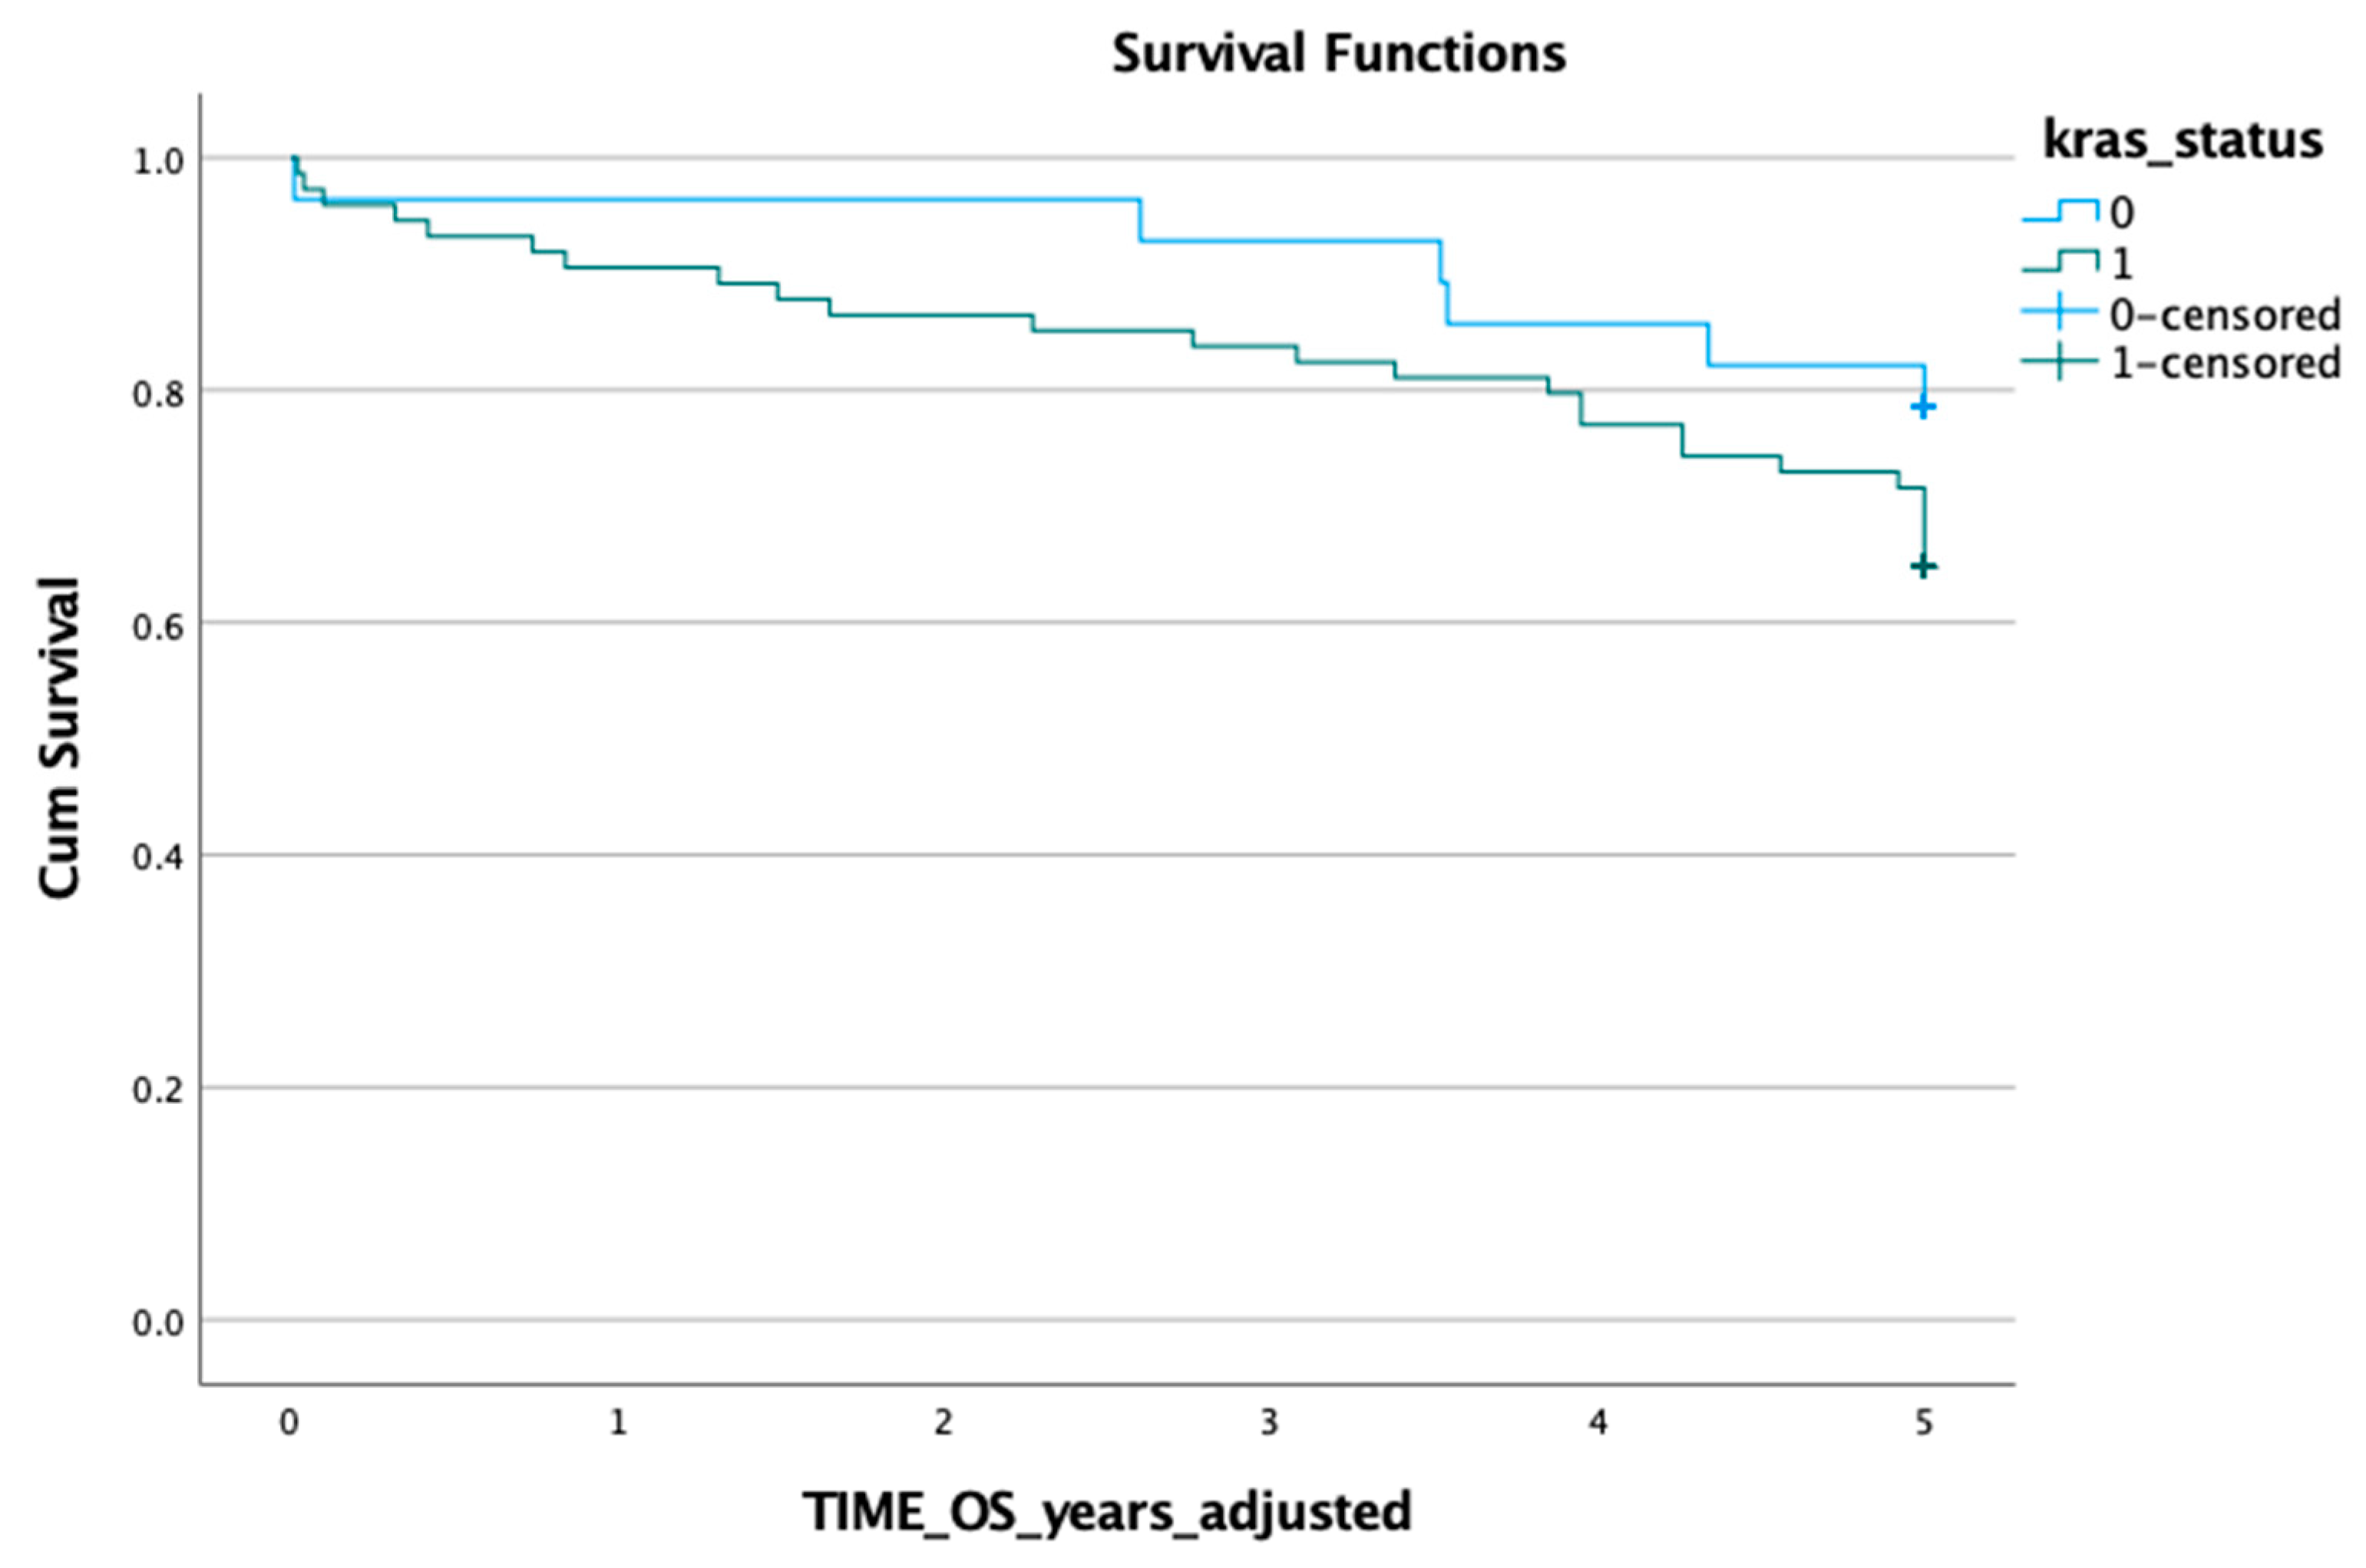
| Negative | Positive | Total | p-Value Exact | ||
|---|---|---|---|---|---|
| Characteristic | Response/Statistic | (n = 57) | (n = 23) | (N = 80) | |
| Sex | Male | 33 (58%) | 9 (39%) | 42 (53%) | 0.146 |
| Female | 24 (42%) | 14 (61%) | 38 (48%) | ||
| Smoking status | Non-smoker | 30 (53%) | 18 (78%) | 48 (60%) | 0.038 |
| Ex-smoker | 20 (35%) | 2 (9%) | 22 (28%) | ||
| Smoker | 7 (12%) | 3 (13%) | 10 (13%) | ||
| Age at operation | mean (SD) | 68.91 (13.52) | 72.87 (9.28) | 70.04 (12.52) | 0.374 |
| median | 71.60 | 73.60 | 72.23 | ||
| BMI | mean (SD) | 28.99 (5.81) | 28.56 (4.80) | 28.87 (5.52) | 0.642 |
| median | 27.96 | 28.10 | 28.10 | ||
| CCI score | mean (SD) | 4.91 (1.56) | 4.84 (2.31) | 4.86 (2.11) | 0.429 |
| median | 5 | 5 | 5 | ||
| Recurrence | No | 42 (74%) | 15 (65%) | 57 (71%) | 0.586 |
| Yes | 15 (26%) | 8 (35%) | 23 (29%) | ||
| Site of cancer | Right | 20 (35%) | 9 (39%) | 29 (36%) | 1.0 |
| Left | 34 (60%) | 14 (61%) | 48 (60%) | ||
| Synchronous | 2 (3% | 0 | 2 (3%) | ||
| Missing | 1 (2%) | 0 | 1 (1%) | ||
| Tumour grade | Well or mod | 45 (80%) | 15 (65%) | 60 (76%) | 0.249 |
| Poorly | 4 (7.1%) | 5 (22%) | 9 (11%) | ||
| Mucinous or medullary | 7 (13%) | 3 (13%) | 10 (13%) | ||
| Missing | 1 | 0 | 1 | ||
| Pathological stage | In situ | 3 (5.3%) | 0 | 3 (3.8%) | 0.853 |
| Stage 1 | 13 (23%) | 5 (22%) | 18 (23%) | ||
| Stage 2 | 20 (35%) | 7 (30%) | 27 (34%) | ||
| Stage 3 | 17 (30%) | 9 (39%) | 26 (33%) | ||
| Stage 4 | 4 (7.0%) | 2 (8.7%) | 6 (7.5%) | ||
| Resection margin | R0 | 52 (91%) | 20 (87%) | 72 (90%) | 0.830 |
| R1 | 2 (4%) | 1 (4%) | 3 (4%) | ||
| R2 | 3 (5%) | 2 (9%) | 5 (6%) | ||
| Adjuvant chemotherapy | Received | 18 (32%) | 13 (57%) | 31 (39%) | 0.046 |
| Not received | 39 (68%) | 10 (43%) | 49 (61%) |
| Negative | Positive | Total | Log-Rank | ||
|---|---|---|---|---|---|
| Characteristic | Response/Statistic | (n = 57) | (n = 23) | (N = 80) | p-Value |
| Overall survival * | mean (SD) | 6.42 (0.357) | 6.30 (0.375) | 6.44 (0.295) | 0.891 |
| Overall survival ** | mean (SD) | 4.34 (0.206) | 4.67 (0.175) | 4.43 (0.155) | 0.832 |
| Survival outcome | Censored | 37 (65%) | 15 (65%) | 52 (65%) | |
| Death | 16 (28%) | 6 (26%) | 22 (27%) | ||
| Missing data/Excluded | 4 (7%) | 2 (9%) | 6 (8%) | ||
| Cancer-specific survival * | mean (SD) | 6.87 (0.332) | 6.44 (0.365) | 6.81 (0.282) | 0.690 |
| Cancer-specific survival ** | mean (SD) | 4.49 (0.197) | 4.72 (0.175) | 4.55 (0.146) | 0.747 |
| Survival status | Censored | 43 (75%) | 16 (70%) | 53 (66%) | |
| Cancer-specific death | 10 (18%) | 5 (22%) | 21 (26%) | ||
| Missing data | 4 (7%) | 2 (9%) | 6 (8%) | ||
| Recurrence-free survival * | mean (SD) | 6.37 (0.376) | 5.12 (0.548) | 6.22 (0.331) | 0.590 |
| Recurrence-free survival ** | mean (SD) | 4.26 (0.205) | 3.89 (0.367) | 4.15 (0.182) | 0.616 |
| Survival status | Censored | 37 (65%) | 14 (61%) | 51 (64%) | |
| Recurrence | 14 (25%) | 7 (30%) | 21 (26%) | ||
| Missing data | 6 (11%) | 2 (9%) | 8 (10%) |
| Crude | Adjusted + | |||||
|---|---|---|---|---|---|---|
| Model | HR (95% CI) | p-Value | N | HR (95% CI) | p-Value | N |
| Overall survival * | 0.94 (0.37, 2.40) | 0.891 | 74 | 0.97 (0.38, 2.50) | 0.952 | 74 |
| Cancer survival * | 1.24 (0.42, 3.65) | 0.691 | 74 | 1.26 (0.43, 3.71) | 0.673 | 74 |
| Recurrence * | 1.28 (0.52, 3.18) | 0.591 | 72 | 1.28 (0.52, 3.17) | 0.598 | 72 |
| Overall survival ** | 0.90 (0.35, 2.31) | 0.833 | 74 | 0.94 (0.37, 2.40) | 0.888 | 74 |
| Cancer survival ** | 1.19 (0.41, 3.49) | 0.748 | 74 | 1.21 (0.41, 3.54) | 0.731 | 74 |
| Recurrence ** | 1.26 (0.51, 3.12) | 0.617 | 72 | 1.26 (0.51, 3.11) | 0.623 | 72 |
| Negative | Positive | Total | p-Value Exact | ||
|---|---|---|---|---|---|
| Characteristic | Response/Statistic | (n = 29) | (n = 78) | (N = 107) | |
| Sex | Male | 15 (52%) | 45 (58%) | 60 (56%) | 0.663 |
| Female | 14 (48%) | 33 (42%) | 47 (44%) | ||
| Smoking status | Non-smoker | 19 (66%) | 48 (62%) | 67 (63%) | 0.286 |
| Ex-smoker | 5 (17%) | 23 (29%) | 28 (26%) | ||
| Smoker | 5 (17%) | 7 (9%) | 12 (11%) | ||
| Age at operation | mean (SD) | 65.66 (14.18) | 71.32 (11.38) | 69.78 (12.39) | 0.623 |
| median | 65.60 | 73.55 | 71.60 | ||
| BMI | mean (SD) | 27.96 (6.22) | 28.49 (4.91) | 28.34 (5.28) | 0.346 |
| median | 28.88 | 27.30 | 27.75 | ||
| CCI score | mean (SD) | 4.48 (1.7) | 5.42 (1.96) | 5.17 (1.93) | 0.531 |
| median | 4 | 5 | 5 | ||
| Recurrence | No | 24 (83%) | 59 (76%) | 83 (78%) | 0.603 |
| Yes | 5 (17%) | 19 (24%) | 24 (22%) | ||
| Site of cancer | Right | 8 (28%) | 32 (41%) | 40 (37%) | 0.444 |
| Left | 21 (72%) | 43 (55%) | 64 60%) | ||
| Synchronous | 0 | 2 (3%) | 2 (2%) | ||
| Missing | 0 | 1 (1%) | 1 (1%) | ||
| Tumour grade | Well or mod | 23 (79%) | 59 (77%) | 82 (77%) | 1.0 |
| Poorly | 2 (6.9%) | 7 (9.1%) | 9 (8.5%) | ||
| Mucinous or medullary | 4 (14%) | 11 (14%) | 15 (14%) | ||
| Missing | 0 | 1 | 1 | ||
| Pathological stage | In situ | 3 (10%) | 2 (2.6%) | 5 (4.7%) | 0.413 |
| Stage 1 | 6 (21%) | 19 (24%) | 25 (23%) | ||
| Stage 2 | 7 (24%) | 26 (33%) | 33 (31%) | ||
| Stage 3 | 12 (41%) | 26 (33%) | 38 (36%) | ||
| Stage 4 | 1 (3.4%) | 5 (6.4%) | 6 (5.6%) | ||
| Resection margin | R0 | 28 (97%) | 73 (94% | 101 (94%) | 0.829 |
| R1 | 0 | 2 (3%) | 2 (2%) | ||
| R2 | 1 (3%) | 3(4%) | 4 (4%) | ||
| Adjuvant chemotherapy | Received | 14 (48%) | 27 (35%) | 41 (38%) | 0.263 |
| Not received | 15 (52%) | 51 (65%) | 66 (62%) |
| Negative | Positive | Total | Log-Rank | ||
|---|---|---|---|---|---|
| Characteristic | Response/Statistic | (n = 29) | (n = 78) | (N = 107) | p-Value |
| Overall survival time * | mean (SD) | 6.45 (0.352) | 6.22 (0.321) | 6.42 (0.264) | 0.251 |
| Overall survival time ** | mean (SD) | 4.61 (0.218) | 4.23 (0.179) | 4.34 (0.142) | 0.193 |
| Survival outcome | Censored | 22 (76%) | 48 (62%) | 70 (65%) | |
| Death | 6 (21%) | 26 (33%) | 32 (30%) | ||
| Missing data/excluded | 1 (3%) | 4 (5%) | 5 (5%) | ||
| Cancer-specific survival time * | mean (SD) | 6.71 (0.319) | 6.73 (0.303) | 6.87 (0.248) | 0.411 |
| Cancer-specific survival time ** | mean (SD) | 4.71 (0.215) | 4.41 (0.168) | 4.50 (0.132) | 0.312 |
| Survival status | Censored | 24 (83%) | 57 (73%) | 81 (76%) | |
| Cancer-specific death | 4 (14%) | 17 (22%) | 21 (20%) | ||
| Missing data/excluded | 1 (3%) | 4 (5%) | 5 (5%) | ||
| Recurrence-free survival time * | mean (SD) | 6.27 (0.418) | 6.46 (0.345) | 6.59 (0.284) | 0.439 |
| Recurrence-free survival time ** | mean (SD) | 4.41 (0.251) | 4.16 (0.196) | 4.23 (0.158) | 0.443 |
| Survival status | Censored | 22 (76%) | 54 (69%) | 76 (71%) | |
| Recurrence | 5 (17%) | 18 (23%) | 23 (22%) | ||
| Missing data/excluded | 2 (7%) | 6 (8%) | 8 (7%) |
| Negative | Positive | Total | Log-Rank | ||
|---|---|---|---|---|---|
| Characteristic | Response/Statistic | (n = 84) | (n = 23) | (N = 107) | p-Value |
| Overall survival time * | mean (SD) | 6.46 (0.280) | 6.12 (0.607) | 6.12 (0.264) | 0.628 |
| Overall survival time ** | mean (SD) | 4.39 (0.154) | 4.14 (0.365) | 4.34 (0.142) | 0.544 |
| Survival outcome | Censored | 56 (67%) | 14 (61%) | 70 (65%) | |
| Death | 24 (29%) | 8 (35%) | 32 (30%) | ||
| Missing data/excluded | 4 (5%) | 1 (4%) | 5 (5%) | ||
| Cancer-specific survival time * | mean (SD) | 6.95 (0.251) | 6.43 (0.606) | 6.87 (0.248) | 0.476 |
| Cancer-specific survival time ** | mean (SD) | 4.58 (0.138) | 4.19 (0.376) | 4.50 (0.132) | 0.382 |
| Survival status | Censored | 65 (77%) | 16 (70%) | 81 (76%) | |
| Cancer-specific death | 15 (18%) | 6 (26%) | 21 (20%) | ||
| Missing data/excluded | 4 (5%) | 1 (4%) | 5 (5%) | ||
| Recurrence-free survival time * | mean (SD) | 6.54 (0.306) | 6.43 (0.660) | 6.59 (0.284) | 0.914 |
| Recurrence-free survival time ** | mean (SD) | 4.28 (0.173) | 4.06 (0.373) | 4.23 (0.158) | 0.924 |
| Survival status | Censored | 60 (71%) | 16 (70%) | 76 (71%) | |
| Recurrence | 18 (21%) | 5 (22%) | 23 (22%) | ||
| Missing data/excluded | 6 (7%) | 2 (9%) | 8 (7%) |
| Crude | Adjusted + | ||||||
|---|---|---|---|---|---|---|---|
| Model | Cut-Off Method | HR (95% CI) | p-Value | N | HR (95% CI) | p-Value | N |
| OS * | LoD | 1.68 (0.69, 4.09) | 0.257 | 102 | 1.48 (0.60, 3.67) | 0.395 | 102 |
| CSS * | 1.58 (0.53, 4.73) | 0.415 | 102 | 1.49 (0.49, 4.53) | 0.485 | 102 | |
| RFS * | 1.48 (0.55, 3.98) | 0.441 | 99 | 1.43 (0.52, 3.91) | 0.488 | 99 | |
| OS * | >10% MAF | 1.22 (0.55, 2.73) | 0.628 | 102 | 1.04 (0.45, 2.36) | 0.934 | 102 |
| CSS * | 1.42 (0.54, 3.69) | 0.475 | 102 | 1.32 (0.49, 3.51) | 0.581 | 102 | |
| RFS * | 1.06 (0.39, 2.84) | 0.914 | 99 | 0.99 (0.36, 2.75) | 0.990 | 99 | |
| OS * | >5% MAF | 1.41 (0.65, 3.06) | 0.387 | 102 | 1.21 (0.55, 2.67) | 0.643 | 102 |
| CSS * | 1.74 (0.70, 4.35) | 0.237 | 102 | 1.64 (0.64, 4.19) | 0.305 | 102 | |
| RFS * | 1.34 (0.53, 3.39) | 0.540 | 99 | 1.28 (0.49, 3.34) | 0.617 | 99 | |
| OS * | >1% MAF | 1.25 (0.57, 2.71) | 0.576 | 102 | 1.10 (0.50, 2.41) | 0.820 | 102 |
| CSS * | 1.55 (0.62, 3.87) | 0.349 | 102 | 1.46 (0.58, 3.71) | 0.422 | 102 | |
| RFS * | 1.17 (0.46, 2.97) | 0.743 | 99 | 1.12 (0.43, 2.89) | 0.817 | 99 | |
| OS ** | LoD | 1.78 (0.73, 4.33) | 0.202 | 102 | 1.56 (0.63, 3.84) | 0.336 | 102 |
| CSS ** | 1.74 (0.58, 5.16) | 0.320 | 102 | 1.61 (0.53, 4.86) | 0.399 | 102 | |
| RFS ** | 1.47 (0.55, 3.96) | 0.446 | 99 | 1.42 (0.52, 3.90) | 0.491 | 99 | |
| OS ** | >10% MAF | 1.28 (0.57, 2.85) | 0.548 | 102 | 1.05 (0.46, 2.40) | 0.900 | 102 |
| CSS ** | 1.52 (0.59, 3.92) | 0.387 | 102 | 1.37 (0.52, 3.64) | 0.526 | 102 | |
| RFS ** | 1.05 (0.39, 2.83) | 0.924 | 99 | 0.99 (0.36, 2.74) | 0.983 | 99 | |
| OS ** | >5% MAF | 1.47 (0.68, 3.18) | 0.326 | 102 | 1.23 (0.56, 2.72) | 0.612 | 102 |
| CSS ** | 1.86 (0.75, 4.60) | 0.182 | 102 | 1.70 (0.67, 4.34) | 0.268 | 102 | |
| RFS ** | 1.33 (0.52, 3.73) | 0.548 | 99 | 1.27 (0.49, 3.32) | 0.624 | 99 | |
| OS ** | >1% MAF | 1.29 (0.60, 2.78) | 0.522 | 102 | 1.11 (0.50, 2.43) | 0.802 | 102 |
| CSS ** | 1.63 (0.66, 4.03) | 0.294 | 102 | 1.50 (0.59, 3.79) | 0.390 | 102 | |
| RFS ** | 1.16 (0.46, 2.94) | 0.757 | 99 | 1.11 (0.43, 2.87) | 0.829 | 99 | |
| ctDNA | ||||
|---|---|---|---|---|
| Positive | Negative | Total | ||
| Tumour tissue (LoD Cut-off) | Positive | 15 | 34 | 49 |
| Negative | 3 | 14 | 17 | |
| Total | 18 | 48 | 66 | |
| Tumour tissue (10% MAF Cut-off) | Positive | 6 | 6 | 12 |
| Negative | 12 | 42 | 54 | |
| Total | 18 | 48 | 66 | |
Disclaimer/Publisher’s Note: The statements, opinions and data contained in all publications are solely those of the individual author(s) and contributor(s) and not of MDPI and/or the editor(s). MDPI and/or the editor(s) disclaim responsibility for any injury to people or property resulting from any ideas, methods, instructions or products referred to in the content. |
© 2024 by the authors. Licensee MDPI, Basel, Switzerland. This article is an open access article distributed under the terms and conditions of the Creative Commons Attribution (CC BY) license (https://creativecommons.org/licenses/by/4.0/).
Share and Cite
Petit, J.; Carroll, G.; Zhao, J.; Pockney, P.; Scott, R.J. The Prognostic Utility of KRAS Mutations in Tissue and Circulating Tumour DNA in Colorectal Cancer Patients. Gastroenterol. Insights 2024, 15, 107-121. https://doi.org/10.3390/gastroent15010008
Petit J, Carroll G, Zhao J, Pockney P, Scott RJ. The Prognostic Utility of KRAS Mutations in Tissue and Circulating Tumour DNA in Colorectal Cancer Patients. Gastroenterology Insights. 2024; 15(1):107-121. https://doi.org/10.3390/gastroent15010008
Chicago/Turabian StylePetit, Joel, Georgia Carroll, Jie Zhao, Peter Pockney, and Rodney J. Scott. 2024. "The Prognostic Utility of KRAS Mutations in Tissue and Circulating Tumour DNA in Colorectal Cancer Patients" Gastroenterology Insights 15, no. 1: 107-121. https://doi.org/10.3390/gastroent15010008
APA StylePetit, J., Carroll, G., Zhao, J., Pockney, P., & Scott, R. J. (2024). The Prognostic Utility of KRAS Mutations in Tissue and Circulating Tumour DNA in Colorectal Cancer Patients. Gastroenterology Insights, 15(1), 107-121. https://doi.org/10.3390/gastroent15010008


