


Effects of Motor Preparation on Walking Ability in Active Ankle Dorsiflexion

 , ,
, ,
Abstract
1. Introduction
2. Materials and Methods
2.1. Participants
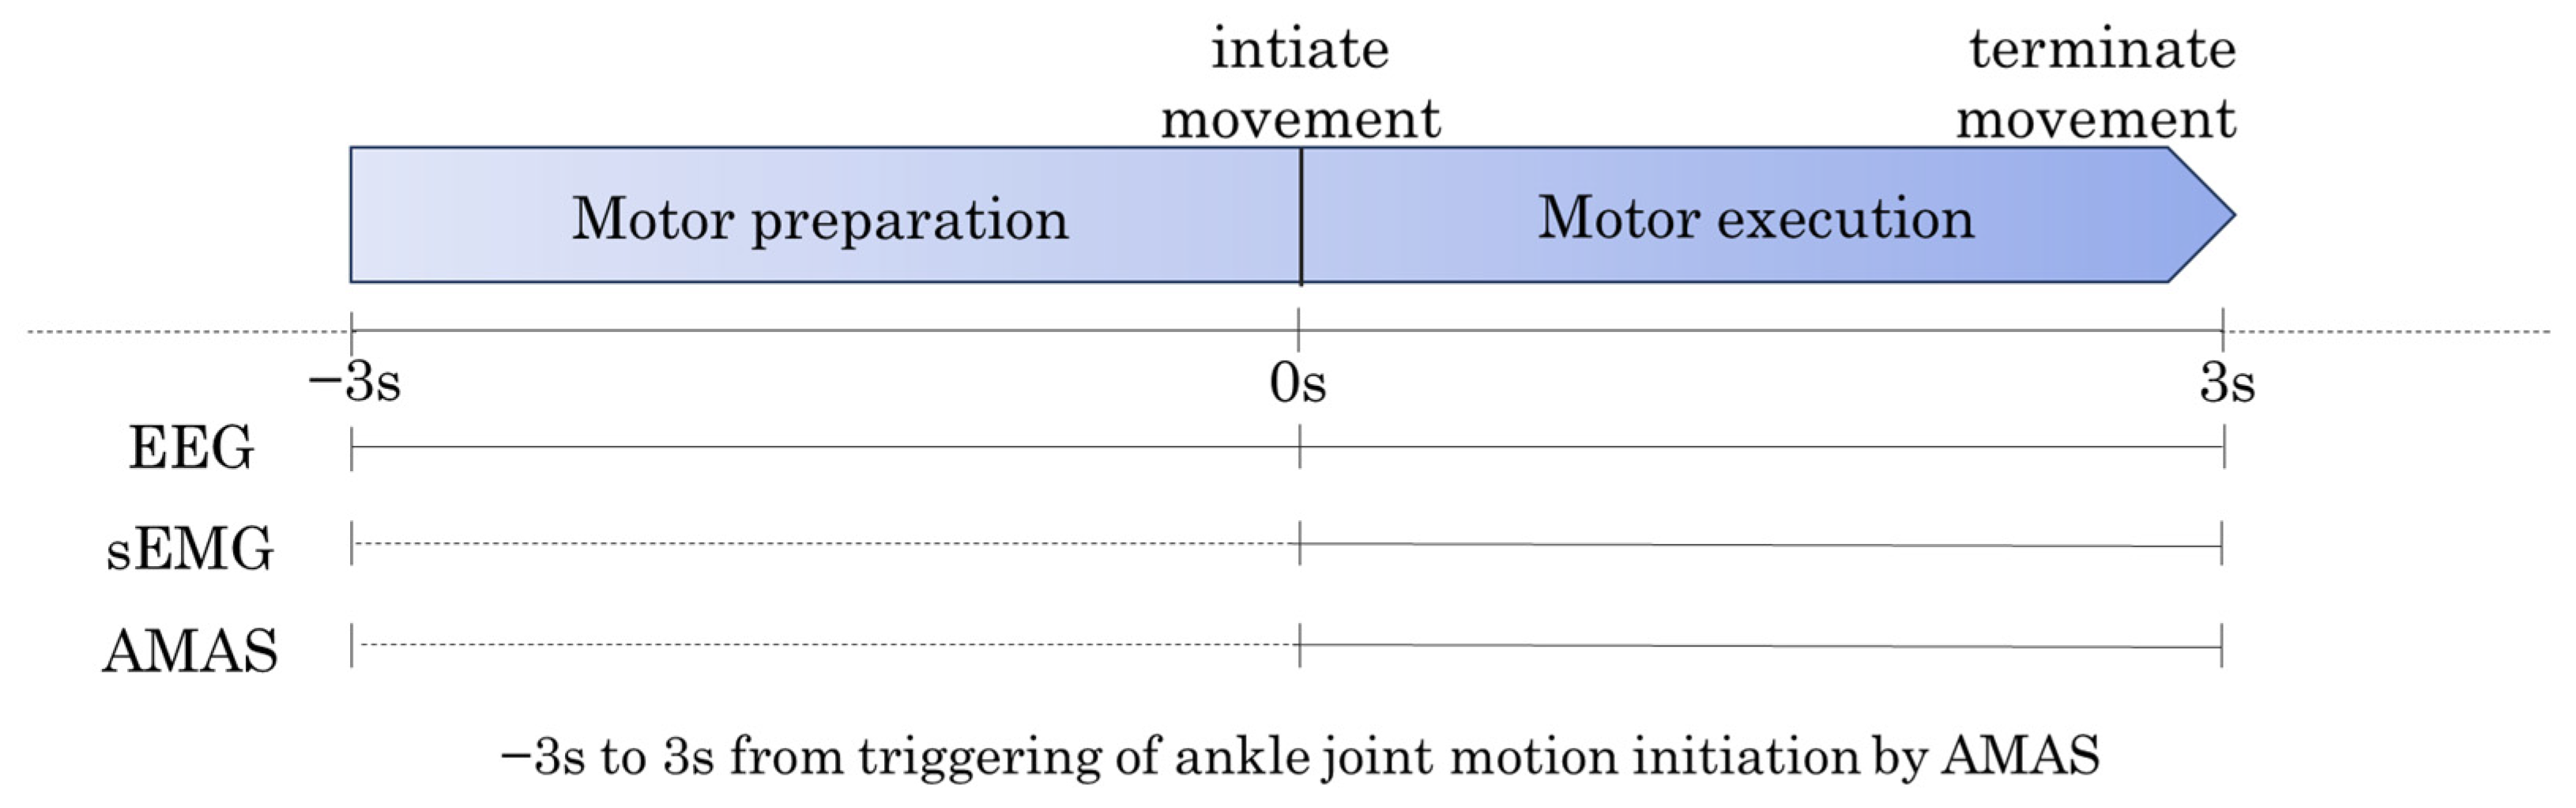
2.2. Protocol
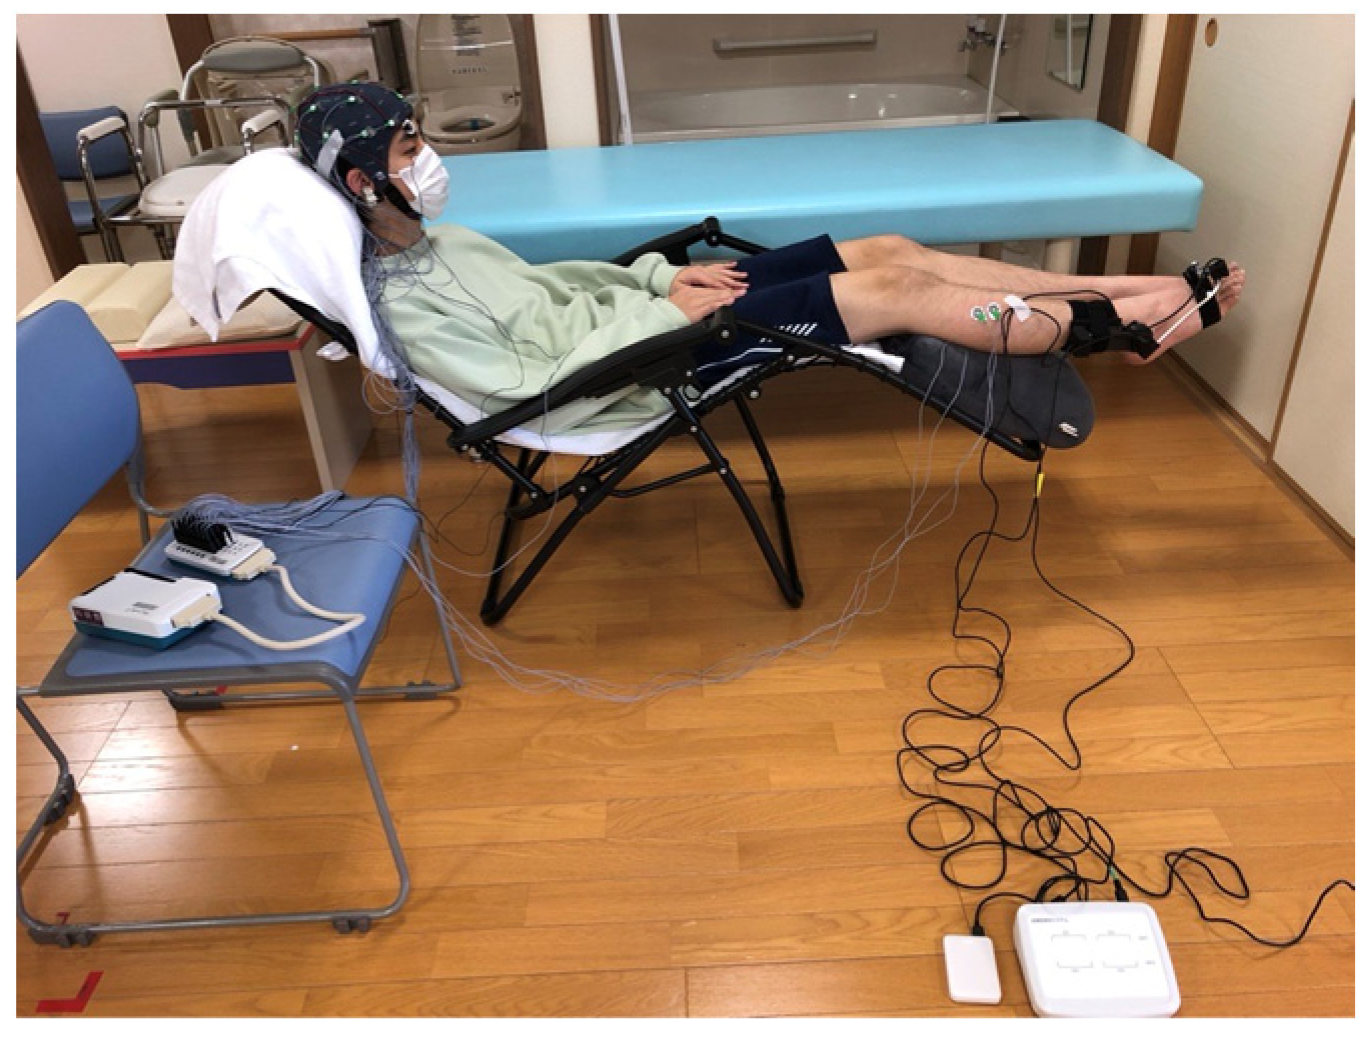
2.3. Instrumentation
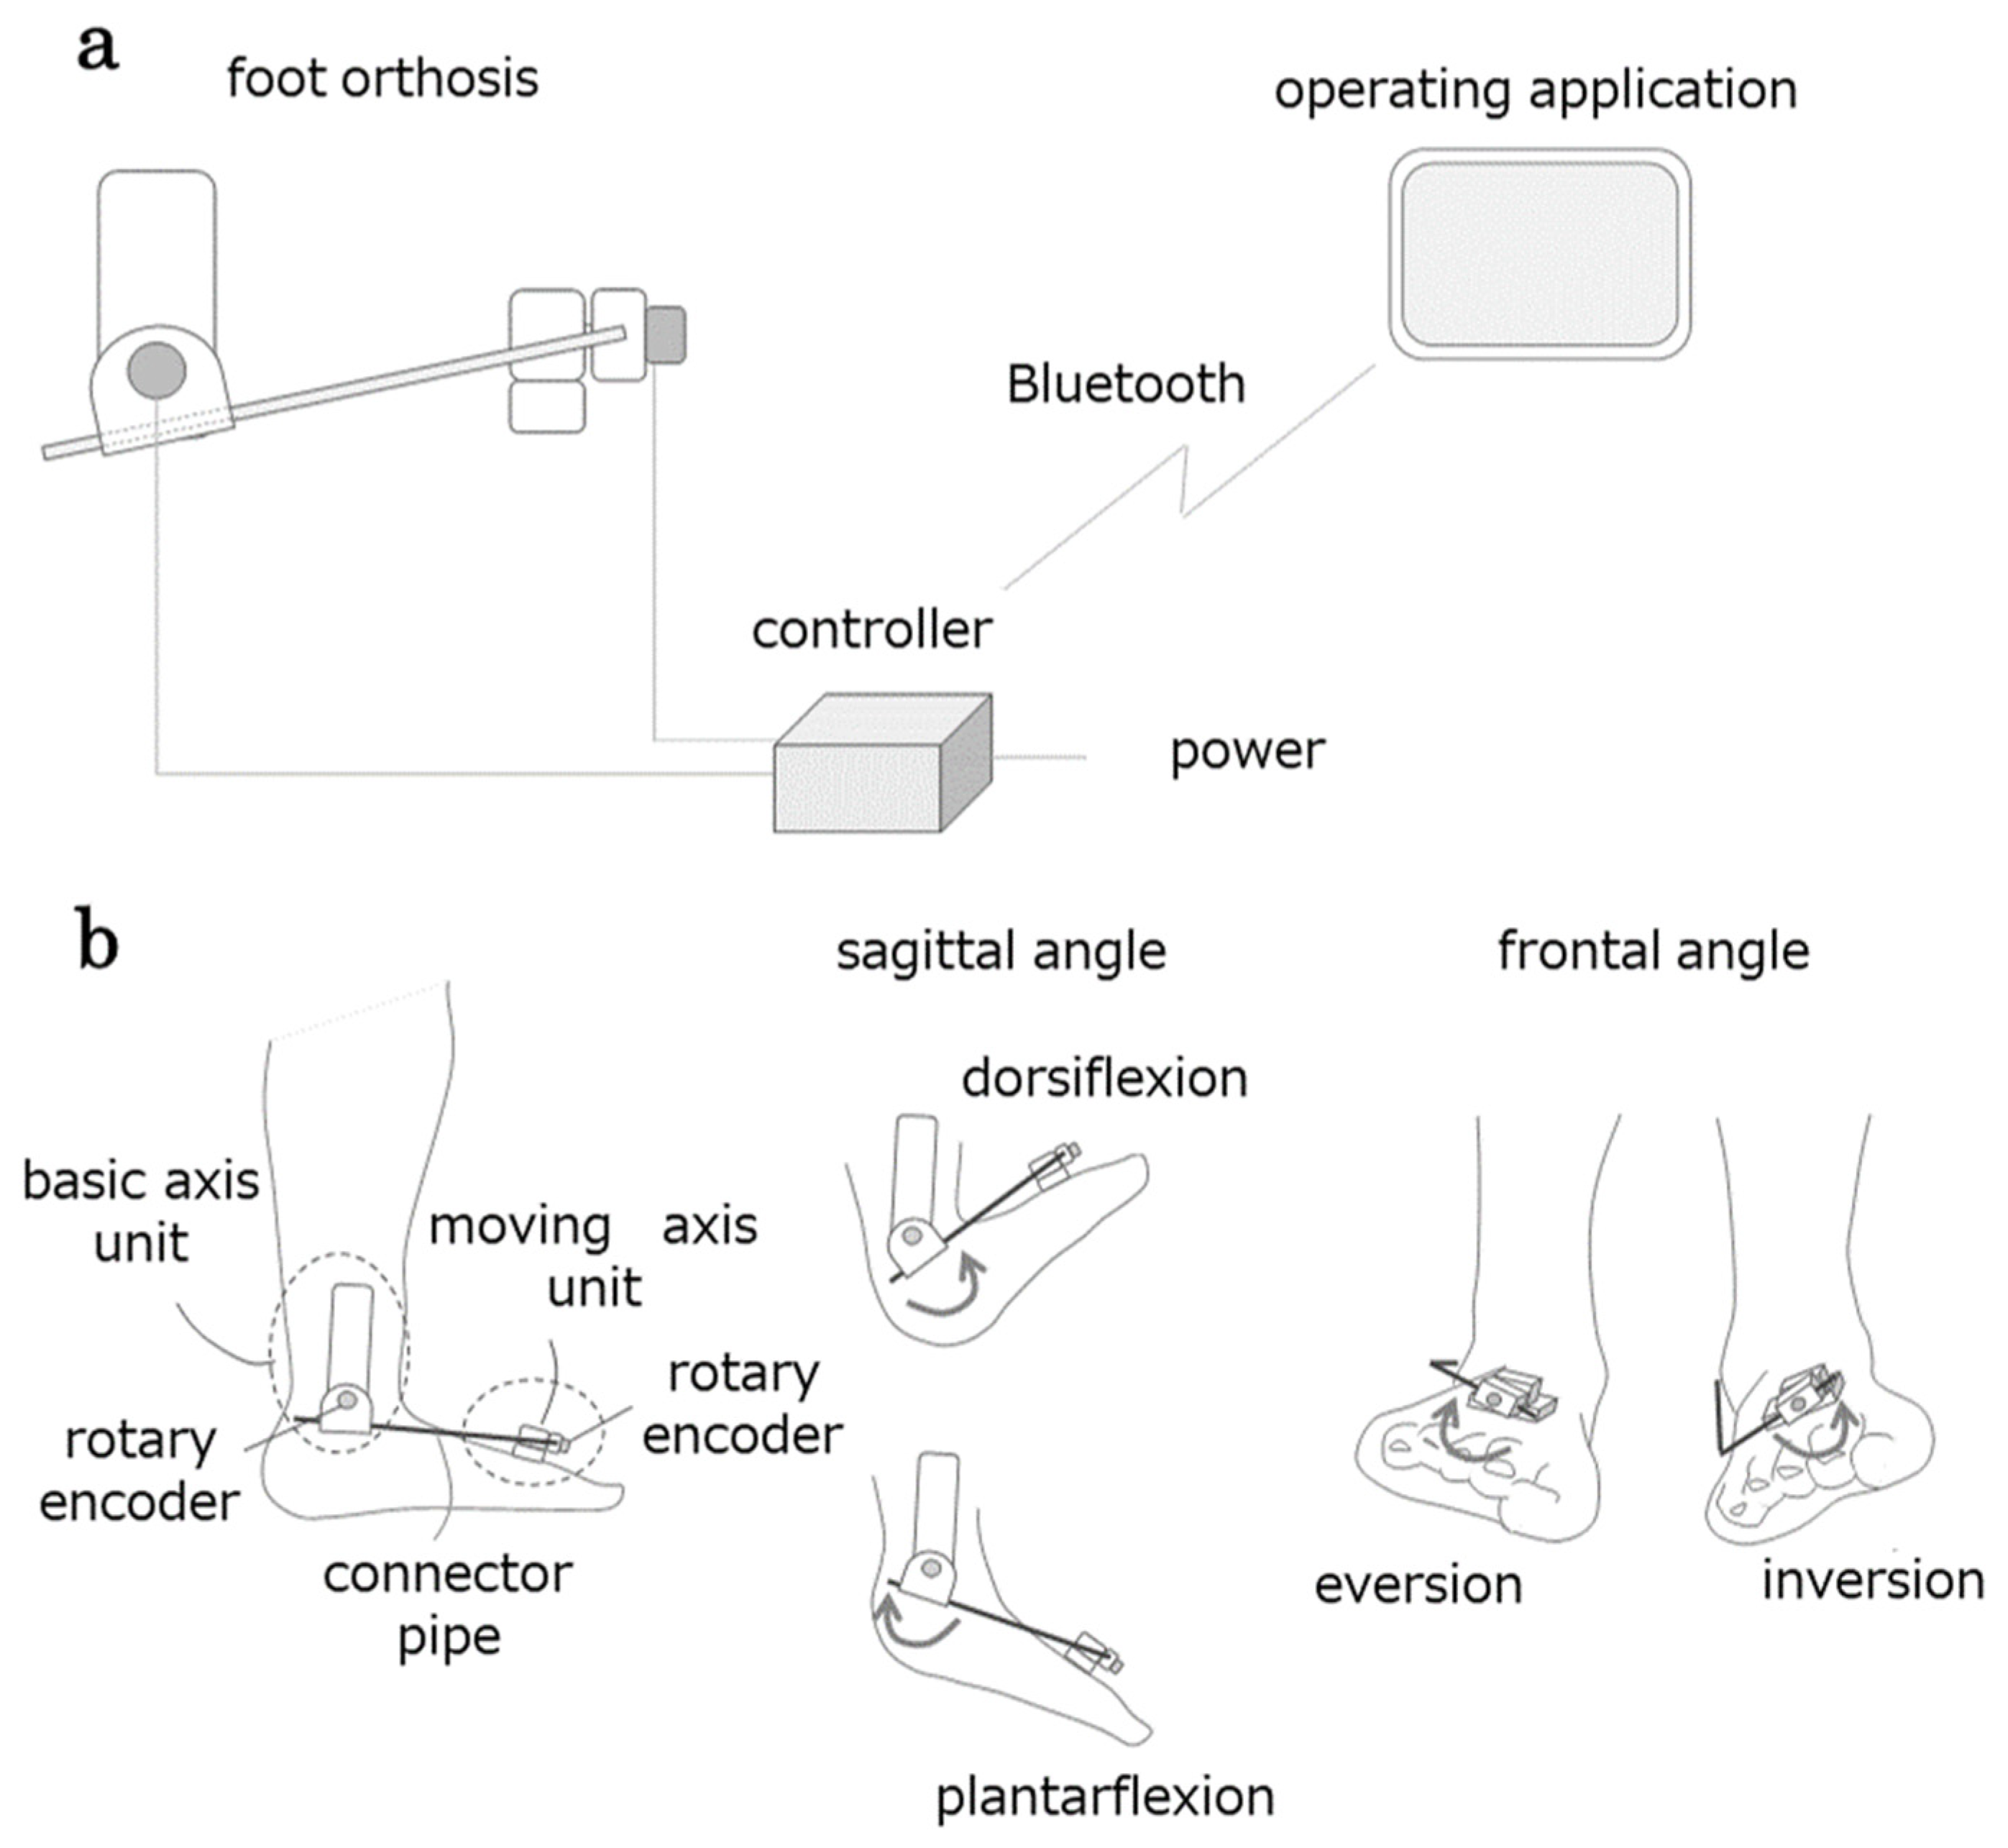
2.3.1. AMAS
2.3.2. Surface Electromyography Measurement
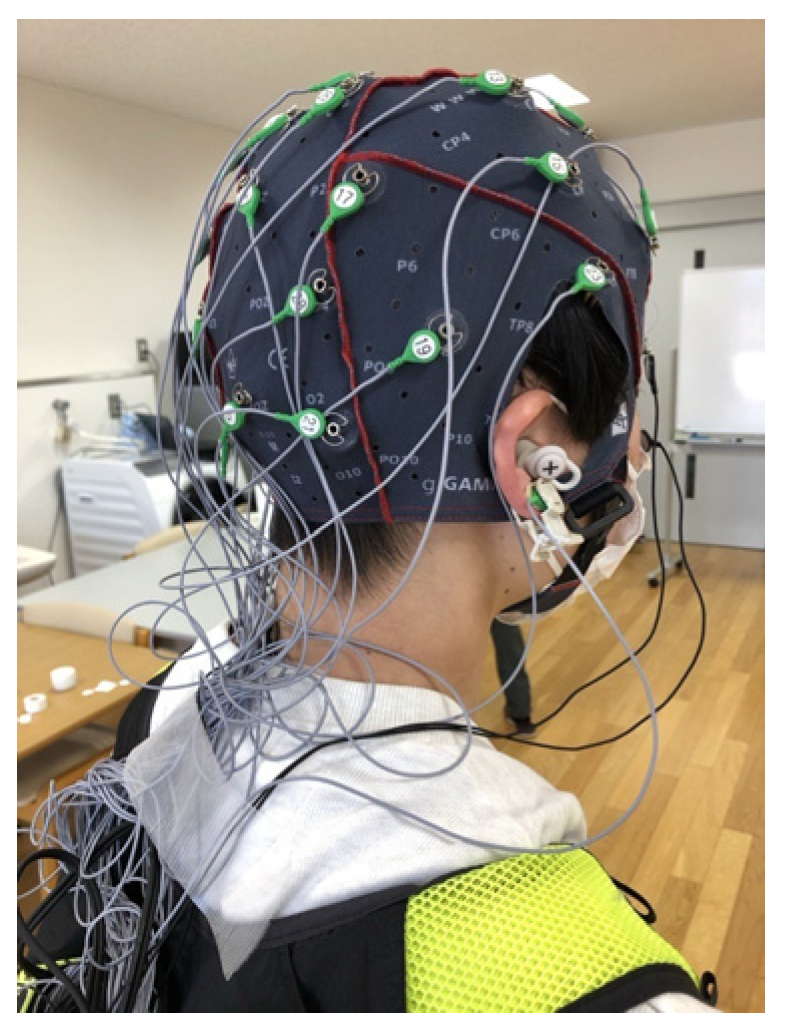
2.3.3. EEG Measurement
2.3.4. Video Recording and Synchronization
2.4. Data Processing
2.4.1. Extraction of Biomechanical Indicators
2.4.2. Preprocessing of sEMG and EEG Data
2.4.3. Calculation of CMC
2.4.4. Calculation of Beta Power Value of EEG by Time-Frequency Analysis
2.5. Statistical Analysis
3. Results
3.1. Comparisons of Each Task Parameter Between CMC Groups
3.1.1. Comparison of Biomechanical Indicators in the Active Ankle Dorsiflexion Movement Task
3.1.2. Comparison of Neurophysiological Indicators in the Active Ankle Dorsiflexion Movement Task
3.1.3. Comparison of Biomechanical Indicators in the Walking Task
3.2. Accuracy Assessment of Machine Learning Models (SVM)
4. Discussion
Limitations
5. Conclusions
Supplementary Materials
Author Contributions
Funding
Institutional Review Board Statement
Informed Consent Statement
Data Availability Statement
Acknowledgments
Conflicts of Interest
Abbreviations
| AMAS | Articulation Motion Assessment System |
| IC | Initial Contact |
| TO | Toe Off |
| sEMG | surface electromyography |
| TA | Tibialis Anterior |
| MG | Gastrocnemius Medialis |
| EEG | Electroencephalography |
| CMC | Corticomuscular Coherence |
| sLORETA | Standardized Low-Resolution Brain Electromagnetic Tomography |
| BA | Brodmann’s area |
| GFP | global field power |
| SVM | Support-Vector Machine |
References
- Schmitt, D. Insights into the evolution of human bipedalism from experimental studies of humans and other primates. J. Exp. Biol. 2003, 206, 1437–1448. [Google Scholar] [CrossRef] [PubMed]
- Mirelman, A.; Shema, S.; Maidan, I.; Hausdorff, J.M. Gait. Handb. Clin. Neurol. 2018, 159, 119–134. [Google Scholar] [CrossRef]
- Baker, J.M. Gait disorders. Am. J. Med. 2018, 131, 602–607. [Google Scholar] [CrossRef]
- Perry, J.; Garrett, M.; Gronley, J.K.; Mulroy, S.J. Classification of walking handicap in the stroke population. Stroke 1995, 26, 982–989. [Google Scholar] [CrossRef]
- Schmid, A.; Duncan, P.W.; Studenski, S.; Lai, S.M.; Richards, L.; Perera, S.; Wu, S.S. Improvements in speed-based gait classifications are meaningful. Stroke 2007, 38, 2096–2100. [Google Scholar] [CrossRef]
- Wade, L.; Birch, J.; Farris, D.J. Walking with increasing acceleration is achieved by tuning ankle torque onset timing and rate of torque development. J. R. Soc. Interface 2022, 19, 20220035. [Google Scholar] [CrossRef] [PubMed]
- van Hoeve, S.; Leenstra, B.; Willems, P.; Poeze, M.; Meijer, K. The effect of age and speed on foot and ankle kinematics assessed using a 4-segment foot model. Medicine 2017, 96, e7907. [Google Scholar] [CrossRef]
- Peiffer, M.; Duquesne, K.; Delanghe, M.; Van, O.A.; De, M.S.; Audenaert, E.; Burssens, A. Quantifying walking speeds in relation to ankle biomechanics on a real-time interactive gait platform: A musculoskeletal modeling approach in healthy adults. Front. Bioeng. Biotechnol. 2024, 12, 1348977. [Google Scholar] [CrossRef] [PubMed]
- Graf, A.; Judge, J.O.; Ounpuu, S.; Thelen, D.G. The effect of walking speed on lower-extremity joint powers among elderly adults who exhibit low physical performance. Arch. Phys. Med. Rehabil. 2005, 86, 2177–2183. [Google Scholar] [CrossRef]
- Lamontagne, A.; Richards, C.L.; Malouin, F. Coactivation during gait as an adaptive behavior after stroke. J. Electromyogr. Kinesiol. 2000, 10, 407–415. [Google Scholar] [CrossRef]
- Allen, J.L.; Kautz, S.A.; Neptune, R.R. The influence of merged muscle excitation modules on post-stroke hemiparetic walking performance. Clin. Biomech. 2013, 28, 697–704. [Google Scholar] [CrossRef] [PubMed]
- Fung, V.S.C. Functional gait disorder. Handb. Clin. Neurol. 2016, 139, 263–270. [Google Scholar] [CrossRef] [PubMed]
- Lim, M.R.; Huang, R.C.; Wu, A.; Girardi, F.P.; Cammisa, F.P., Jr. Evaluation of the elderly patient with an abnormal gait. J. Am. Acad. Orthop. Surg 2007, 15, 107–117. [Google Scholar] [CrossRef] [PubMed]
- Capaday, C.; Lavoie, B.A.; Barbeau, H.; Schneider, C.; Bonnard, M. Studies on the corticospinal control of human walking. I. Responses to focal transcranial magnetic stimulation of the motor cortex. J. Neurophysiol. 1999, 81, 129–139. [Google Scholar] [CrossRef]
- Dobkin, B.H.; Firestine, A.; West, M.; Saremi, K.; Woods, R. Ankle dorsiflexion as an fMRI paradigm to assay motor control for walking during rehabilitation. Neuroimage 2004, 23, 370–381. [Google Scholar] [CrossRef]
- Smania, N.; Gambarin, M.; Paolucci, S.; Girardi, P.; Bortolami, M.; Fiaschi, A.; Santilli, V.; Picelli, A. Active ankle dorsiflexion and the Mingazzini manoeuvre: Two clinical bedside tests related to prognosis of postural transferring, standing and walking ability in patients with stroke. Eur. J. Phys. Rehabil. Med. 2011, 47, 435–440. [Google Scholar] [PubMed]
- Chisholm, A.E.; Perry, S.D.; McIlroy, W.E. Correlations between ankle-foot impairments and dropped foot gait deviations among stroke survivors. Clin. Biomech. 2013, 28, 1049–1054. [Google Scholar] [CrossRef]
- Mizuta, N.; Hasui, N.; Nakatani, T.; Takamura, Y.; Fujii, S.; Tsutsumi, M.; Taguchi, J.; Morioka, S. Walking characteristics including mild motor paralysis and slow walking speed in post-stroke patients. Sci. Rep. 2020, 10, 11819. [Google Scholar] [CrossRef]
- Lodha, N.; Patel, P.; Casamento-Moran, A.; Hays, E.; Poisson, S.N.; Christou, E.A. Strength or motor control: What matters in high-functioning stroke? Front. Neurol. 2018, 9, 1160. [Google Scholar] [CrossRef]
- Fauvet, M.; Gasq, D.; Chalard, A.; Tisseyre, J.; Amarantini, D. Temporal dynamics of corticomuscular coherence reflects alteration of the central mechanisms of neural motor control in post-stroke patients. Front. Hum. Neurosci. 2021, 15, 682080. [Google Scholar] [CrossRef] [PubMed] [PubMed Central]
- Gwin, J.T.; Ferris, D.P. Beta- and gamma-range human lower limb corticomuscular coherence. Front. Hum. Neurosci. 2012, 6, 258. [Google Scholar] [CrossRef] [PubMed] [PubMed Central]
- Petersen, T.H.; Willerslev-Olsen, M.; Conway, B.A.; Nielsen, J.B. The motor cortex drives the muscles during walking in human subjects. J. Physiol. 2012, 590, 2443–2452. [Google Scholar] [CrossRef] [PubMed] [PubMed Central]
- Yoshida, T.; Masani, K.; Zabjek, K.; Chen, R.; Popovic, M.R. Dynamic cortical participation during bilateral, cyclical ankle movements: Effects of aging. Sci. Rep. 2017, 7, 44658. [Google Scholar] [CrossRef] [PubMed] [PubMed Central]
- Bernstein, N.A. The Coordination and Regulation of Movements; Pergamon Press: London, UK, 1967. [Google Scholar]
- Isomura, Y.; Harukuni, R.; Takekawa, T.; Aizawa, H.; Fukai, T. Microcircuitry coordination of cortical motor information in self-initiation of voluntary movements. Nat. Neurosci. 2009, 12, 1586–1593. [Google Scholar] [CrossRef] [PubMed]
- Churchland, M.M.; Yu, B.M.; Ryu, S.I.; Santhanam, G.; Shenoy, K.V. Neural variability in premotor cortex provides a signature of motor preparation. J. Neurosci. 2006, 26, 3697–3712. [Google Scholar] [CrossRef] [PubMed] [PubMed Central]
- Giordano, N.; Alia, C.; Fruzzetti, L.; Pasquini, M.; Palla, G.; Mazzoni, A.; Micera, S.; Fogassi, L.; Bonini, L.; Caleo, M. Fast-spiking interneurons of the premotor cortex contribute to initiation and execution of spontaneous actions. J. Neurosci. 2023, 43, 4234–4250. [Google Scholar] [CrossRef] [PubMed] [PubMed Central]
- Ito, H.; Yamaguchi, H.; Inoue, M.; Nagano, H.; Kitai, K.; Morita, K.; Kodama, T. Reliability and validity of the articulation motion assessment system using a rotary encoder. Biomechanics 2025, 5, 2. [Google Scholar] [CrossRef]
- McCurdy, K.; Langford, G. Comparison of unilateral squat strength between the dominant and non-dominant leg in men and women. J. Sports Sci. Med. 2005, 4, 153–159. [Google Scholar]
- Kapreli, E.; Athanasopoulos, S.; Papathanasiou, M.; Van Hecke, P.; Strimpakos, N.; Gouliamos, A.; Peeters, R.; Sunaert, S. Lateralization of brain activity during lower limb joints movement. An fMRI study. Neuroimage 2006, 32, 1709–1721. [Google Scholar] [CrossRef]
- Glazebrook, C.M.; Welsh, T.N.; Tremblay, L. The processing of visual and auditory information for reaching movements. Psychol. Res. 2016, 80, 757–773. [Google Scholar] [CrossRef]
- Hermens, H.J.; Freriks, B.; Disselhorst-Klug, C.; Rau, G. Development of recommendations for SEMG sensors and sensor placement procedures. J. Electromyogr. Kinesiol. 2000, 10, 361–374. [Google Scholar] [CrossRef]
- Chatrian, G.E.; Lettich, E.; Nelson, P.L. Ten percent electrode system for topographic studies of spontaneous and evoked EEG activities. Am. J. EEG Technol. 1985, 25, 83–92. [Google Scholar] [CrossRef]
- Su, C.; Chen, S.; Jiang, H.; Chen, Y. Ankle joint torque prediction based on surface electromyographic and angular velocity signals. IEEE Access 2020, 8, 217681–217687. [Google Scholar] [CrossRef]
- Little, V.L.; McGuirk, T.E.; Patten, C. Slower than normal walking speeds involve a pattern shift in joint and temporal coordination contributions. Exp. Brain Res. 2019, 237, 2973–2982. [Google Scholar] [CrossRef]
- Brockett, C.L.; Chapman, G.J. Biomechanics of the ankle. Orthop. Trauma 2016, 30, 232–238. [Google Scholar] [CrossRef] [PubMed]
- Kim, H.; Cho, J.E.; Seo, K.J.; Lee, J. Bilateral ankle deformities affects gait kinematics in chronic stroke patients. Front. Neurol. 2023, 14, 1078064. [Google Scholar] [CrossRef] [PubMed]
- Chen, C.C.; Hong, W.H.; Wang, C.M.; Chen, C.K.; Wu, K.P.H.; Kang, C.F.; Tang, S.F. Kinematic features of rear-foot motion using anterior and posterior ankle-foot orthoses in stroke patients with hemiplegic gait. Arch. Phys. Med. Rehabil. 2010, 91, 1862–1868. [Google Scholar] [CrossRef]
- Mentiplay, B.F.; Banky, M.; Clark, R.A.; Kahn, M.B.; Williams, G. Lower limb angular velocity during walking at various speeds. Gait Posture 2018, 65, 190–196. [Google Scholar] [CrossRef]
- Srivastava, S.; Kindred, J.H.; Seamon, B.A.; Charalambous, C.C.; Boan, A.D.; Kautz, S.A.; Bowden, M.G. A novel biomechanical indicator for impaired ankle dorsiflexion function during walking in individuals with chronic stroke. Gait Posture 2024, 107, 246–252. [Google Scholar] [CrossRef]
- Hamacher, D.; Hollander, K.; Zech, A. Effects of ankle instability on running gait ankle angles and its variability in young adults. Clin. Biomech. 2016, 33, 73–78. [Google Scholar] [CrossRef]
- Hwang, Y.I.; Park, D.J. Effects of elastic neutral ankle-foot orthoses on 3 dimensional parameters during gait training in patients with stroke: A pilot study. J. Bodyw. Mov. Ther. 2021, 27, 300–306. [Google Scholar] [CrossRef] [PubMed]
- Thomson, D.J. Spectrum estimation and harmonic analysis. Proc. IEEE 1982, 70, 1055–1096. [Google Scholar] [CrossRef]
- Roeder, L.; Boonstra, T.W.; Smith, S.S.; Kerr, G.K. Dynamics of corticospinal motor control during overground and treadmill walking in humans. J. Neurophysiol. 2018, 120, 1017–1031. [Google Scholar] [CrossRef]
- Yokoyama, H.; Yoshida, T.; Zabjek, K.; Chen, R.; Masani, K. Defective corticomuscular connectivity during walking in patients with Parkinson’s disease. J. Neurophysiol. 2020, 124, 1399–1414. [Google Scholar] [CrossRef]
- Stergiou, N.; Harbourne, R.; Cavanaugh, J. Optimal movement variability: A new theoretical perspective for neurologic physical therapy. J. Neurol. Phys. Ther. 2006, 30, 120–129. [Google Scholar] [CrossRef] [PubMed]
- Ivanenko, Y.P.; Poppele, R.E.; Lacquaniti, F. Motor control programs and walking. Neuroscientist 2006, 12, 339–348. [Google Scholar] [CrossRef]
- Moisan, G.; Mainville, C.; Descarreaux, M.; Cantin, V. Lower limb biomechanics in individuals with chronic ankle instability during gait: A case-control study. J. Foot Ankle Res. 2021, 14, 36. [Google Scholar] [CrossRef]
- Piming, G.; Yaming, Y.; Hai, S.; Xia, L.; Xiaobing, L. Three-dimensional ankle kinematics of the full gait cycle in patients with chronic ankle instability: A case-control study. Heliyon 2023, 9, e22265. [Google Scholar] [CrossRef]
- Granata, K.P.; Abel, M.F.; Damiano, D.L. Joint angular velocity in spastic gait and the influence of muscle-tendon lengthening. J. Bone Joint Surg. Am. 2000, 82, 174–186. [Google Scholar] [CrossRef]
- Fukuchi, C.A.; Fukuchi, R.K.; Duarte, M. Effects of walking speed on gait biomechanics in healthy participants: A systematic review and meta-analysis. Syst. Rev. 2019, 8, 153. [Google Scholar] [CrossRef]
- Liang, T.; Zhang, Q.; Liu, X.; Dong, B.; Liu, X.; Wang, H. Identifying bidirectional total and non-linear information flow in functional corticomuscular coupling during a dorsiflexion task: A pilot study. J. Neuroeng. Rehabil. 2021, 18, 74. [Google Scholar] [CrossRef] [PubMed] [PubMed Central]
- Peng, J.; Zikereya, T.; Shao, Z.; Shi, K. The neuromechanical of Beta-band corticomuscular coupling within the human motor system. Front. Neurosci. 2024, 18, 1441002. [Google Scholar] [CrossRef] [PubMed] [PubMed Central]
- Rosenberg, J.R.; Amjad, A.M.; Breeze, P.; Brillinger, D.R.; Halliday, D.M. The Fourier approach to the identification of functional coupling between neuronal spike trains. Prog. Biophys. Mol. Biol. 1989, 53, 1–31. [Google Scholar] [CrossRef] [PubMed]
- Pfurtscheller, G.; Lopes da Silva, F.H. Event-related EEG/MEG synchronization and desynchronization: Basic principles. Clin. Neurophysiol. 1999, 110, 1842–1857. [Google Scholar] [CrossRef]
- Stolk, A.; Brinkman, L.; Vansteensel, M.J.; Aarnoutse, E.; Leijten, F.S.; Dijkerman, C.H.; Knight, R.T.; de Lange, F.P.; Toni, I. Electrocorticographic dissociation of alpha and beta rhythmic activity in the human sensorimotor system. eLife 2019, 8, e48065. [Google Scholar] [CrossRef]
- Shiner, C.T.; Tang, H.; Johnson, B.W.; McNulty, P.A. Cortical beta oscillations and motor thresholds differ across the spectrum of post-stroke motor impairment, a preliminary MEG and TMS study. Brain Res. 2015, 1629, 26–37. [Google Scholar] [CrossRef]
- Koelewijn, T.; Van Schie, H.T.; Bekkering, H.; Oostenveld, R.; Jensen, O. Motor-cortical beta oscillations are modulated by correctness of observed action. Neuroimage 2008, 40, 767–775. [Google Scholar] [CrossRef] [PubMed]
- Cardellicchio, P.; Hilt, P.M.; Dolfini, E.; Fadiga, L.; D’Ausilio, A. Beta rebound as an index of temporal integration of somatosensory and motor signals. Front. Syst. Neurosci. 2020, 14, 63. [Google Scholar] [CrossRef]
- Pascual-Marqui, R.D. Standardized low-resolution brain electromagnetic tomography (sLORETA): Technical details. Methods Find. Exp. Clin. Pharmacol. 2002, 24 (Suppl. D), 5–12. [Google Scholar] [PubMed]
- Collins, D.L.; Holmes, C.J.; Peters, T.M.; Evans, A.C. Automatic 3-D model-based neuroanatomical segmentation. Hum. Brain Mapp. 1995, 3, 190–208. [Google Scholar] [CrossRef]
- Pascual-Marqui, R.D. Instantaneous and Lagged Measurements of Linear and Nonlinear Dependence Between Groups of Multivariate Time Series: Frequency Decomposition. arXiv 2007, arXiv:0711.1455. [Google Scholar]
- Cortes, C.; Vapnik, V. Support-vector networks. Mach. Learn. 1995, 20, 273–297. [Google Scholar] [CrossRef]
- Jacobs, J.V.; Wu, G.; Kelly, K.M. Evidence for beta corticomuscular coherence during human standing balance: Effects of stance width, vision, and support surface. Neuroscience 2015, 298, 1–11. [Google Scholar] [CrossRef] [PubMed]
- Xu, R.; Zhang, H.; Shi, X.; Liang, J.; Wan, C.; Ming, D. Lower-limb motor assessment with corticomuscular coherence of multiple muscles during ankle dorsiflexion after stroke. IEEE Trans. Neural Syst. Rehabil. Eng. 2023, 31, 160–168. [Google Scholar] [CrossRef] [PubMed]
- Menz, H.B.; Morris, M.E.; Lord, S. Foot and ankle risk factors for falls in older people: A prospective study. J. Gerontol. A Biol. Sci. Med. Sci. 2006, 61, 866–870. [Google Scholar] [CrossRef]
- Tabrizi, P.; McIntyre, W.M.; Quesnel, M.B.; Howard, A.W. Limited dorsiflexion predisposes to injuries of the ankle in children. J. Bone Joint Surg. Br. 2000, 82, 1103–1106. [Google Scholar] [CrossRef] [PubMed]
- Choi, M.; Kim, H.C.; Youn, I.; Lee, S.J.; Lee, J.H. Use of functional magnetic resonance imaging to identify cortical loci for lower limb movements and their efficacy for individuals after stroke. J. Neuroeng. Rehabil. 2024, 21, 58. [Google Scholar] [CrossRef]
- Simonsen, E.B. Contributions to the understanding of gait control. Dan. Med. J. 2014, 61, B4823. [Google Scholar] [PubMed]
- Wanner, P.; Schmautz, T.; Kluge, F.; Eskofier, B.; Pfeifer, K.; Steib, S. Ankle angle variability during running in athletes with chronic ankle instability and copers. Gait Posture 2019, 68, 329–334. [Google Scholar] [CrossRef] [PubMed]
- de Ruvo, R.; Russo, G.; Lena, F.; Giovannico, G.; Neville, C.; Turolla, A.; Torre, M.; Pellicciari, L. The Effect of Manual Therapy Plus Exercise in Patients with Lateral Ankle Sprains: A Critically Appraised Topic with a Meta-Analysis. J. Clin. Med. 2022, 11, 4925. [Google Scholar] [CrossRef] [PubMed] [PubMed Central]
- Wu, Z.; Jiang, X.; Zhong, M.; Shen, B.; Zhu, J.; Pan, Y.; Dong, J.; Xu, P.; Zhang, W.; Zhang, L. Wearable sensors measure ankle joint changes of patients with Parkinson’s disease before and after acute levodopa challenge. Parkinsons Dis. 2020, 2020, 2976535. [Google Scholar] [CrossRef] [PubMed] [PubMed Central]
- Jaqueline da Cunha, M.; Rech, K.D.; Salazar, A.P.; Pagnussat, A.S. Functional electrical stimulation of the peroneal nerve improves post-stroke gait speed when combined with physiotherapy. A systematic review and meta-analysis. Ann. Phys. Rehabil. Med. 2021, 64, 101388. [Google Scholar] [CrossRef] [PubMed]
- Delahunt, E.; Monaghan, K.; Caulfield, B. Altered neuromuscular control and ankle joint kinematics during walking in subjects with functional instability of the ankle joint. Am. J. Sports Med. 2006, 34, 1970–1976. [Google Scholar] [CrossRef] [PubMed]
- Heuer, H.; Sülzenbrück, S. Mind and movement. Psychol. Res. 2012, 76, 159–170. [Google Scholar] [CrossRef] [PubMed]
- Scott, S.H. The computational and neural basis of voluntary motor control and planning. Trends Cogn. Sci. 2012, 16, 541–549. [Google Scholar] [CrossRef] [PubMed]
- Ames, K.C.; Ryu, S.I.; Shenoy, K.V. Neural dynamics of reaching following incorrect or absent motor preparation. Neuron 2014, 81, 438–451. [Google Scholar] [CrossRef]
- Churchland, M.M.; Shenoy, K.V. Preparatory activity and the expansive null-space. Nat. Rev. Neurosci. 2024, 25, 213–236. [Google Scholar] [CrossRef] [PubMed]
- Zimnik, A.J.; Churchland, M.M. Independent generation of sequence elements by motor cortex. Nat. Neurosci. 2021, 24, 412–424, Erratum in: Nat. Neurosci. 2022, 25, 530. https://doi.org/10.1038/s41593-022-01048-y. [Google Scholar] [CrossRef] [PubMed] [PubMed Central]
- Ames, K.C.; Ryu, S.I.; Shenoy, K.V. Simultaneous motor preparation and execution in a last-moment reach correction task. Nat. Commun. 2019, 10, 2718. [Google Scholar] [CrossRef] [PubMed] [PubMed Central]
- Haggard, P. Conscious intention and motor cognition. Trends Cogn. Sci. 2005, 9, 290–295. [Google Scholar] [CrossRef]
- Rektor, I. Parallel information processing in motor systems: Intracerebral recordings of readiness potential and CNV in human subjects. Neural Plast. 2000, 7, 65–72. [Google Scholar] [CrossRef] [PubMed]
- Dirnberger, G.; Duregger, C.; Lindinger, G.; Lang, W. On the regularity of preparatory activity preceding movements with the dominant and non-dominant hand: A readiness potential study. Int. J. Psychophysiol. 2011, 81, 127–131. [Google Scholar] [CrossRef]
- Baker, K.S.; Piriyapunyaporn, T.; Cunnington, R. Neural activity in readiness for incidental and explicitly timed actions. Neuropsychologia 2012, 50, 715–722. [Google Scholar] [CrossRef]
- Takashima, S.; Ogawa, C.Y.; Najman, F.A.; Ramos, R.T. The volition, the mode of movement selection and the readiness potential. Exp. Brain Res. 2020, 238, 2113–2123. [Google Scholar] [CrossRef]
- Joordens, S.; van Duijn, M.; Spalek, T.M. When timing the mind one should also mind the timing: Biases in the measurement of voluntary actions. Conscious. Cogn. 2002, 11, 231–240. [Google Scholar] [CrossRef]
- Praamstra, P.; Stegeman, D.F.; Horstink, M.W.; Brunia, C.H.; Cools, A.R. Movement-related potentials preceding voluntary movement are modulated by the mode of movement selection. Exp. Brain Res. 1995, 103, 429–439. [Google Scholar] [CrossRef]
- Schurger, A.; Hu, P.B.; Pak, J.; Roskies, A.L. What Is the Readiness Potential? Trends Cogn. Sci. 2021, 25, 558–570. [Google Scholar] [CrossRef] [PubMed]
- Witham, C.L.; Riddle, C.N.; Baker, M.R.; Baker, S.N. Contributions of descending and ascending pathways to corticomuscular co-herence in humans. J. Physiol. 2011, 589, 3789–3800. [Google Scholar] [CrossRef] [PubMed]
- Kodama, T.; Katayama, O.; Nakano, H.; Ueda, T.; Murata, S. Treatment of Medial Medullary Infarction Using a Novel iNems Training: A Case Report and Literature Review. Clin. EEG Neurosci. 2019, 50, 429–435. [Google Scholar] [CrossRef]
- Mahalungkar, S.P.; Shrivastava, R.; Angadi, S. A brief survey on human activity recognition using motor imagery of EEG signals. Electromagn. Biol. Med. 2024, 43, 312–327. [Google Scholar] [CrossRef] [PubMed]
- Mebarkia, K.; Reffad, A. Multi optimized SVM classifiers for motor imagery left and right hand movement identification. Australas. Phys. Eng. Sci. Med. 2019, 42, 949–958. [Google Scholar] [CrossRef] [PubMed]
- Bhattacharyya, S.; Konar, A.; Tibarewala, D.N. Motor imagery, P300 and error-related EEG-based robot arm movement control for rehabilitation purpose. Med. Biol. Eng. Comput. 2014, 52, 1007–1017. [Google Scholar] [CrossRef] [PubMed]
- Jamil, N.; Belkacem, A.N.; Ouhbi, S.; Lakas, A. Noninvasive electroencephalography equipment for assistive, adaptive, and rehabilitative brain-computer interfaces: A systematic literature review. Sensors 2021, 21, 4754. [Google Scholar] [CrossRef] [PubMed] [PubMed Central]
- Saibene, A.; Caglioni, M.; Corchs, S.; Gasparini, F. EEG-based BCIs on motor imagery paradigm using wearable technologies: A systematic review. Sensors 2023, 23, 2798. [Google Scholar] [CrossRef] [PubMed] [PubMed Central]


| Accuracy | Precision | Recall | F1 Score | ||||
|---|---|---|---|---|---|---|---|
| High | Low | High | Low | High | Low | ||
| −2500~−2000 ms | 0.83 | 0.89 | 0.79 | 0.73 | 0.92 | 0.80 | 0.85 |
| −2000~−1500 ms | 0.77 | 0.87 | 0.72 | 0.63 | 0.91 | 0.73 | 0.81 |
| −1500~−1000 ms | 0.74 | 1.00 | 0.67 | 0.45 | 1.00 | 0.62 | 0.80 |
| −1000~−500 ms | 0.70 | 1.00 | 0.66 | 0.25 | 1.00 | 0.40 | 0.80 |
| −500~0 ms | 0.96 | 1.00 | 0.92 | 0.91 | 1.00 | 0.95 | 0.96 |
Disclaimer/Publisher’s Note: The statements, opinions and data contained in all publications are solely those of the individual author(s) and contributor(s) and not of MDPI and/or the editor(s). MDPI and/or the editor(s) disclaim responsibility for any injury to people or property resulting from any ideas, methods, instructions or products referred to in the content. |
© 2025 by the authors. Licensee MDPI, Basel, Switzerland. This article is an open access article distributed under the terms and conditions of the Creative Commons Attribution (CC BY) license (https://creativecommons.org/licenses/by/4.0/).
Share and Cite
Ito, H.; Yamaguchi, H.; Yamauchi, R.; Kitai, K.; Nishimoto, K.; Kodama, T. Effects of Motor Preparation on Walking Ability in Active Ankle Dorsiflexion. Neurol. Int. 2025, 17, 93. https://doi.org/10.3390/neurolint17060093
Ito H, Yamaguchi H, Yamauchi R, Kitai K, Nishimoto K, Kodama T. Effects of Motor Preparation on Walking Ability in Active Ankle Dorsiflexion. Neurology International. 2025; 17(6):93. https://doi.org/10.3390/neurolint17060093
Chicago/Turabian StyleIto, Hiroki, Hideaki Yamaguchi, Ryosuke Yamauchi, Ken Kitai, Kazuhei Nishimoto, and Takayuki Kodama. 2025. "Effects of Motor Preparation on Walking Ability in Active Ankle Dorsiflexion" Neurology International 17, no. 6: 93. https://doi.org/10.3390/neurolint17060093
APA StyleIto, H., Yamaguchi, H., Yamauchi, R., Kitai, K., Nishimoto, K., & Kodama, T. (2025). Effects of Motor Preparation on Walking Ability in Active Ankle Dorsiflexion. Neurology International, 17(6), 93. https://doi.org/10.3390/neurolint17060093