4.1. Constant Current Condition
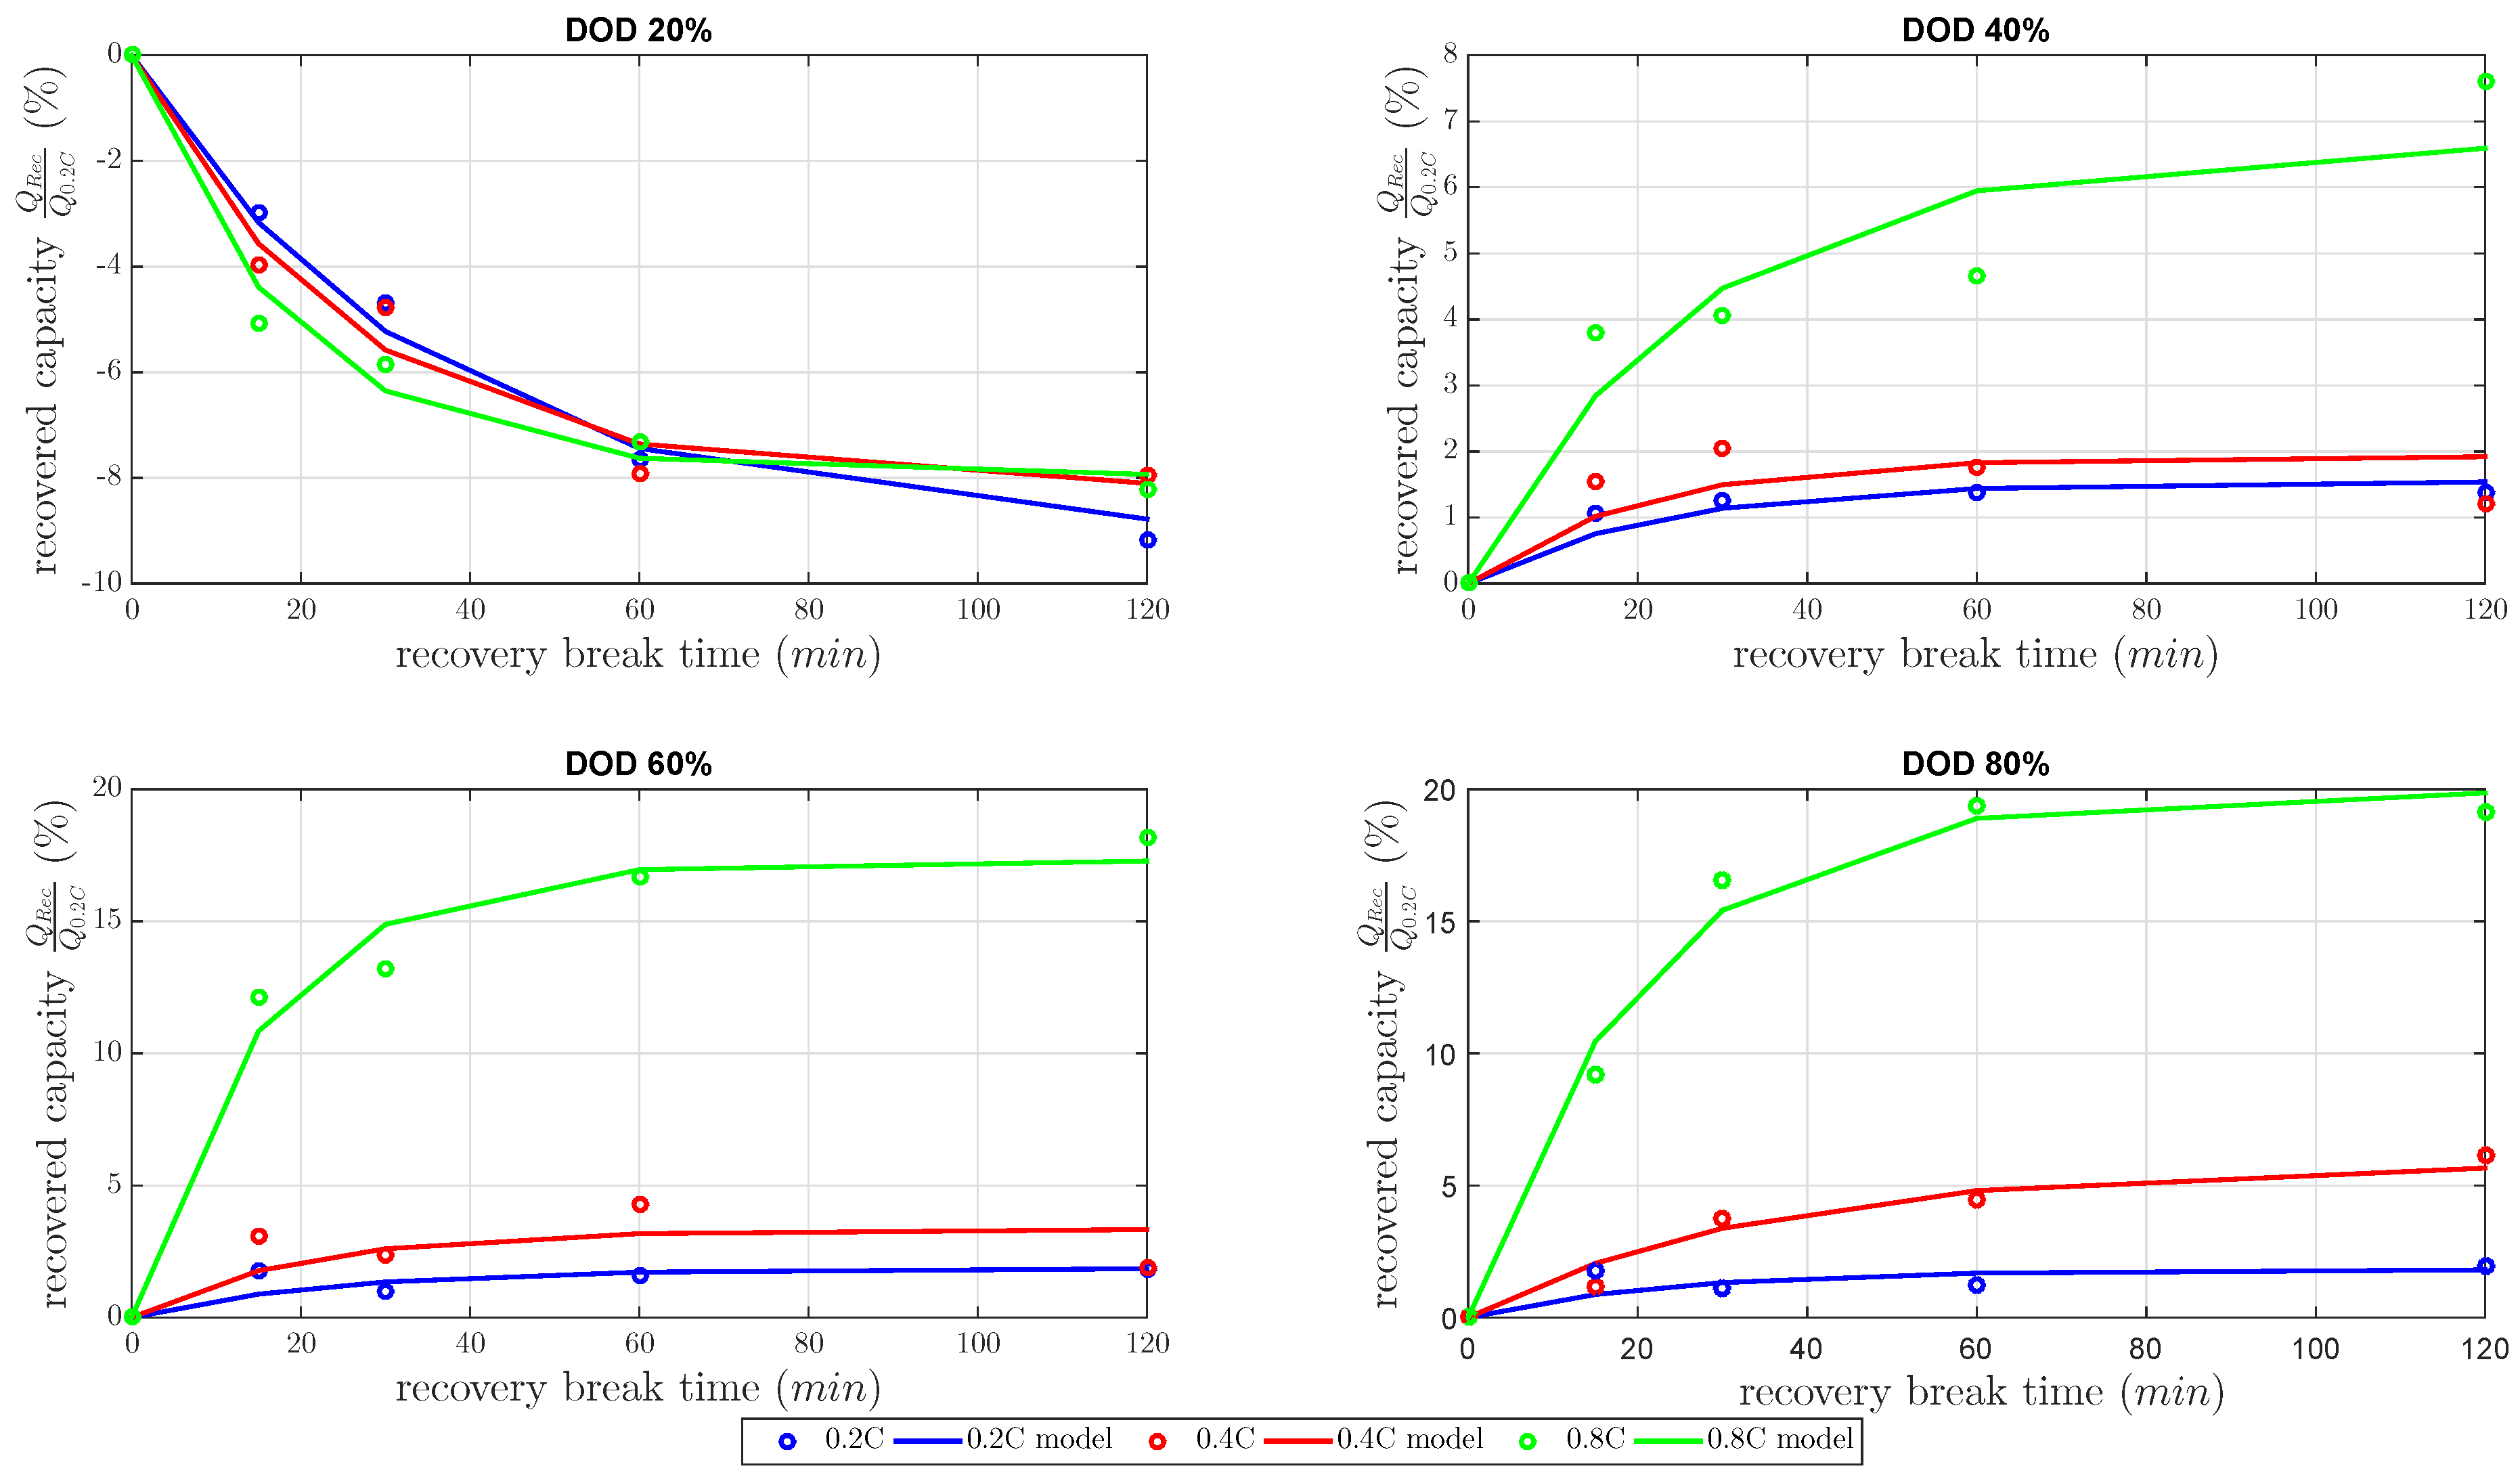
This section focuses on the model and the results of the recovery capacity investigation. The gain factor
k and the time constant
as defined in Equation (
5) were estimated by the least-squares method to build the model in the best possible quality. The estimated models are shown in
Figure 5 dependent on the gain factor and time constant. All recovered capacities in
Figure 5 were normalized capacities by the nominal capacity at 0.2 C constant discharge current.
At DOD 20%, the measurements showed a negative recovered capacity for every discharge current. At that DOD, the cell capacity showed a high decrease of about 8%–9% at 120 min
. Therefore, the inclusion of
at a low DOD level decreased the discharged capacity compared to the same varied constant current discharge without
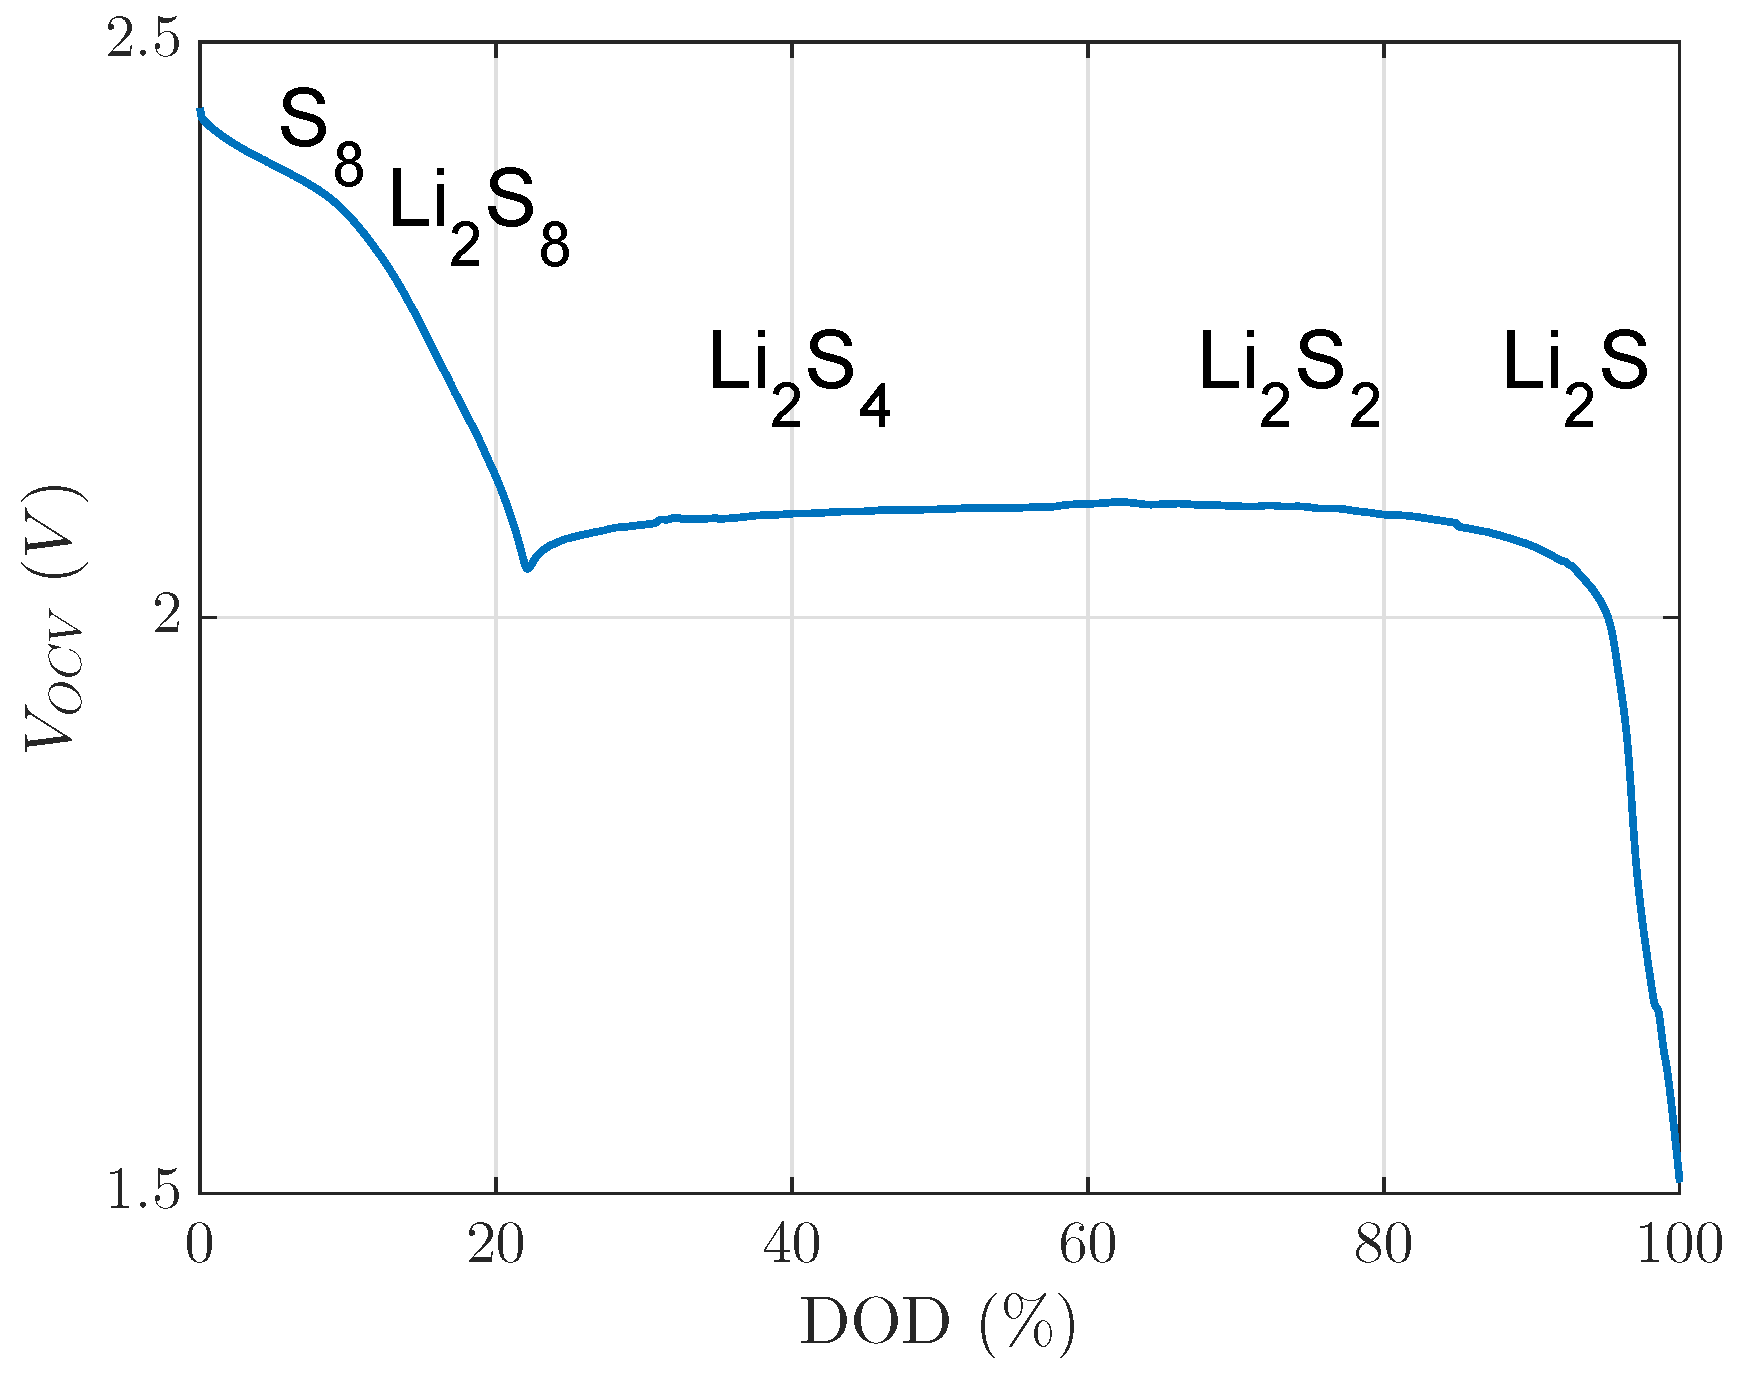
. The investigated 20% DOD level was already in the second plateau, with respect to voltage limits of this investigation, as
Figure 1 shows. In the second plateau at a 20% DOD level, precipitated
existed at a low concentration [
5]. Nevertheless, this small concentration of
did not block much active material, which could be unblocked by the recovery effect during
. In other words, the recovery effect did not explain the decreased discharged capacity. The cell temperature was considered next. It is well known that the cell temperature has a high influence on the discharge capacity in LiS cells. One reason for this influence is the high amount of electrolyte in LiS cells.
forced the inner cell temperature to return to temperature equilibrium conditions and reduced cell kinetics based on the Arrhenius law. Consequently, these findings showed contrary mechanisms between the recovered capacity during the
and the decreasing inner cell temperature during the
. Therefore, the lower inner cell temperature reduced the discharged capacity more than the capacity recovered due to unblocked active materials. In other words, the concentration of precipitated
was too small.
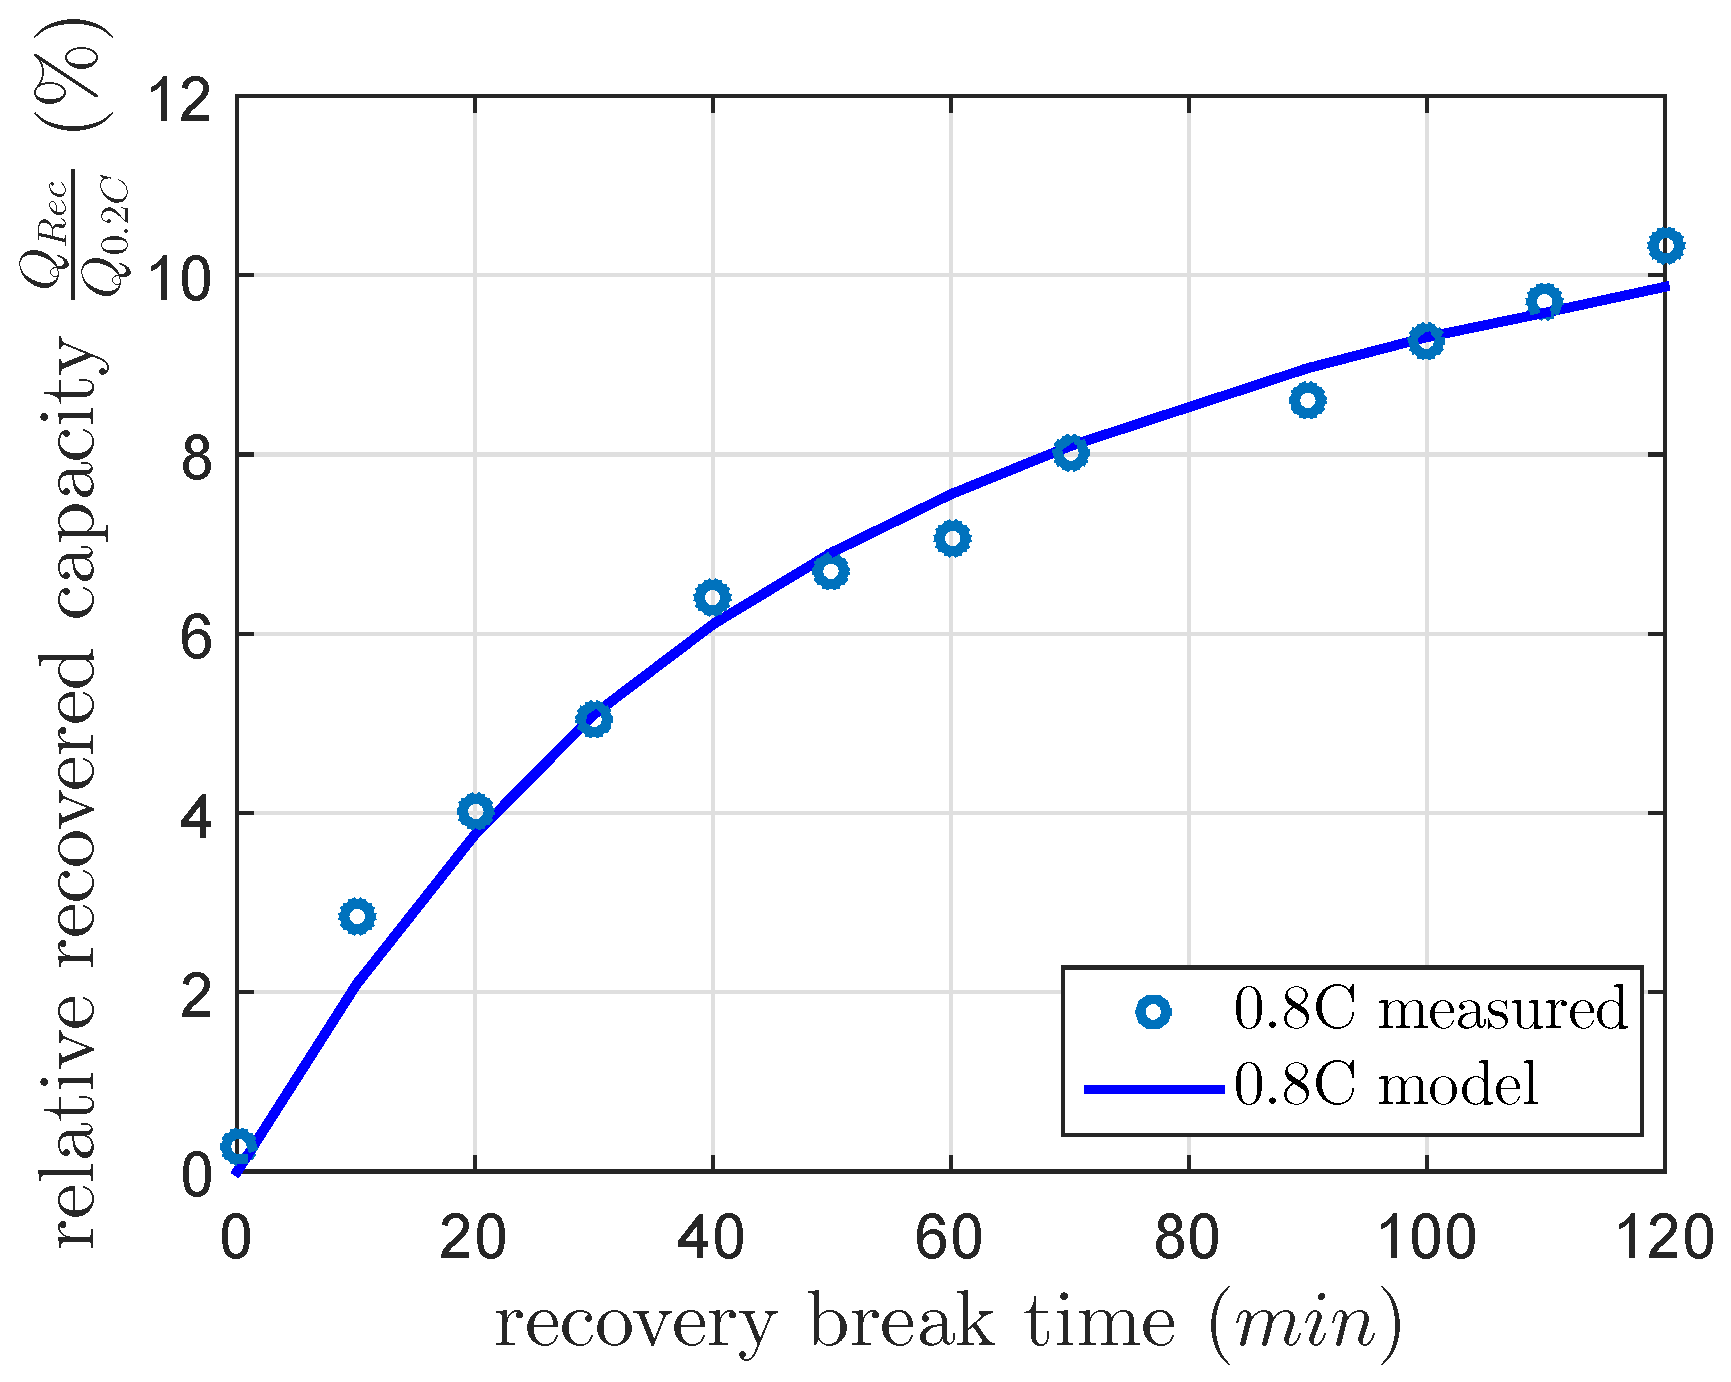
The results of all at 40%, 60% and 80% DOD showed an increasing amount of recovered capacity for all discharged current rates. The recoverable capacity increased with higher DOD levels due to the increase of the concentration and the diffusion of polysulfides to the active surface. Therefore, the recovered capacity dominated the contrary mechanism between the recovered capacity during the and decreasing inner cell temperature during . The recovered capacity due to the unblocked active material increased the discharged capacity more than the discharged capacity was reduced by lower inner cell temperature. As expected, the recovered capacity highly increased with higher DOD, with higher discharge current and with higher . Up to 20% of the cell capacity was recovered due to the concentration of and the amount of blocked active material.
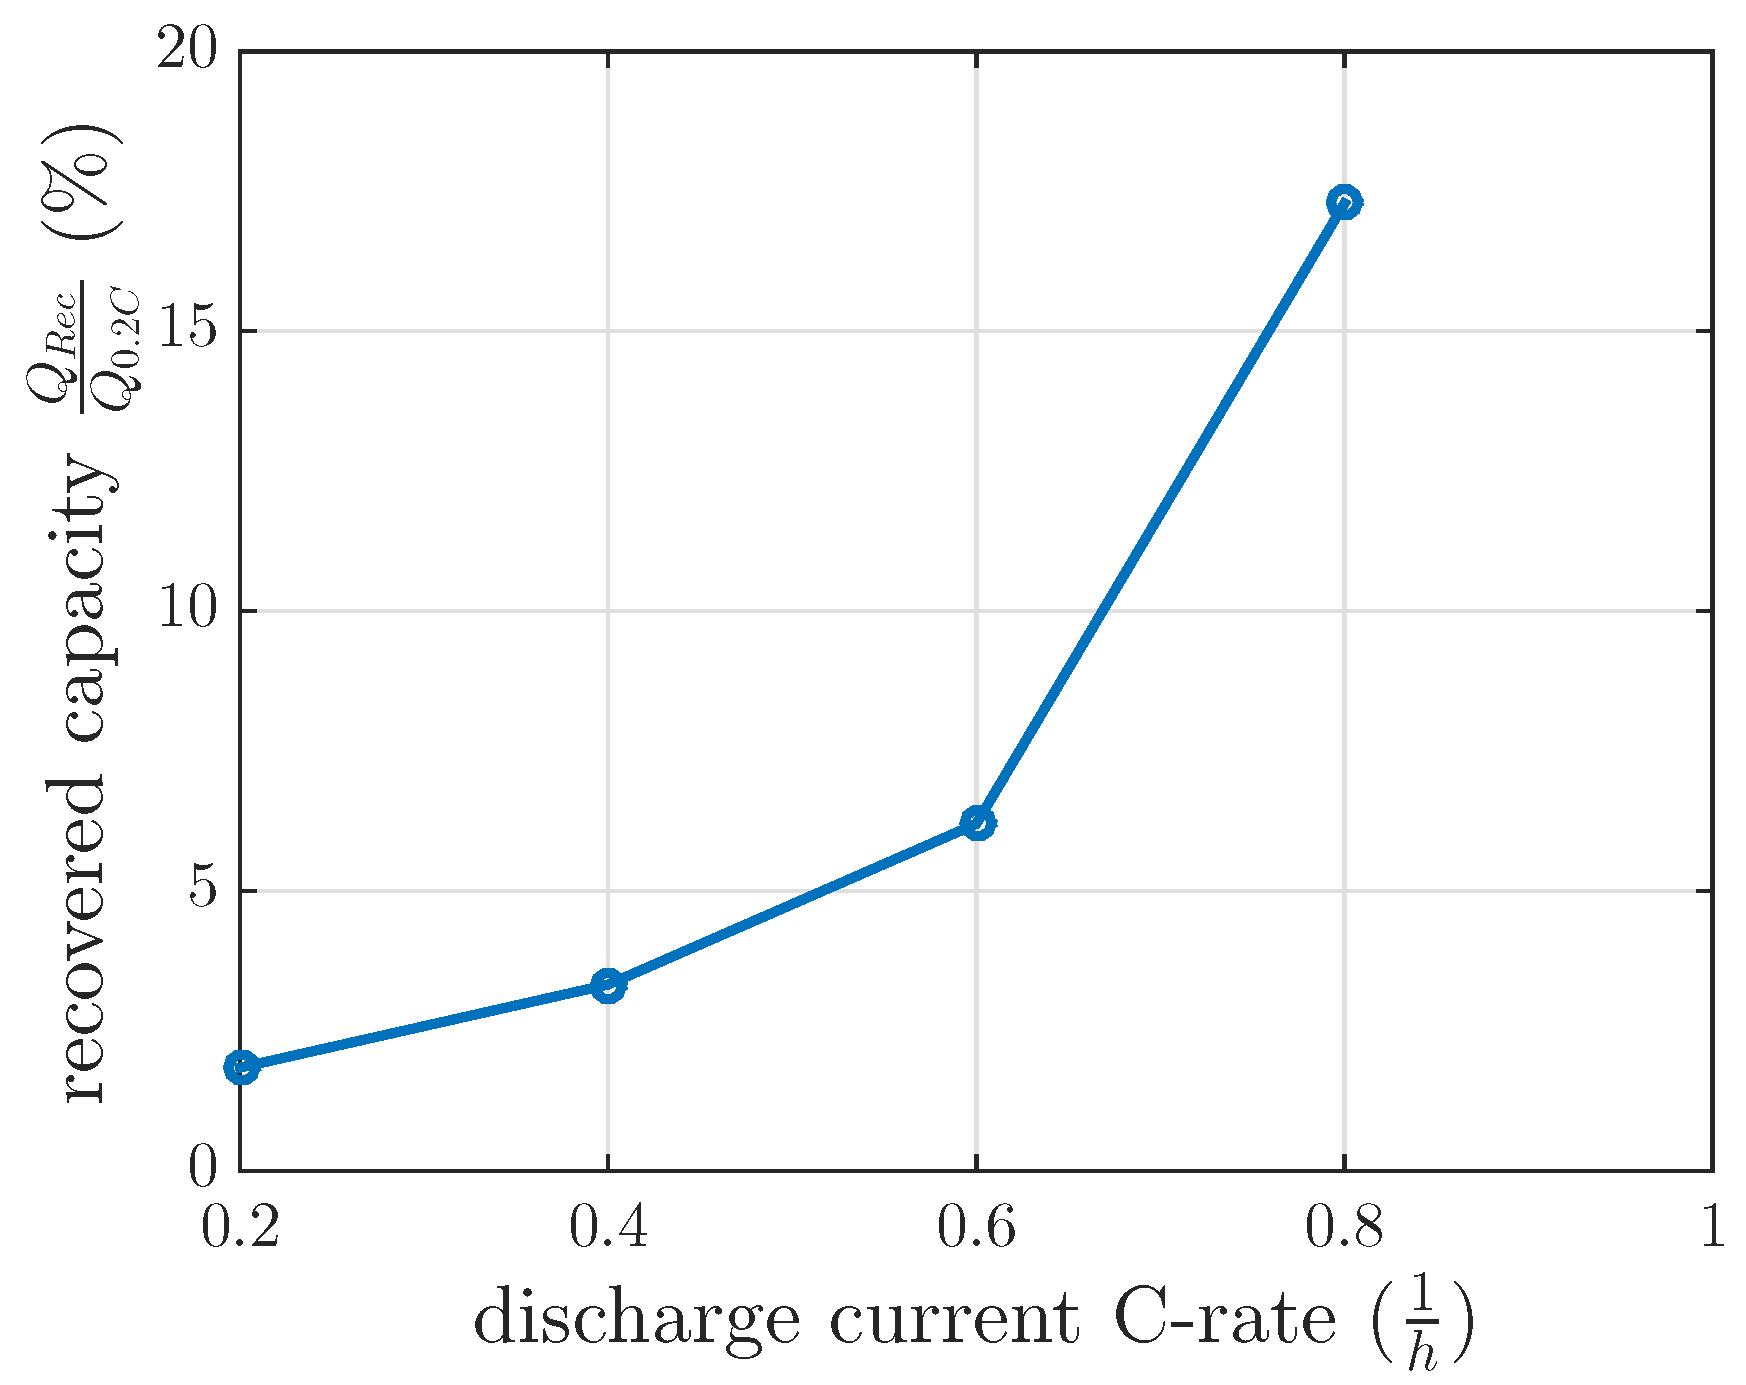
The measurements for every DOD and discharge current were separately modeled by a first order differential equation, which was solved in Equation (
5). The final recovery capacities of these separate models at
min are nonlinearly related, as we illustrate in
Figure 6.
Furthermore, the results of
Figure 5 and
Table 1 present a mean time constant
within the range of 17.9 and 24.4 min. This is in the same range as the published time constant in [
9].
In order to quantify the modeled quality, the root mean square of the recovery model for every discharge current and every DOD is shown in
Table 2. This shows that the highest error of the model was at 60% DOD. Good agreements were given for 20% and 80%.
In order to test the modeled capacity recovery effect, the same recovery cycle as described in
Section 3.2 was applied for a discharge current of 0.6 C with a
of 120 min at 60% DOD. This investigation intended to test the feasibility of the model interpolation between the measured discharge current of 0.4 C and 0.8 C. The measured recovered capacity in this recovery cycle was 6.2% (see
Figure 6), whereas the modeled recovery capacity was 9.5% by interpolating the recovery model between 0.4 C and 0.8 C. If the modeled recovered capacity between 0.2 C and 0.4 C were extrapolated, the modeled recovery capacity would be 4.75% for this 0.6 C investigation. These recovery capacities did not fit the measured ones for interpolation or extrapolation. Therefore, a linear interpolation of the recovered capacity at 0.4 C of constant current investigation and at 0.8 C of the first recovery time constant investigation in
Section 3.1 was used and showed that the measured recovered capacity of 0.6 C was reasonable. Therefore, the gain of the first recovery time constant investigation was interpolated between 100% DOD and 60% DOD with respect to the DOD dependent gain results in our measurements in
Figure 5. A recovery capacity of 5.6% was calculated by this model interpolation. The measured recovered capacity of 6.2% at 0.6 C was higher, as our model predicted, but reasonable with respect to
Table 2.
4.2. Drive Cycle Condition
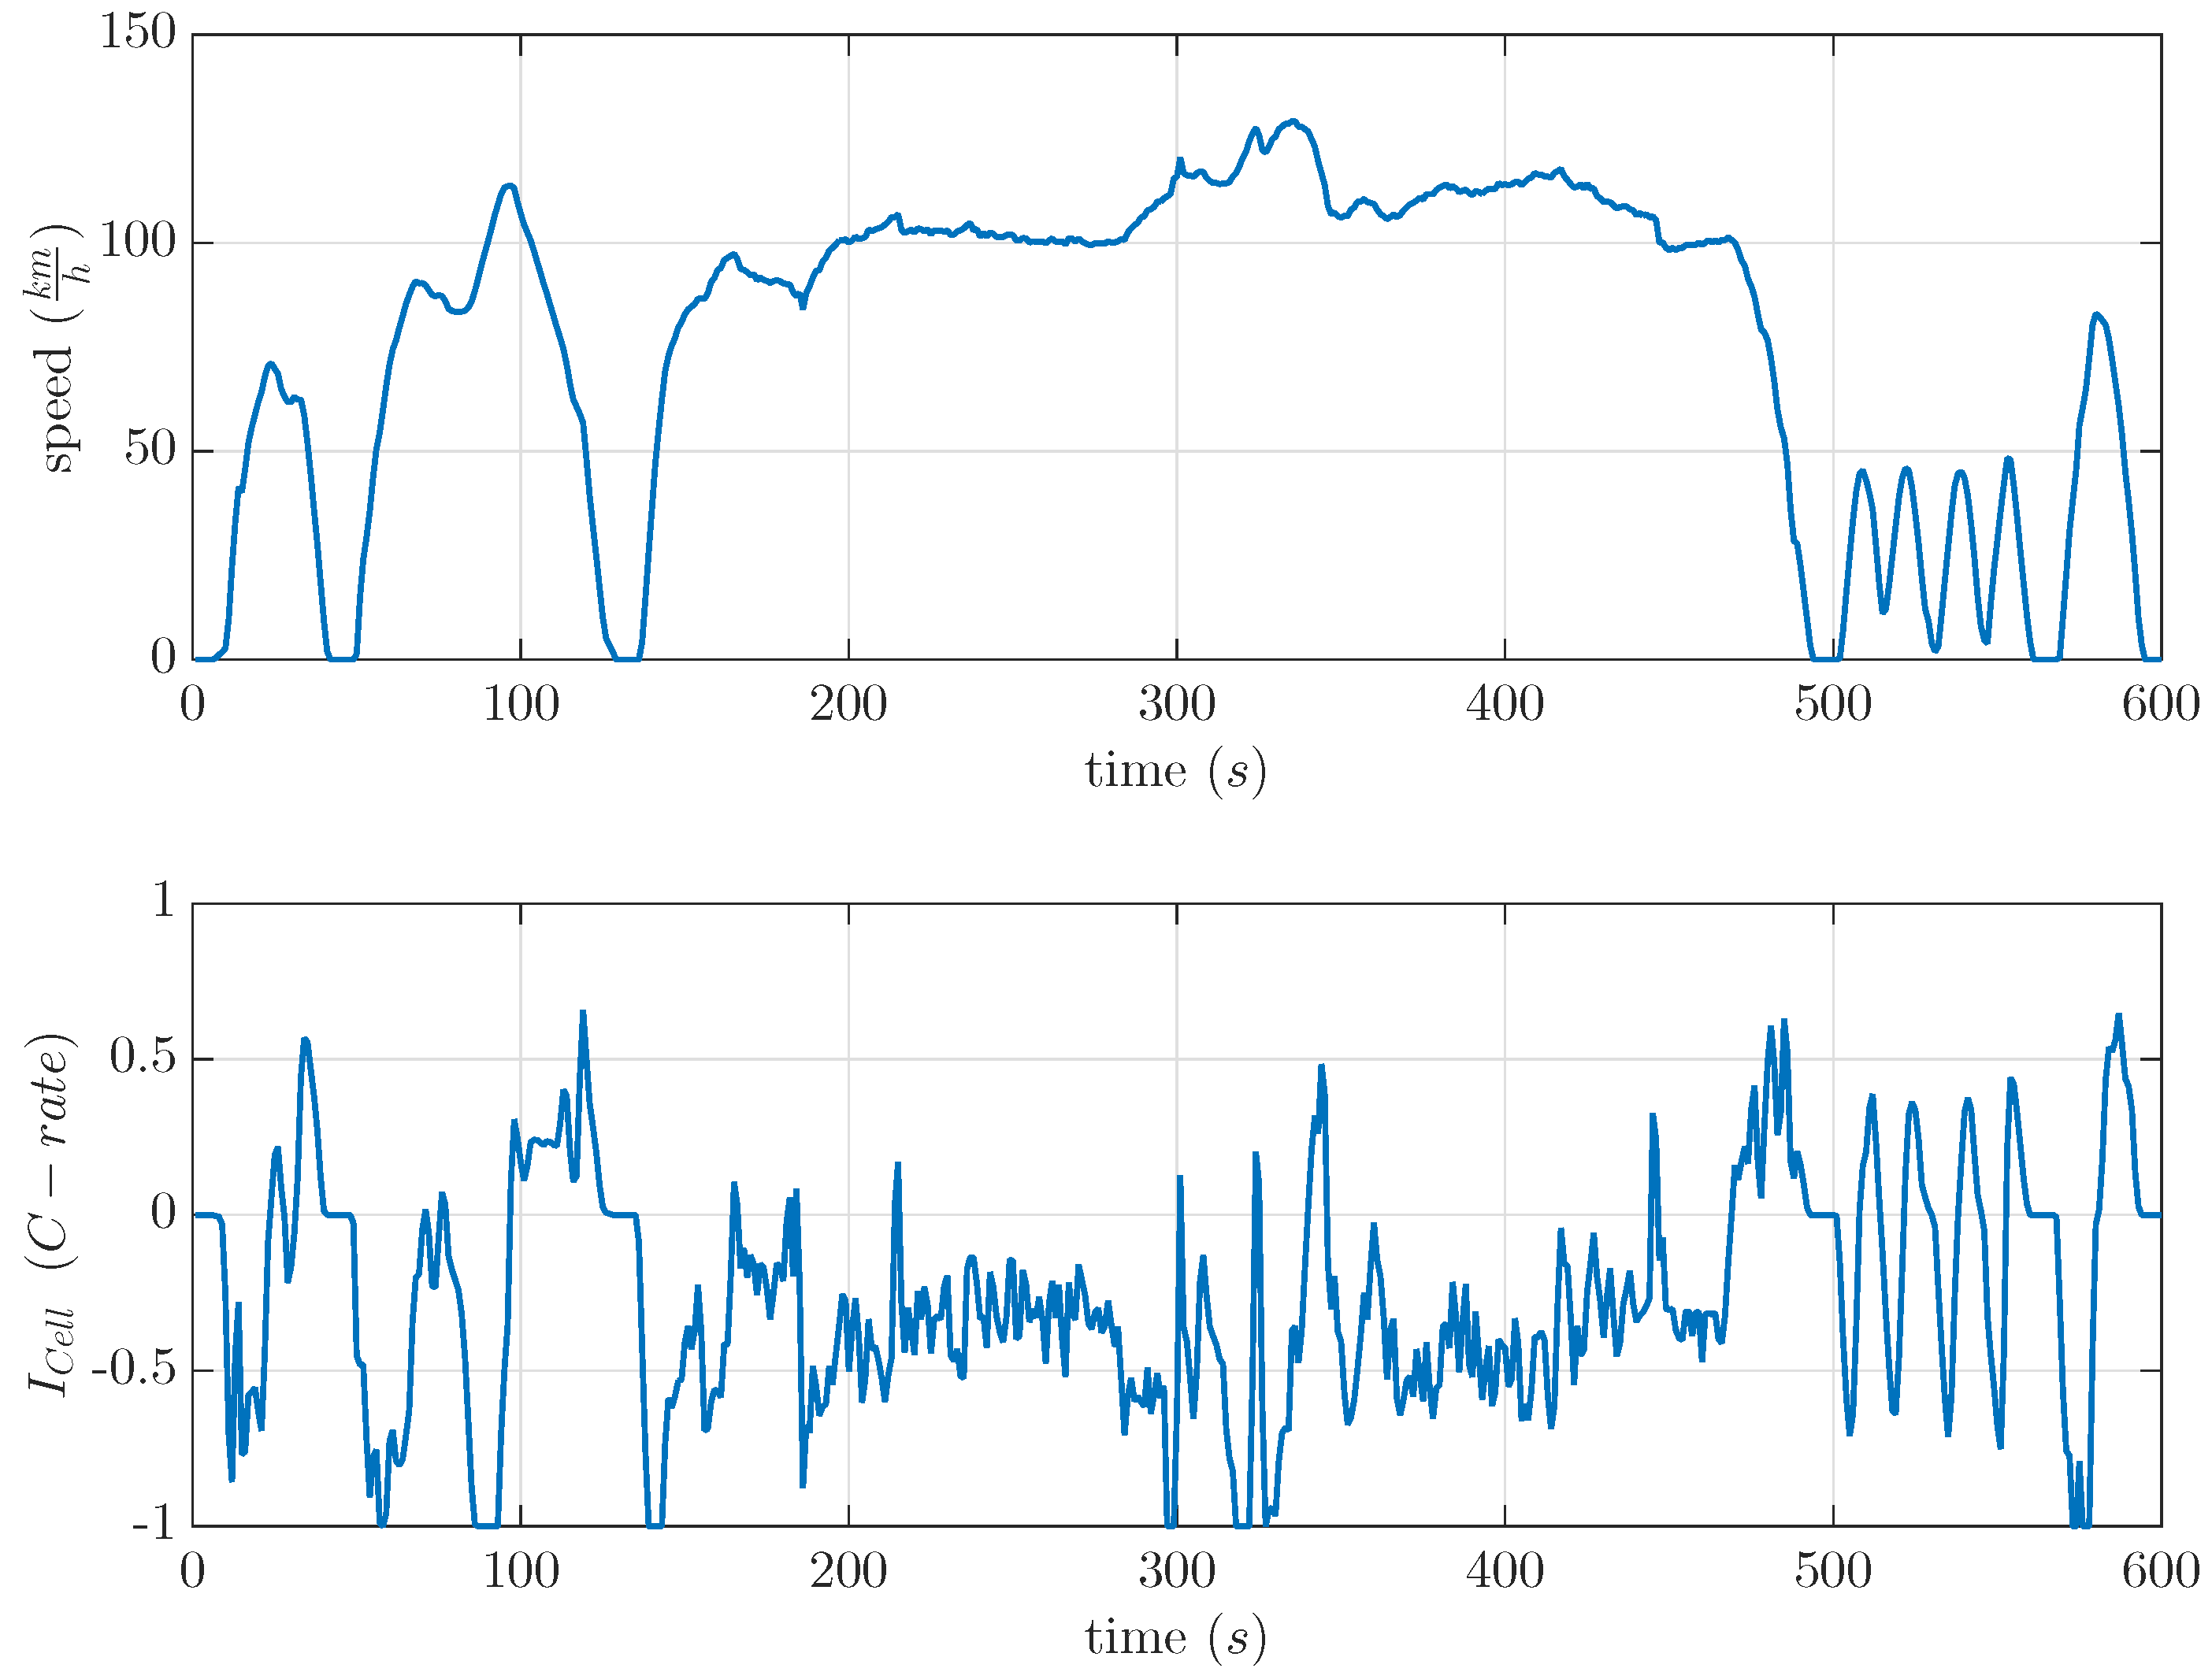
In this section, time-variant currents are investigated based on a drive cycle. Due to the fact that the recovered capacity is interesting for vehicular applications, a drive cycle with a LiS traction battery was investigated. This LiS traction battery was downsized on the cell level and measured in our lab.
Today, 68% of the daily travel of light-duty vehicles is about 40 miles per day [
16]. The electric vehicle journey time is short compared to rest time periods. In vehicular applications, these rest time periods have an important influence on the usable cell capacity and DOD in LiS batteries due to the recovery effect. Therefore, the basic recovery model was tested at separate cells with two different time-variant current profiles based on the US06 drive cycle. This drive cycle was already used in [
17] because of the high amount of recuperation parts. It showed a maximum possible real condition opposite to a recovery effect based on constant current discharge. The drive cycle and the used current profile are shown in
Figure 7. This US06 drive cycle was used to calculate current profiles for commercial LiS cells. The current profile as shown in
Figure 7 was separately scaled to a maximum discharge current of 0.5 C and 1 C by a light-duty vehicle.
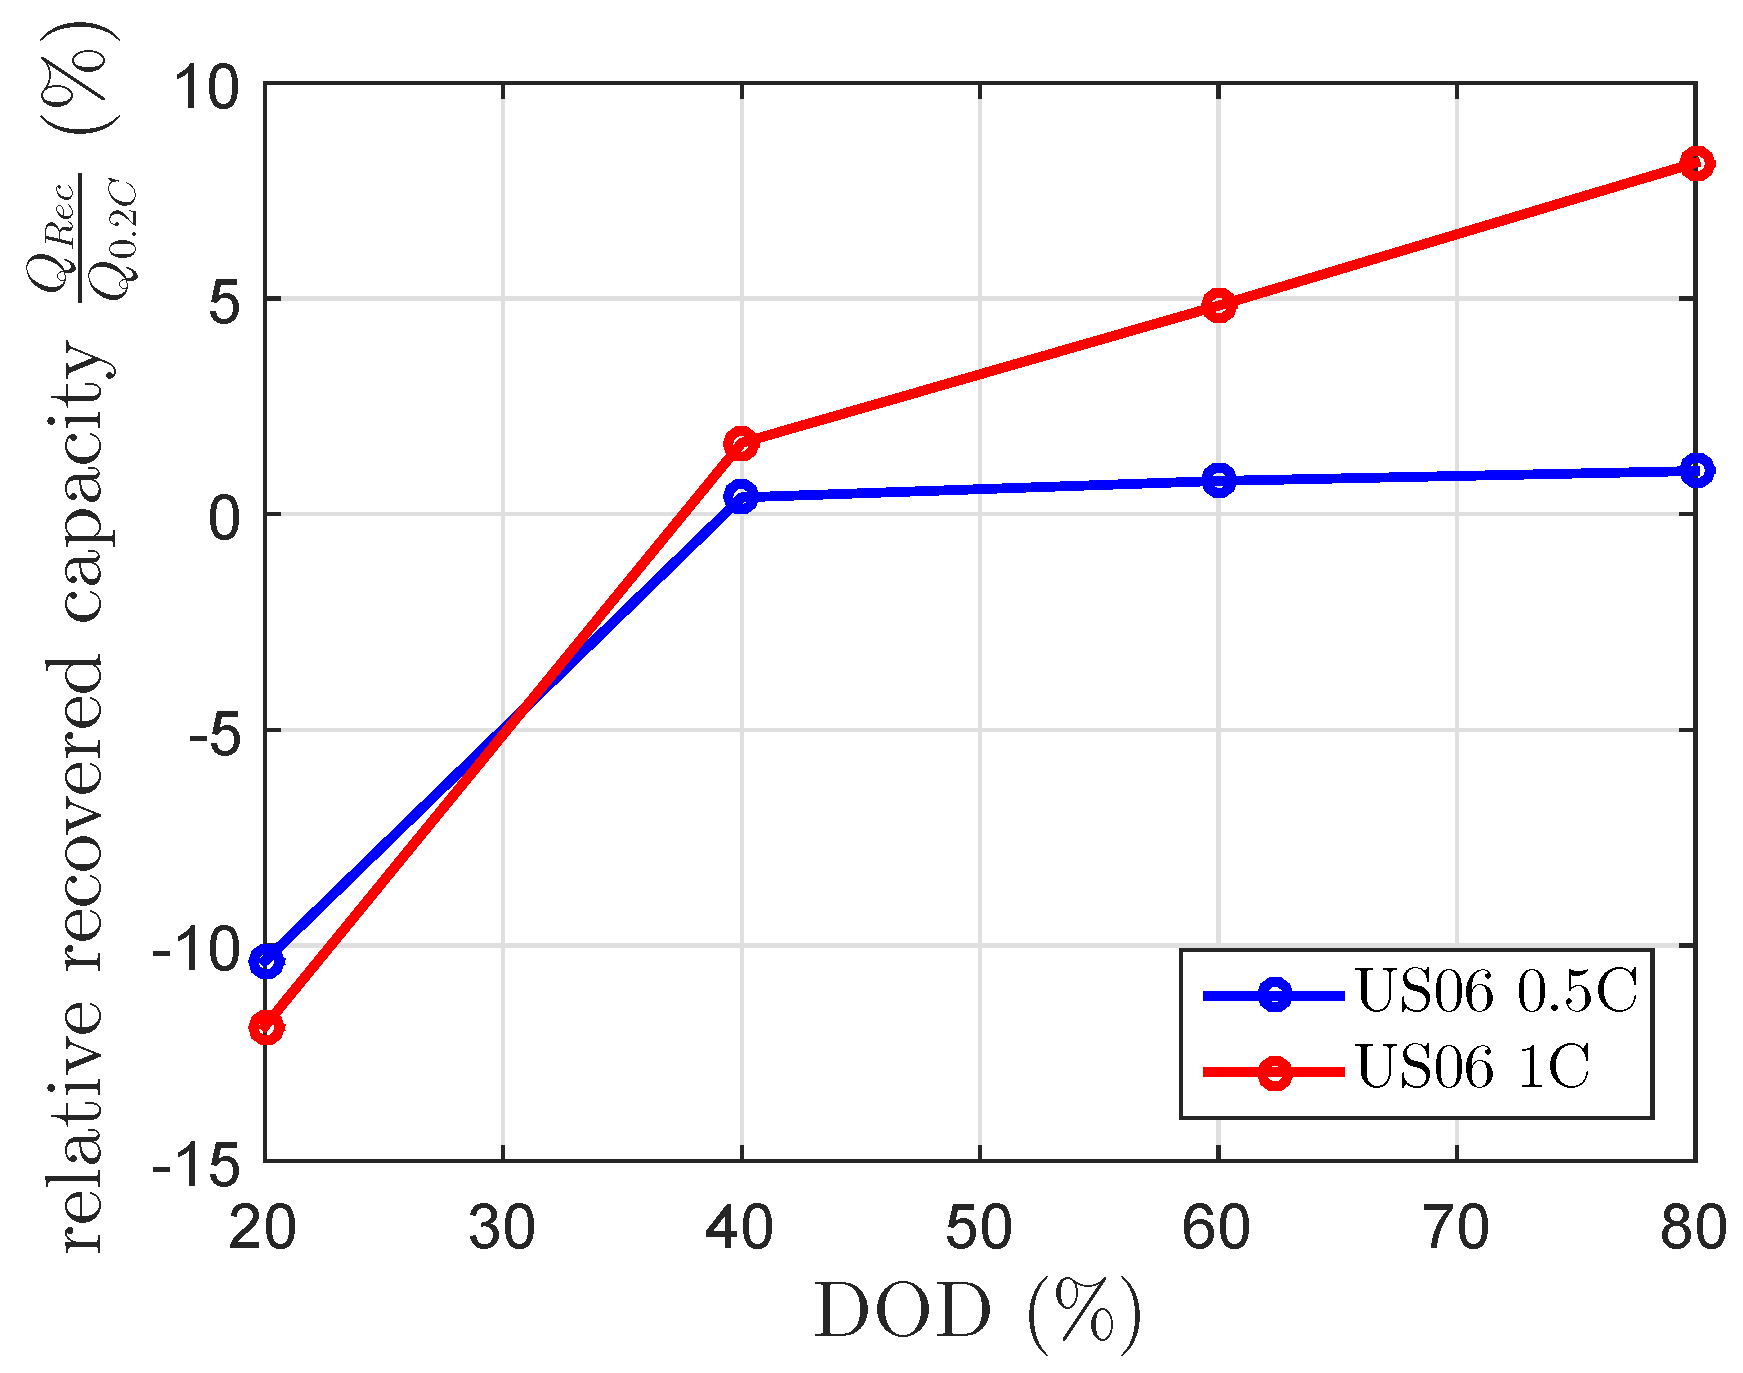
Each cell was discharged with repetitions of one of the two scaled current profiles of the US06 drive cycle. These repeated current profiles discharged the cell to the same DOD levels as described in
Section 3.3. At these DOD levels, a
of 120 min was included in order to check the maximum recovered capacity. Afterwards, the cell was further discharged at repeated current profiles of the scaled US06 current profile. The results presented in
Figure 8 show the expected negative recovered capacity at 20% DOD. Beside this, the results for the 1 C US06 at 60% and 80% DOD were unexpectedly high. At 80% DOD, it showed a recovered capacity of 8%. The results of the scaled 0.5 C US06 drive cycle fit the 0.5 C US06 mean current of the current profile (
), whereas the recovered capacities of the scaled 1 C US06 drive cycle highly differed from the modeled recovered capacity by the 1 C US06 mean current (
). The modeled recovered capacity at a constant discharge current of 0.27 C, which equivalents to
at 80% DOD and
of 120 min is 3.2%. This is lower than the measured one (see
Figure 5 and
Figure 8). The calculated mean currents of the drive cycle considered each current
by the same weight.
4.3. Discussion
Our study demonstrates a DOD and current-dependent capacity recovery effect. Obviously, the findings in the constant current investigation in
Section 4.1 show a first order differential equation behavior for constant currents.
As
Section 4.1 shows, the recovered capacity of 0.6 C is underestimated by model extrapolation between 0.2 C and 0.4 C, and it is overestimated by model interpolation between 0.4 C and 0.8 C. A reasonable recovered capacity can be estimated with respect to the first recovery time constant investigation. This can be explained by assuming that the recovered capacity of the 0.8 C model is too high. The findings of the recovered capacity for discharge current at 0.8 C for 60% and for 80% DOD of up to 20% seem to be too high compared to the maximum of 10.5% recovered capacity of the first recovery time constant investigation in
Section 3.1. One explanation for the finding of this high recovered capacity might be an increasing age of the cell. The decreased discharge capacity of the cell at high currents is more influenced than at low currents. Compared to constant current discharge, the discharge with
at a higher aged state could recover some capacity and, in addition, might use dissolved non-utilized polysulfides, which diffuse back to the active surface. However, the normalized recovered capacity is in the same range as the normalized recovered capacity in [
9] at 1 C. Contrary to the results in [
9], we could not recover the whole non-utilized sulfur capacity. The difference in our study and the findings of [
9] might also be that the
is included at 100% DOD in [
9] and at a maximum of 80% DOD in our study. A further explanation could be due to different cell designs. Further investigations on the recovery effect and aging have to be made.
Although there are some higher root mean square errors for data of 60% DOD in comparison to the root mean square errors of the other DODs (see
Table 2), they still seem reasonable compared to the amount of recovered capacity and to the other model errors.
Our data in
Table 1 confirm that
at different DOD levels suit the recovery time constant of 100% DOD published in [
9]; although they are very small at 0.2 C.
Our additional results at drive cycle conditions offer evidence that the provided model cannot estimate recovered capacity of time-variant currents due to current averaging before . The assumption of equally-weighted current on the recovery effect is not feasible. The 1 C US06 drive cycle provided a remarkably higher recovered capacity than estimated by current averaging. The difference between the actual recovered capacity and the estimated recovered capacity due to current averaging is probably due to the nonlinearity of the blocking process by time-variant currents. The constant current investigation provides little information about this blocking process due to time-variant currents. It seems that 0.5 C US06 does not heavily influence the recovery effect due to time-variant currents.
We readily acknowledge that this model is limited to constant current discharge profiles. We therefore recommend further investigations towards dynamic current discharge profiles. An alternative to the averaged current as the input parameter for the recovery model might be the grade of blocked active material.
However, the present study offers clear evidence that the recovery effect is an important mechanism to be considered in vehicular applications.


