Article

Comparative Life Cycle Analysis of Conventional and Hybrid Heavy-Duty Trucks

1
FH Aachen, NOWUM-Energy, Heinrich-Mußmann-Str. 1, 52428 Jülich, Germany
2
FH Aachen, European Center for Sustainable Mobility (ECSM), Aachener-und-Münchener-Allee 1, 52074 Aachen, Germany
*
Author to whom correspondence should be addressed.
World Electr. Veh. J. 2018, 9(2), 33; https://doi.org/10.3390/wevj9020033
Submission received: 12 June 2018 / Revised: 25 July 2018 / Accepted: 3 August 2018 / Published: 13 August 2018

Abstract

:
Heavy-duty trucks are one of the main contributors to greenhouse gas emissions in German traffic. Drivetrain electrification is an option to reduce tailpipe emissions by increasing energy conversion efficiency. To evaluate the vehicle’s environmental impacts, it is necessary to consider the entire life cycle. In addition to the daily use, it is also necessary to include the impact of production and disposal. This study presents the comparative life cycle analysis of a parallel hybrid and a conventional heavy-duty truck in long-haul operation. Assuming a uniform vehicle glider, only the differing parts of both drivetrains are taken into account to calculate the environmental burdens of the production. The use phase is modeled by a backward simulation in MATLAB/Simulink considering a characteristic driving cycle. A break-even analysis is conducted to show at what mileage the larger CO2eq emissions due to the production of the electric drivetrain are compensated. The effect of parameter variation on the break-even mileage is investigated by a sensitivity analysis. The results of this analysis show the difference in CO2eq/t km is negative, indicating that the hybrid vehicle releases 4.34 g CO2eq/t km over a lifetime fewer emissions compared to the diesel truck. The break-even analysis also emphasizes the advantages of the electrified drivetrain, compensating the larger emissions generated during production after already a distance of 15,800 km (approx. 1.5 months of operation time). The intersection coordinates, distance, and CO2eq, strongly depend on fuel, emissions for battery production and the driving profile, which lead to nearly all parameter variations showing an increase in break-even distance.

1. Introduction

According to The German Government’s Climate Action Programme of 2014, greenhouse gas (GHG) emissions have to be reduced by at least 40% below 1990 levels by 2020 [1]. To achieve the GHG target, the German Government has defined two sub-targets among others: Renewable generated electricity to increase to 35% of gross electricity production by 2020 and to have 1 million electric vehicles on the road by 2020 [2,3]. GHG emissions from the transportation sector accounted for about 18% of total German GHG emissions in 2013, approximately 95% of these were released from road transport [4]. Out of 52.4 million registered vehicles in Germany 2013, passenger cars accounted for 83% and semi-trailer trucks for 0.3% [5]. The annual average mileage was 14,259 km for passenger cars and 102,832 km for semi-trailers [6]. The average fuel consumption of passenger cars accounts 4.9 liters (corresponding to 15.6 kg CO2eq) of diesel per 100 km, and the average fuel consumption of semi-trailer trucks (long-haul) 34.5 liters (corresponding to 109.6 kg CO2eq) of diesel per 100 km [7,8]. From this it can be concluded that the emission and energy reduction potential per vehicle of semi-trailer trucks is larger than the potential of passenger cars. Despite this enormous potential, drivetrain electrification is still not common for heavy-duty vehicles (HDV). In 2016 there were 12 hybrid and only 2 pure electric HDV registered in Germany [9], and there are currently no electric or hybrid HDV commercially available [9].
In the context of HDV and life cycle assessment (LCA), research has been conducted comparing different conventional vehicles powered by internal combustion engines (ICEV) [10]. Gaines et al. analyzed life cycle impacts by changes in truck materials, truck design, engine design, and operation by using liquefied natural gas and Fischer-Tropsch, diesel instead of conventional diesel fuel [11]. Rose et al. published a comparative LCA of diesel and compressed natural gas but for a special application of HDV (refuse collection) [12]. Further studies have analyzed the environmental impacts of freight transportation alternatives in Europe and in the U.S. but neglecting drivetrain electrification as having energy reduction potential [13]. There is currently no study available evaluating the energy and CO2eq reduction potential by substituting conventional with hybrid HDV in long-haul transportation in Europe.
This paper compares the life cycle CO2eq emissions of conventional and hybrid heavy-duty trucks in long-haul operation. First, goal and scope of the study are defined, and the life cycle inventory is modeled. The energy consumption of both trucks is calculated by simulating the vehicle dynamics using a real driving profile. The difference in environmental impact over the vehicle life cycle is calculated, and a break-even analysis is conducted to determine at what mileage the larger CO2eq emissions of the hybrid electric vehicle (HEV) production are compensated compared to the ICEV. A sensitivity analysis is finally applied to evaluate the influence of selected parameters on the break-even distance.

2. Methodology

LCA is an established and widely used method to analyze the environmental impacts of products and services [14]. According to the international standard, an LCA is divided into 4 phases: goal and scope definition, inventory analysis, impact assessment, and interpretation [15].

2.1. Goal and Scope

This study presents a comparative assertion of the life cycle environmental impacts associated with a heavy-duty truck in long-haul application having a conventional or a parallel hybrid drivetrain and a total mass of 40 tons. It investigates whether in 2017 in Germany HEVs are competitive to ICEVs with respect to energy consumption (abiotic depletion) and CO2eq emissions (Global Warming Potential). Referring to this issue, the following two questions are answered:
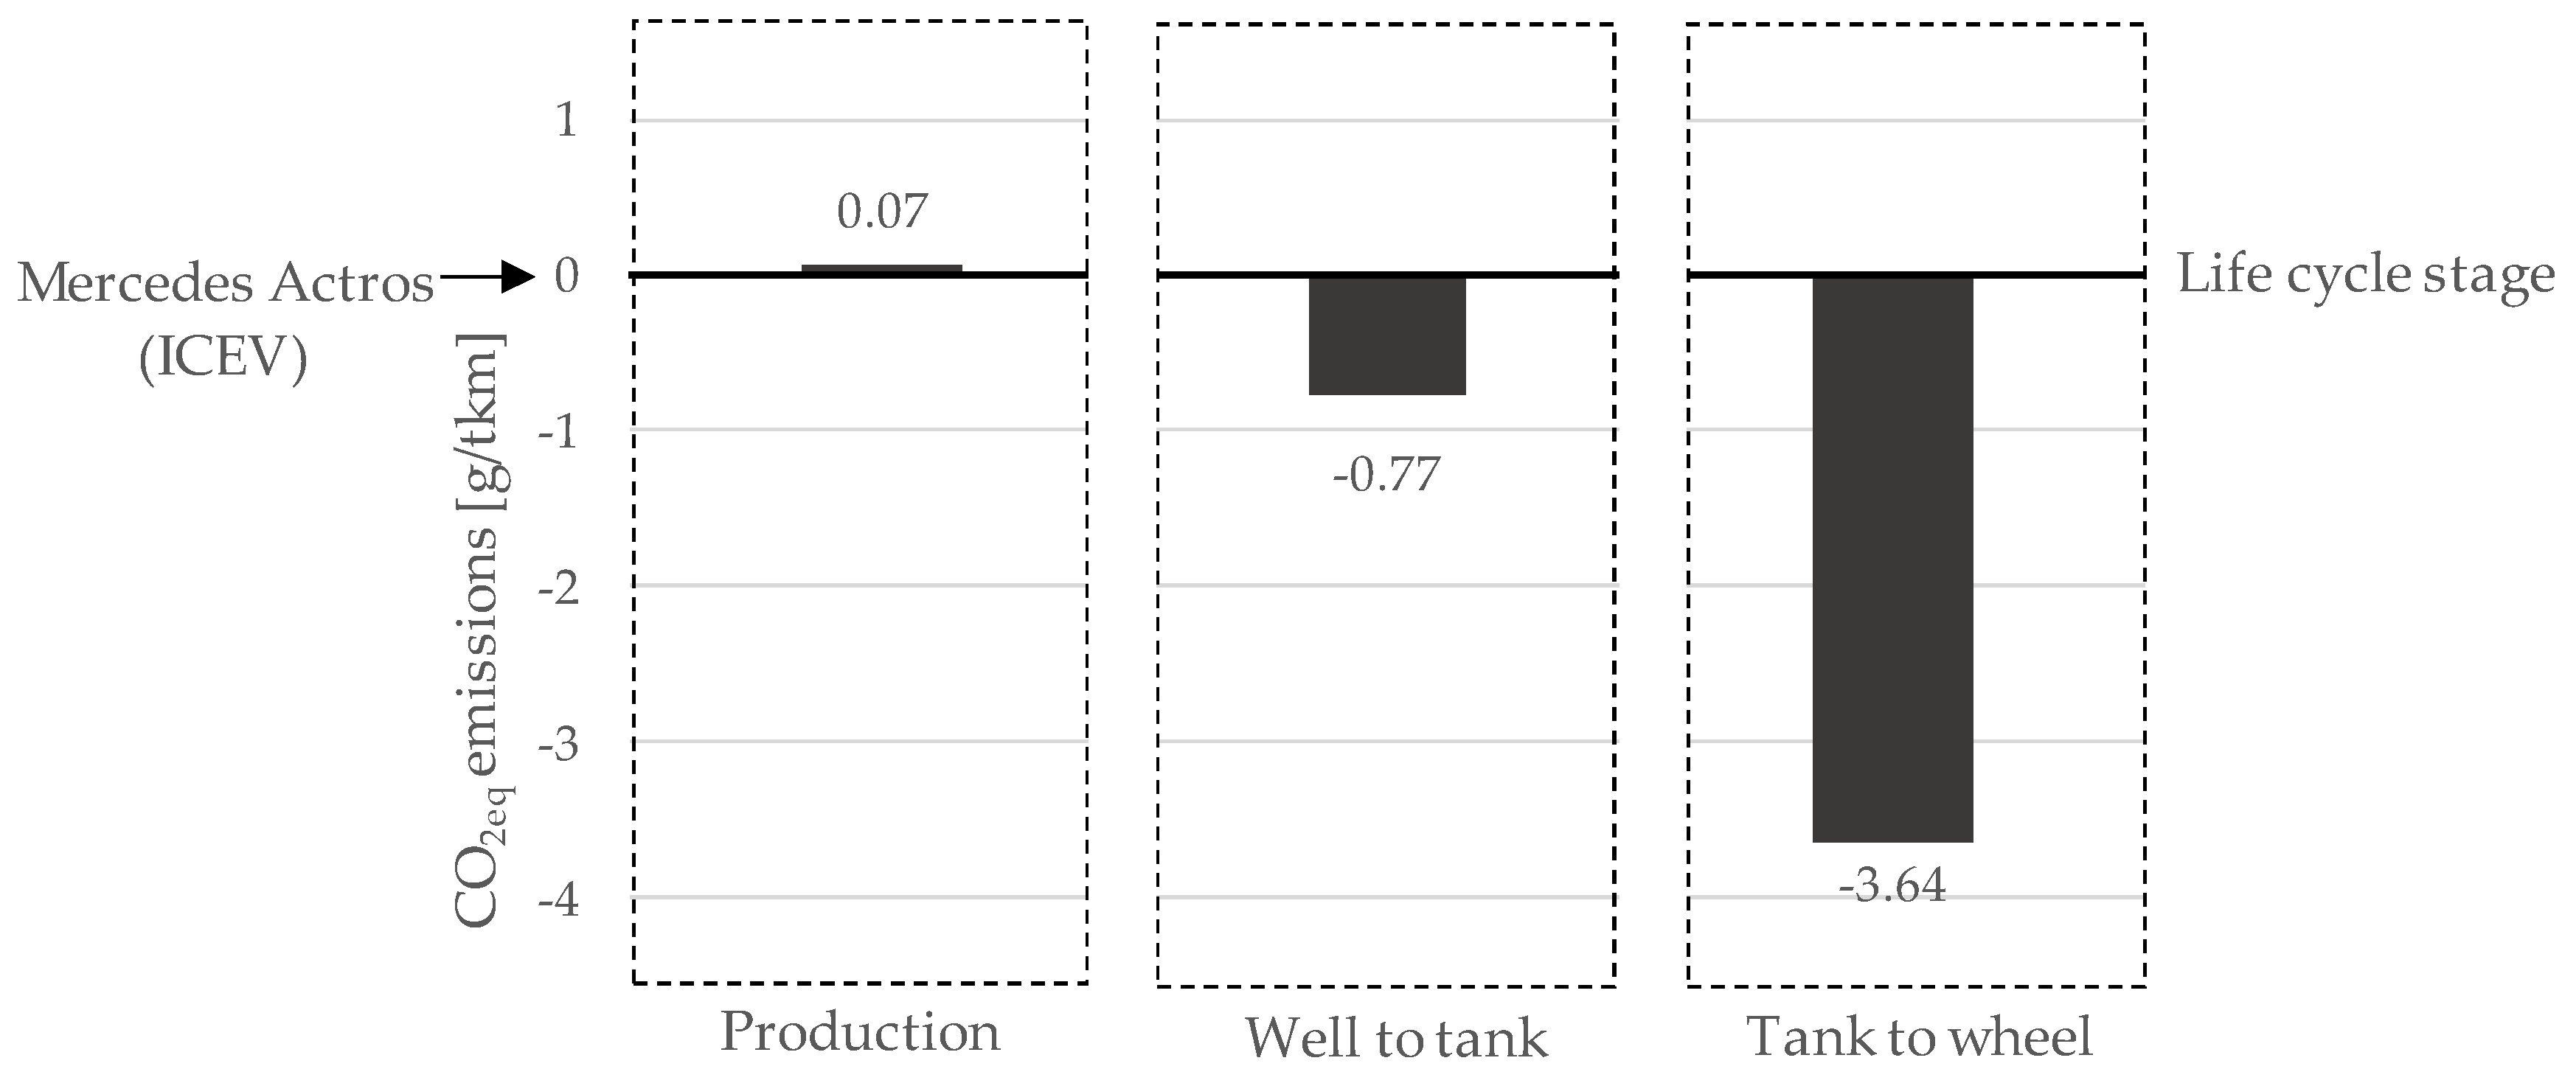
  • How large is the difference in environmental impact for the hybrid truck during its life cycle, using the conventional vehicle as a baseline?
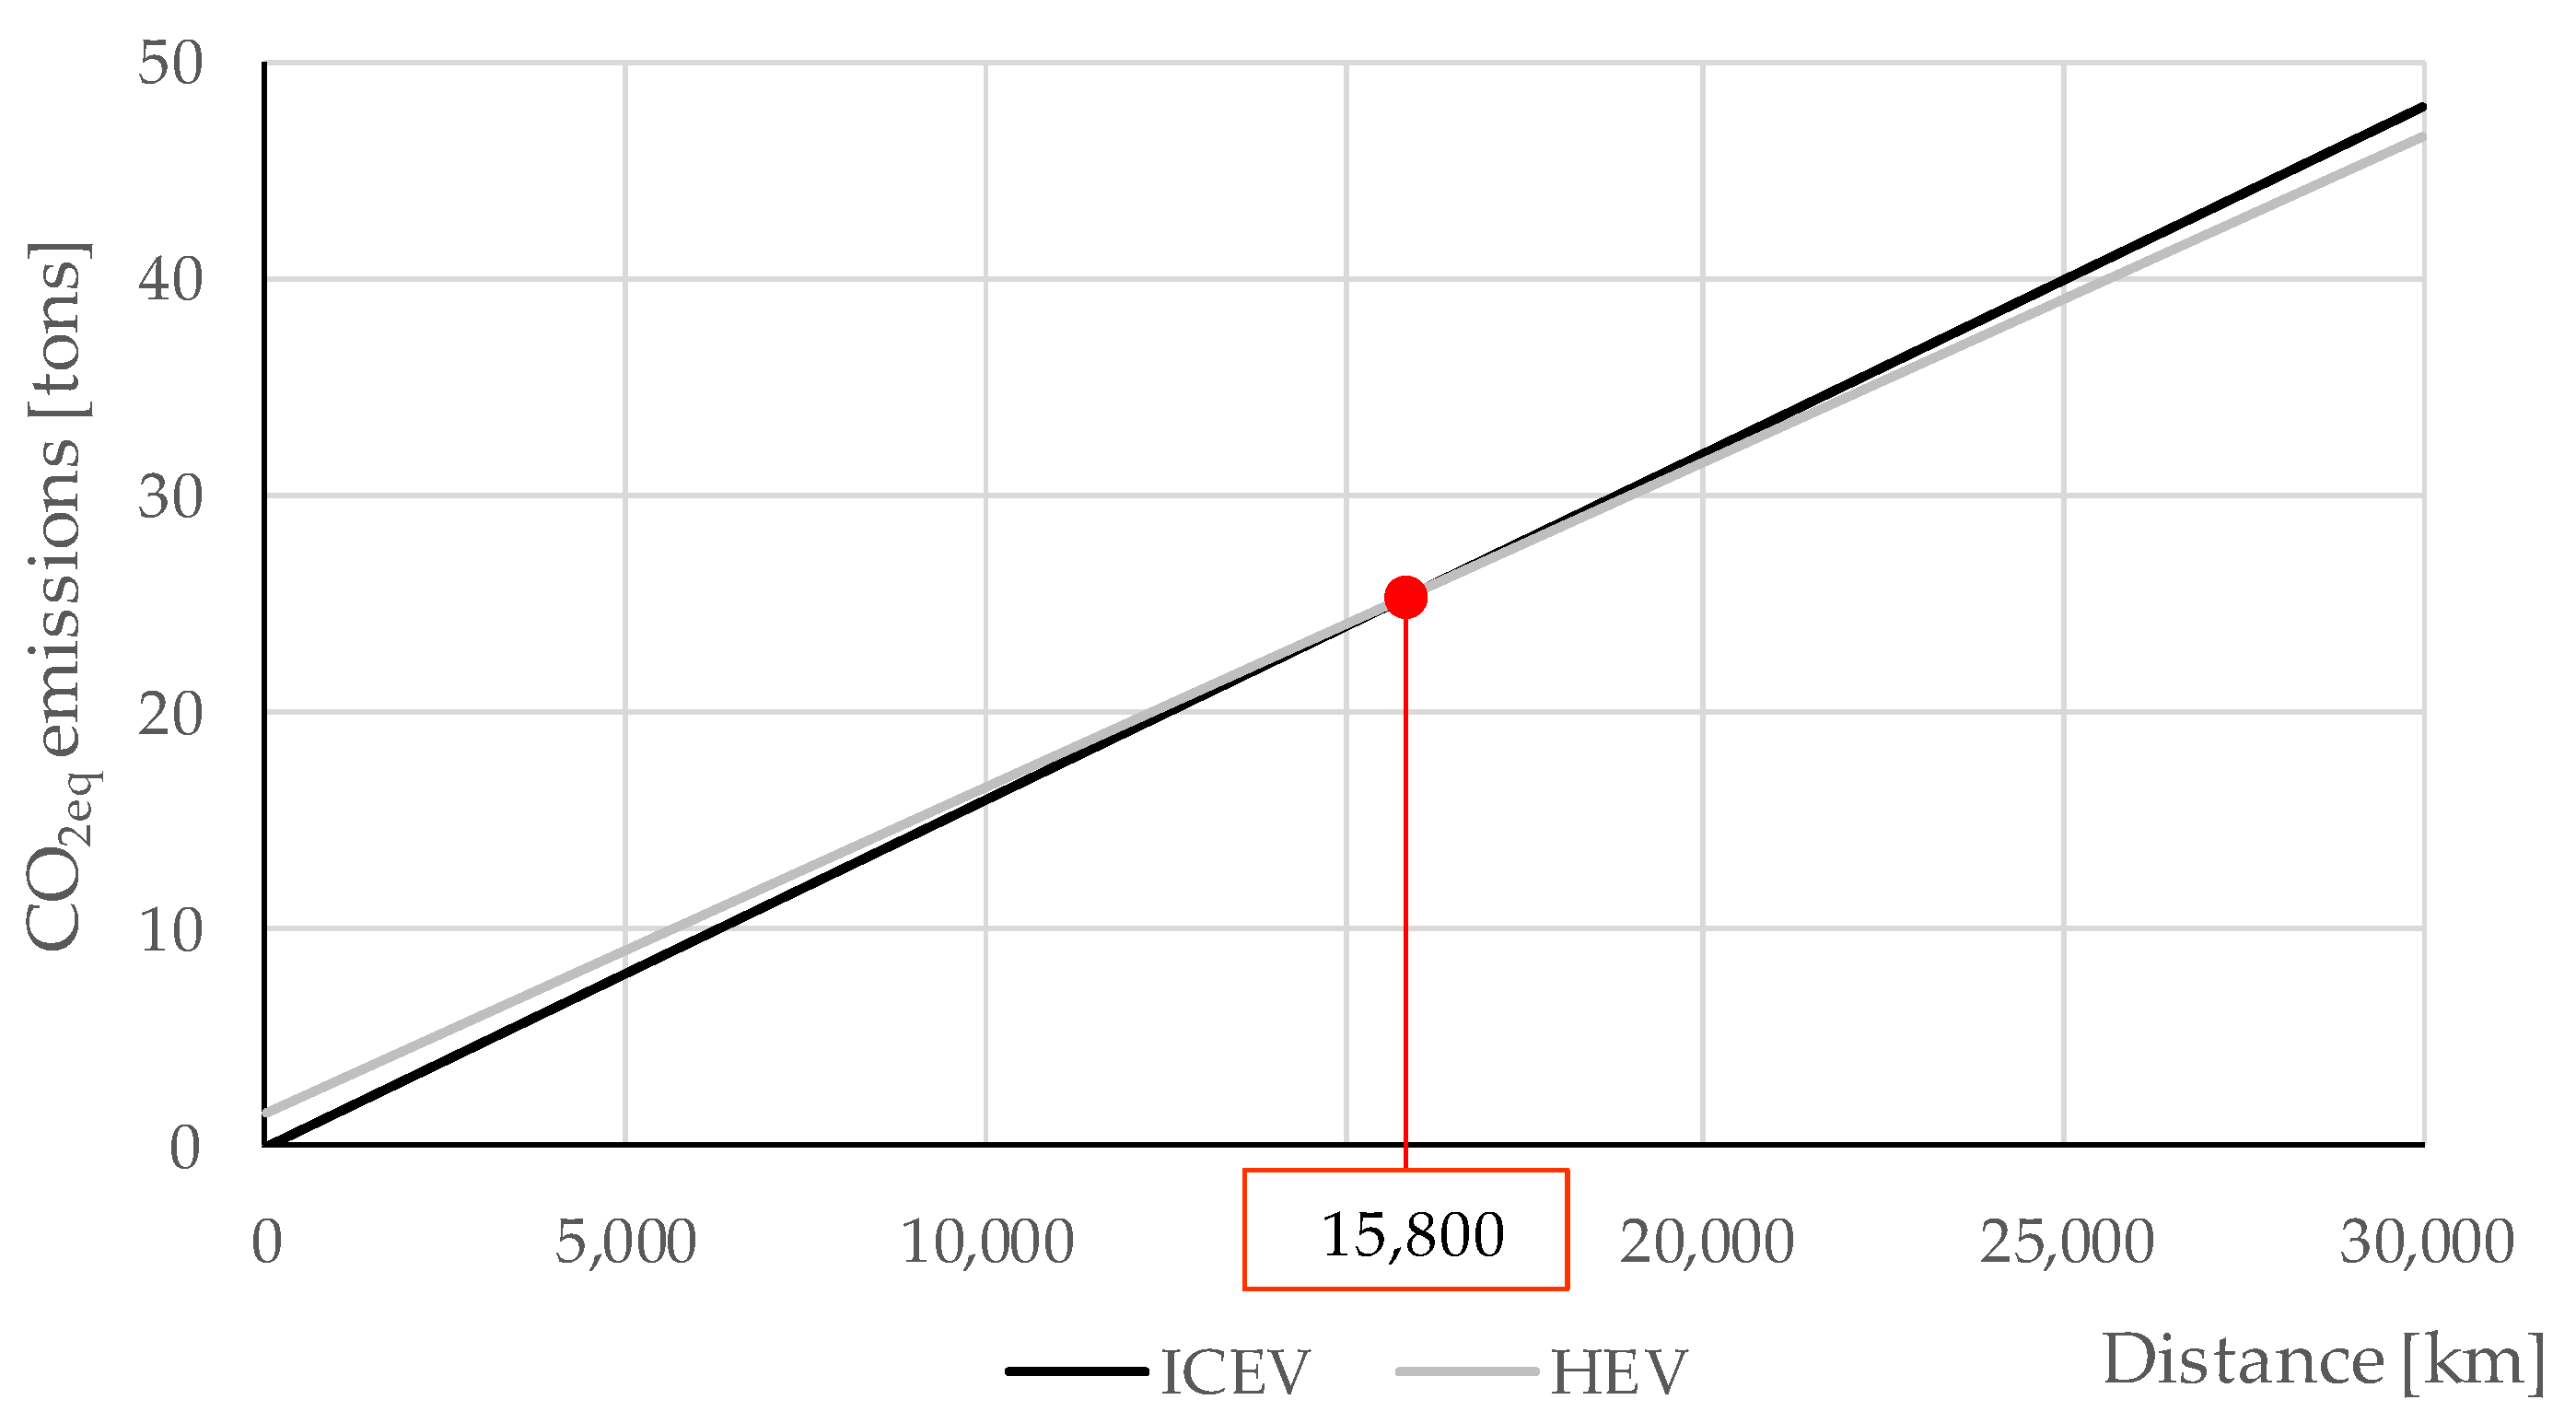
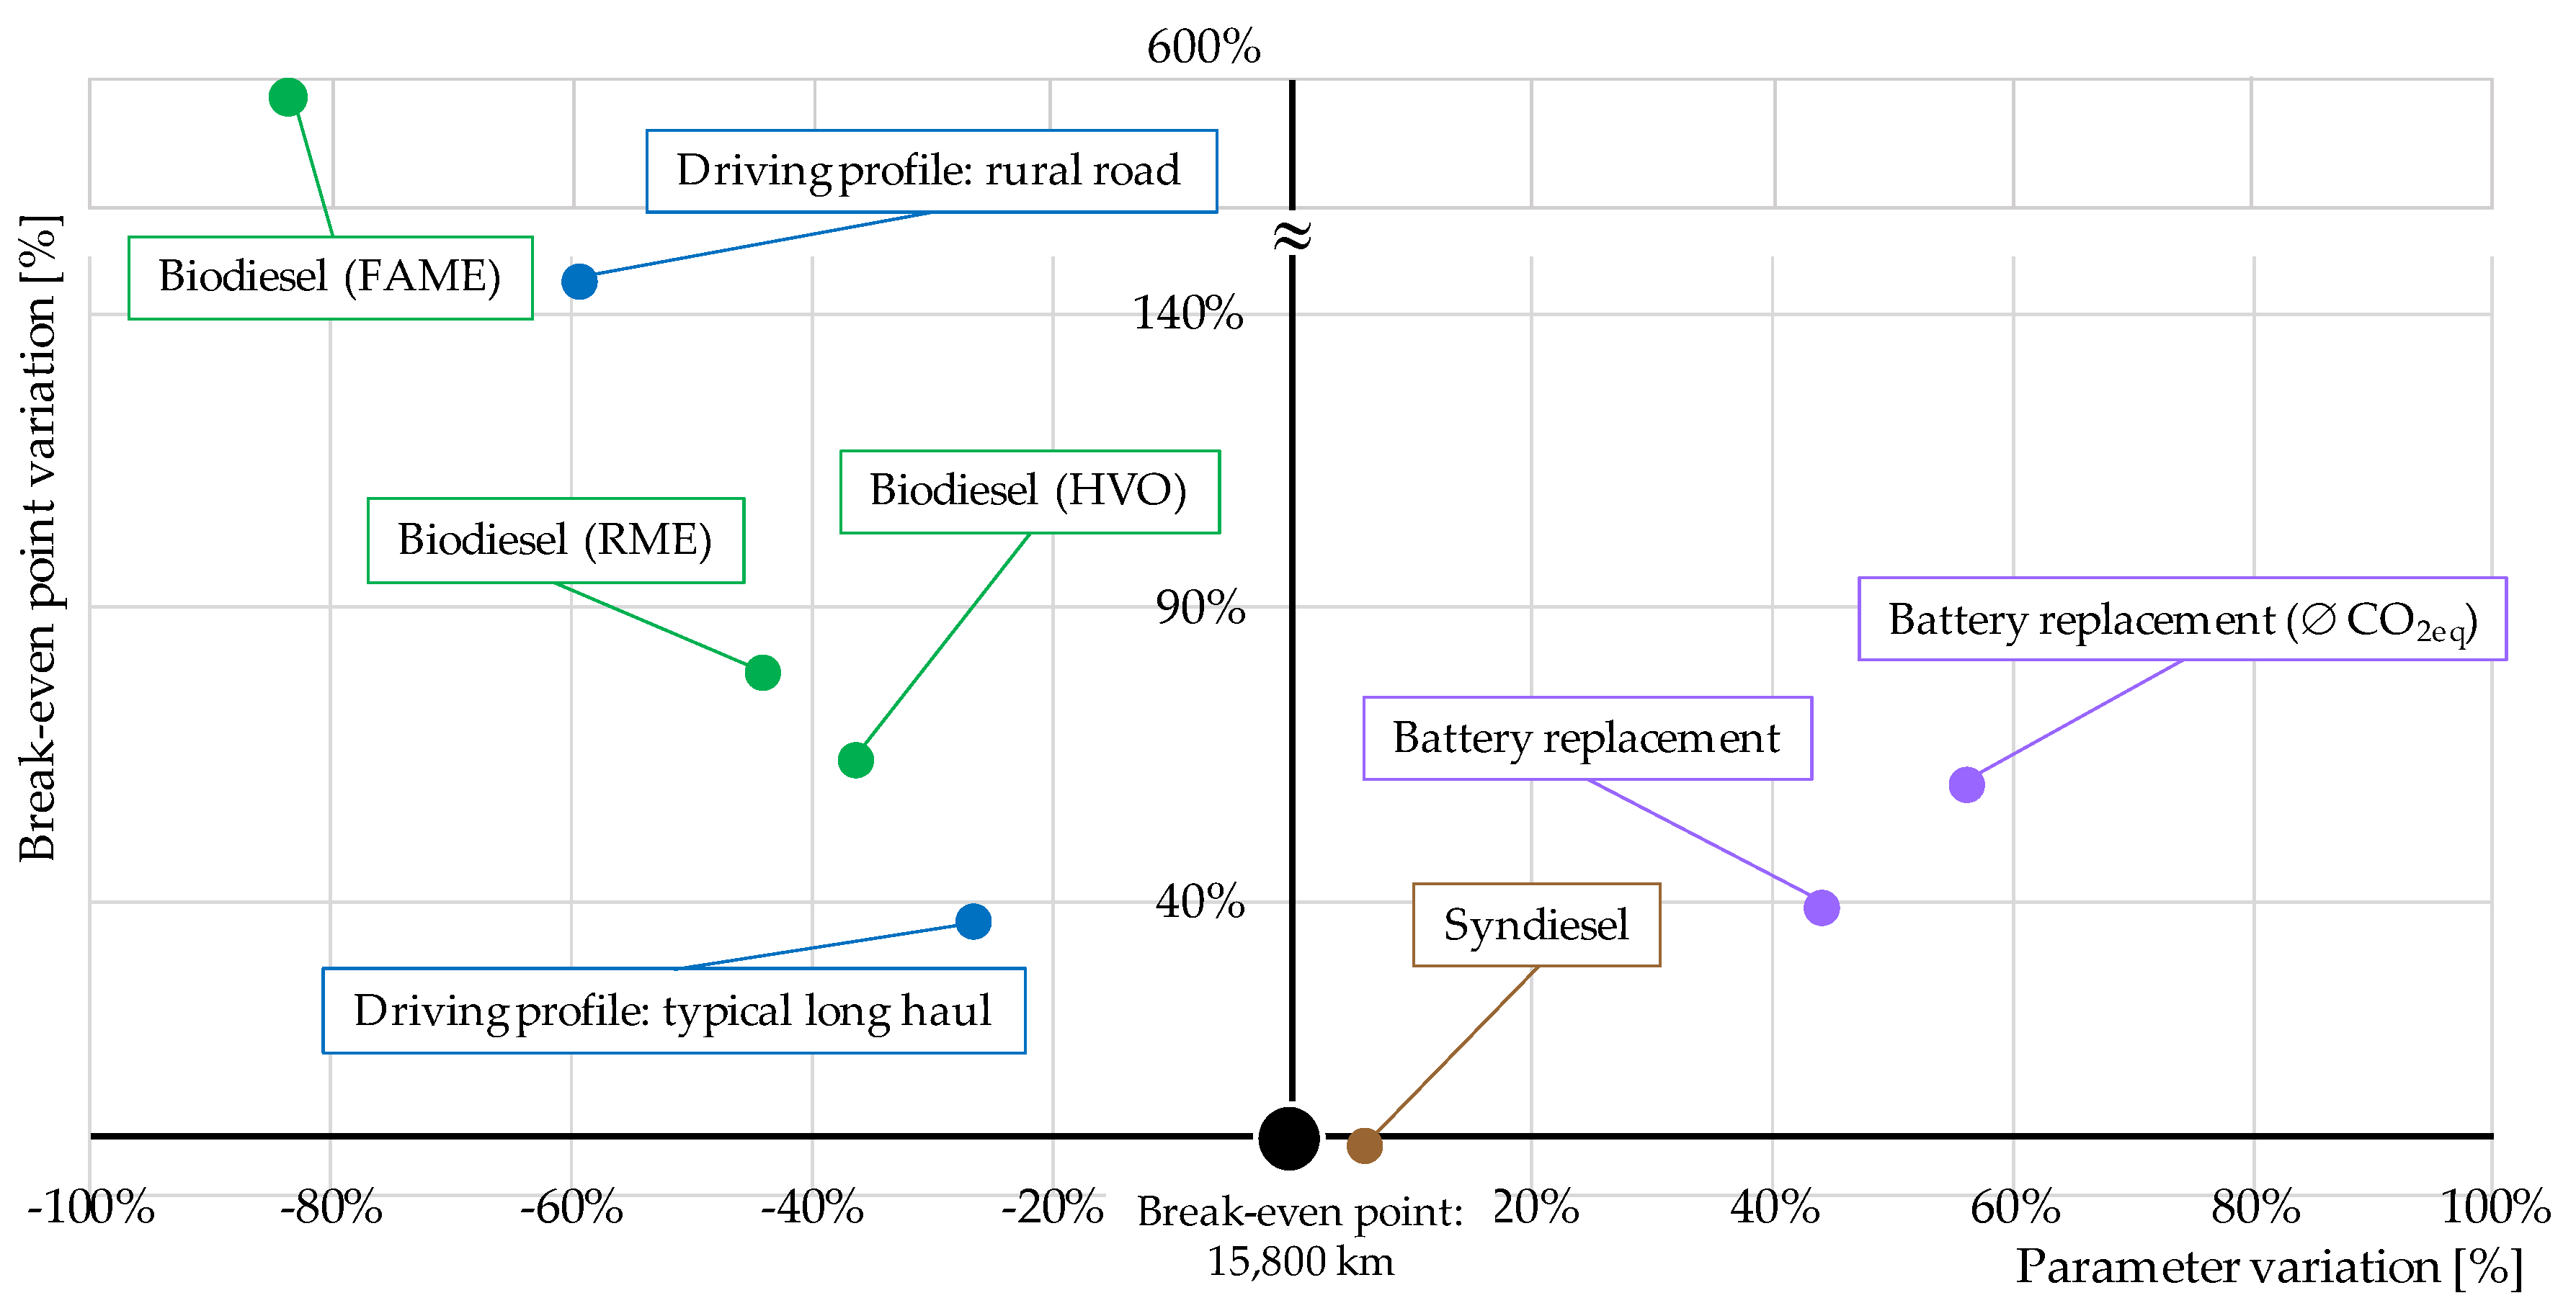
  • At what mileage are the larger environmental burdens due to the production of the hybrid drivetrain compensated compared to the conventional one and which parameters affect the break-even point?
The Mercedes-Benz Actros is selected as a product system equipped with a conventional and a parallel hybrid drivetrain. Both vehicles have a common generic glider (all components are the same except the drivetrain [16]). Therefore, this study is an assessment of the different drivetrain components of ICEV and HEV. The setup of both drivetrains is shown in Figure 1.
The primary function of the system analyzed is to carry a defined cargo throughout its lifetime, which is assumed to be 8 years and 1,040,000 km (according to Reference [17]). The functional unit is chosen to be the transportation of 1-ton cargo over a distance of 1 km. A hilly motorway driving cycle with many acceleration and deceleration sections has been used in this study (see Figure 2).
In contrast to standardized driving cycles as the Heavy Heavy Diesel Duty Truck (HHDDT) schedule, this measured driving profile includes the gradient of the road. This is particularly important for the HEV because the traction battery can only be recharged by recuperation (no charging via plug or load point shift).
Due to the large annual mileage of on-road HDV in long-haul operation, the share of energy demand and CO2eq emission of vehicle use to the overall vehicle life cycle is larger than 90%. In this case, the share of end of vehicle life is relatively small. Therefore, and due to a lack of data, it is omitted in this study. Moreover, the production of infrastructure is excluded because it is assumed to be the same for ICEV and HEV. In summary, the modeled life cycle stages in this study are vehicle production and vehicle use.

2.2. Life Cycle Inventory

The drivetrain production consists of the raw material extraction, production, and assembly of components. Major components in the HEV drivetrain identified as being additional are electric machine, inverter, converter, high voltage cable, lithium ion battery, and power distribution unit. The inventory data base on literature studies existing datasets, research reports, and published information on the vehicle manufacturer. The software openLCA and the datasets of ecoinvent database version 3.3 have been used to model the production of the drivetrain components [18,19].
The use phase is separated into a well-to-tank (WTT) and a tank-to-wheel section (TTW). The production, transportation, and distribution of fuels have been modeled based on results from Reference [20]. Due to the fact that the TTW section has the largest share of CO2eq emissions in HDV life cycles, the calculation of the energy consumption has been simulated in MATLAB/Simulink to generate a precise and applications specific result. The simulation model used for the energy consumption in this paper is a so-called backward simulation (see Figure 3).
This approach reverses the physical causality as it appears in a real vehicle. Based on a velocity profile vcyc (t) of the driving cycle and the vehicle geometry, the forces respectively resistances acting at the vehicle are calculated according to the following equations and Figure 4:
F a i r = 1 2 A c D ρ a i r v c y c 2  
F g r a d e = ( m v + m t ) g sin ( α )  
F r o l l = ( m v + m t ) g cos ( α ) f r  
F a = ( m v e i + m t ) a  
where A is the vehicle frontal area, cD is the air drag coefficient, ρair is the air density, vcyc is the speed, a is the acceleration, g the gravity, α is the road gradient, mv is the vehicle mass, mt is the trailer mass, fr is the coefficient of rolling resistance, and ei is the mass inertia coefficient. Summing up these forces to Ftot at a certain time and speed (operation point) and multiplied by the average wheel radius the required torque TqWHE (t) at the wheels can be determined. This torque was then fed backwards from the wheels via the energy converters to the energy storage systems. To determine the fuel consumption of the vehicle, the efficiency of the gearbox, energy converters, and the electric energy storage system was taken from efficiency curves and maps.
This approach is well suited for the examination of measures to reduce the fuel consumption as well as the design of hybrid control strategies. One of the main advantages is the low computational effort compared to the forward simulation approach. As the dynamics of the powertrain and feedback control problems can be neglected, the backward approach was identified as the optimal approach [21].
The specifications of the examined vehicle are summarized in Table 1. The 40 ton truck features a P2-hybrid architecture, the dead weight of the conventional truck is 18,000 kg, and the maximum load capacity accounts 22 tons.
The dead weight of the HEV is about 500 kg heavier compared to the ICEV due to the additional components of the hybrid system. To ensure comparability in terms of energy consumption of both vehicles, the same payload is assumed. As a result, the HEV exceeds the maximum weight of 40 tons. The reformation of the Council Directive 96/53/EC in 2015 (Directive (EU) 2015/719 of the European Parliament, [25]) allows derogations from the maximum authorized weights and dimensions of alternatively fueled vehicles and vehicle combinations. The disadvantage of the larger tractor mass of alternatively fueled vehicles is compensated by this. However, the additional mass of the HEV is taken into account during vehicle production and converted into CO2eq accordingly (see Section 3).
The hybrid functions of this heavy-duty hybrid truck differ from that implemented in hybrid vehicles with lower gross vehicle weight. De Jong and Bram give an overview of the implemented hybrid modes in a real heavy-duty hybrid vehicle and indicate the fuel reduction potential [26]. The major difference lies in the application of the pure electric mode. This mode is used in passenger cars during low load driving situations where the ICE has a low efficiency. In the P2-heavy-duty hybrid truck, the pure electric mode is only used for maneuvering at distribution centers. Therefore, the electric mode is neglected in the simulation model. In addition to that, the EcoRoll-Mode, as well as the support of the refrigeration trailer by the hybrid system, are neglected. The implemented hybrid control strategy in the simulation model used therefore only applies to a hybrid mode that includes recuperation and boosting. Next to this, the conventional drive (ICE-only) is implemented.
Neither the hybrid control strategy nor the shifting strategy is disclosed in any publication or other source in detail and therefore has to be developed on sensible assumption. The shifting strategy is designed in a way that the operating point of the ICE mostly lies at around 1200–1400 rpm.
The design of the hybrid control strategy includes more rules but also simpler ones. To capture as much braking energy as possible the electric machine (EM) is allowed to operate in overload in the recuperation mode. An I2t counter as presented in Reference [24] is implemented to limit charging current in braking situations. During the propulsion of the vehicle, the EM is working under nominal conditions to lower the load point of the ICE. The electric machine features a maximum efficiency of roughly 94% including the losses of the power electronics. The maximum efficiency of the diesel engine is 46%. In contrast to Reference [24] the hybrid control strategy used in the simulation model for this paper does not feature a predictive function.
The mentioned development of the control strategies for the hybrid powertrain and the gearbox based on literature sources, as well as the usage of the efficiency maps (also based on literature sources), lead to a certain inaccuracy of the simulation results. Nonetheless, the reduction of fuel consumption indicated by the simulation model is in accordance with the published reduction potential [27,28].

3. Results and Discussion

The results of the comparative life cycle analysis show that HEVs have a significant contribution to energy and CO2eq emission reduction. The fuel consumption of the HEV (47.2 L/100 km) is 6.2% lower than that of the ICEV (50.3 L/100km). Referring to the questions defined in Section 2.1, the difference in environmental impact is large. From Figure 5 it can be concluded, that in total the HEV saves about 4.34 t CO2eq per ton of cargo compared to the ICEV over a lifetime. The environmental impact due to the production of the HEV drivetrain components is with 0.07 g CO2eq/t km very small compared to the use phase with 4.41 g CO2eq/t km.
This large share of the use phase on the overall life cycle (about 98%) results from the fact that the annual mileage assumed in this study of 130,000 km is very large. According to Reference [6] passenger cars in Germany drive annually in average about 14,259 km which leads to the fact, that the share of the hybrid drivetrain production on the vehicle life cycle increases despite smaller sized hybrid systems as presented in this paper. This correlation is presented in many studies, e.g., in References [16,29,30,31].
The results of the break-even analysis (Figure 6) indicate that the larger CO2eq emissions resulting from the HEV drivetrain production are compensated at a mileage of about 15,800 km (about 1.5 months) due to the more efficient energy conversion and the capability of energy recuperation.
A sensitivity analysis is conducted to examine the variation of different parameters on the break-even point (Figure 7). The variation of each parameter is represented on the x-axis; the effect of this, the increase or decrease of break-even distance, is shown on the y-axis. The origin represents the break-even point of 15,800 km based on the assumptions presented in Section 2.
First, the effect of using different fuels compared to conventional diesel is studied. Therefore, the difference in well-to-wheel (WTW) emissions for production (WTT) and combustion (TTW) of 1 MJ final fuel are taken into account. Replacing diesel by Syndiesel (brown dot), the primary energy demand increases by 6% and the break-even distance decreases, since the production of Syndiesel is more energy demanding than conventional diesel [20]. Using biodiesel (green dots) instead of conventional diesel leads to an increase of break-even distance. The reduction of WTW emissions by 86% (fatty acid methyl ester [FAME]), 44% (rapeseed methyl ester [RME]), and 36% (hydrotreated vegetable oil [HVO]) shifts the break-even point by 79%, 600%, and 64%, respectively. For these types of biodiesel, it is assumed that during combustion no CO2eq emissions are released [20]. Neglecting this assumption, the primary energy demand for the production of these three biofuels increases, results in a positive parameter variation and a decrease in break-even distance.
The standard conditions for the energy consumption calculation (TTW) are based on a driving cycle with many acceleration and deceleration intervals as well as uphill and downhill sections. These conditions are available in Germany, but these are not standard conditions. Considering different driving cycles (blue dots) reduces the energy savings (parameter variation) by 26% (typical long-haul on the motorway), respectively by 59% (rural road). Taking a driving cycle without hills into account, the fuel consumption of the HEV increases slightly above the level of the ICEV. In this special case, there is no intersection of the ICEV and HEV curve.
Assuming one battery replacement during lifetime (purple dots), the CO2eq emissions released during production increase (parameter variation) by 44% and the break-even point shifts by 39%. Compared to results from References [30,32,33], the specific CO2eq emissions resulting from the battery production (kg CO2eq/kWh) listed in the ecoinvent 3.2 database are relatively small. Taking an average value (Ø CO2eq) into account, the break-even distance is reached at about 25,300 km. Due to the fact that the capacity of the selected battery is relatively small in relation to the vehicle mass, the effect of the replacement on the overall life cycle CO2eq emission is small, as well. Evaluating this, it has to be considered, that this hybrid drivetrain setup has been specially designed for this application (addition of torque, electric motor, and diesel engine acting simultaneously during acceleration phases, no pure electric driving).
The study shows that for all parameter variations the larger CO2eq emissions of the HEV drivetrain production are compensated within the first year of use with exception of Syndiesel and motorways without hills.
Several assumptions were made within this life cycle analysis, which may lead to uncertainties in the results. To model the drivetrain components production, the material composition is linearly scaled by mass because life cycle inventory data for these components are not available. In reality, material composition is not only a function of mass but of several other parameters. Furthermore, the increase in vehicle weight due to the additional hybrid drivetrain components was not taken into account. The overall mass of semitrailer trucks in Germany is limited to 40 tons. By increasing the tractor mass, the transport capacity decreases, and the specific CO2eq emissions per ton increase. However, the amendment of Directive 96/53/EC could offset this disadvantage in favor of alternatively powered vehicles (see Section 2.2).

4. Conclusions

In this study, a comparative life cycle analysis of conventional and hybrid heavy-duty trucks is presented. The large contribution of HDV to greenhouse gas emissions in German traffic offers a large reduction potential. The results confirm this potential: The larger CO2eq emissions due to the production of the HEV drivetrain are already compensated by a better energy conversion efficiency and a well-defined control strategy within the first months of operation at a mileage of 15,800 km. Compared to the ICEV, the HEV saves 4.34 g CO2eq per transported ton and kilometer during use. To examine the effect of different parameter variations on the results, a sensitivity analysis of the break-even point has been conducted. The variation of almost all parameters results in an increase in break-even distance, but the larger HEV production emissions are still compensated within the first year of operation.
Ecologically, the hybrid heavy-duty truck represents a better alternative to conventional vehicles powered by internal combustion engines. However, this positive result is based on a hilly driving profile that benefits the hybrid truck. On a typical motorway trip with constant speed and low gradient, the efficiency advantages of the hybrid drivetrain are significantly smaller than those of the conventional one. In this case, less CO2eq emissions are saved, and the break-even distance increases. To evaluate the hybrid system entirely, other possible applications should be investigated, such as short distance delivery traffic between two warehouses. In how far these systems are economically competitive remains to be examined in future.

Author Contributions

Conceptualization, M.R. and I.K.; Formal analysis, M.R.; Funding acquisition, I.K.; Methodology, M.R. and S.S.; Investigation, M.R. and S.S.; Supervision, I.K.; Visualization, M.R.; Writing - original draft, M.R. and S.S.; Writing - review & editing, M.R. and I.K.

Funding

This research was funded by the Ministry of Innovation, Science, and Research of the State of North Rhine-Westphalia grant number 321-8.03.04.03.-2012/01.

Acknowledgments

This work resulted in significant contributions within the framework of the program “ANFAHRT” (NRW.Forschungskooperationen U & FH) sponsored by the Ministry of Innovation, Science, and Research of the State of North Rhine-Westphalia. The authors thank the Ministry for their generous support.

Conflicts of Interest

The authors declare no conflicts of interest.

References

  1. Federal Ministry for the Environment, Nature Conservation, Building and Nuclear Safety (BMUB). The German Government’s Climate Action Programme 2020: Cabinet Decision of 3 December 2014. Available online: http://www.bmub.bund.de/fileadmin/Daten_BMU/Pools/Broschueren/aktionsprogramm_klimaschutz_2020_broschuere_en_bf.pdf (accessed on 29 August 2016).
  2. Federal Ministry for Economic Affairs and Energy. Energiekonzept für eine Umweltschonende, Zuverlässige und Bezahlbare Energieversorgung. Available online: http://www.bmwi.de/BMWi/Redaktion/PDF/E/energiekonzept-2010,property=pdf,bereich=bmwi2012,sprache=de,rwb=true.pdf (accessed on 29 August 2016).
  3. Nationale Plattform Elektromobilität (NPE). Zweiter Bericht der Nationalen Plattform Elektromobilität. Gemeinsame Geschäftsstelle Elektromobilität der Bundesregierung (GGEMO). Berlin, Germany, 2011. Available online: https://www.erneuerbar-mobil.de/sites/default/files/2016-08/nep%20bericht_emob_2.pdf (accessed on 12 August 2018).
  4. Umweltbundesamt. Entwicklung der Treibhausgasemissionen in Deutschland. Available online: https://www.umweltbundesamt.de/bild/entwicklung-der-treibhausgasemissionen-in (accessed on 29 August 2016).
  5. Kraftfahrt-Bundesamt (KBA). Der Fahrzeugbestand im Überblick am 1. Januar 2013 gegenüber 1. Januar 2012. Available online: http://www.kba.de/DE/Statistik/Fahrzeuge/Bestand/Ueberblick/2013/2013_b_ueberblick_pdf.pdf?__blob=publicationFile&v=4 (accessed on 29 August 2016).
  6. Kraftfahrt-Bundesamt (KBA). 14.259 Kilometer: Die Jährliche Fahrleistung Deutscher Pkw: Erstmals Ergebnisse aus Echtdaten. Available online: https://www.kba.de/SharedDocs/Pressemitteilungen/DE/2015/pm_15_15_jaehrliche_fahrleistung_deutscher_pkw_pdf.pdf?__blob=publicationFile&v=5 (accessed on 27 April 2016).
  7. Kraftfahrt-Bundesamt (KBA). Fahrzeugzulassungen (FZ): Neuzulassungen von Kraftfahrzeugen Nach Umwelt-Merkmalen Jahr 2012. Available online: http://www.kba.de/SharedDocs/Publikationen/DE/Statistik/Fahrzeuge/FZ/2015/fz14_2015_pdf.pdf?__blob=publicationFile&v=3 (accessed on 31 August 2016).
  8. Frank Dünnebeil, Carsten Reinhard, Udo Lambrecht, Antonius Kies, Stefan Hausberger, Martin Rexeis. Zukünftige Maßnahmen zur Kraftstoffeinsparung und Treibhausgasminderung bei schweren Nutzfahrzeugen. Umweltbundesamt: Dessau-Roßlau, Germany, 2015. Available online: https://www.umweltbundesamt.de/sites/default/files/medien/378/publikationen/texte_32_2015_kraftstoffeinsparung_bei_nutzfahrzeugen.pdf (accessed on 31 August 2016).
  9. Kraftfahrt-Bundesamt (KBA). Fahrzeugzulassungen (FZ): Bestand an Kraftfahrzeugen nach Umwelt-Merkmalen 1. Januar 2015. Available online: https://www.kba.de/SharedDocs/Publikationen/DE/Statistik/Fahrzeuge/FZ/2015/fz13_2015_pdf.pdf?__blob=publicationFile&v=4 (accessed on 31 August 2016).
  10. Marques, G.G.; Alves, M.F.; Krinke, S.; Koffler, C. Life Cycle Thinking in the Brazilian Automotive Industry; SAE International: Troy, MI, USA, 2008. [Google Scholar]
  11. Gaines, L.; Stodolsky, F.; Cuenca, R. Lifecycle-Analysis for Heavy Vehicles; Air and Waste Management Association: Pittsburgh, PA, USA, 1998. [Google Scholar]
  12. Rose, L.; Hussain, M.; Ahmed, S.; Malek, K.; Costanzo, R.; Kjeang, E. A comparative life cycle assessment of diesel and compressed natural gas powered refuse collection vehicles in a Canadian city. Energy Policy 2013, 52, 453–461. [Google Scholar] [CrossRef]
  13. Nam, S.K.; Bert, V.W. Assessment of CO2 emissions for truck-only and rail-based intermodal freight systems in Europe. Transport. Plan. Technol. 2009, 32, 313–333. [Google Scholar]
  14. Baumann, H.; Tillmann, A.-M. The Hitch Hiker’s Guide to LCA: An. Orientation in Life Cycle Assessment Methodology and Application; Studentlitteratur: Lund, Sweden, 2004. [Google Scholar]
  15. International Organization for Standardization. Environmental Managemen—Life Cycle Assessment—Principles and Framework; ISO: Geneva, Switzerland, 2006. [Google Scholar]
  16. Notter, D.A; Gauch, M.; Widmer, R.; Wager, P.; Stamp, A.; Zah, R.; Althaus, H.-J. Contribution of Li-ion batteries to the environmental impact of electric vehicles. Environ. Sci. Technol. 2010, 44, 6550–6556. [Google Scholar] [CrossRef] [PubMed]
  17. Law, K.; Jackson, M.D.; Chan, M. European Union Greenhouse Gas Reduction Potential for Heavy-Duty Vehicles; The International Council on Clean Transportation: San Francisco, CA, USA, 2011. [Google Scholar]
  18. GreenDelta GmbH. OpenLCA; GreenDelta GmbH: Berlin, Germany, 2016. [Google Scholar]
  19. Wernet, G.; Bauer, C.; Steubing, B.; Reinhard, J.; Moreno-Ruiz, E.; Weidema, B. The ecoinvent database version 3 (part I): overview and methodology. Int. J. Life Cycle Assess. 2016, 21, 1218–1230. [Google Scholar] [CrossRef]
  20. Edwards, R.; Larivé, J.-F.; Rickeard, D.; Weindorf, W. Well-to-Wheels Version 4.0: Tank-to-Wheels (TTW); Well-to-Wheels Analysis of Future Automotive Fuels and Powertrains in the European Context; Publication Office of the European Union: Luxembourg, 2013. [Google Scholar]
  21. Guzzella, L.; Sciarretta, A. Vehicle Propulsion Systems: Introduction to Modeling and Optimization; Springer: Berlin, Germany, 2013. [Google Scholar]
  22. Wallner, S.; Lamke, M.; Mohr, M.; Sedlacek, M.; Speck, F.D. Hybrid Plattform: Wirtschaftlicher Hybridantrieb für Nutzfahrzeuge. In Proceedings of the 32nd International Vienna Motor Symposium, Vienna, Austria, 5–6 May 2011; pp. 244–262. [Google Scholar]
  23. Frank, Z. Hybridlösung für Schwere LKW. Available online: https://www.eurotransport.de/news/zf-friedrichshafen-hybridloesung-fuer-schwere-lkw-629341.html (accessed on 11 June 2018).
  24. Sonntag, M.; Sawodny, O.; Kauffmann, F.; Gehring, O. Vorausschauendes HV-Batteriemanagement für E-Hybrid LKW im Fernverkehr. In Proceedings of the 6. VDI/VDE-Fachtagung Steuerung und Regelung von Fahrzeugen und Motoren, Baden-Baden, Germany, 5–6 June 2013; pp. 69–80. [Google Scholar]
  25. The European Parliament and the Council of the European Union. Directive (eu) 2015/719 of the European Parliament and of the Council of 29 April 2015 Amending Council Directive 96/53/EC Laying down for Certain Road Vehicles Circulating within the Community the Maximum Authorised Dimensions in National and International Traffic and the Maximum Authorised Weights in International traffic; The European Parliament and the Council of the European Union: Brussels, Belgium, 2015. [Google Scholar]
  26. De Jong, A.J.; Bram, I. Technology for a Heavy-Duty Hybrid Business-Case. In Proceedings of the 23rd Aachen Colloquium Automobile and Engine Technology 2014, Aachen, Germany, 6–8 October 2014; pp. 629–636. [Google Scholar]
  27. Thomas, W.; Frank, D. TraXon Hybrid Macht Fernverkehr Noch Wirtschaftlicher. Available online: http://www.zf.com/media/media/de/document/corporate_2/press_3/press_kits_1/2012_iaa_1/txIAA12_3_TraXon-Hybrid_d.pdf (accessed on 13 June 2014).
  28. Andreas, L. Fernverkehr der Zukunft: IAA-Premiere des Concept MAN TGX Hybrid. Im Fernverkehr liegt weiterhin großes CO2-Einsparpotenzial Im Fernverkehr liegt weiterhin großes CO2-Einsparpotenzial. Available online: https://www.truck.man.eu/man/media/de/content_medien/doc/entry_page_germany_1/presse_und_medien_4/140926_MAN_SE_IAA_TGX_Hybrid.pdf (accessed on 14 May 2017).
  29. Hongrui, M.; Felix, B.; Nigel, T.; Xavier, R.-P.; Andrew, H. A new comparison between the life cycle greenhouse gas emissions of battery electric vehicles and internal combustion vehicles. Energy Policy 2012, 44, 160–173. [Google Scholar]
  30. Samaras, C.; Meisterling, K. Life Cycle Assessment of Greenhouse Gas Emissions from Plug-in Hybrid Vehicles: Implications for Policy. Environ. Sci. Technol. 2008, 42, 3170–3176. [Google Scholar] [CrossRef] [PubMed] [Green Version]
  31. Hawkins, T.R.; Singh, B.; Majeau-Bettez, G.; Strømman, A.H. Comparative Environmental Life Cycle Assessment of Conventional and Electric Vehicles. J. Ind. Ecol. 2013, 17, 53–64. [Google Scholar] [CrossRef]
  32. Michael, H. Current LCA Results and Need for Further Research. Fraunhofer System Research for E-Mobility (FSEM). Echterdingen, Germany, 2011. Available online: http://www.lcaforum.ch/portals/0/df43/DF43-01%20Michael%20Held.pdf (accessed on 24 February 2017).
  33. Rolf, F. Umweltaspekte von Elektroautos Ein Argumentarium; Bundesamt für Umwelt BAFU: Uster, Swiss, 2012; Available online: http://esu-services.ch/fileadmin/download/frischknecht-2012-Umweltaskpekte-Elektroautos.pdf (accessed on 16 June 2018).
Figure 1. The product system studied.
Wevj 09 00033 g001
Figure 2. Real-world driving cycle.
Wevj 09 00033 g002
Figure 3. Backward simulation approach.
Wevj 09 00033 g003
Figure 4. Driving resistances acting at the truck.
Wevj 09 00033 g004
Figure 5. CO2eq emission reduction potential of hybrid electric vehicle (HEV) compared to internal combustion engine vehicle (ICEV).
Wevj 09 00033 g005
Figure 6. Break-even analysis (ICEV vs. HEV).
Wevj 09 00033 g006
Figure 7. Sensitivity analysis of break-even distance.
Wevj 09 00033 g007
Table 1. Technical specifications powertrain [22,23,24].
ComponentSpecification
Diesel engineVH = 12.8 L; Pmax = 330 kW @ 1800 rpm
Gearbox12-gear; Automated Manual Transmission 14.929-1.0
Electric machinePN = 70 kW @ 1000 rpm; Pmax = 120 kW
BatteryLi-Ion; 2.5 kWh usable

