1. Introduction
The energy market is changing to alternative energies and the automobile industry is changing to electric vehicles. Both new markets use battery systems consisting of multiple cells connected in parallel and series. Connecting the cells causes them to interact with each other by means of charge transference. To understand the interactions between cells in a system, measurements and dynamic battery pack simulations have to be carried out. Consequently, the reasons and the consequences of the interactions have to be considered. The reasons are inhomogeneities caused by production differences and/or current/temperature distributions in a battery system which influence the performance of the pack or module. To counter the differences in production an approach for sorting the cells by the internal resistance or nominal capacity before the configuration of the pack was suggested by Fuqiang An et al. [
1]. Current distributions in parallel connections needs to be considered [
2] also how it effects ageing compared to the ageing of a single cell [
3]. The inhomogeneities which lead to these current distributions are the mechanical connections (welding, soldering, pressing) of the cells on to the conductor, the influence of different cell capacities and internal resistances and the position of the plus and minus poles of the battery also has an influence on the system.
Typical battery systems are series connected parallel strings, where the terminals of a parallel string is at the plus and minus poles of the first cell in the string or at the plus pole of the first cell and at the minus pole of the last cell in the string. Using this kind of connection and the assumption that the voltages of the cells are exactly the same in a parallel string, it is possible to minimize the measurement effort to a single current measurement of the whole pack or module and one voltage measurement for each parallel string in the pack. Therefore the current distribution is neglected and the battery management system is unable to identify the consequences for the single cell. Neglecting the current distribution could lead to an inaccurate estimation of different states of the parallel connection since the current through a cell influences the estimated capacity, the impedance parameters and therefore the state of charge, the state of health and the state of available power [
4]. It leads to the neglection of the parameter variations of the cells as well, which leads to a variation of the ageing as described by [
5].
To analyse and understand the behaviour and consequences of the pack design and cell location, many measurements and simulations could be conducted. Some researches have been conducted. For example Long Zhou, et al. [
6], studied parameter variations in battery packs consisting of series connected cells. They varied the initial capacity, the initial SOC, the initial resistance, the initial temperature, the capacity decay, the internal resistance growth, the self-discharge rate and the coulombic efficiency in their simulation and tested two in series connected cells, where each cell was in its own climate chamber. Another work by M. Mathew, et al. [
7], considered the replacement of modules in a battery pack for electric vehicles and investigated the influences in the series connected modules. The paper by Gregory L. Plett, et al. [
8], investigated the simulation of battery packs in series and parallel connections with different initial conditions.
This paper deals with different positions of the cells in a parallel connection. So cells with outlying nominal capacities and internal resistances are positioned at specific points in the connection to accomplish an expected behaviour of the system. Also, the position of the plus and minus terminals of the pack in the parallel connection are changed. Afterwards the simulations are used to clarify and explain the observed results of the measurements, because in the case of the simulation it is possible to observe a specific inhomogeneity. The following chapters deal with the modeling of the pack, the measurements, its results and the simulation and its results, followed by a conclusion.
2. Battery Pack Modelling
The state of the art in electrical battery pack modeling extends from single cell models extrapolated for packs to single cell models for each cell of the pack. The pack models based on a single cell model differ in how the actual functionality and parameters of the pack model is estimated. There are pack models which aggregate single cell models and their behaviour by simply calculating the pack model parameters based on the configuration of the pack without considering cell variations and thermal imbalance. Other pack models based on single cell models use the information of the capacity and internal resistance variations of the cells to calculate a more specific pack model [
9]. Another approach based on single cell models is to identify the parameters directly from a build battery pack [
10]. These approaches could consider parameter variations between cells but they do not model each single cell, which means that it is not possible to estimate the performance of a single cell in the pack and its specific state.
To investigate the behaviour of single cells in a pack it is required to model every cell in the pack, depending on the aim of the investigation the model of a single cell has to include an electrical, an ageing or a thermal model. This work investigates the influences of variations of capacities and internal resistances in a short term and therefore an electrical model is needed to simulate the dynamic behaviour resulting from the variations. Bruen et al. [
11] suggested a model which is modeling the pack using equivalent circuit models for every cell single cell combined in a state space model for a parallel connection only. Modeling a battery pack in the state space leads to fast simulations without losing too much information. Every single cell is modelled by an equivalent circuit model with an inner resistance and up to
n RC-Elements. The proposed model of Bruen et al. is extended to be able to simulate series connections and different terminal positions as well as it has an additional entry for the terminal voltage of the whole parallel connection.
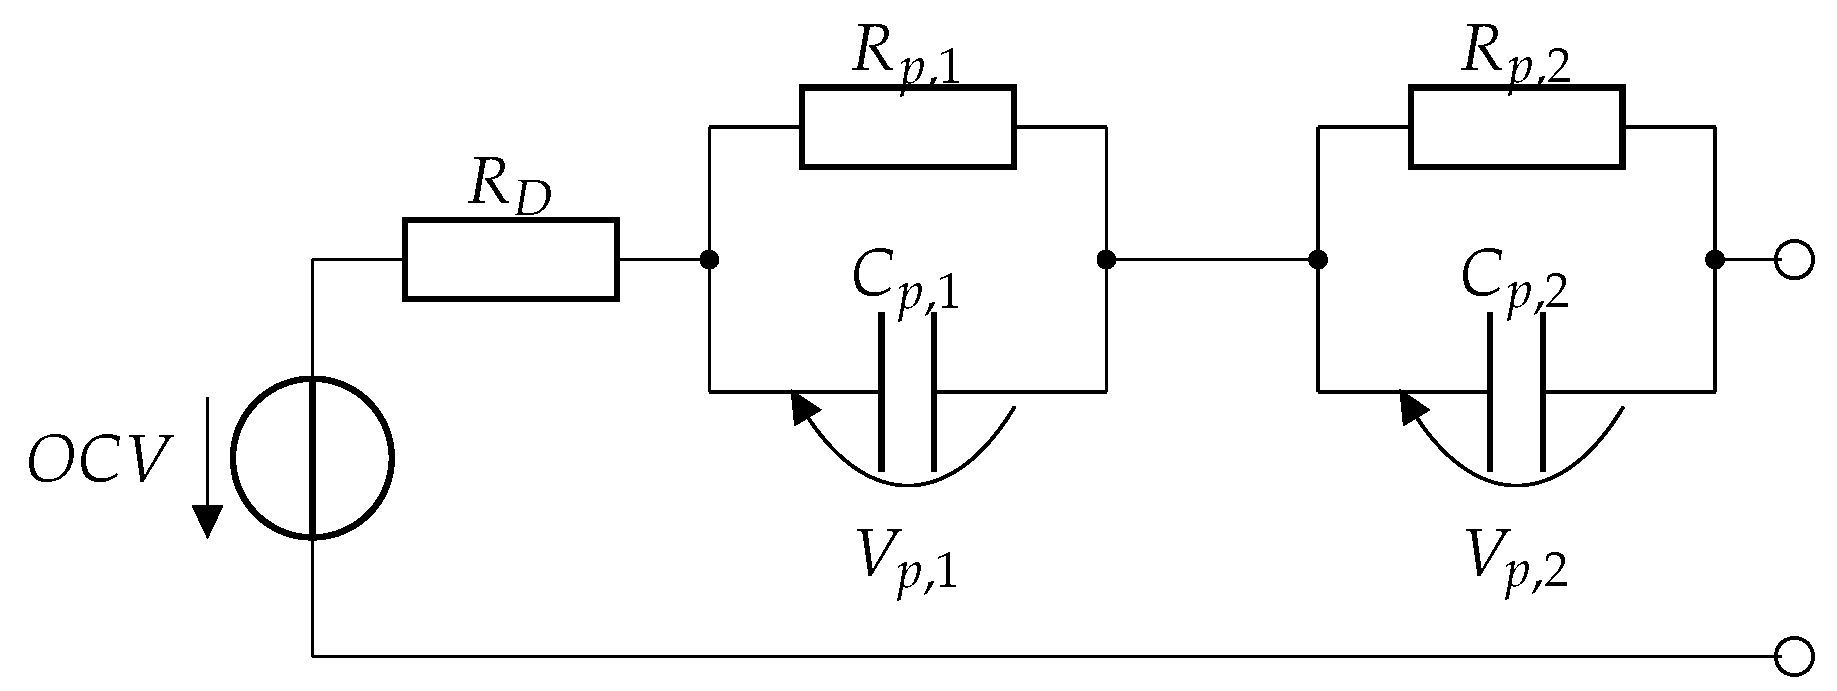
The cell model used in this paper is shown in
Figure 1 and consists of a voltage source for the open circuit voltage, a series resistor for the battery internal resistance and RC parallel elements for the dynamic behaviour.
Its state space representation is shown in Formulas (
3) to (
4), which is given by [
11]. The general form of a state space model is given by Formulas (
1) and (
2).
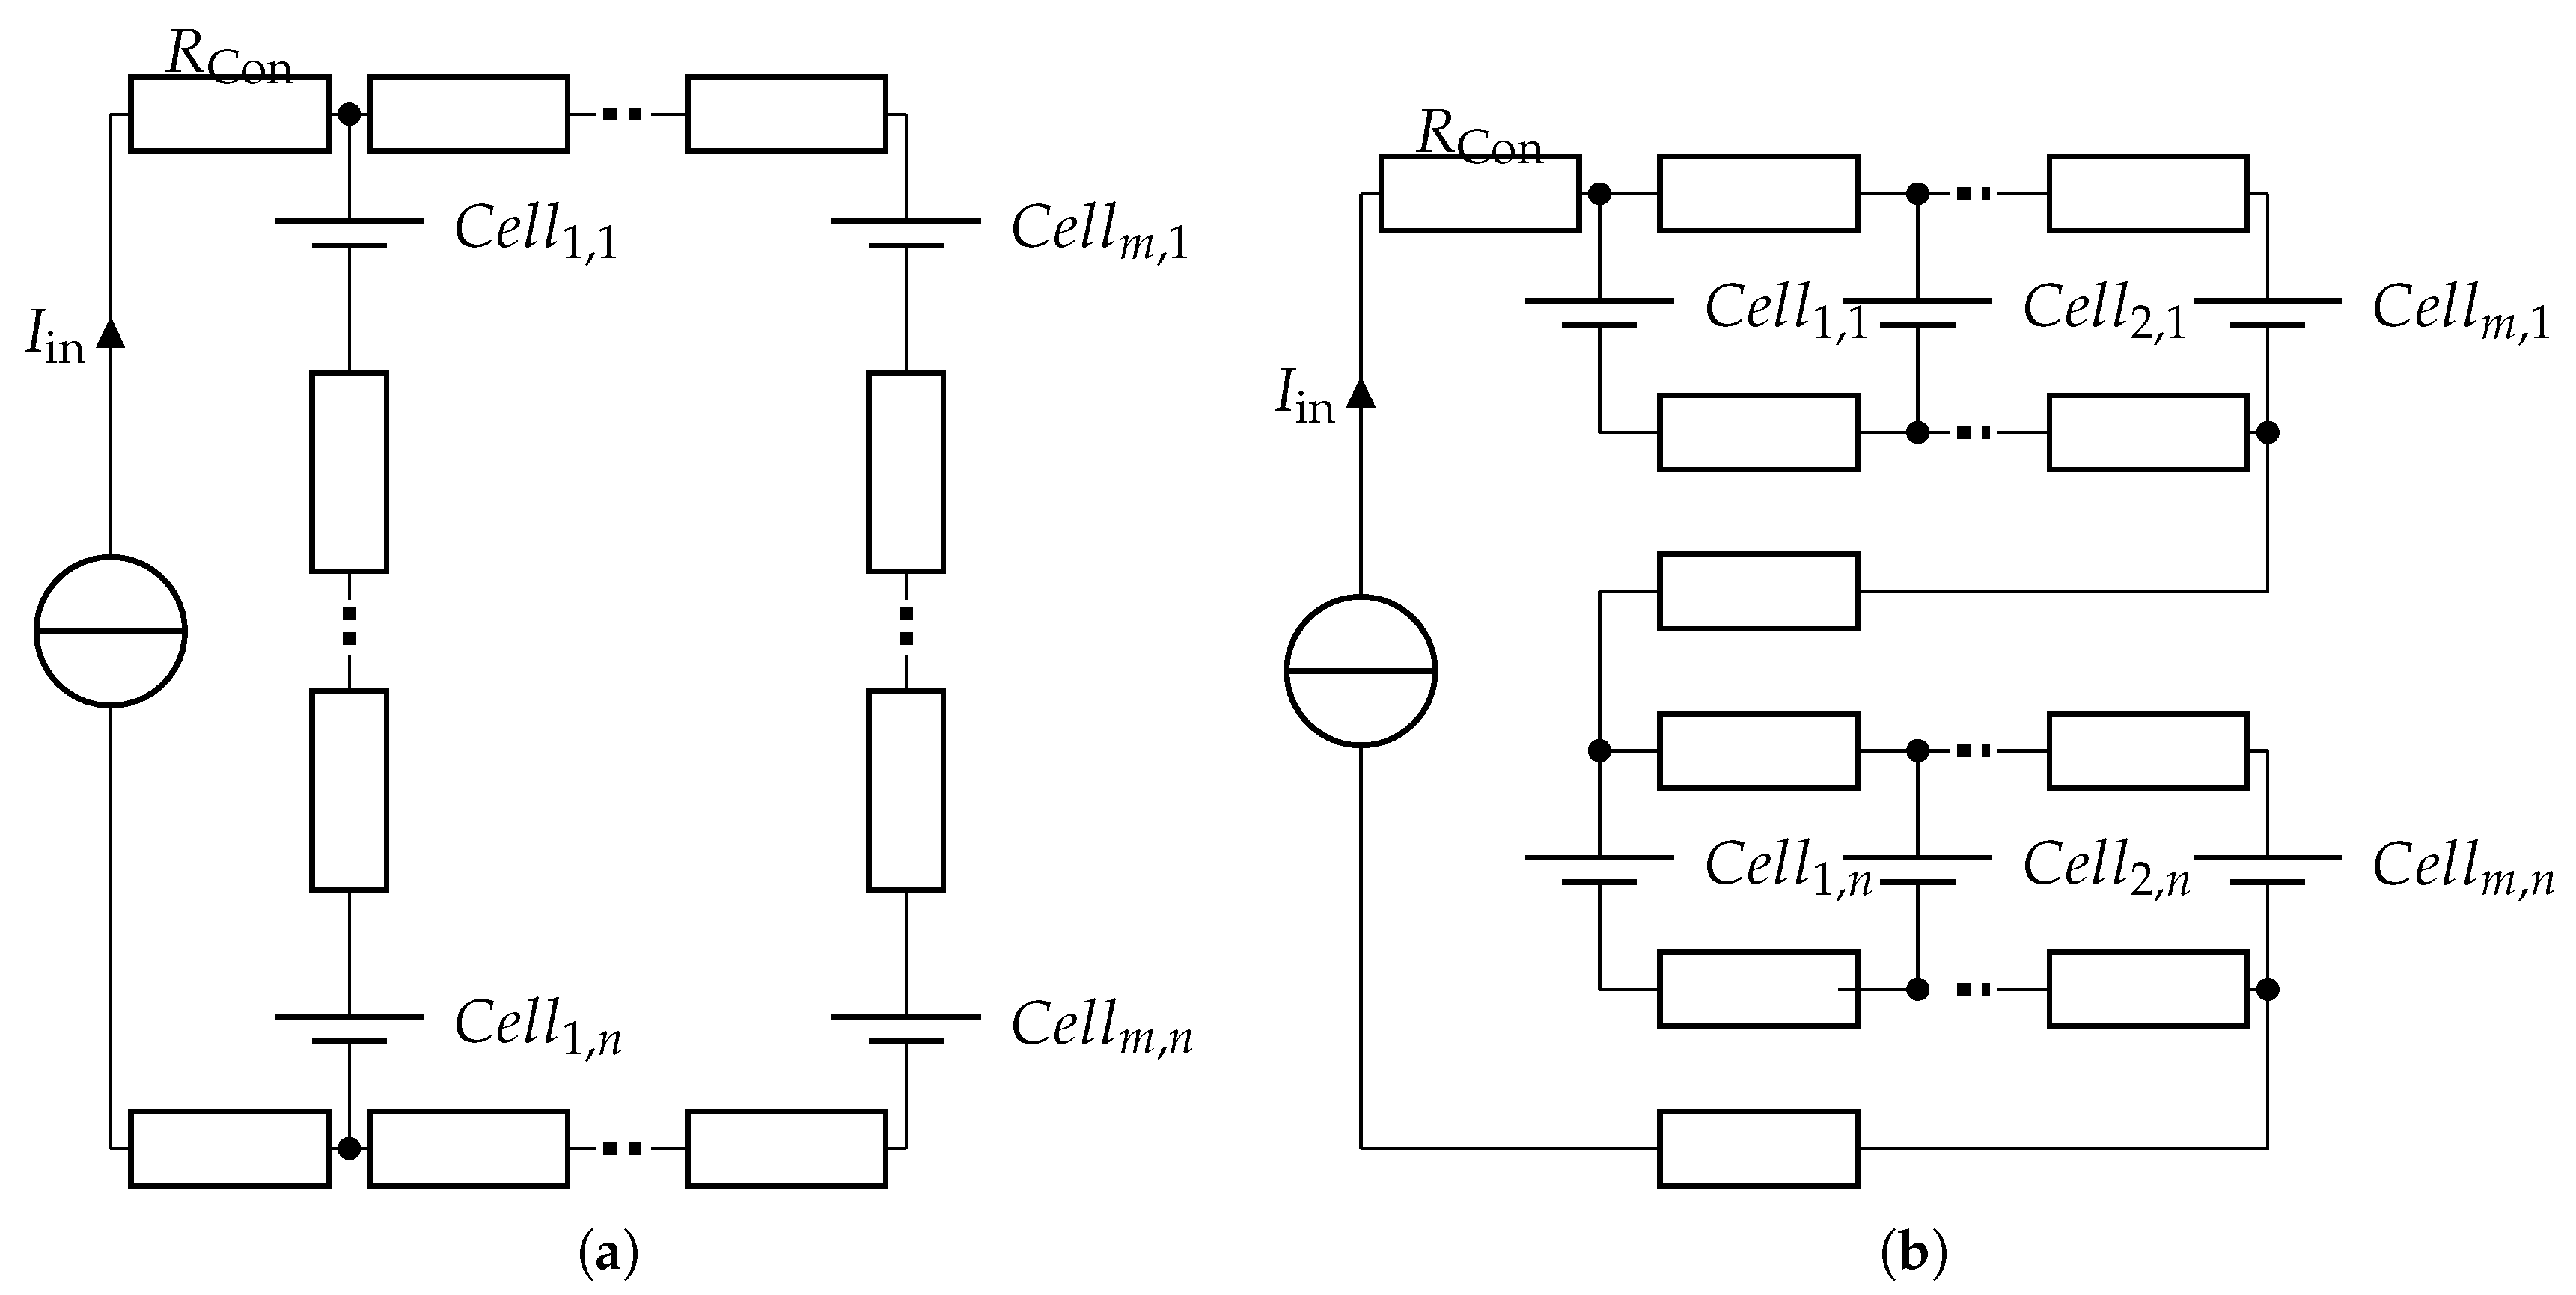
These cells can be connected in different arrangements which leads to different behaviour of the battery pack. They could be arranged in a four series with two parallel strings (i.e.,
Figure 2a) or with two parallel cells connected four times in series and any other number of cells (i.e.,
Figure 2b).
Often a connection of parallel strings in series is used, because the cells are balancing each other in parallel strings without an additional balancing system. Also the location of the plus and minus poles are important for the behaviour of the system. Using the networks of a parallel string, the meshes and knots are calculated and lead to the matrices A, B, C and D of the state space model. The scheme is given by Bruen et al. [
11] and leads to the following state space model, which is adjusted such that the terminal voltage of a parallel cell string could differ from the voltage of the first cell and all cell voltages are included in the output vector. So the matrices A, B, C and D are mostly diagonal matrices of the matrices of a single cell.
The interaction of the parallel connected cells is included in the calculation of the cell currents, which is influenced by the voltages of the cells and the voltage drops over the connection resistances. As shown by Bruen et al. the cell current could be calculated by using the voltage loops for a parallel connection.
These voltage loops are then rearranged for a matrix form. This leads to three new matrices, the resistance matrix
R, the state dependency matrix
E and input dependency matrix
F. The result should take the form of Equation (
7), where
are the currents through the connection resistances and
is the input current for the parallel connection.
This form and the voltage loops lead to the following matrices.
By using the voltage loops in matrix form and inverting the matrix
R, it is possible to solve Kirchhoff’s Current Law for the cell currents
in matrix form. Therefore, the current translation matrix
G as described by Bruen et al. is introduced.
These calculations lead to the new extended state space model
The model was explained for a parallel string, where the terminals of the parallel strings are at the first cell. The connection of the terminals influences the overall behaviour as well. Different connections of the terminals could be implemented with the model, too, by modifying the D matrix and the calculation of the cell currents, because the location of connection resistances changes the R matrix. The D and the R matrix in case of the terminals being at the plus pole of the first cell and the minus pole of the last cell take the following form.
To represent battery packs with series connected parallel strings the matrices of the parallel connected cells are concatenated in diagonal matrices to form the whole system. This leads to a model of a battery system with multiple layers consisting of the cell model, parallel string and the whole system. So the concatenation of the parallel strings results also in a diagonal matrix as shown in the following equations, where the index ps indicates one parallel string. The matrices to calculate the cell currents are concatenated in the same manner.
Characterization and Parameterization
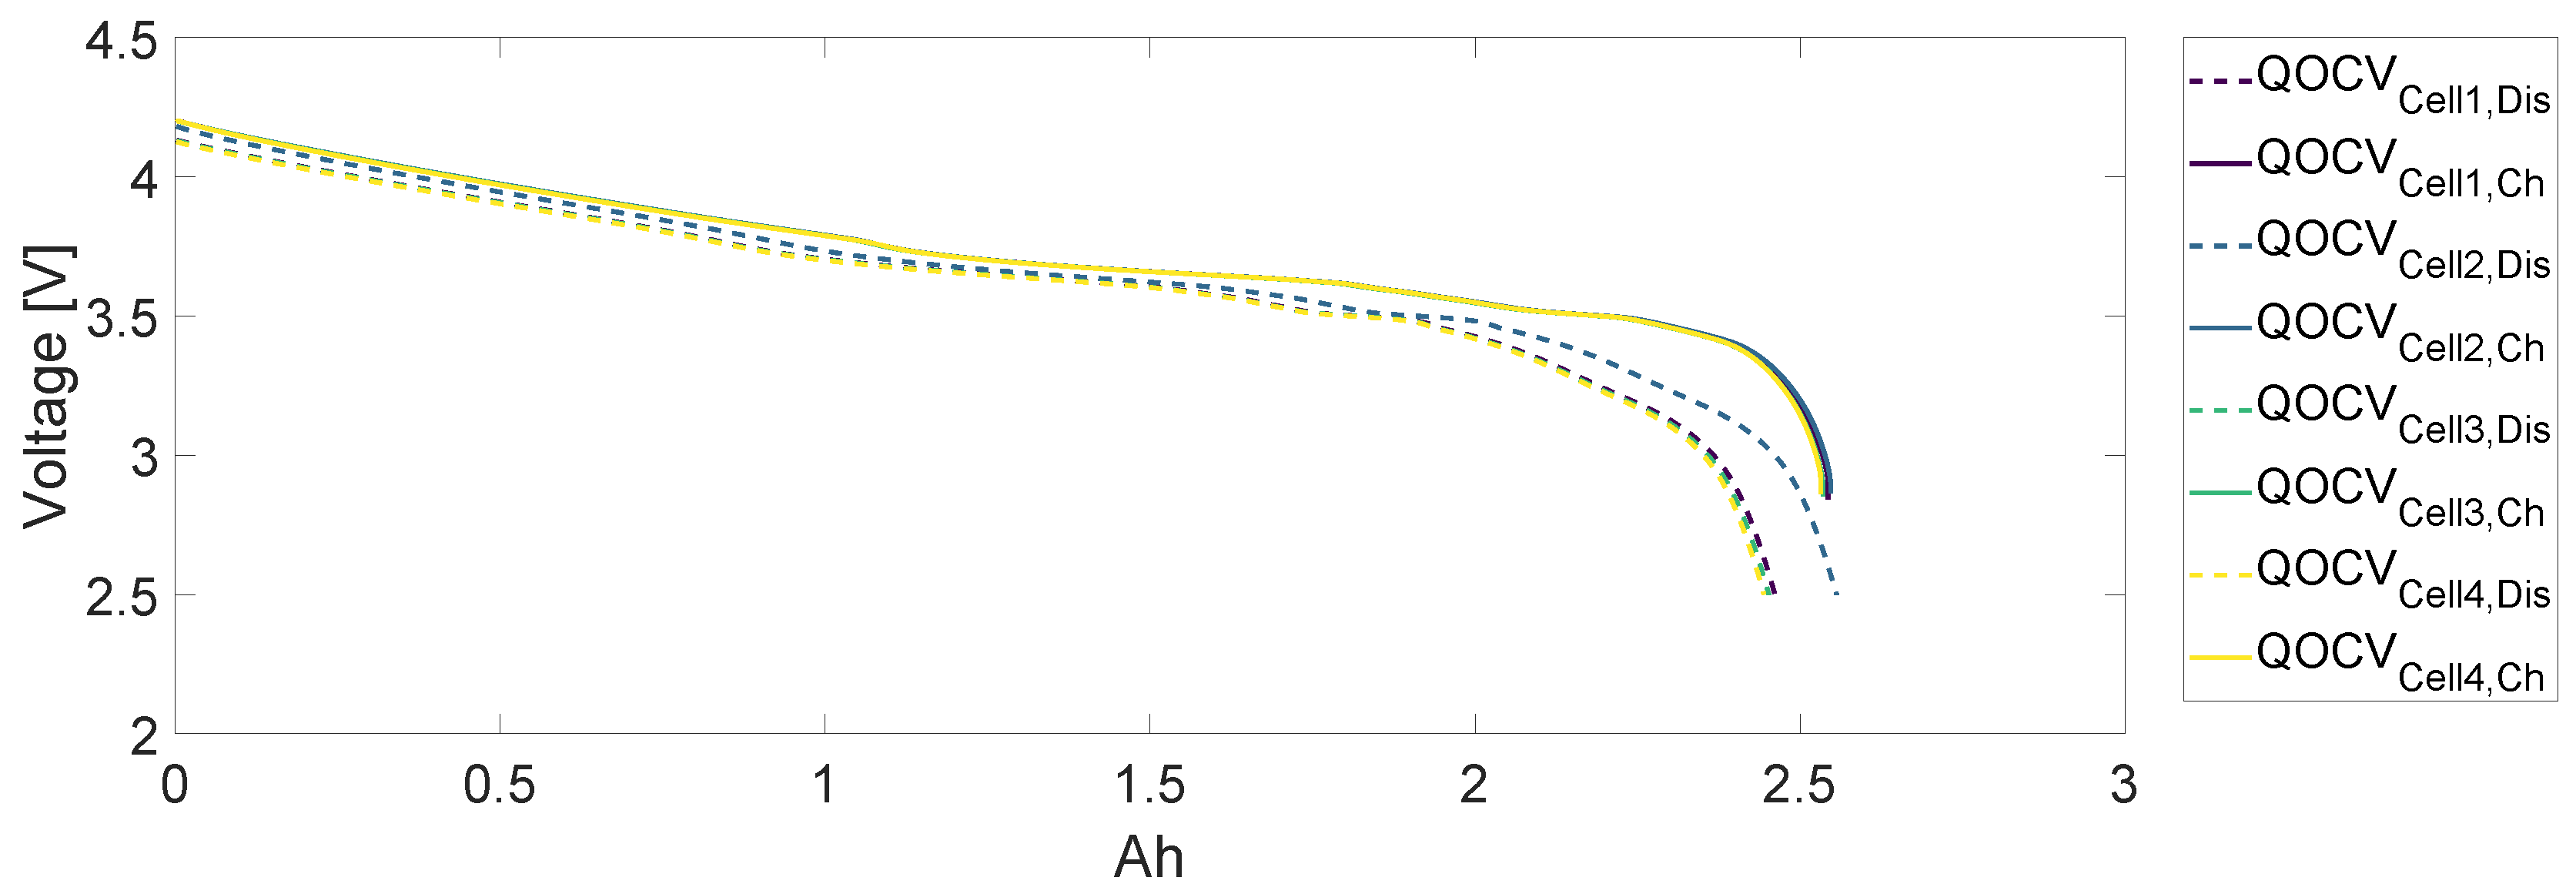
The described model had to be parameterized and therefore the cells have to be characterized and tested to generate the profiles to parameterize the battery model. By conducting a quasi open circuit voltage (QOCV) measurement the capacity could be calculated and the measurement result could be used as characteristic map for the cell models. The cells were at first discharged and then charged with a current of
.
Figure 3 depicts some example results of the QOCV measurement.
The measurementents show varations in the internal resistance and the capacity (see
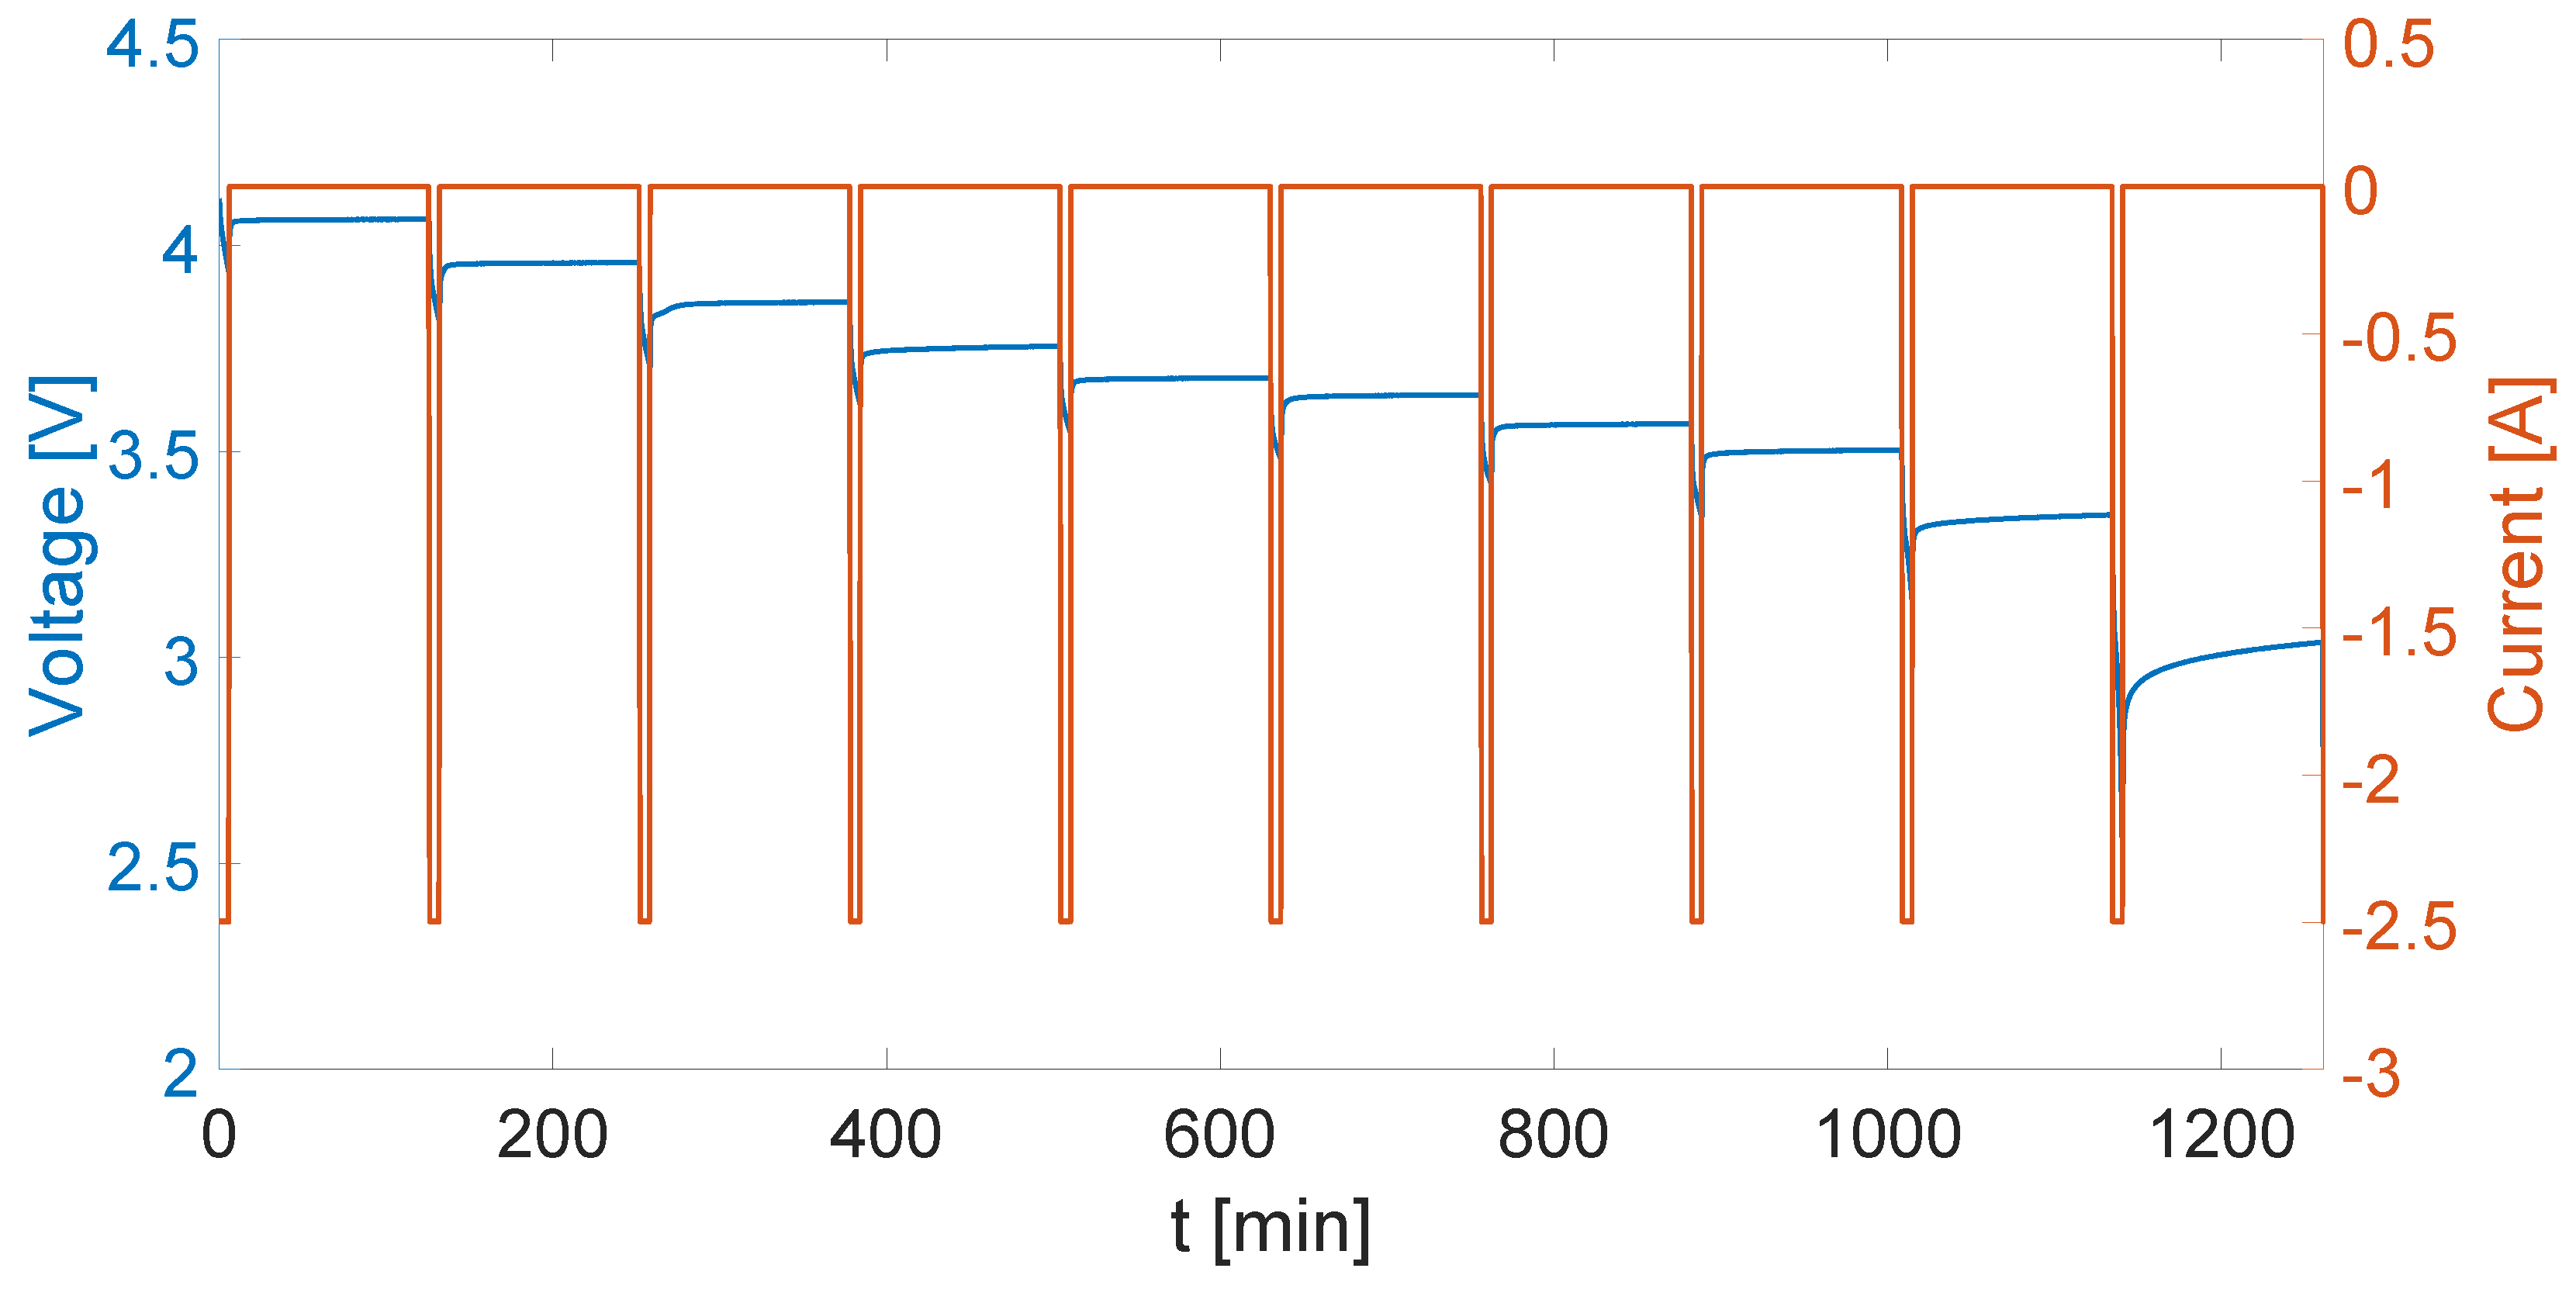
Table 1). There is also one outlier when the QOCV is considered. At this point it has to be mentioned that the cells are all new and appear to exhibit production quality variations, perhaps even flaws. This is a perfect example of how production tolerances can vary. Each battery system can suffer under the production tolerances of the single cells, which lead to slightly different capacities and internal resistances. To parameterize the cell models additional tests were carried out. The cells were charged and discharged in 10% steps of the state of charge (SOC). After the charge or discharge steps there were two hours of relaxation. These relaxations of the voltage were used to identify the parameters for a cell model consisting of an internal resistance and two RC parallel elements. An example pulsed discharge profile is depicted in
Figure 4. The relaxation parts were extracted and fitted using a Nelder-Mead algorithm to identify the models parameters.
To accomplish a successful fitting, the start-parameters of the fittings were calculated for each relaxation by identifying the different areas for the internal resistance and the RC parallel elements. The internal resistances is directly calculated from the relationship
where the voltage and current difference was calculated after about 20 ms after the start of the relaxation. Because of the kind of the internal resistance calculation the internal resistance represents parts of the charge transfer resistance. By subtracting the voltage drop across the internal resistance and the OCV the remaining voltage is the voltage across the RC parallel elements. Thus the voltage was divided into different parts which should be represented by the RCs. Therefore the resistances can be calculated and the time constant can be determined.
Table 1 sums up the mean internal resistances across the different SOCs and capacities of the 8 cells. Now there are only the connection resistances left to complete the model. The connection parameters where measured using a HIOKI BT3554 Battery Tester which applies a 2 kHz sinussoidal current to conduct an impedance measurement. The resistances for the connections are about 2 m
.
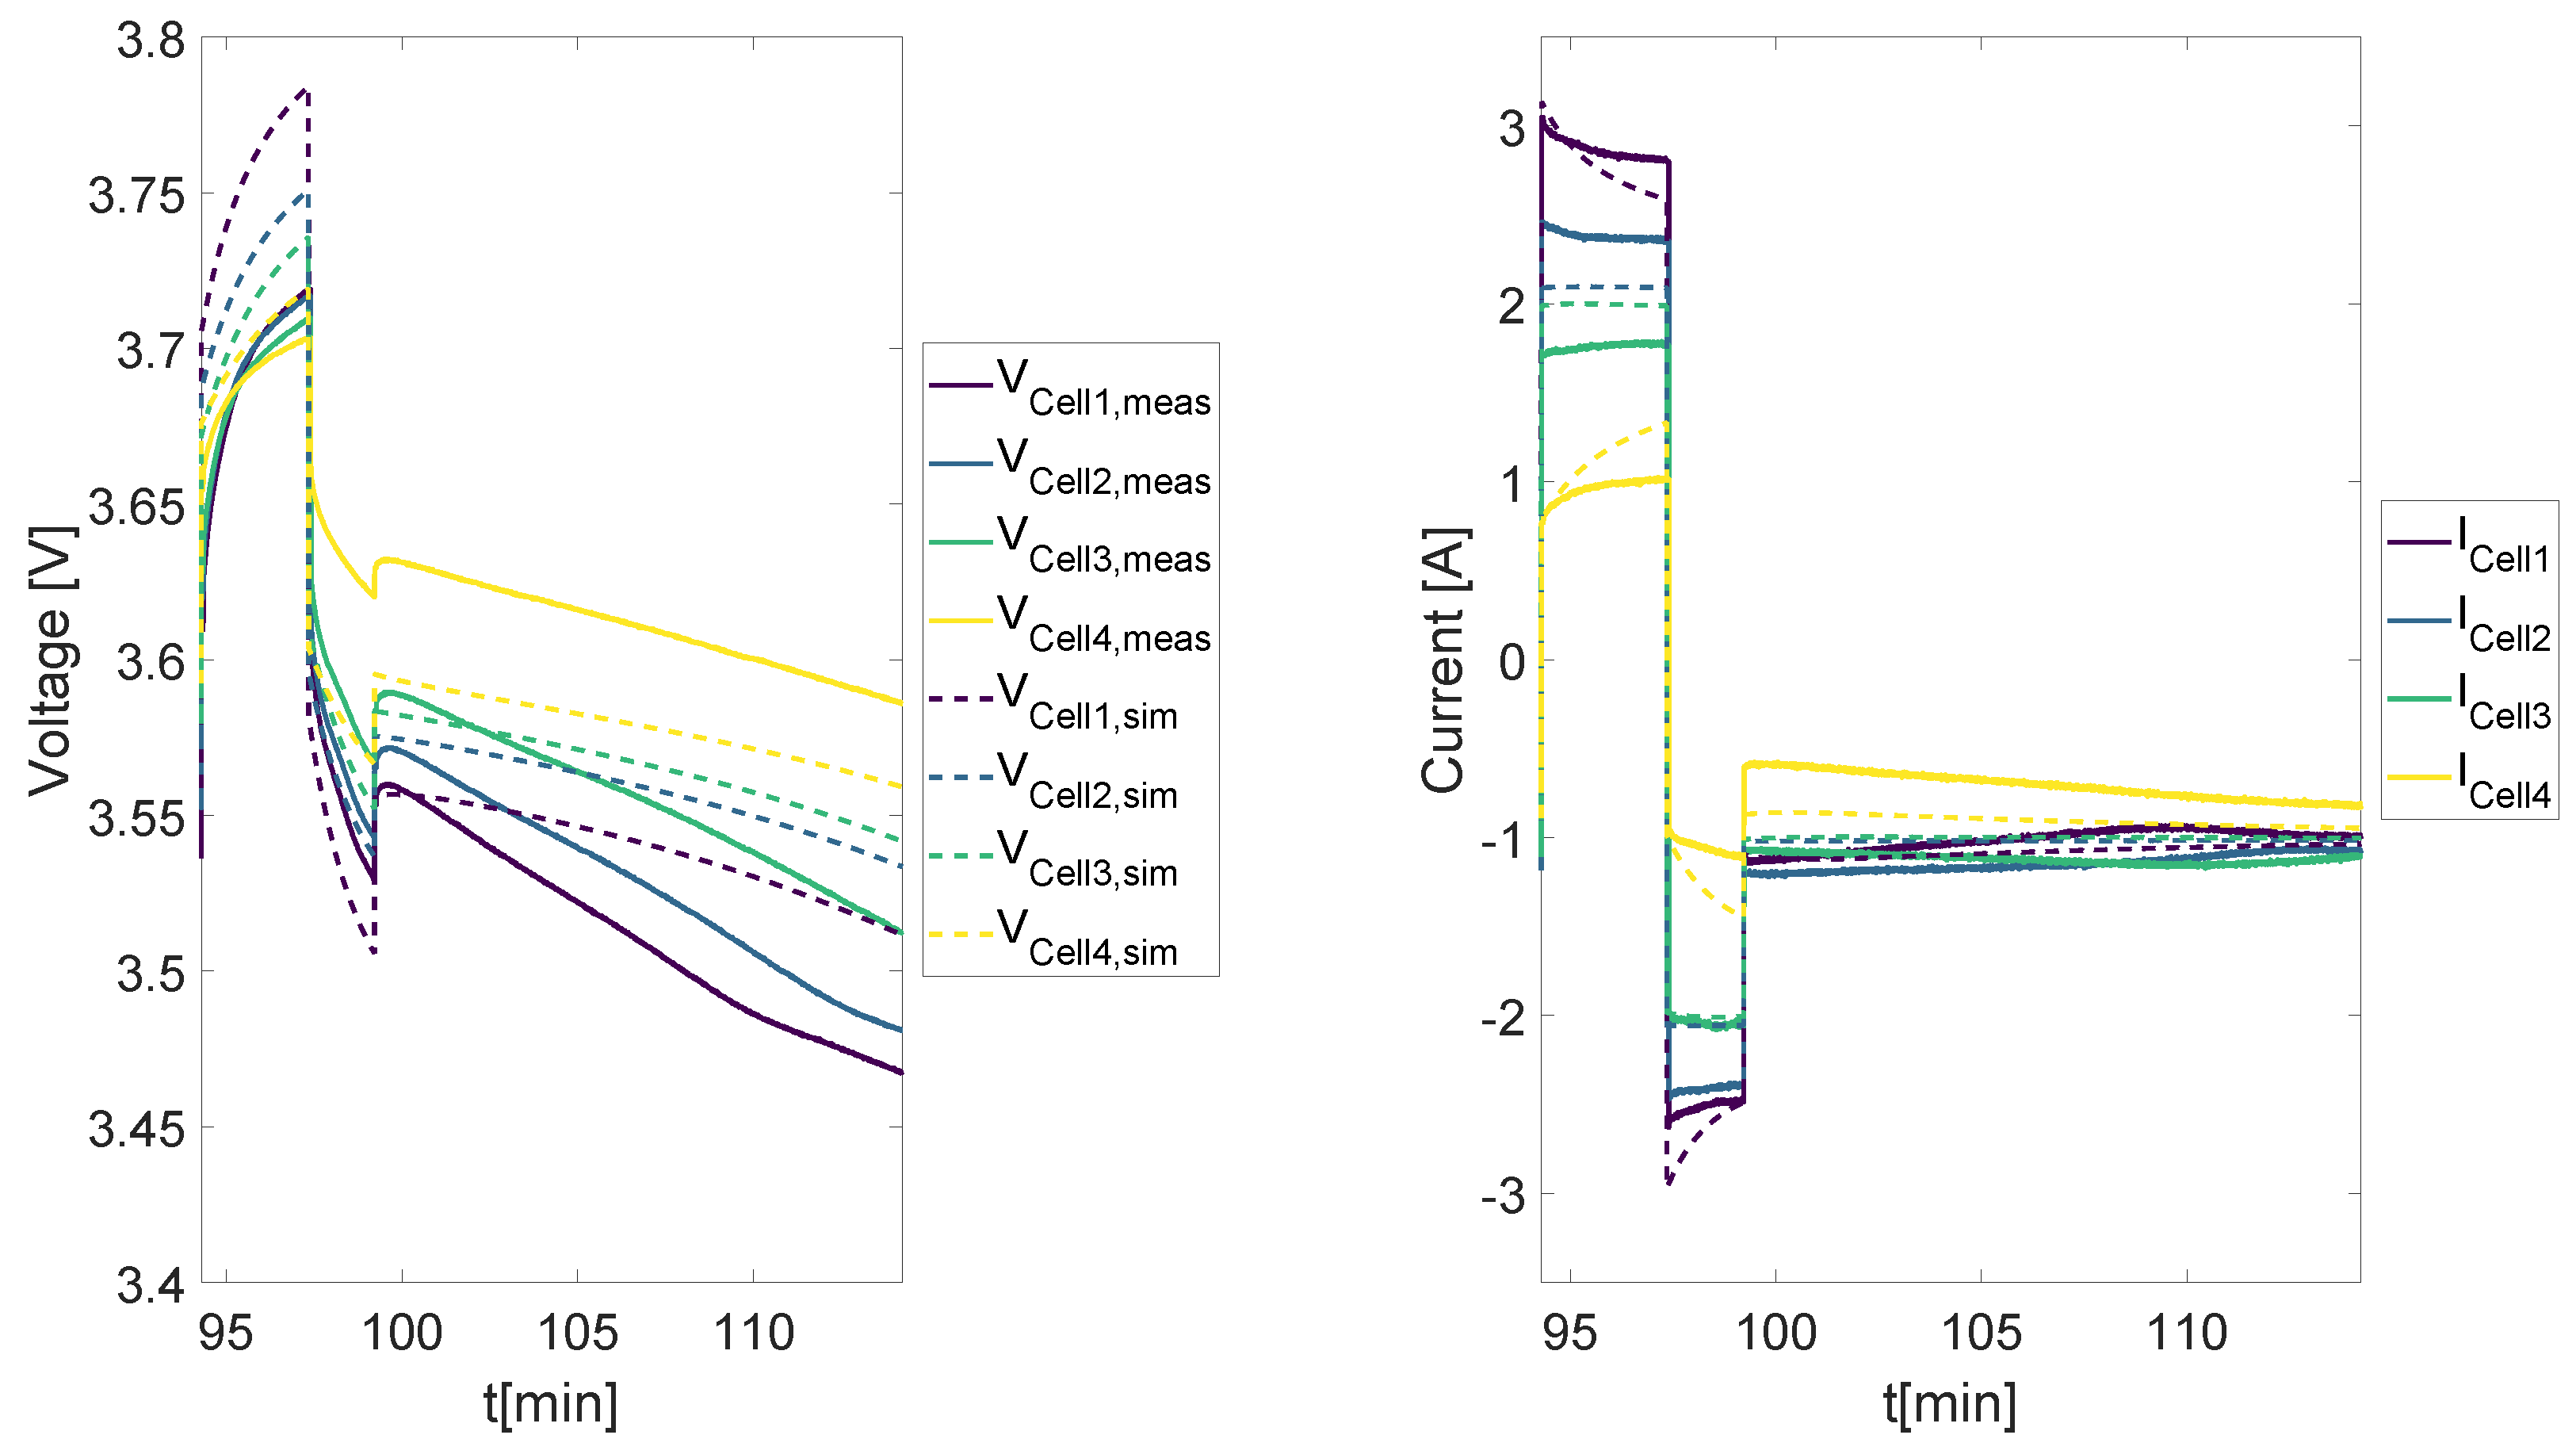
The parameters were fitted for charging and discharging direction and were averaged for each 10% SOC step. Also, the QOCV were averaged for a mean open circuit voltage.
Figure 5 depicts a comparison of the model with the measurement. It shows a part of the profile, which is used in the measurement section. Also, the setup is described in that section. The model consists of four parallel connected cells. The currents show a similar behaviour, where the voltages have higher errors. In the model the currents are calculated from the voltages in a voltage loop, therefore small errors in the current should lead to small errors in the voltages, if the parameters are a good estimation of the real battery parameters, because they influence the calculation of the current distribution. The simplifications, like using mean parameters and quasi open circuit voltages, and a maybe flawed characterization could have led to these errors. However, the model seems to emulate the overall behaviour sufficiently. More time could be spent to improve the parameterization of the pack model, but at this point the models’ performance is adequate for amplifying the goal of the work, to investigate the influence of parameter variations.
3. Measurement and Simulation
Many applications use battery systems, which consist of parallel and series connected cells. The majority of research deals with variations in series connections, where the parallel connected cells are considered equal [
5,
6,
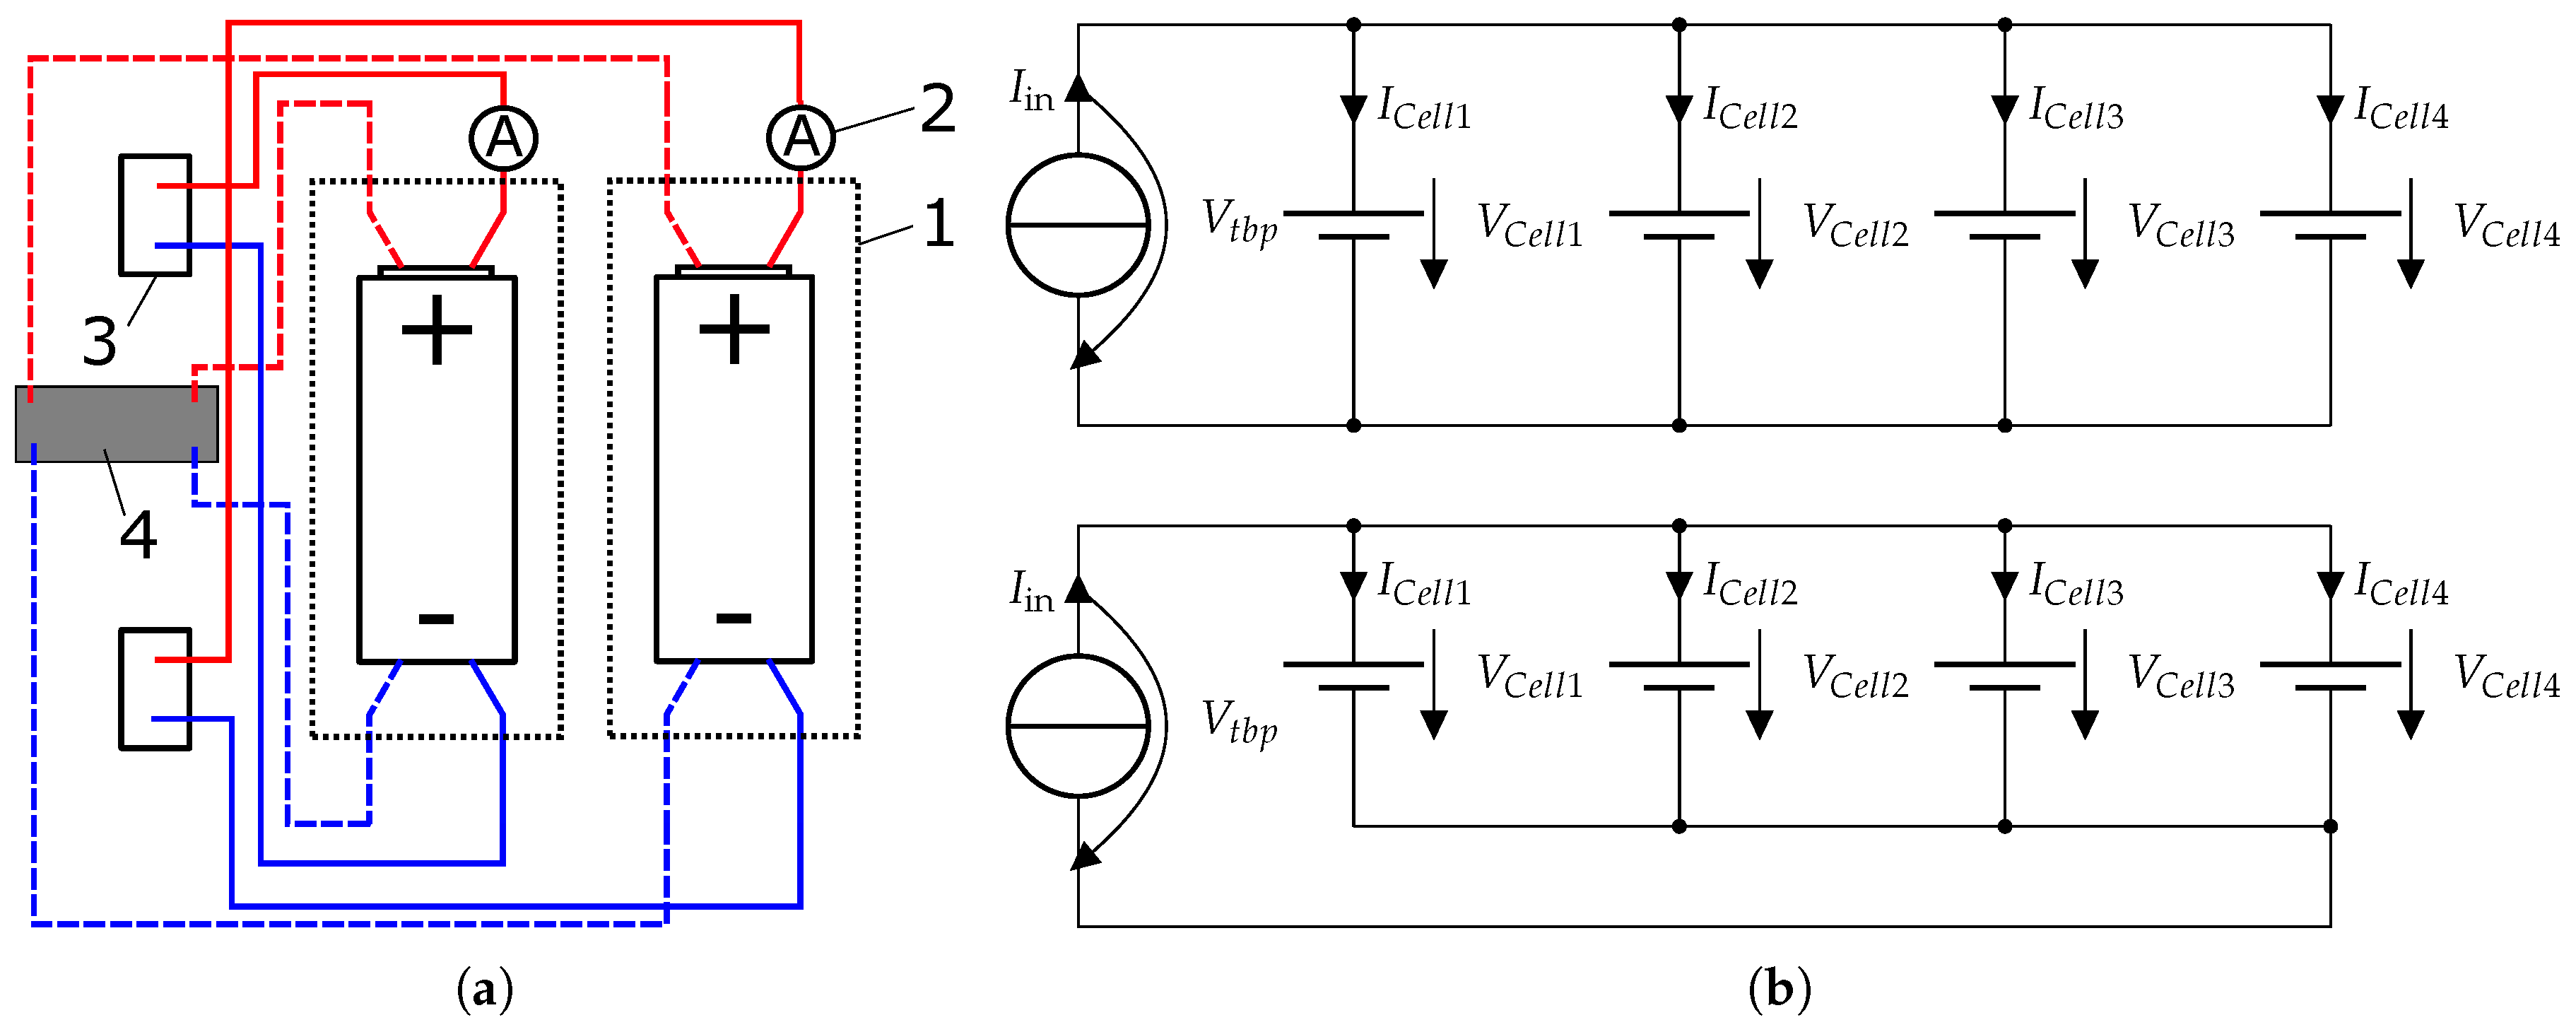
7]. This paper concentrates on parallel connections and the influence of inhomogeneities. A few different measurements were conducted, where the cells have different capacities, internal resistances and different connections. Due to the concentration on parallel connected cells the measurement setup consists of four parallel connected cells where the current in each path and each temperature is measured. The setup is variable and the interconnections could be changed easily due to the usage of screwed contacts.
Figure 6a,b depict the setup as overview of the printed circuit board and as simplified circuit diagram including the different terminal positions. For the measurements two different high power 18,650 cells were used. One cell is the LGHE4 from LG with a nominal capacity (
) of 2.5 Ah and the other is the VTC5 from Sony with
= 2.6 Ah. They have slightly different internal resistances as well, see
Table 1.
3.1. Measurement Cases
The measurements belonging to the parallel connections consider different capacities, internal resistances and different interconnections of the cells, which means that the terminals of the pack are at different locations of the pack. These cases lead to five different measurements.
- Test 1
The first test uses only the cells from LG in the order LGHE4-1, LGHE4-2, LGHE4-3 and as fourth cell the LGHE4-4. The terminals were connected to the poles of the first cell in the configuration. This test should highlight a very poor scenario, where the fourth cell experiences the smallest load due to its internal resistance and its location.
- Test 2
The second test changes the positioning of the cells in comparison to test one. LGHE4-4 was placed at position two in the parallel connection, where LGHE4-2 and LGHE4-3 are shifted to position three and four. The terminals were connected to the poles of the first cell in the configuration. This test should show how the location of a higher internal resistance influences the current distribution.
- Test 3
Test three uses three Sony cells at position one (VTC5-1), three (VTC5-2) and four (VTC5-4). At position two is an LG cell (LGHE4-2). The terminals were connected to the poles of the first cell in the configuration. This test shall display the effect of a smaller nominal capacity in a parallel connection.
- Test 4
LGHE4-1, LGHE4-2 and LGHE4-3 were used as cell one, cell three, and cell four respectively. The second cell in the measurement setup was VTC5-3. The terminals are located at the plus and minus poles of the first cell. In comparison to test three, test four shows the influences of a higher nominal capacity.
- Test 5
During this test the terminals plus and minus of the pack were connected to the first and last cell respectively. The cell configuration is the same as in test one. This test in comparison with test one is used to investigate the influence of the terminal location.
Each measurement is conducted using the same current profile. The cells start at 4 V and are discharged with a constant current of 4 A with intermitting charge and discharge pulses of 8 A until the terminal voltage of the pack reaches 3.4 V. Afterwards the pack is charged with the constant current constant voltage scheme to 4 V. The operation window is for safety reasons between 3.4 V and 4 V.
Table 2 sums up the measurement configurations.
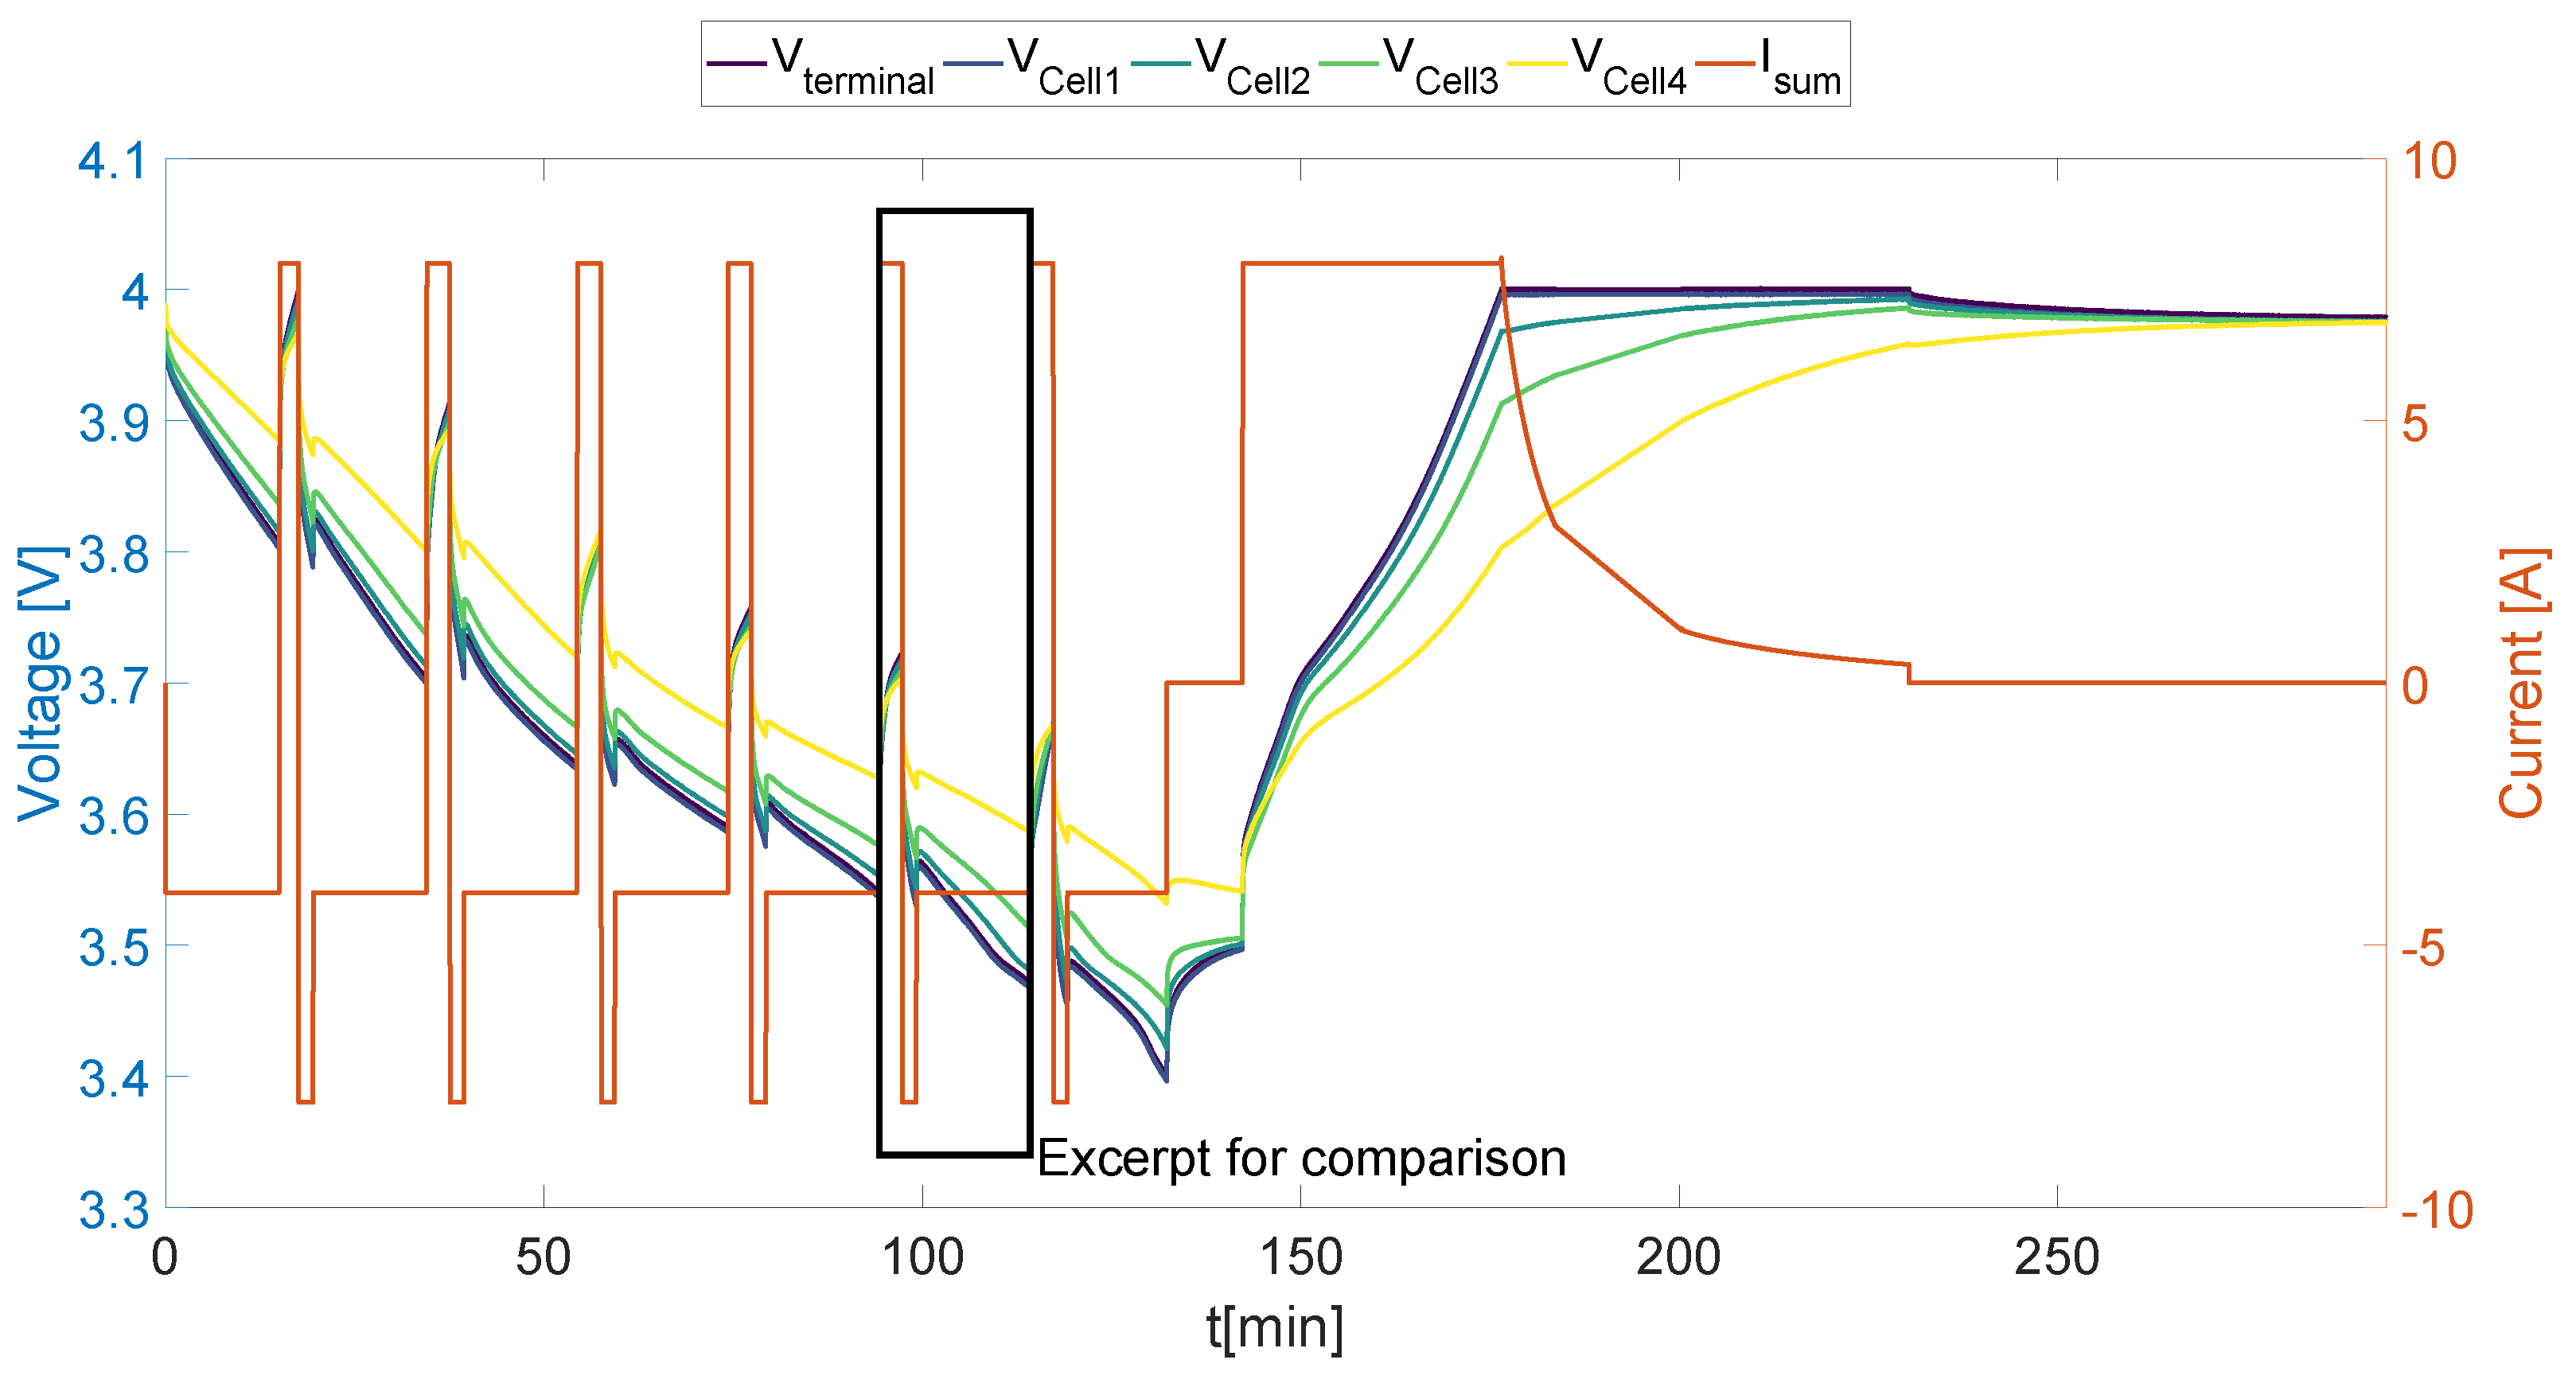
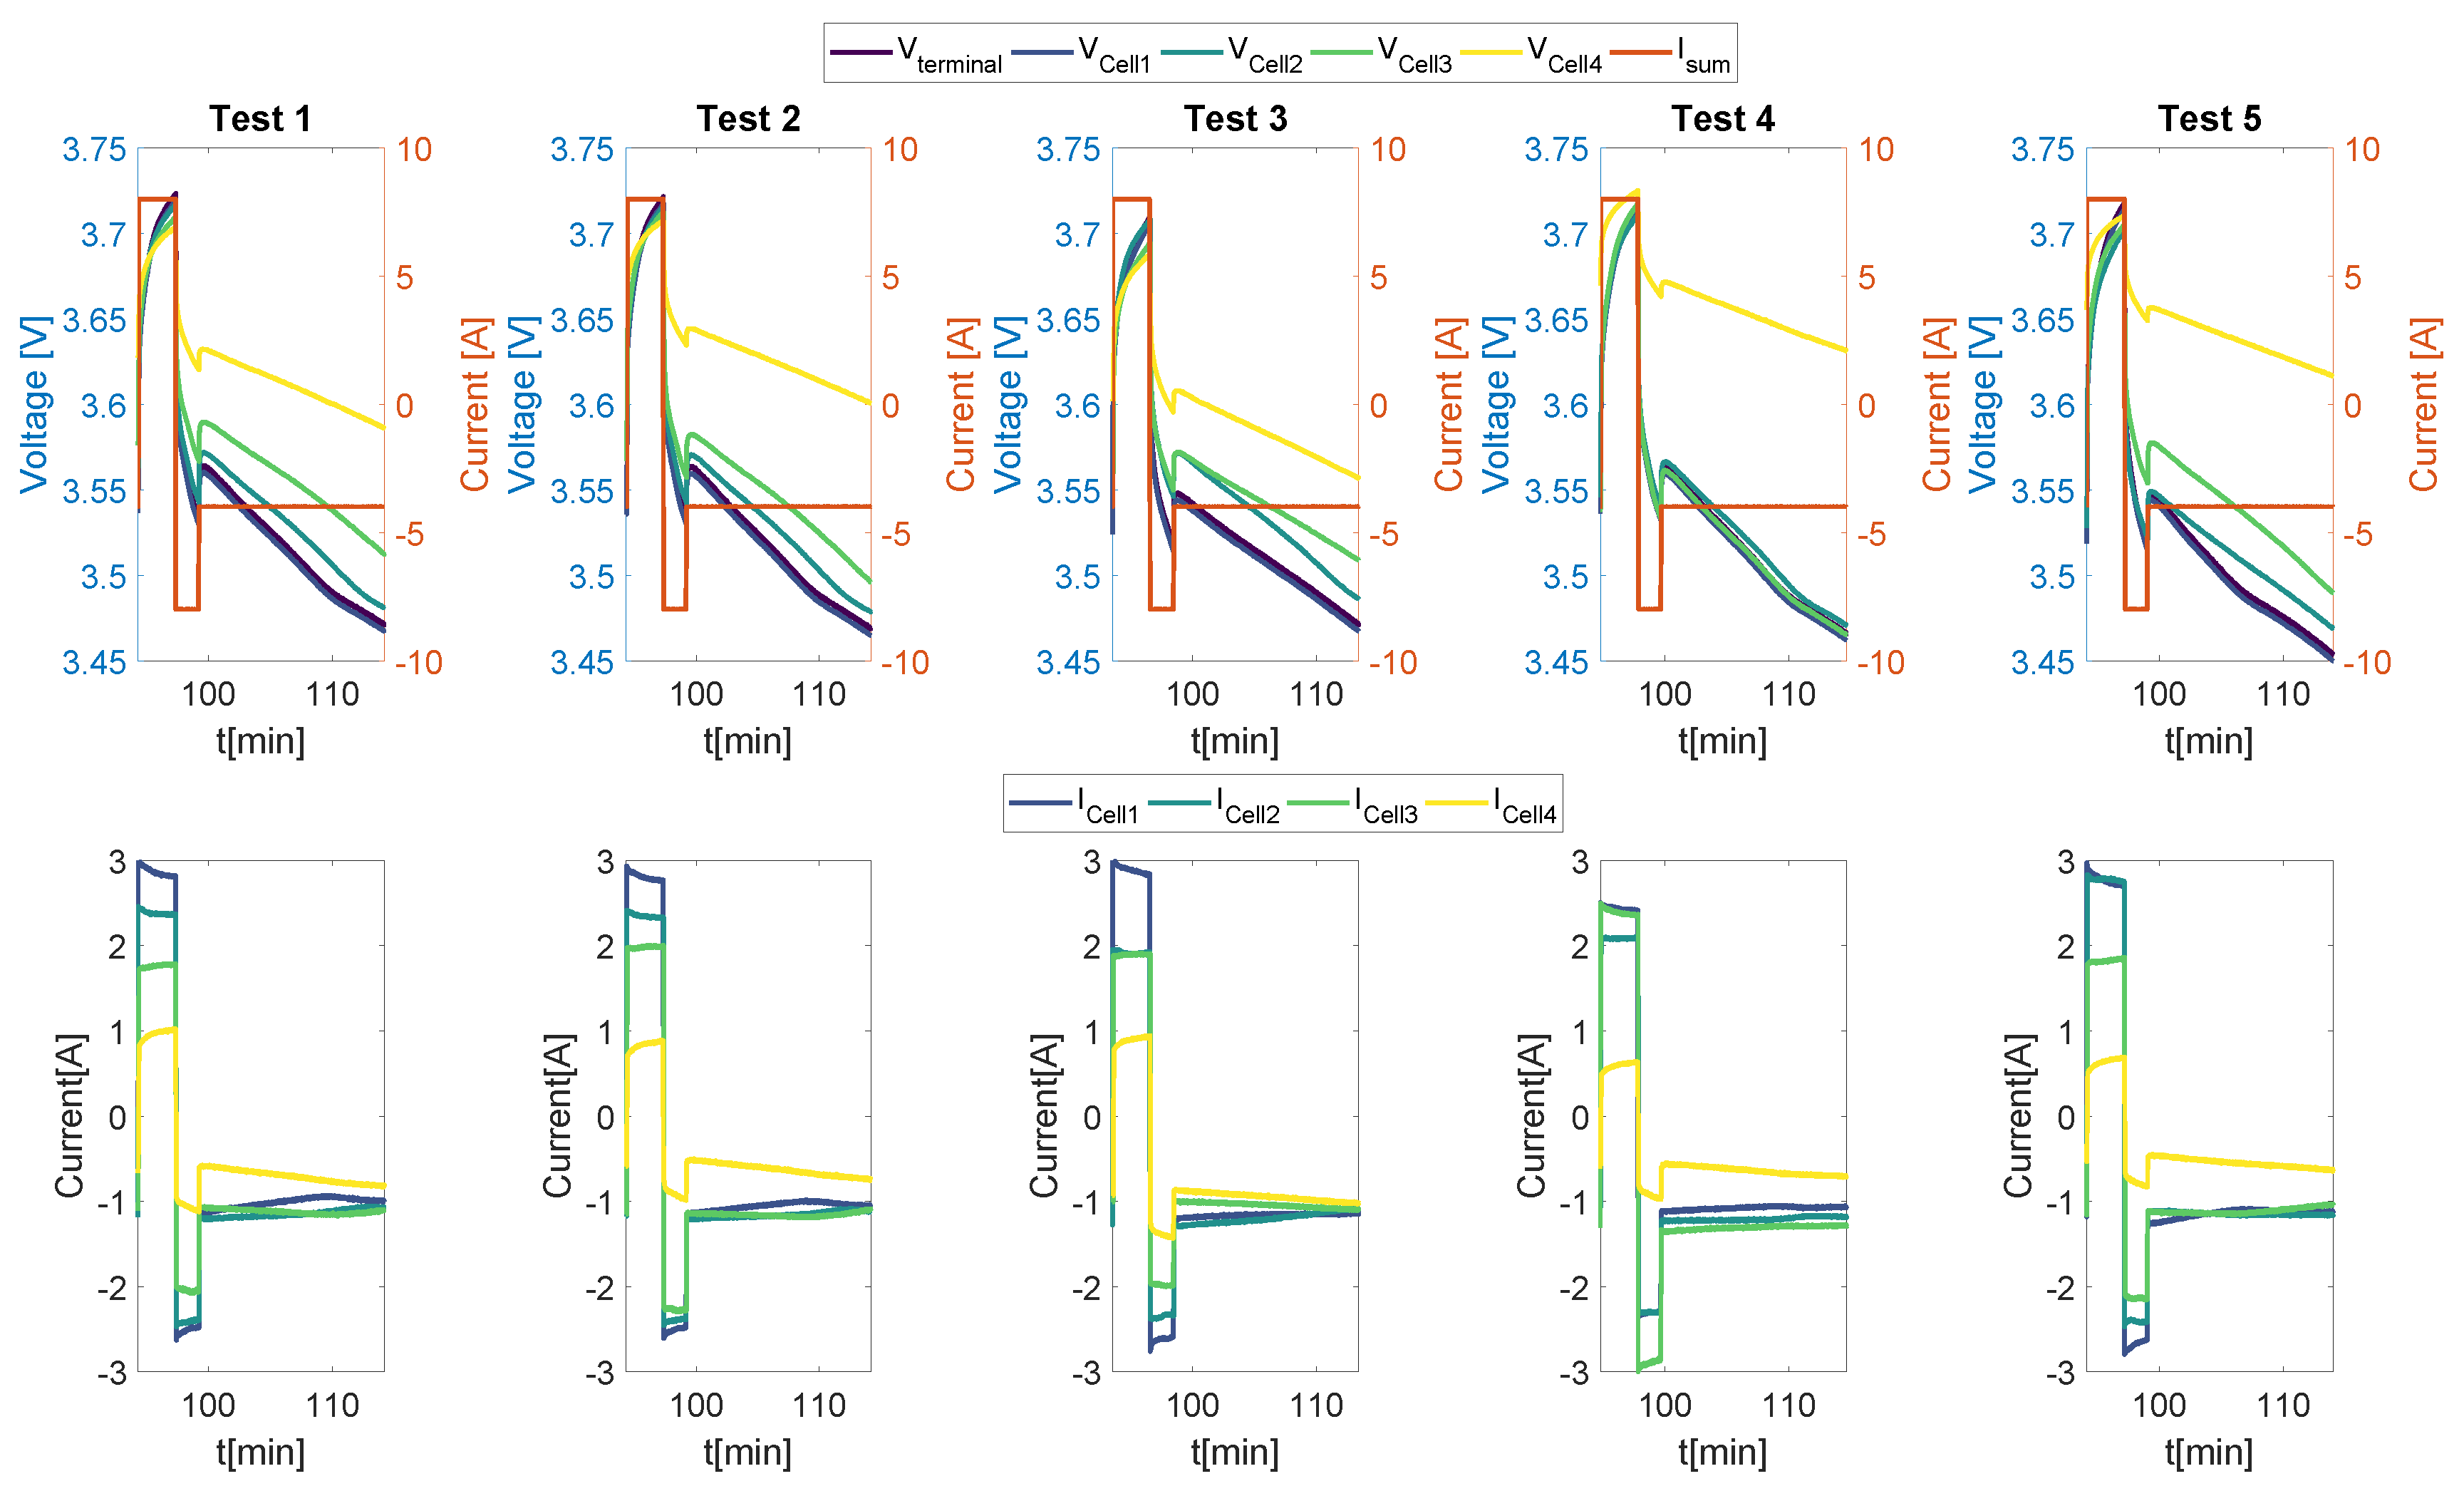
Figure 7 depicts the voltages of the cells and the terminal as well as the total current through the parallel connection. It exemplifies the current profile which is used to investigate the variation of parameters in parallel connections. As it is shown in the figure the voltage differs by up to 200 mV and further comparisons are conducted for a small exerpt of the current profile, which is marked in
Figure 7.
The expectations of a specific behaviour for each of the tests is driven by the configuration and the parameters of the cells and the connections.
Figure 8 displays a part of the testing scheme for every measurement.
In the first test the capacities of the cells lie in the range of
Ah and
Ah. Whereas the internal resistances have a higher discrepancy of up to 20
. The order of the internal resistances is 36
, 38
, 30
and 50
. By considering the internal resistances on its own, the highest current would be expected for cell three, which is the cell with the lowest internal resistance. For the cell with the highest internal resistance the current should be the smallest. When the connection resistances and position of the terminals are taken into account, the first cell should be the cell with the highest current in the parallel connection and the last cell with the smallest current. Combining the expectations leads to the assumption that cell four would experience by far the smallest current followed by cell three, two and one.
Figure 8 shows an excerpt of test one, which confirms the assumption. The currents and the voltages of the first three cells lie in the range of 1 Ah and 50
, whereas the fourth cell experiences differences of more than 50
and 1
.
By changing the position of the cell with the highest internal resistance, it is expected that the current distribution would change accordingly. This case is investigated in test two, where the fourth cell of test one (LGHE4-4, 50 ) is placed at the second position and the other two cells (LGHE4-2, LGHE4-3) are shifted to the position three and four. So the assumption is that the current load for the second cell decreases, where it increases for the fourth cell due to the smaller internal resistance. The results show that this assumption is not met, since the current load for the fourth cell decreases, the load for the second cell stays the same and the third cell, which had in test one a smaller resistance is now loaded with a higher current than before. So the main conclusion from this test is that the positioning has a higher influence than the actual internal resistance of the cell at a specific position, with this specific measurement setup.
Test three investigates the case of having a cell with a smaller nominal capacity in the parallel connection. So the configuration consists of three VTC5 cells, VTC5-1, -2 and -4 at positions one, three and four. At position two is the LGHE4-2 which has about 130 mAh lower capacity than the VTC5 cells and an 10 higher internal resistance except VTC5-4. A lower capacity should lead especially at a low or high state of charge to an influence on the open circuit voltage due to the exponential change of the open circuit voltage. Due to the internal resistances and the positions in this configuration, cells two and four are expected to be loaded to a smaller amount than before. This configuration leads to an equal current during the high charging current for cell two and three, so cell two is loaded less considering its position in the configuration, but that could not be observed during the discharges, which could be a result of variations in the charging and discharging behaviour. The slightly lower capactiy leads to a faster descrease of the voltage of cell two in the section of the smaller discharging current. So the predetermined current distribution caused by the posistion could be influenced by the arrangement of the internal resistances and lower capacities could influence the current distribution as well, especially at a lower state of charge.
Where test three investigated the case of a smaller capacity in a parallel connection test four investigates the case of a higher capacity. To be able to investigate the given case a connection of LGHE4-1 ( Ah), VTC5-3 ( Ah), LGHE4-2 ( Ah) and LGHE4-3 ( Ah) was configured. The internal resistances lie in the range of 10 ( , , and for cell one to four in the configuration). Due to the positioning and the internal resistances cell two could be loaded more than would normally be expected in this position. The higher capacity could influence the current distribution if the other cells reach the exponential part of their open circuit voltage. During the test this case was not reached and the assumption that cell two has a higher load considering its internal resistance and its position could not be observed. In this case the voltages of cells one to three are nearly the same, just cell four shows a highly differing voltage, which leads to the assumption that the connection resistances are high, but the measurements of the connection resistances do not support that assumption.
In test five the influence of the location of the terminals of the parallel connection should be analysed. The configuration is exactly the same as in test one except the location of the terminals, where the positive terminal is connected to the positive pole of the first cell and the negative terminal is connected to the negative pole of the last cell. This leads to the expectation that the first and the last cell will be loaded the most, due to their position, but the fourth should be loaded less, due to its internal resistance. The measurement revealed a shift of the current distribution, such that the second cell is loaded like the first cell, and the fourth cell is loaded even less than in test one. So the terminal location does influence the current distribution but in this setup not as expected.
The different cases have shown that different internal resistances and capacities have different influences on the behaviour in a parallel connected string of cells. They lead to higher currents or smaller currents. But in a real measurement the expectations could not be observed. The main reasons are that in every real setup the cells are not exactly the same, so they have different internal resistances and capacities. They could have different open circuit voltages as well. Because the expectations depend on a mean value of internal resistances and capacities, there could also be false assumption, because the charging and discharging internal resistance could differ. Also the terminal location did influence the behaviour, but the results were not as expected. To identify the effects of the configuration of a parallel connection and their source, simulations are a helpful tool.
3.2. Simulations
The simulations are used to reason the expectations and to understand the influence. Simulations bring the advantage that it is possible to have four identical cells as defined by their perameters. Also the connection resistances can be neglected to investigate the influence of different internal resistances and capacities without the current distribution due to the terminal location or other influences. Three simulations were conducted to show the behaviour of a parallel connection under specific conditions without disturbing other influences.
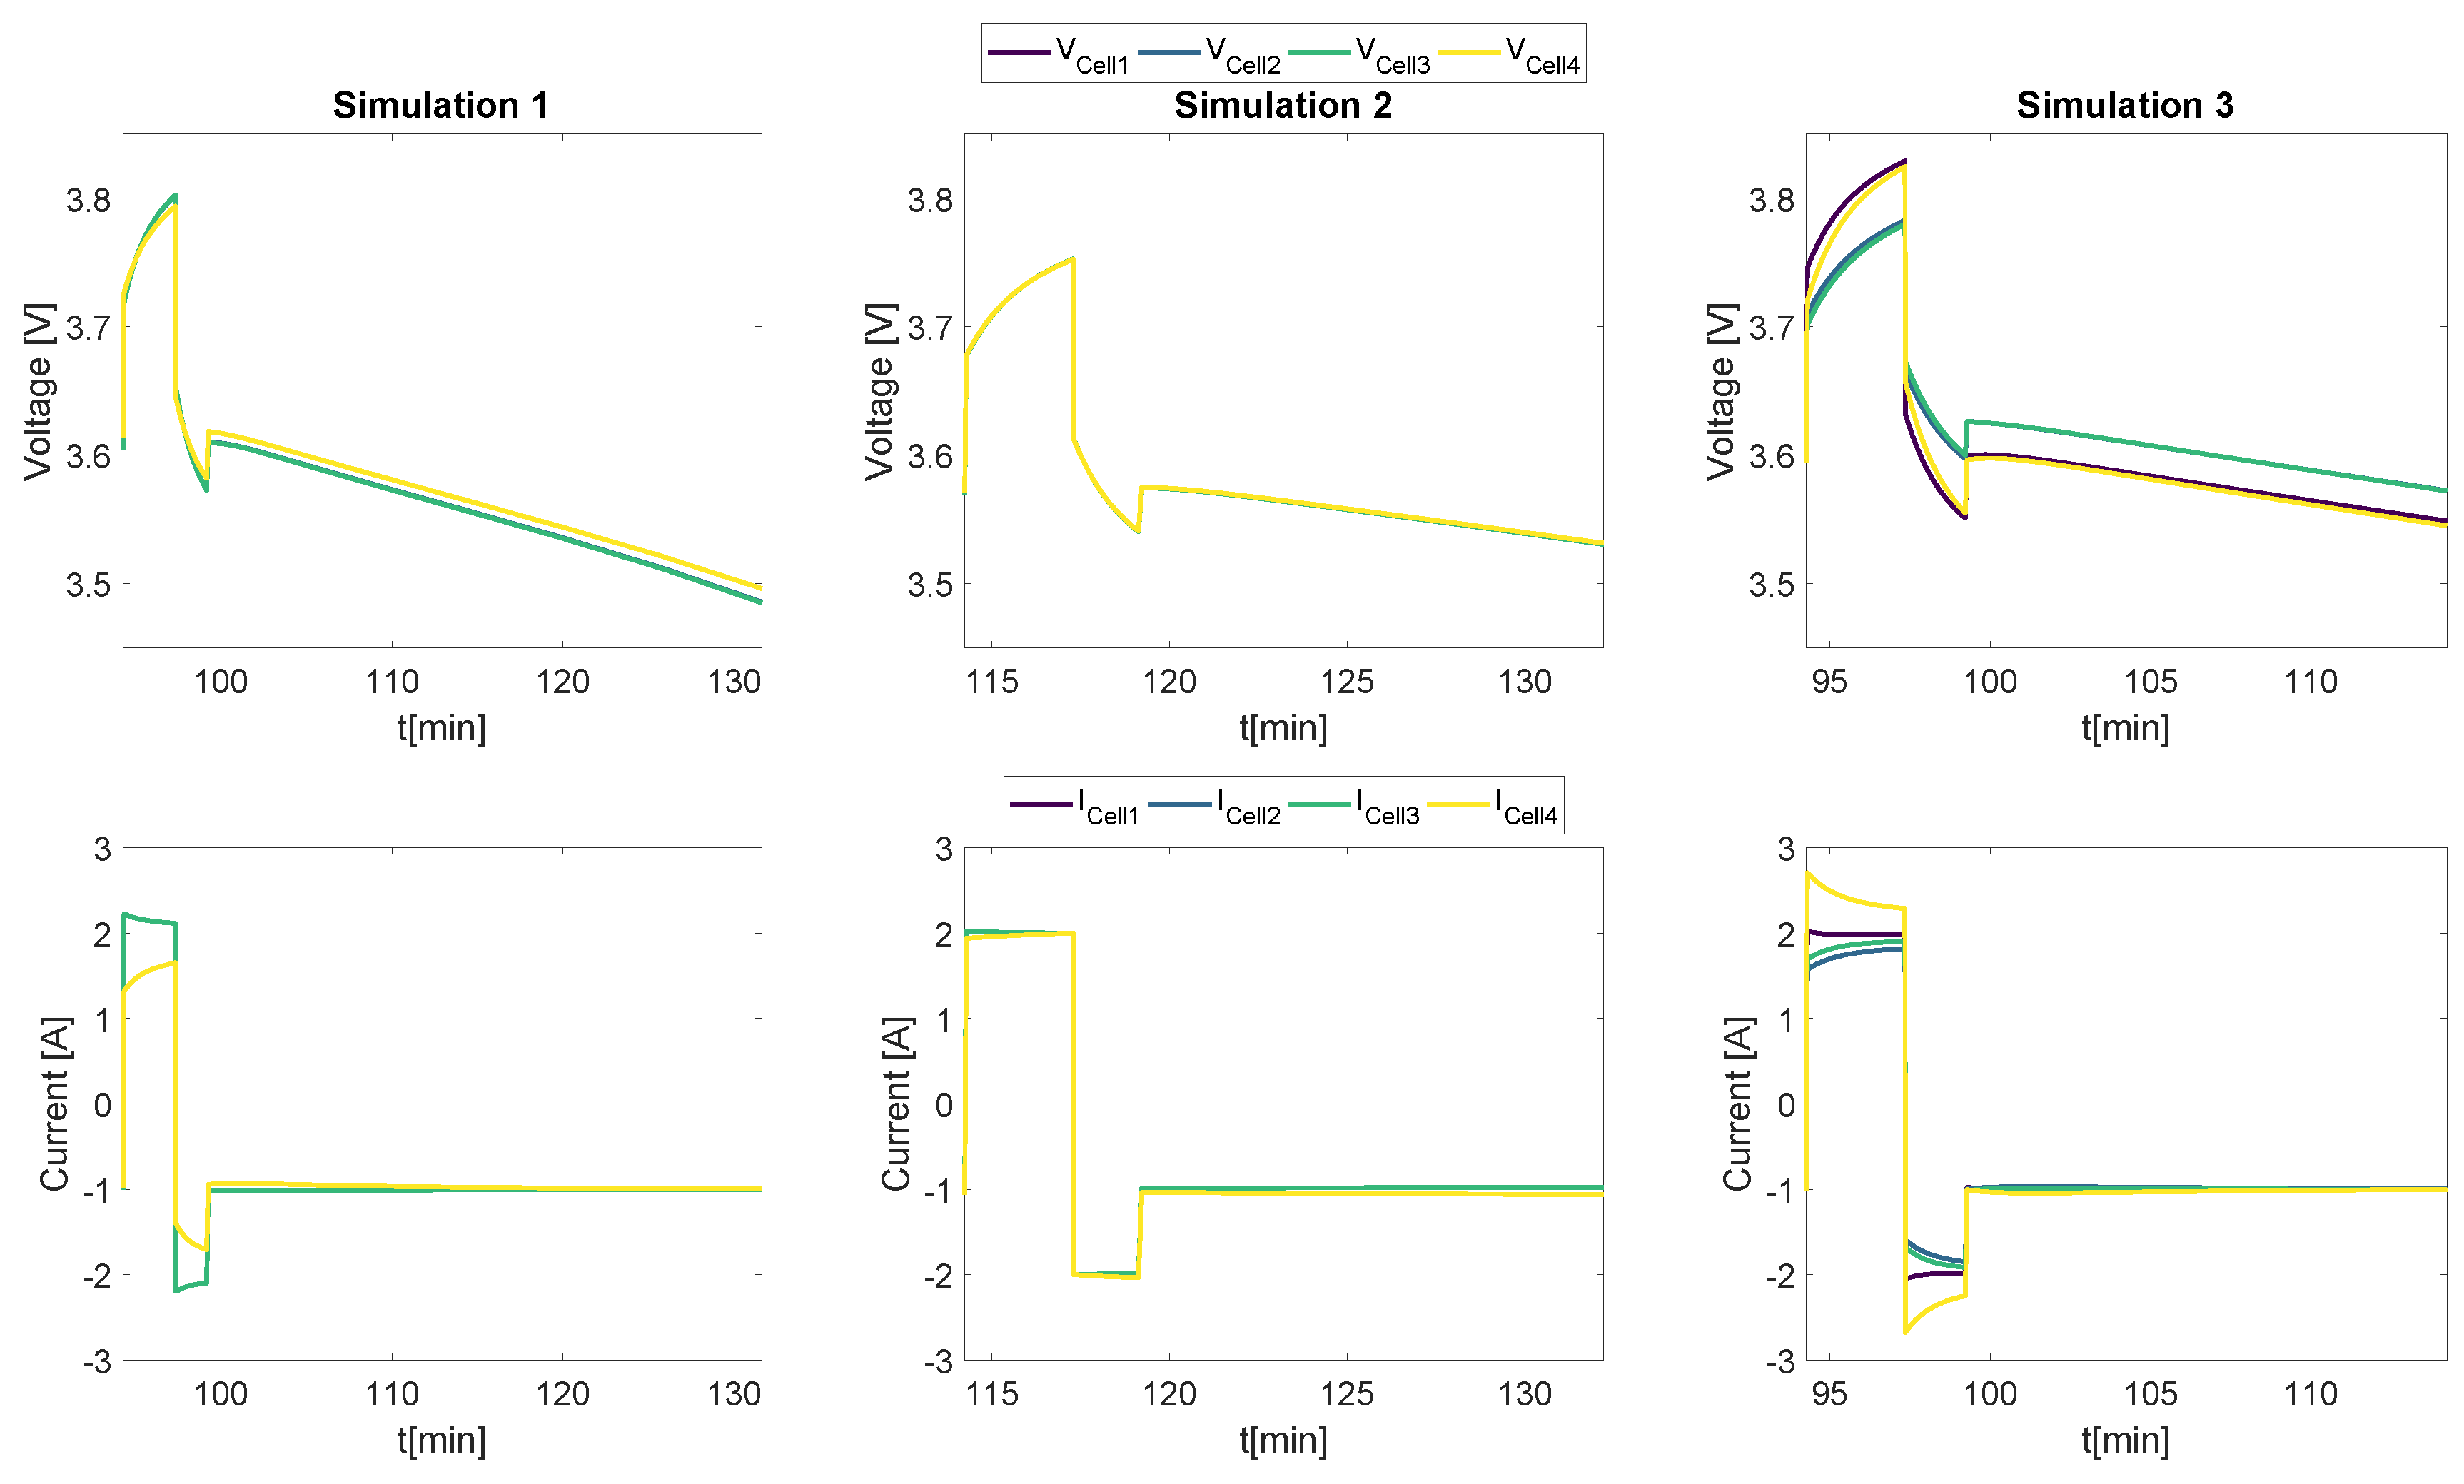
- Simulation 1
This simulation shows the behaviour of parallel connection when there is one cell with a higher resistance present. Every cell has the same parameters of the LGHE4-1 except cell four which is parameterized with the parameters of the LGHE4-4 ( ). The connection resistances are very low and the terminals were at the first cell in this simulation.
- Simulation 2
By using the parameters of LGHE4-1 for every cell except cell four which has the same impedance parameters but a nominal capacity of Ah, the simulation shows the influence of a higher capacity in the parallel connection. The terminals were simulated at the first cell.
- Simulation 3
In this simulation the cells have the parameters of the cells of test one in the measurements, but they were arranged such that the cells with higher internal resistances are positioned at the outer most locations and the terminals were connected to the positive pole of the first and the negative pole of the last cell. The parameters of the cells positioned at cell one to four are from LGHE4-4, LGHE4-1, LGHE4-3 and LGHE4-2, respectively.
As
Figure 9 shows the specific simulations it depicts the effects with no interference of other influences. From simulation one it can be observed that the lower internal resistance leads to the expected smaller load in comparison with the other cells which experience the same load. In the case of simulation two, the influence of a 10% higher nominal capacity is marginal, because there are very small differences in the current and the voltage. But very small differences in the voltage mean, with almost zero connection resistances, that the fourth cell with the higher capacity is at the same state of charge such that the open circuit voltages are equal, which means that the fourth cell was discharged more during the whole simulation. The last simulation depicts a nearly optimal configuration of a parallel connection of four different cells, which are located in a way that the currents are distributed more equal than in test one. Cells with high internal resistances are positioned at the outer most locations to counter the current distribution due to the positioning in a parallel connection with the terminals at the positive pole at the first and the negative at the fourth cell. Due to the terminals’ location the current distribution by the position in the connection is symmetric, higher loads for the cells connected to the terminals and smaller loads for the cells in between.


