1. Introduction
The transformation of conventional powertrains into hybrid powertrains opens new degrees of freedom in influencing longitudinal and lateral driving dynamics. Such influences can result from the selection of the powertrain topology, the sizing of its components and their vehicle integration. A hybrid powertrain topology defines the driven axles and wheels, as well as the positioning of the electrical machine, in a conventional powertrain. Consequently, there is a connection between the topology and the driving dynamics because various functionalities are feasible depending on the topology. Exemplary functionalities are all-wheel-drive or torque vectoring. Sizing of powertrain components determines specific component variables, for instance, power and torque of an electrical machine or maximum energy content of a battery. Furthermore, sizing can imply interactions with correlating component masses. Thus, sizing specifies the fundamental performance of a powertrain. Positioning of powertrain components into a vehicle characterizes integration. It can affect a vehicle’s centre of gravity and consequently affect wheel load distribution and traction capability while accelerating or cornering, respectively.
These degrees of freedom can be utilized to improve driving dynamics through appropriate system design. Due to various combinations of powertrain topologies and component sizes, the system design of a hybrid powertrain results in a wide and complex solution space. For example, electrical machines can be sized variously and can be differently integrated into the powertrain, such as at the transmission or with an additional transmission directly at the axle. Furthermore, these combinations can be mixed with different battery sizes. The battery itself can also be placed at different positions in the vehicle, exemplarily in the centre or rear of the vehicle. In such a complex solution space the correlations between design variables and evaluation criteria are often uncertain.
In this paper, a novel simulation-based method is presented for the quantification of these correlations utilizing the Fourier amplitude sensitivity test (FAST). It identifies the sensitivity of each system design variable towards an evaluation criterion. The generated results are extended by local sensitivity analyses. These reveal correlation curves between each single design variable and an evaluation criterion for a limited section of design space. To ensure the efficient computational application of FAST and the local sensitivity analyses, compensatory models of the solution space are built by utilizing design of experiments and artificial neural network methods. An explanation of the proposed method is given in
Section 2. To demonstrate this method, an exemplary simulation-based study was conducted. Its objective is to quantify powertrain electrification impacts in the required time to accomplish a challenging driving profile. The baseline of this study is a conventional front-wheel-drive vehicle. Its electrification design space includes various hybrid powertrain topologies and sizing variables of the electrical machine and battery.
Section 3 presents the corresponding experimental set-up in detail. In
Section 4 the study’s outcomes are presented and discussed. A conclusion, as well as an outlook, is given in
Section 5.
2. Quantification Method
The proposed method elucidates the impact of design variables of powertrain electrification on driving dynamic-related evaluation criteria. This method consists of two segments. Firstly, computationally efficient models of the solution space are generated. Secondly, based on these models, sensitivity analysis is performed to identify variable specific impacts. These analyses apply global sensitivity analyses using FAST and use local sensitivity curves to support the findings generated by FAST. An insight on these approaches is presented in the following two subsections.
2.1. Solution Space Approximation
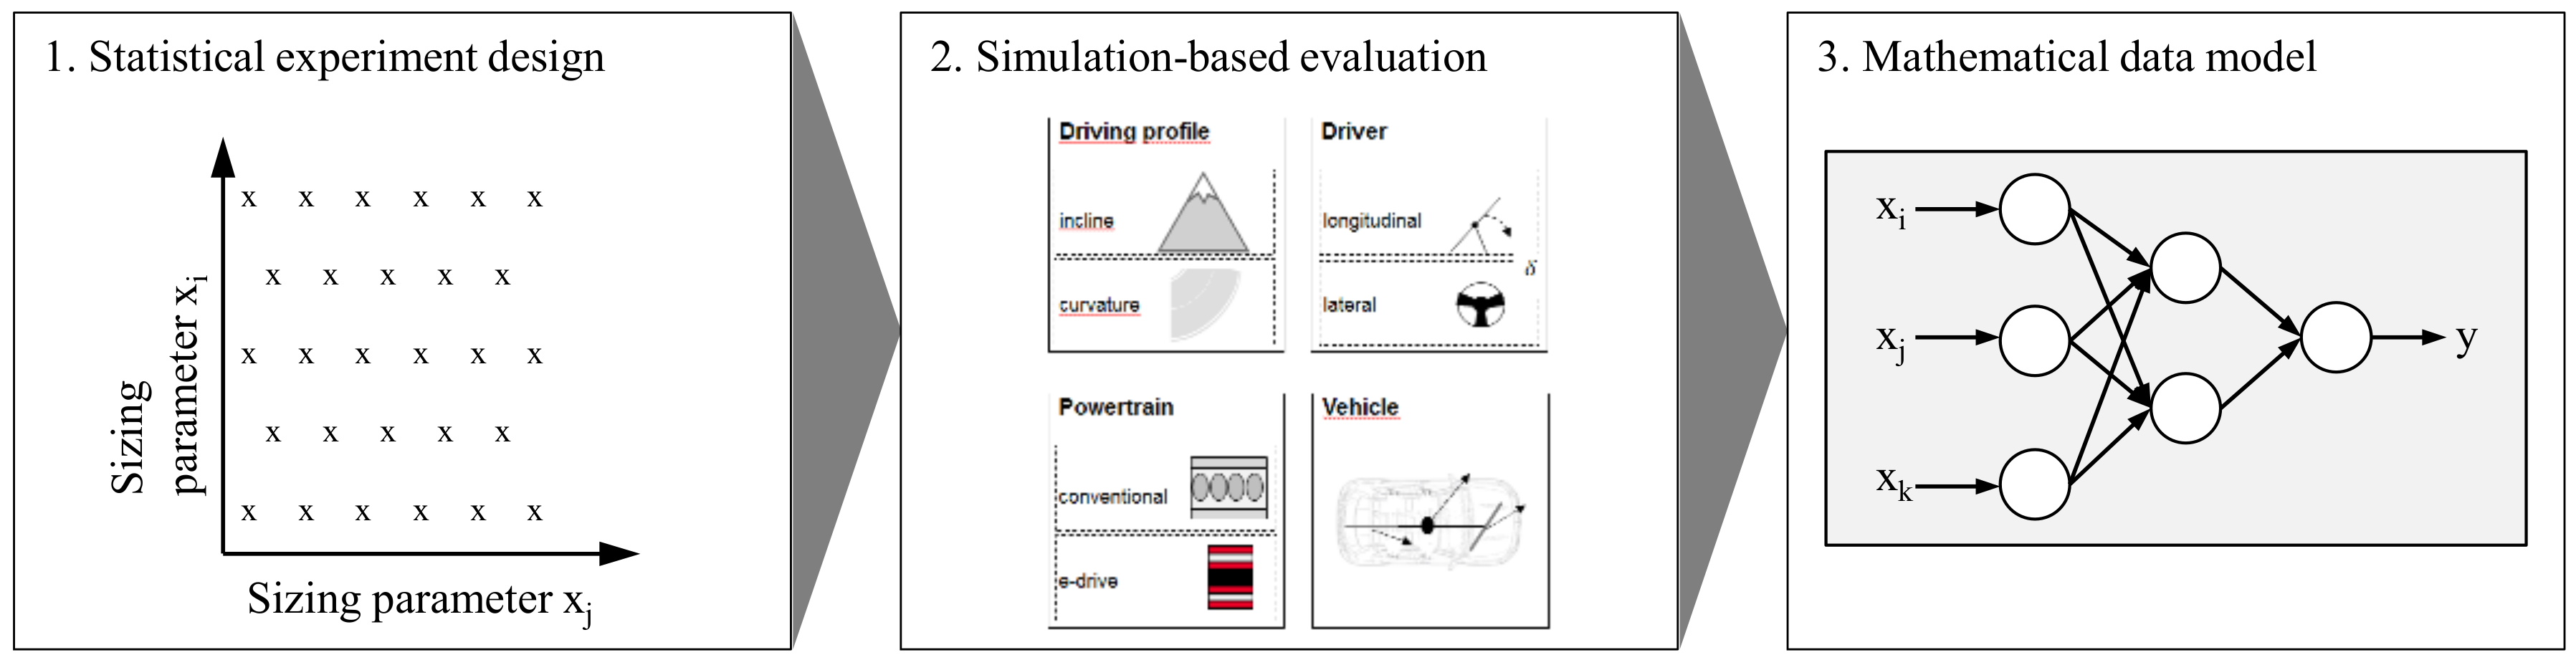
In this method, a solution space consists of a defined hybrid powertrain topology, various sizing variables and evaluations of the combinations of these two aspects in a defined investigation scenario. To generate a compensatory and computationally efficient model of such a solution space, a three-step approach in the style of [
1,
2,
3] is applied, as shown in
Figure 1.
Firstly, the sizing variables’ design space is discretized by individually using a statistical experiment design for every hybrid powertrain topology. Accordingly, every experiment presents a system design consisting of a specific hybrid powertrain topology and determined values for each sizing variable. Secondly, these system designs are evaluated with a quasi-steady-state simulation model, which includes physical compensatory models for the powertrain and vehicle, as well as a control strategy optimization algorithm. The applied optimization algorithm is a development of [
4]. Its objective is to minimize the required time for a given track by applying an electric drive in consideration of its electrical energy content and thermal boundary conditions. Based on the simulation outcome, mathematical data models of the solution space model are generated for each hybrid powertrain topology. These models are generated using an artificial neural network and they enable faster evaluation of new system designs compared to the physical simulation model.
2.2. Sensitivity Analysis
The sensitivity analysis is divided into a global and local part. The global part of the sensitivity analysis identifies main impacts on an evaluation criterion for each sizing variable. This identification is performed with the application of FAST. The local part of the sensitivity analysis allows for conclusions on the results generated by FAST. For that, it presents correlation curves between each sizing variable and an evaluation criterion in a local scope around the optimal design. The following sections explain the essential steps of the FAST algorithm and demonstrate its use on a basic equation.
According to [
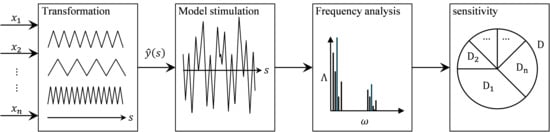
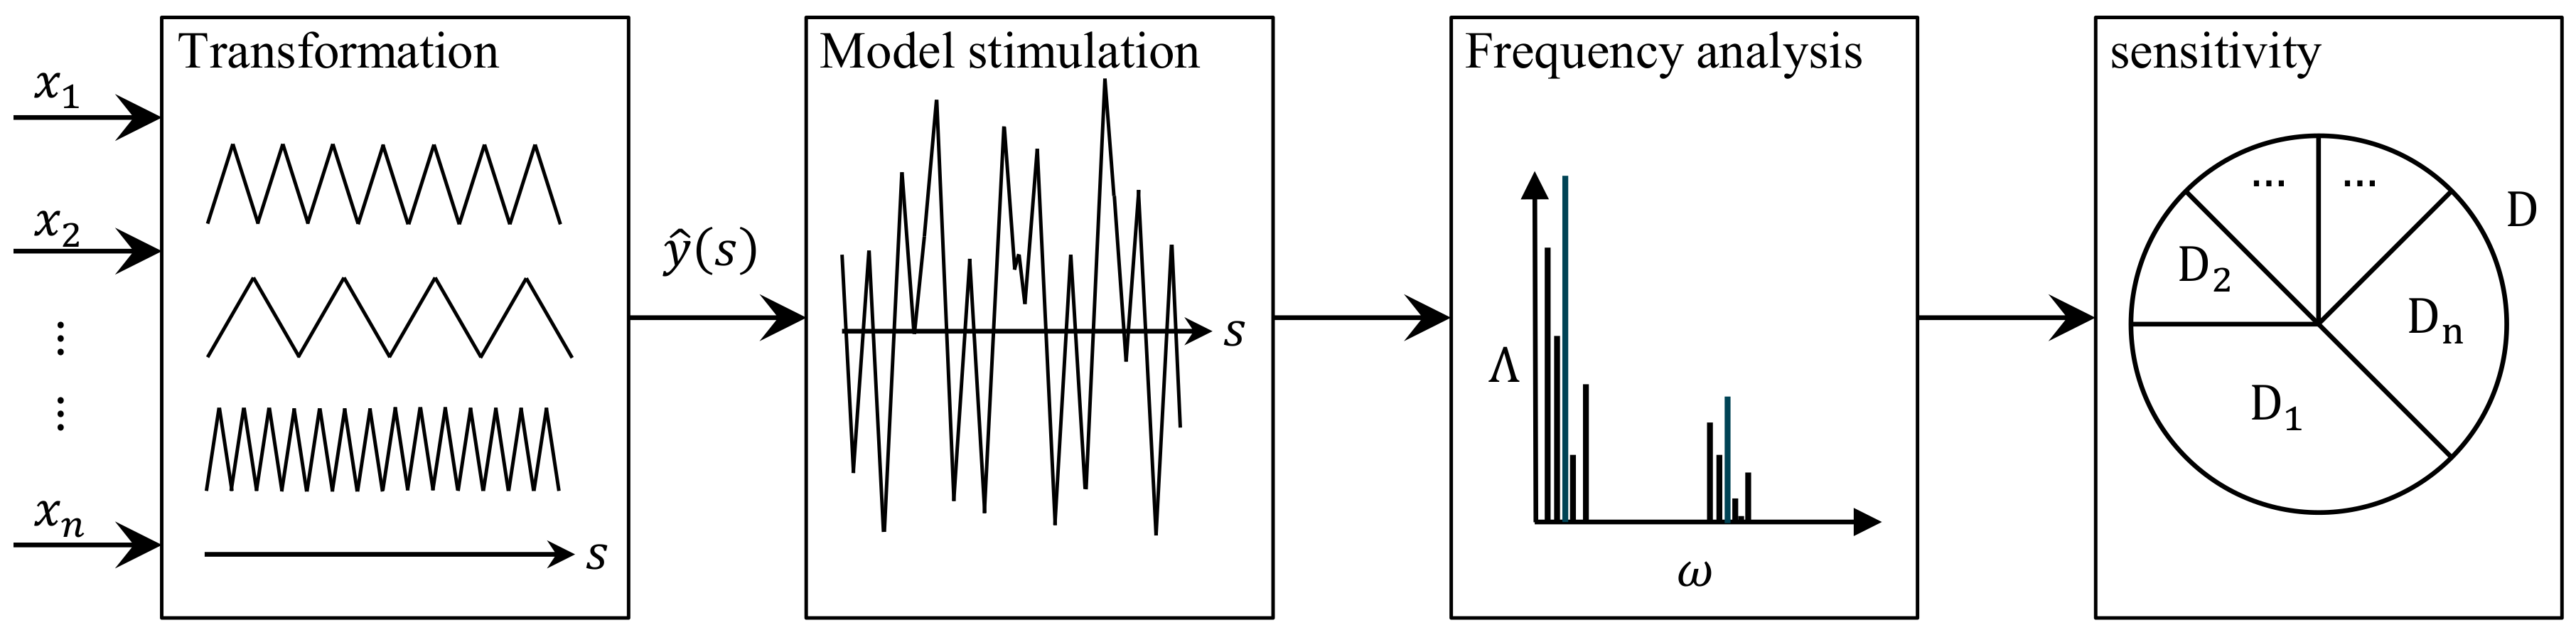
5], FAST is appropriate in generating accurate and significant correlations with little computational effort. Its approach can be characterized as consisting of four steps (
Figure 2): transformation, model stimulation, frequency analysis and sensitivity calculation [
6].
The starting point is a transformation of a multidimensional problem with various design variables into a one-dimensional problem, which is represented by a function of a single variable,
. For that, each design variable (
) is assigned to a frequency (
) and is represented by a compensatory function of
and
, as well as a transformation function,
(Equation (1)). The output of the transformation is presented as function
(Equation (2)), which combines all compensatory functions.
Secondly,
is stimulated. This leads to an oscillation, which indicates correlations between a design variable and an evaluation criterion. In the third step, a frequency analysis is performed to quantify these correlations, which are determined by their frequency-specific amplitudes,
Comparative calculations of these amplitudes reveal the specific impact of each design variable in the last step. According to Equation (3), a main impact results from the sum of frequency specific amplitudes
in relation to the sum of all amplitudes
.
In conclusion, this main impact characterizes the strength of the correlation between a design variable and an evaluation criterion. For this method, the applied FAST algorithm is based on the algorithm developed by [
7].
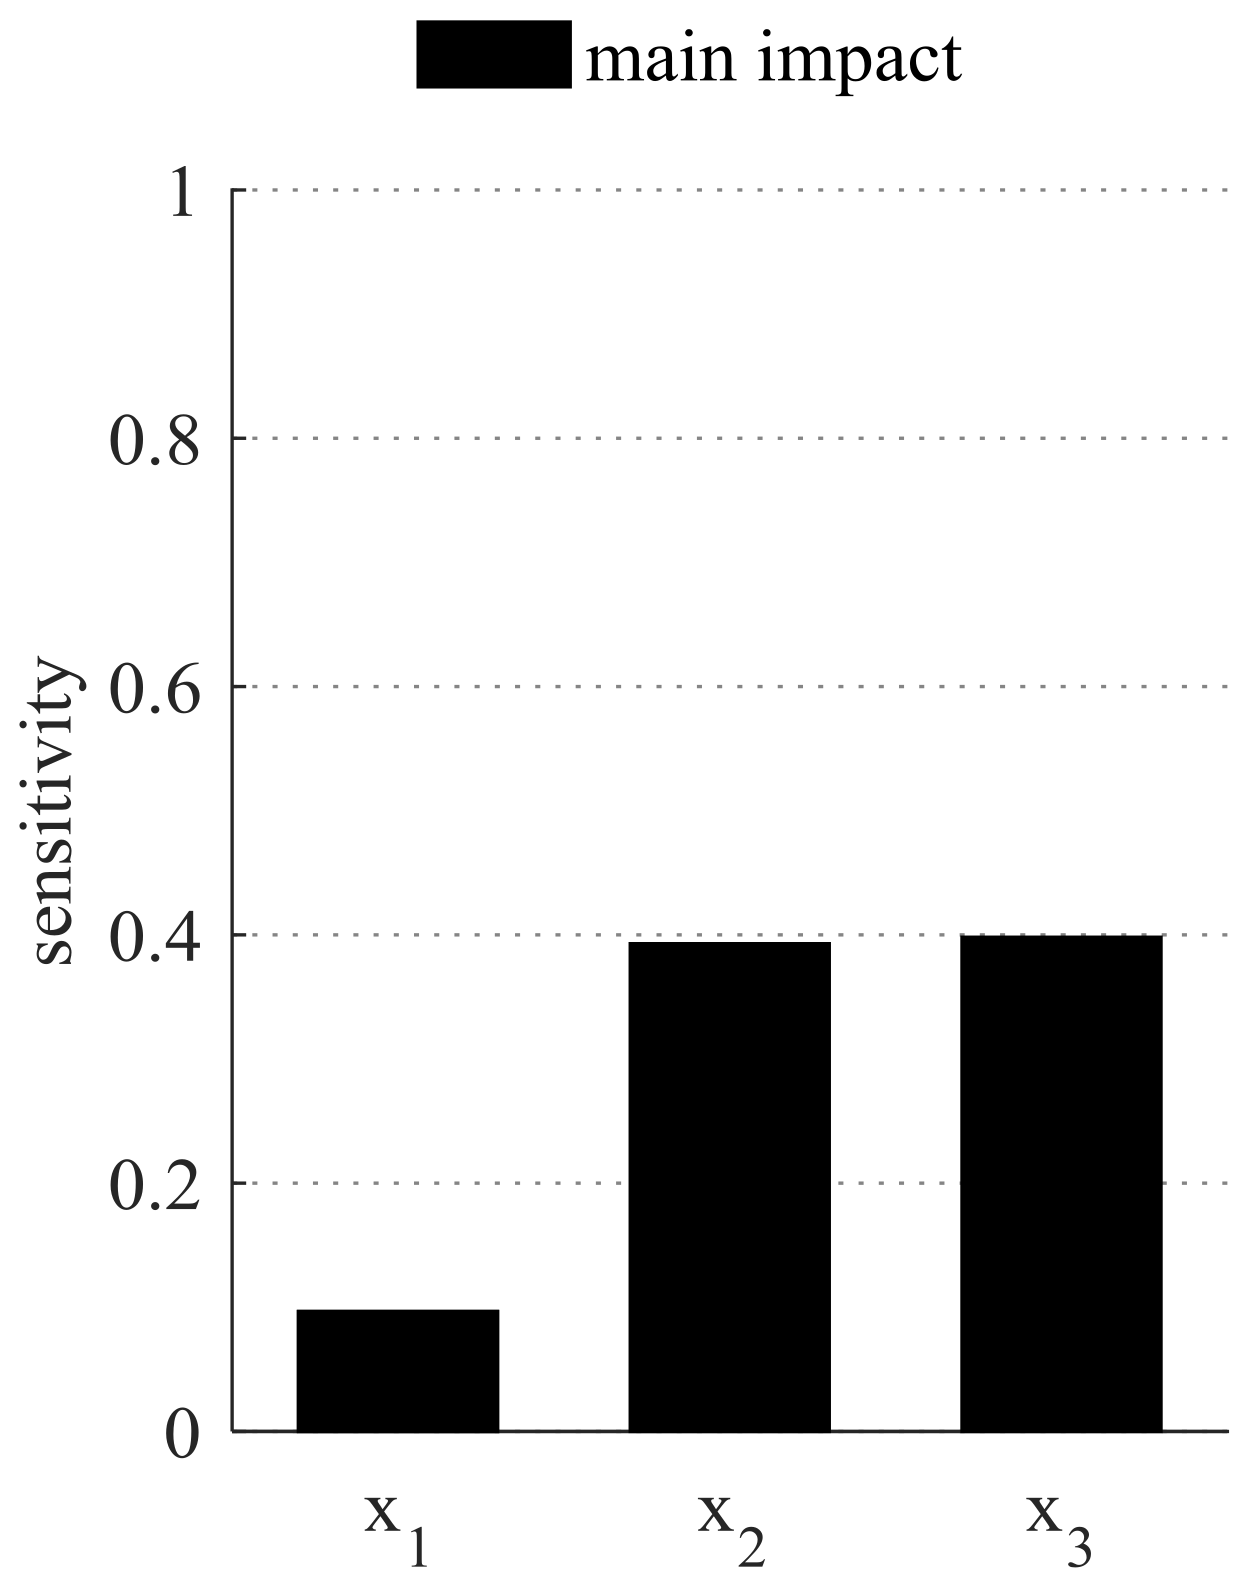
An exemplary demonstration of FAST is given in Equation (4), in which the evaluation criterion
is a function of the design variables
,
and
.
The results in
Figure 3 show the global sensitivity analysis’ outcome for the main impacts of each design variable. It presents that variables
and
have a greater impact on
compared to
. The main reasons for this are the different coefficients in Equation (4), as well as the multiplication of
and
.
3. Experimental Set-Up
The objective of the proposed study is to investigate the impact of certain sizing variables on the required time to accomplish a defined driving profile. An additional investigation aspect is its dependency on various hybrid powertrain topologies. Following the experimental set-up defines the investigation scenario, as well as the design space of sizing variables and powertrain topologies.
The investigation scenario is a challenging driving profile, which is derived from the Nürburgring race circuit [
8]. Accordingly, the required lap time characterizes the evaluation criterion. Furthermore, the achieved lap times shall be reproducible. Thus, the battery’s state of charge and the thermal state of an electric drive have to be almost equal at the beginning and at the end of the given track.
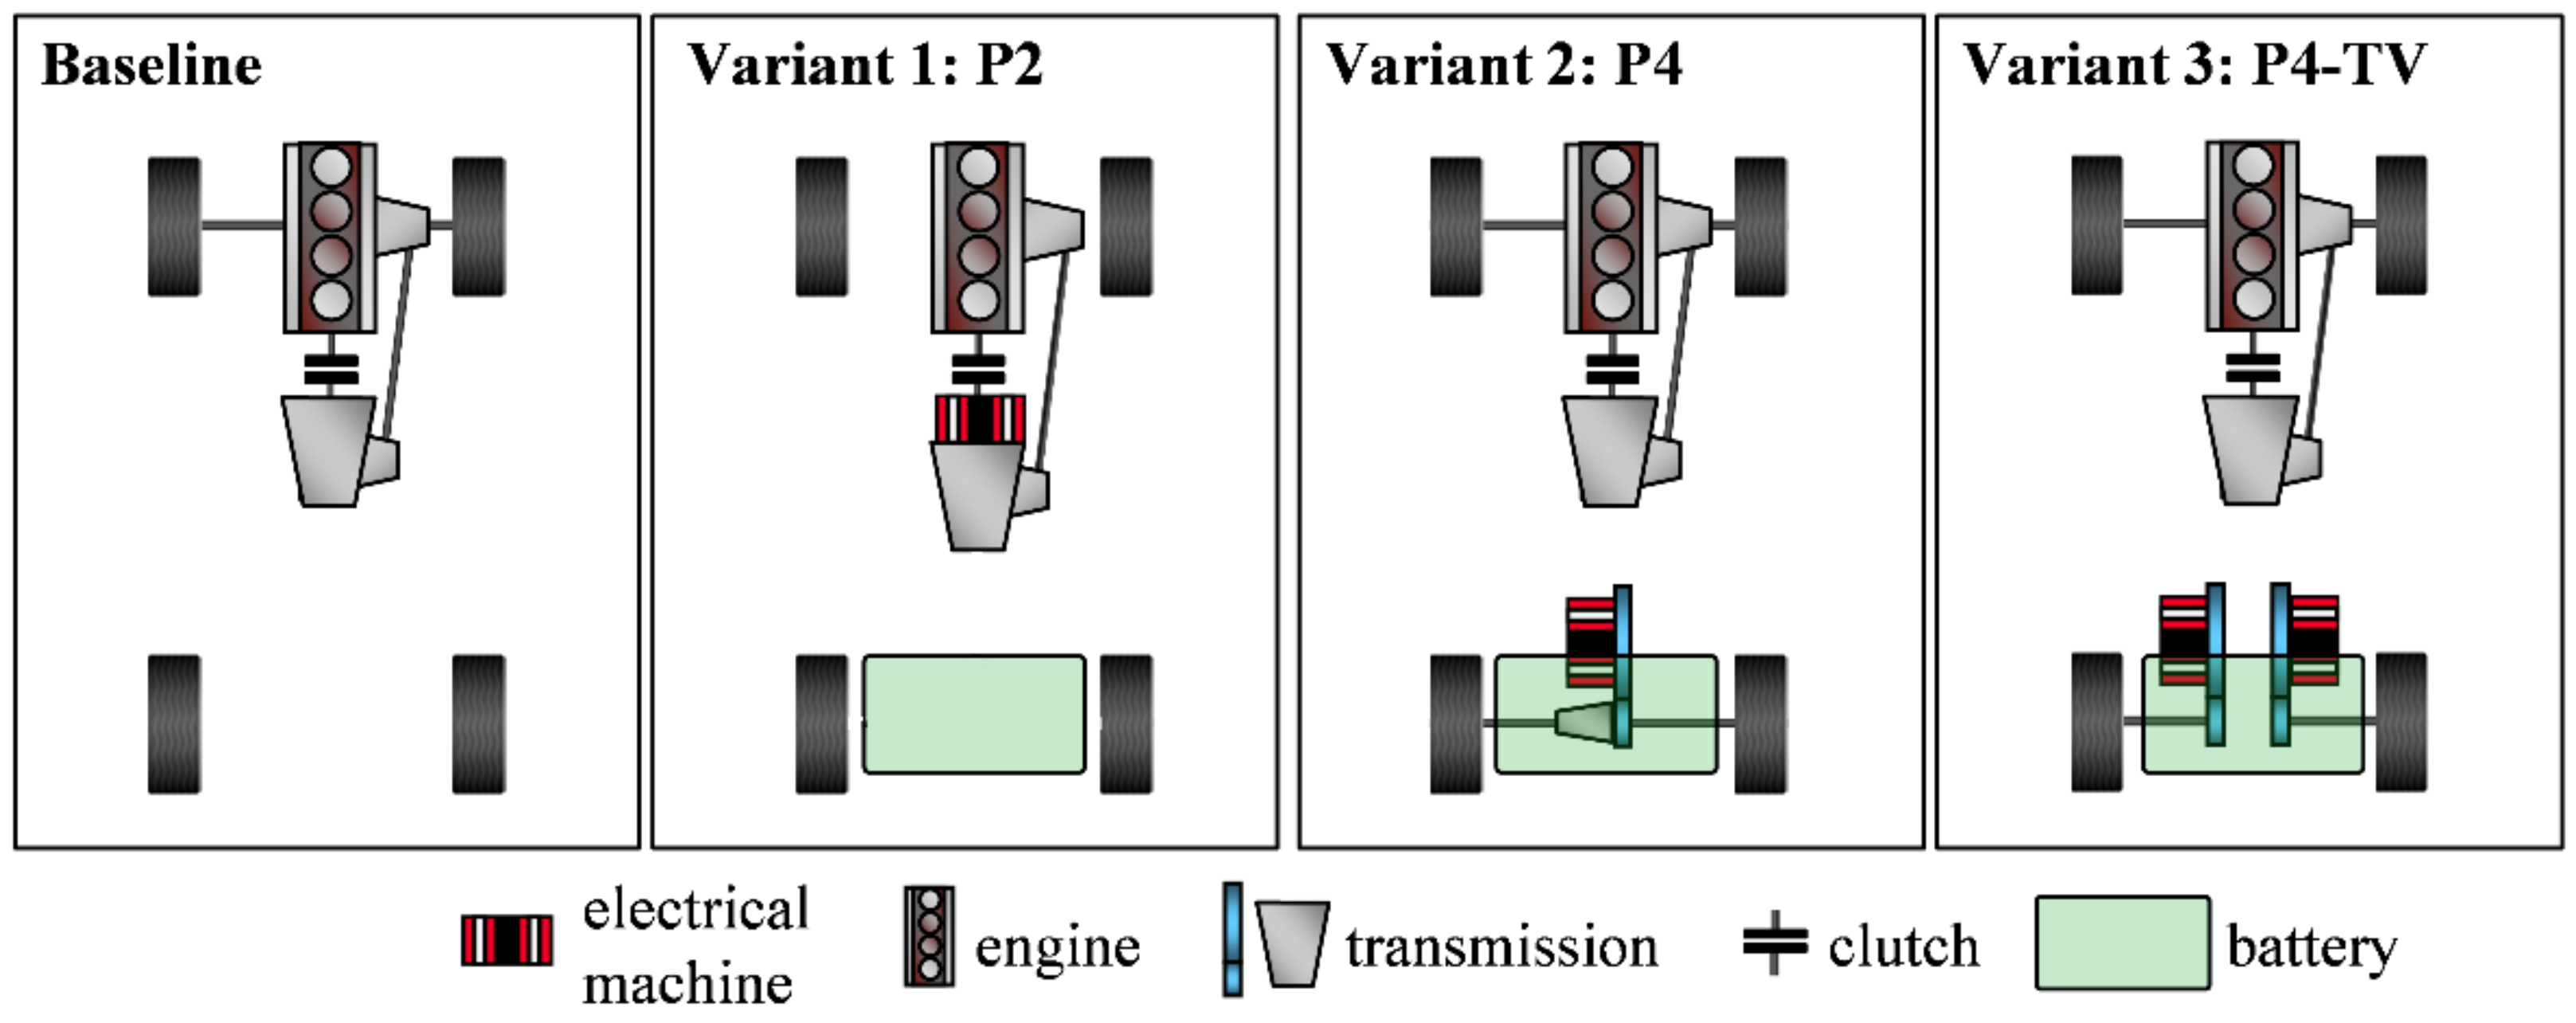
The baseline of this study is a conventional front-wheel-drive vehicle. Its electrification design space includes three different hybrid powertrain topologies and sizing variables in terms of electrical machine and battery.
Figure 4 shows the baseline topology, as well as its electrification towards three different hybrid powertrain topologies.
In Variant 1, the baseline powertrain is extended by an electrical machine, which is integrated between the clutch and transmission. This configuration enables a boost functionality, meaning an addition of an engine and electrical machine torque. Mounting of an electrical machine, together with an additional transmission at the rear axle, characterizes Variant 2. In addition to the boost functionality, this topology is capable of all-wheel-drive. Variant 3 extends Variant 2 through the installation of a single-wheel-drive at the rear axle. This allows free torque distribution between the left and right rear wheels. This so-called torque vectoring functionality (TV) enables, for instance, the improvement of cornering with regards to driving stability and velocity. According to [
9], these introduced hybrid powertrain topologies are labelled as P2, P4 and P4-TV. These labels are used in further work. For all these variants, a battery is integrated above the rear axle.
All these topology variants are equipped with the same engine, which is specified to a maximum power of 185 kW and a maximum torque of 400 Nm. A seven-speed gearbox connects this engine to the differential of the front axle. The sizing variables’ design space is summarized in
Table 1. It includes sizing variables, which affect the dimensions of the electrical machine and battery.
The sizable variables of the electrical machine are the maximum and continuous power (, ). The design space of the maximum power ranges from 20 to 250 kW. Continuous power is defined as a function of the maximum power and is sizable from 20% to 80% of the maximum power. The possible overload time () of the power is set to 10 s. A value of 350 Nm is defined for the maximum torque () and a value of 200 Nm for the continuous torque (). Regarding the P4-TV topology, these electrical machine values correspond to the sum of two single electrical machines. The maximum speed of the electrical machine is limited to the maximum speed of the engine in terms of the P2 topology ( 6500 rpm). In terms of the P4 and P4-TVtopology, a value of 15,000 rpm is selected for the maximum speed of the electrical machine and, additionally, for performance optimal gear ratios for the electric drive transmission. Regarding battery, the maximum energy content () is sizable in a range from 0.2 to 20 kWh.
For the masses of the components battery (
) and electrical machine (
), basic functions are postulated in Equations (5) and (6).
Due to these functions, the electrical machine and battery mass result from the sizing of continuous power, continuous torque, energy content and coefficients
. For the application in this study, the coefficients are derived from a specific Li-ion battery [
10] and electrical machine design [
11], respectively.
4. Study’s Outcome and Discussion
Outcomes of the performed study are the lap time sensitivity of the variable’s maximum power, continuous power and energy content dependent on the hybrid powertrain topology. Firstly, the resulting main impacts are presented, which are generated using FAST. Secondly, the conducted local sensitivity analyses are discussed to reveal the lap time impact of each sizing variable individually and to consequently derive an understanding of the results generated by FAST.
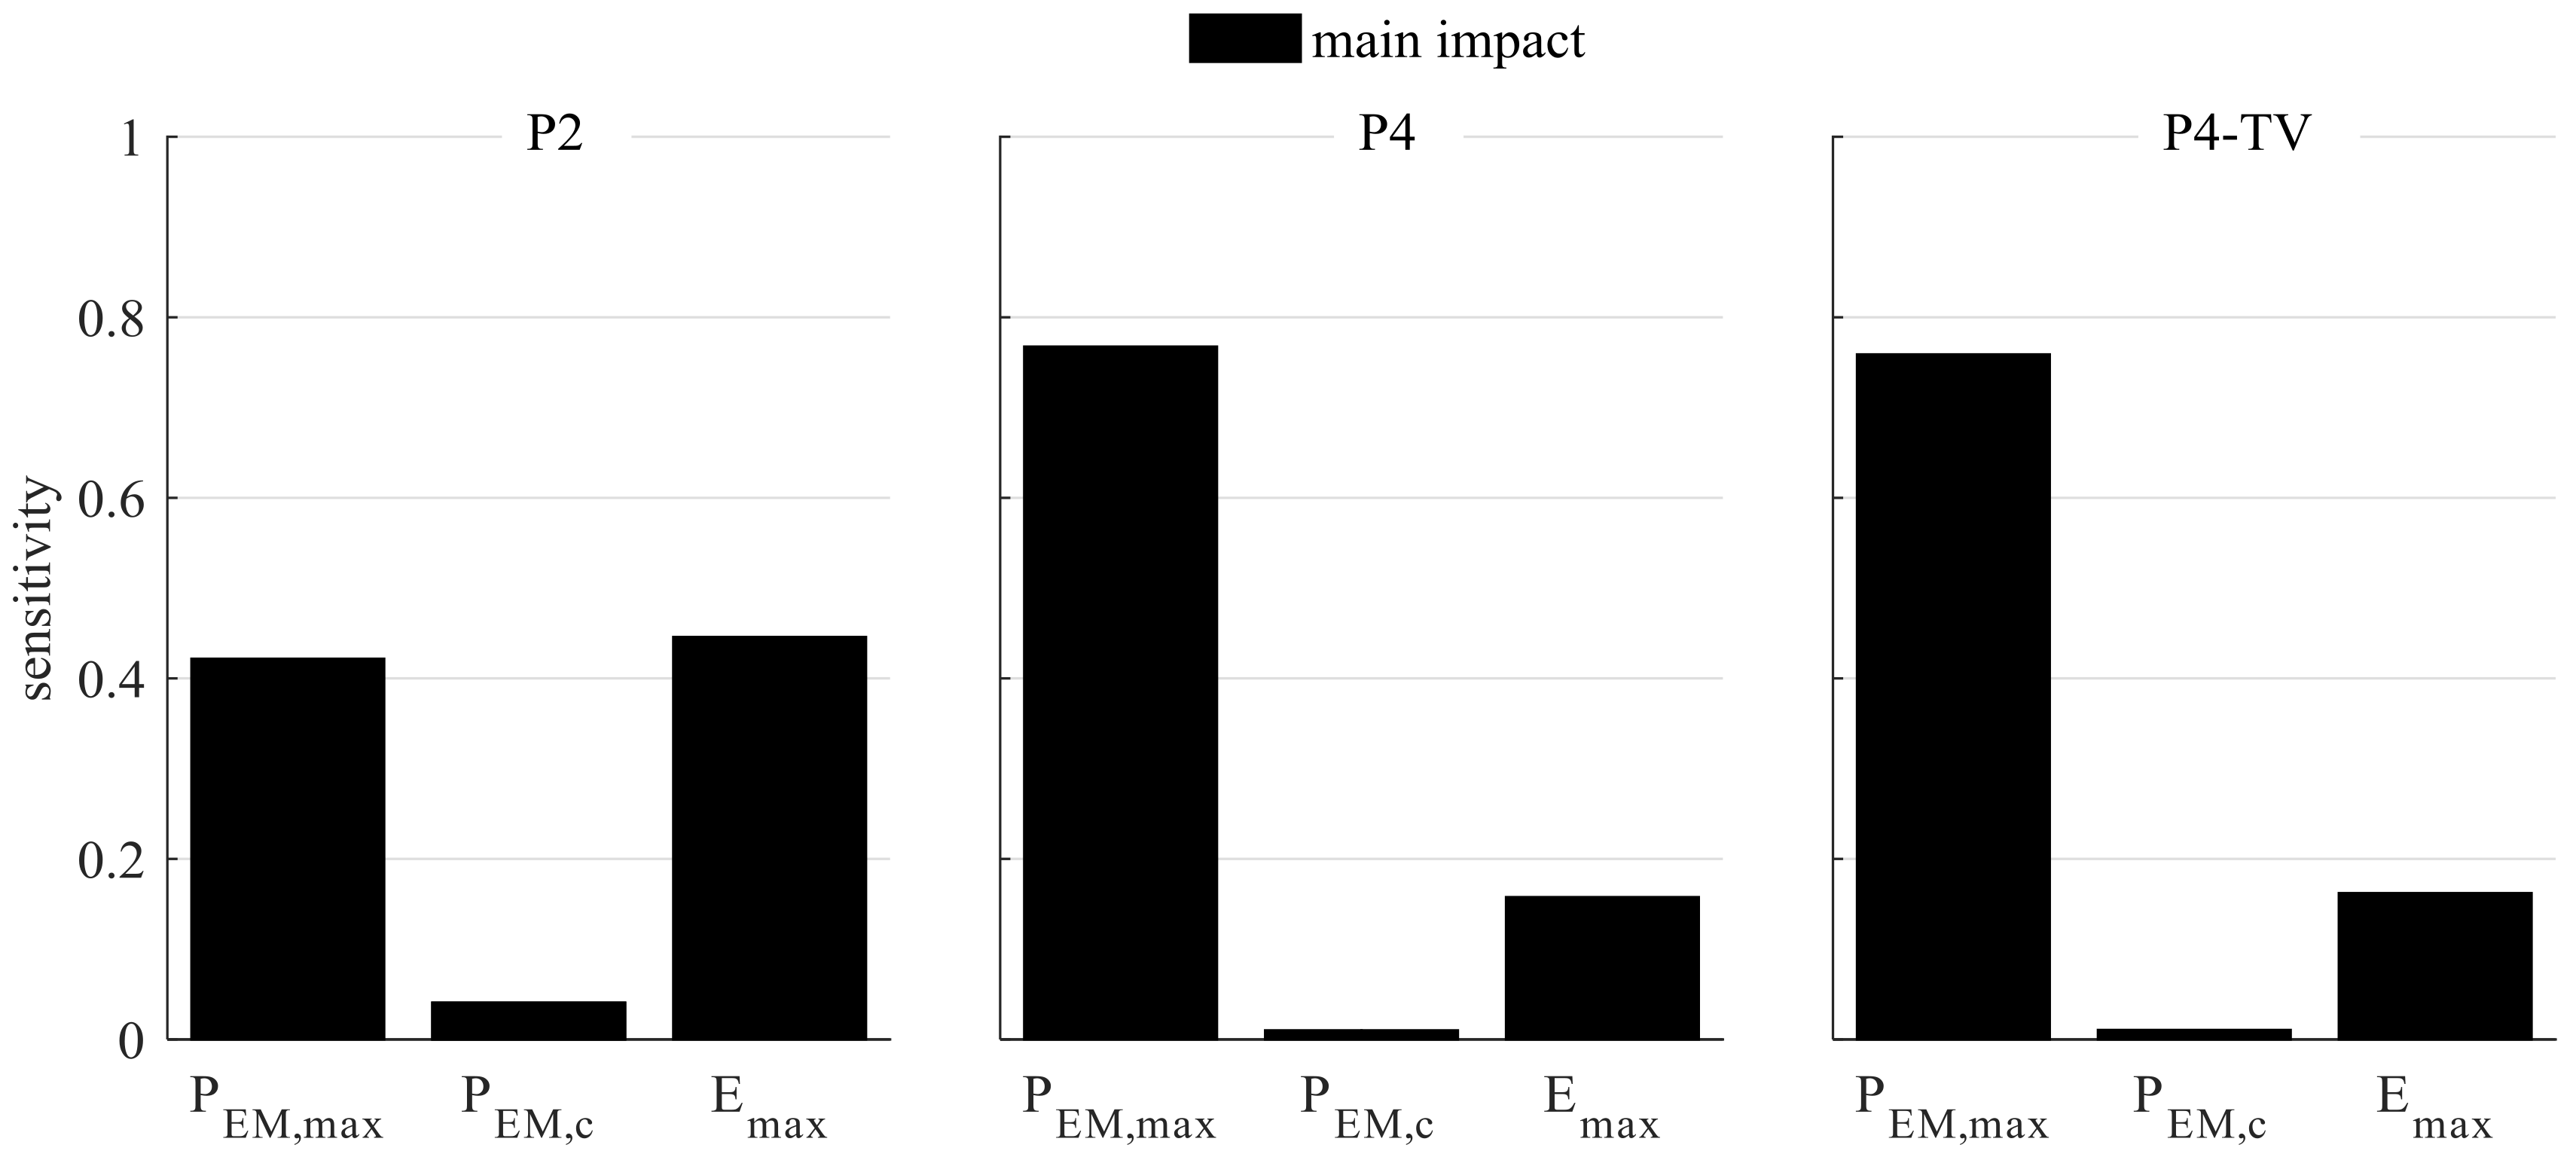
Figure 5 demonstrates the outcomes of the global sensitivity analysis from the application of FAST. It shows the sizing variables’ specific impacts for the three selected hybrid powertrain topologies: P2, P4 and P4-TV.
The left diagram of
Figure 5 contains the FAST analysis for the P2 topology. Its
and its
reveal the largest main impacts on the lap time, with values above 0.4. The impact of the
is, with a value of 0.04, comparatively small. For the P4 and P4-TV topology, the FAST outcomes are shown in the middle and right diagrams. As can be seen from these diagrams, the outcomes unveil similar main impacts for both topologies. Their
has the largest influence on the lap time.
has the second largest impact and
has the smallest. From comparing FAST’s outcomes across topologies, it can be seen that the
has an impact greater than about 0.35 on the lap time for the P4 and P4-TV variant than for the P2 variant. The
influences the lap time most for the P2 topology. Compared to that of P2, the main impacts of
are less by half for the P4 and P4-TV topology. In all three hybrid powertrain topologies, the
has a relatively small impact.
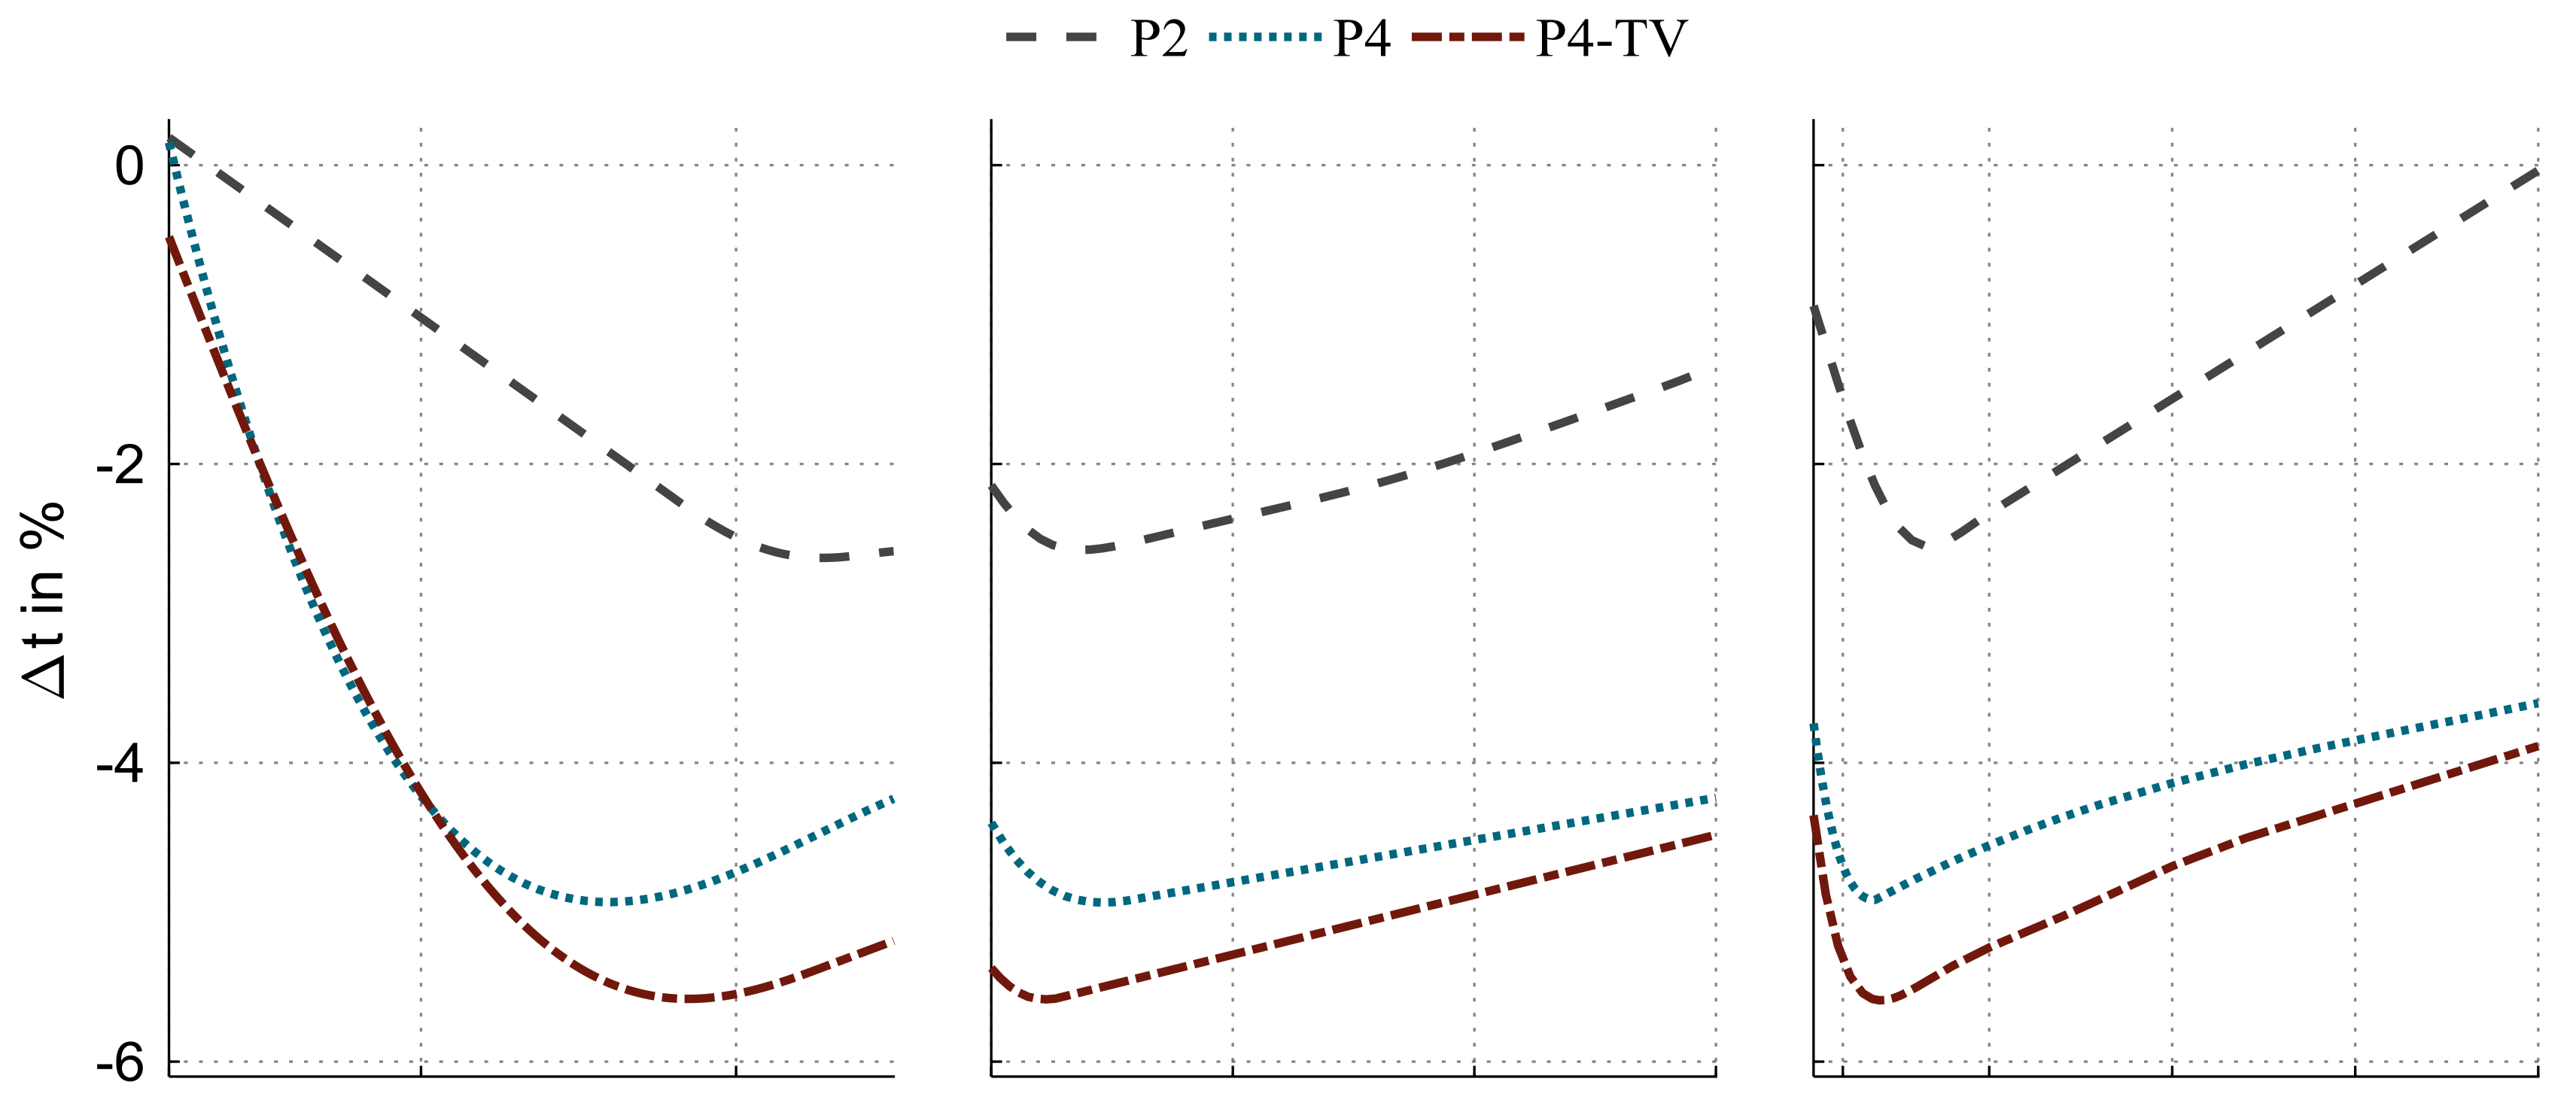
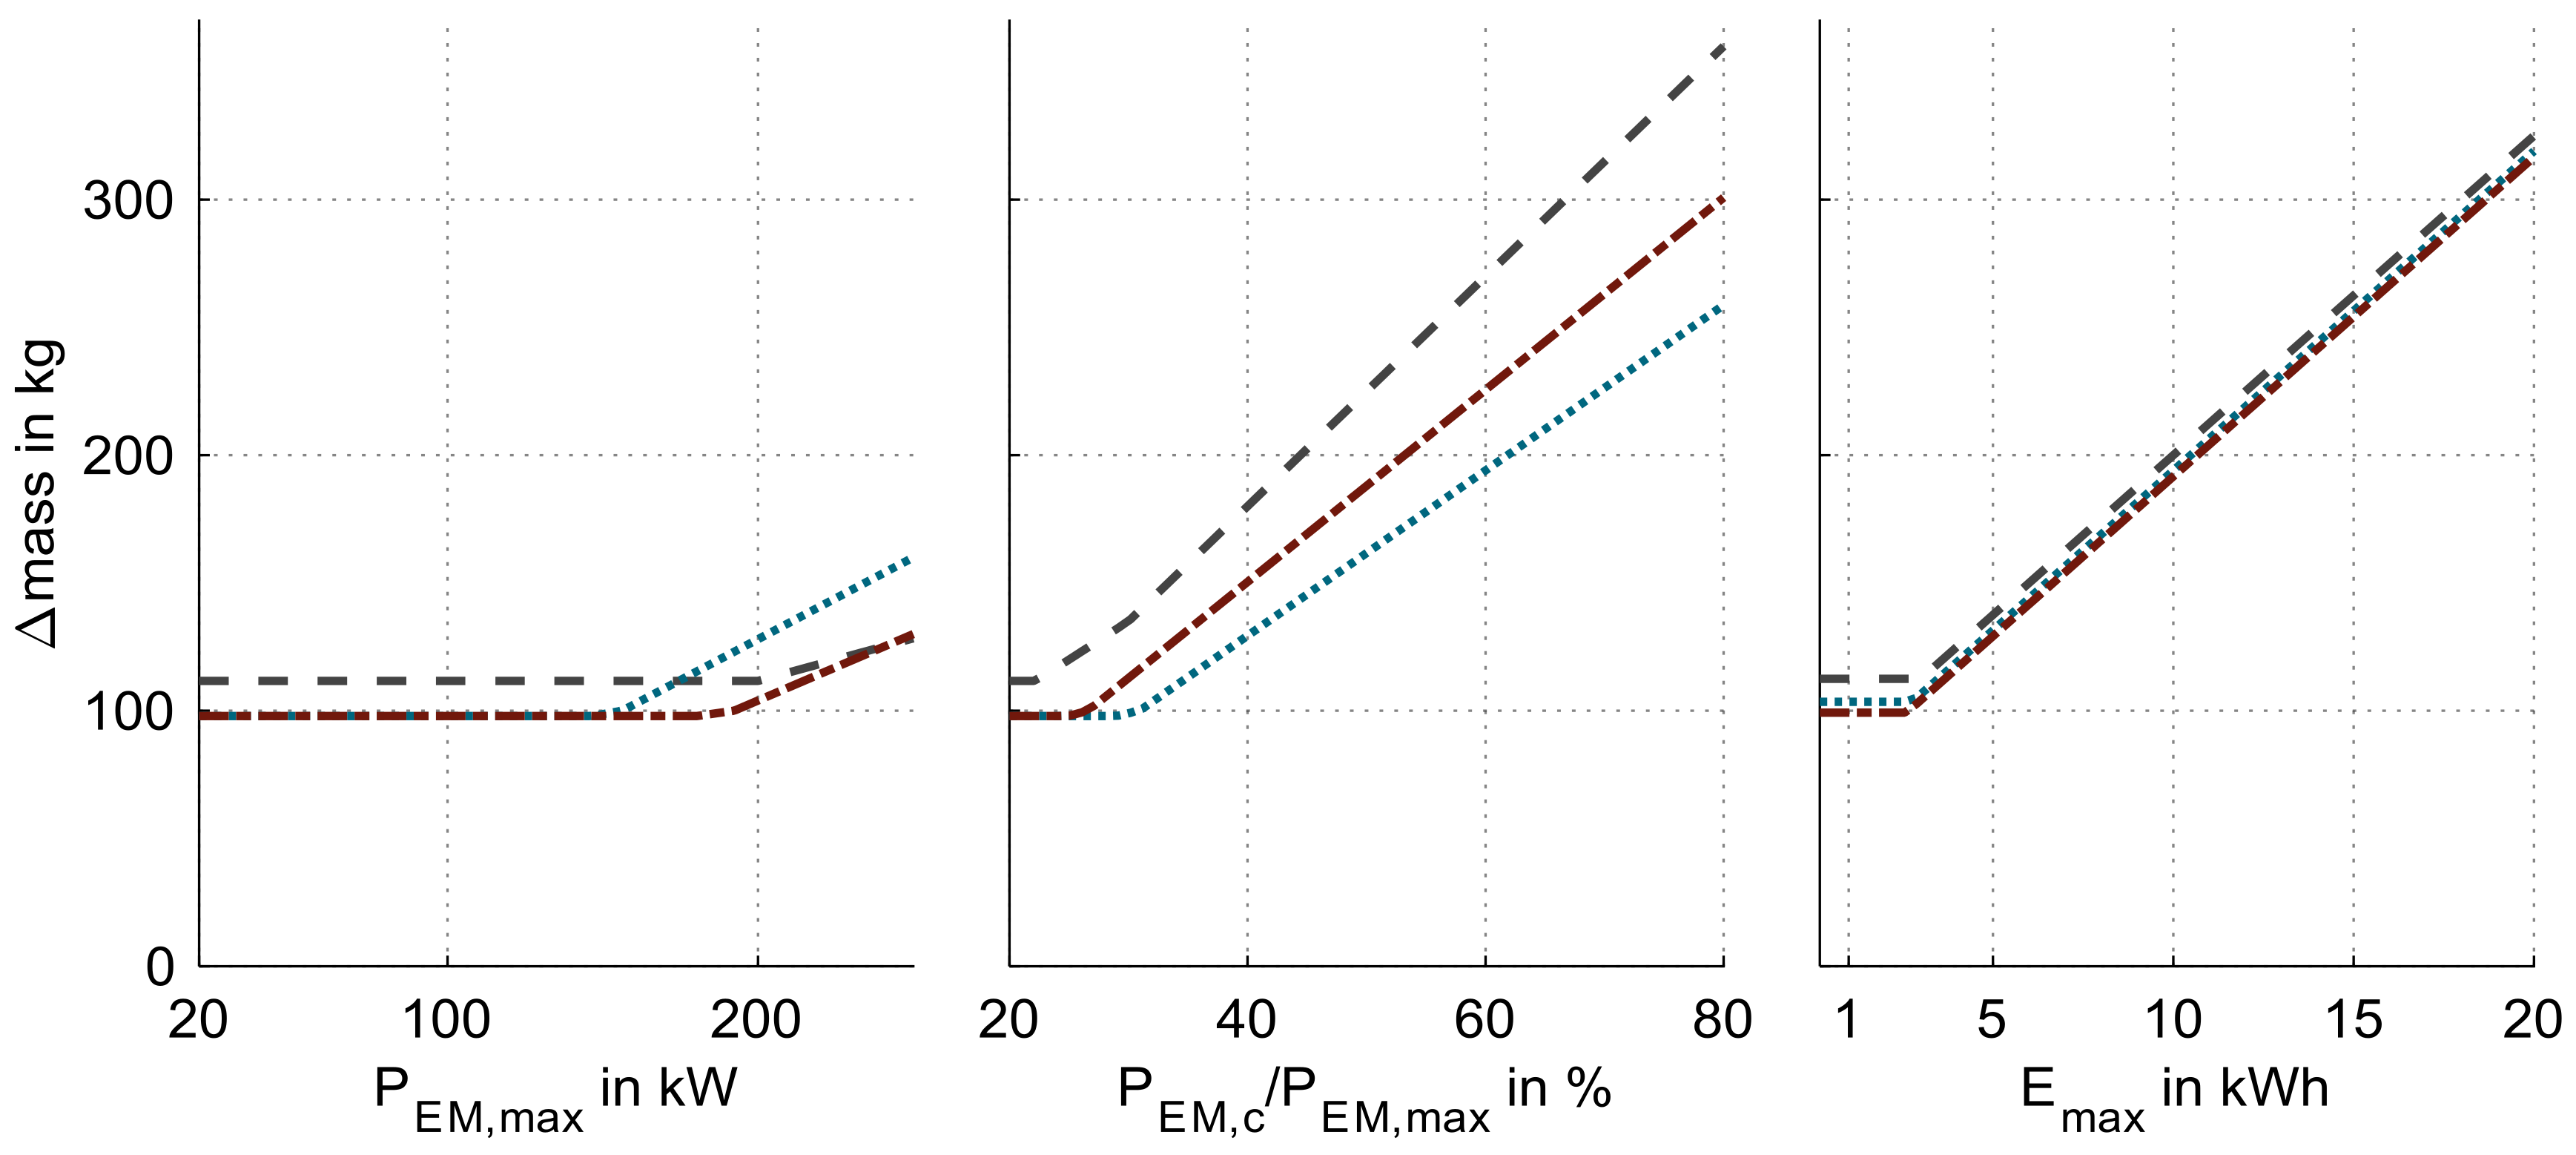
Figure 6 shows the results of the local sensitivity analyses. Every column shows the variation of one single sizing variable. In this scope, other sizing variables are fixed to their identified optimal size. The first row reveals the impacts on the ratio of the lap time to the lap time of the baseline configuration. Negative values imply a lap time improvement. In the second row, vehicle mass modifications are illustrated. Due to different optimal values for the design variables, the mass curves are slightly varying. Different line styles indicate the powertrain topologies.
4.1. Maximum Power or
An increase in results in an enhancement of acceleration and recuperation capability for all three topologies. In terms of recuperation capability, such a power increase enables the regeneration of more energy in each single braking and, consequently, an increase in the availability of electric drive. Consequently, these effects lead to lap time improvements. According to the diagrams, this lap time improvement can be seen up to the point of mass increase. This suggests that the lap time-improving effects of power sizing are not sufficient to compensate for the additional component mass.
Comparison across topologies shows that the FAST’s main impacts regarding are almost twice as big for the P4 and P4-TV topology in comparison with the P2 topology. In relation to the local sensitivity analysis, this is related to the lap time gradients in the range of 20–100 kW. In that range, the P4 and P4-TV designs reveal a gradient twice as big as that of the P2 design. This is because, in the P2 topology, the engine utilizes most of the traction capability at the front wheels. Due to that, the electrical machine can only add torque if the engine is not completely utilizing the available traction at the front wheels. In contrast, the P4 and P4-TV topologies’ electrical machine is able to utilize the entire traction capability of the rear wheels. Furthermore, the P4-TV variant can utilize the traction of each rear wheel separately due to torque vectoring functionality. On this basis, the P4-TV topology outperforms the P4 topology for maximum power sizing above 120 kW. This local difference is not represented in the global sensitivity analysis. This implies that this local difference is not effective in the global solution space to this extent.
4.2. Continuous Power or
All three topologies reveal an optimal
which is approximately 25% to 30% of the
. Smaller sizing results in functional restrictions and greater sizing in overdimensioning. Overdimensioning is the mass increase of components without functional benefit.
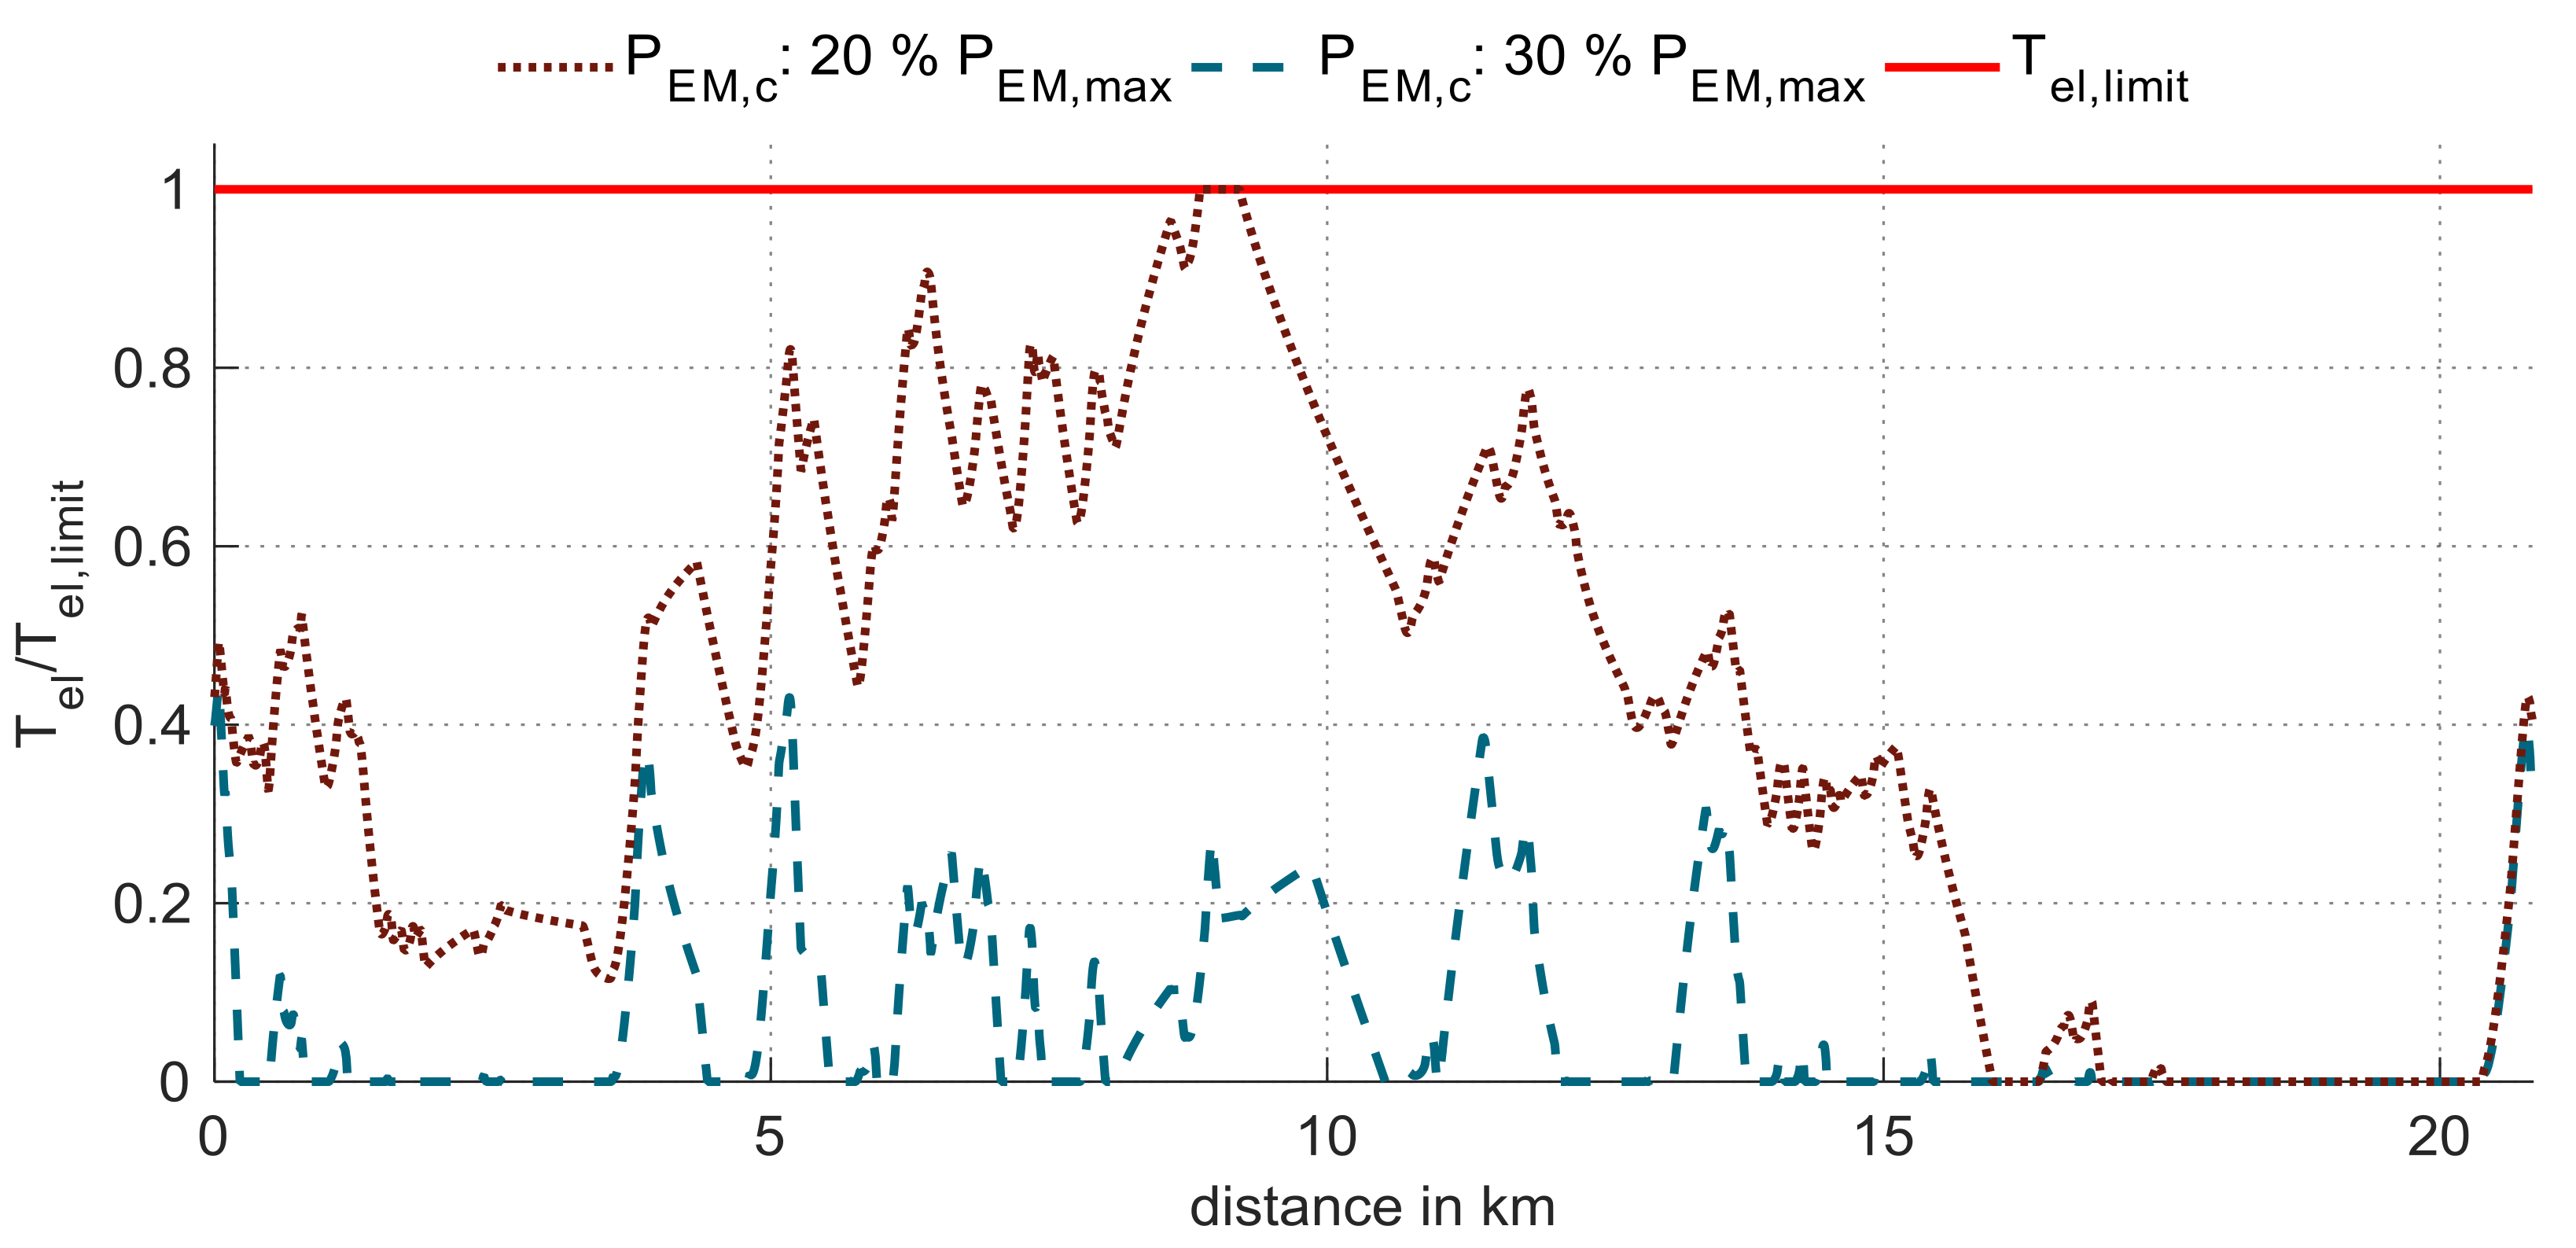
Figure 7 demonstrates the cause for those two effects. It shows the normalized thermal load (
) of the electrical machine for two different continuous power sizings of the optimal P4 design (
). This thermal load variable is a compensatory variable in control strategy optimization. It occurs when power is applied above the continuous power.
The diagram illustrates the normalized curves of the thermal load over distance for two different sizings of
. These curves result from the optimization of the control strategy. For a sizing of continuous power that is 20% the maximum power, the thermal load requires the entire permissible range. Furthermore, the thermal load meets its limit at approximately 8 km. Due to these aspects, restriction of the electric drive operation is concluded. An increase in continuous power to 30% that of the maximum power solves this restriction. The associated profile shows no contact points with the thermal limitation. Furthermore, the utilized range of the thermal load decreases. This resulting thermal degree of freedom enables more frequent and longer operation of the electric drive. Hence, the power throughput rises from 2.8 to 3.3 kWh and, exemplarily, the lap time improves from −4.5 to −5% (
Figure 5). A further increase in
does not lead to any additional enhancement. It just causes increasing component masses, which is a reason for lap time decreases.
For all three topologies, the local sensitivity analyses show similar curves at different levels. For higher continuous power sizing, the P2 topology has a slightly higher gradient than the other two topology variants. One reason for this is a higher increase in mass. In relation to the FAST analysis, this difference in gradients correlates with the different main impacts. Thus, the P2 topology presents a slightly larger main impact for continuous power sizing compared to the P4 topology and P4-TV topology.
4.3. Energy Content or
Sizing of the
influences the lap time by defining the maximum depth of the discharge level, as well as its dependence on the battery mass. In the same way as with continuous power sizing, values below optimal ones cause functional restrictions and values above optimal ones affects mass increases without functional benefits.
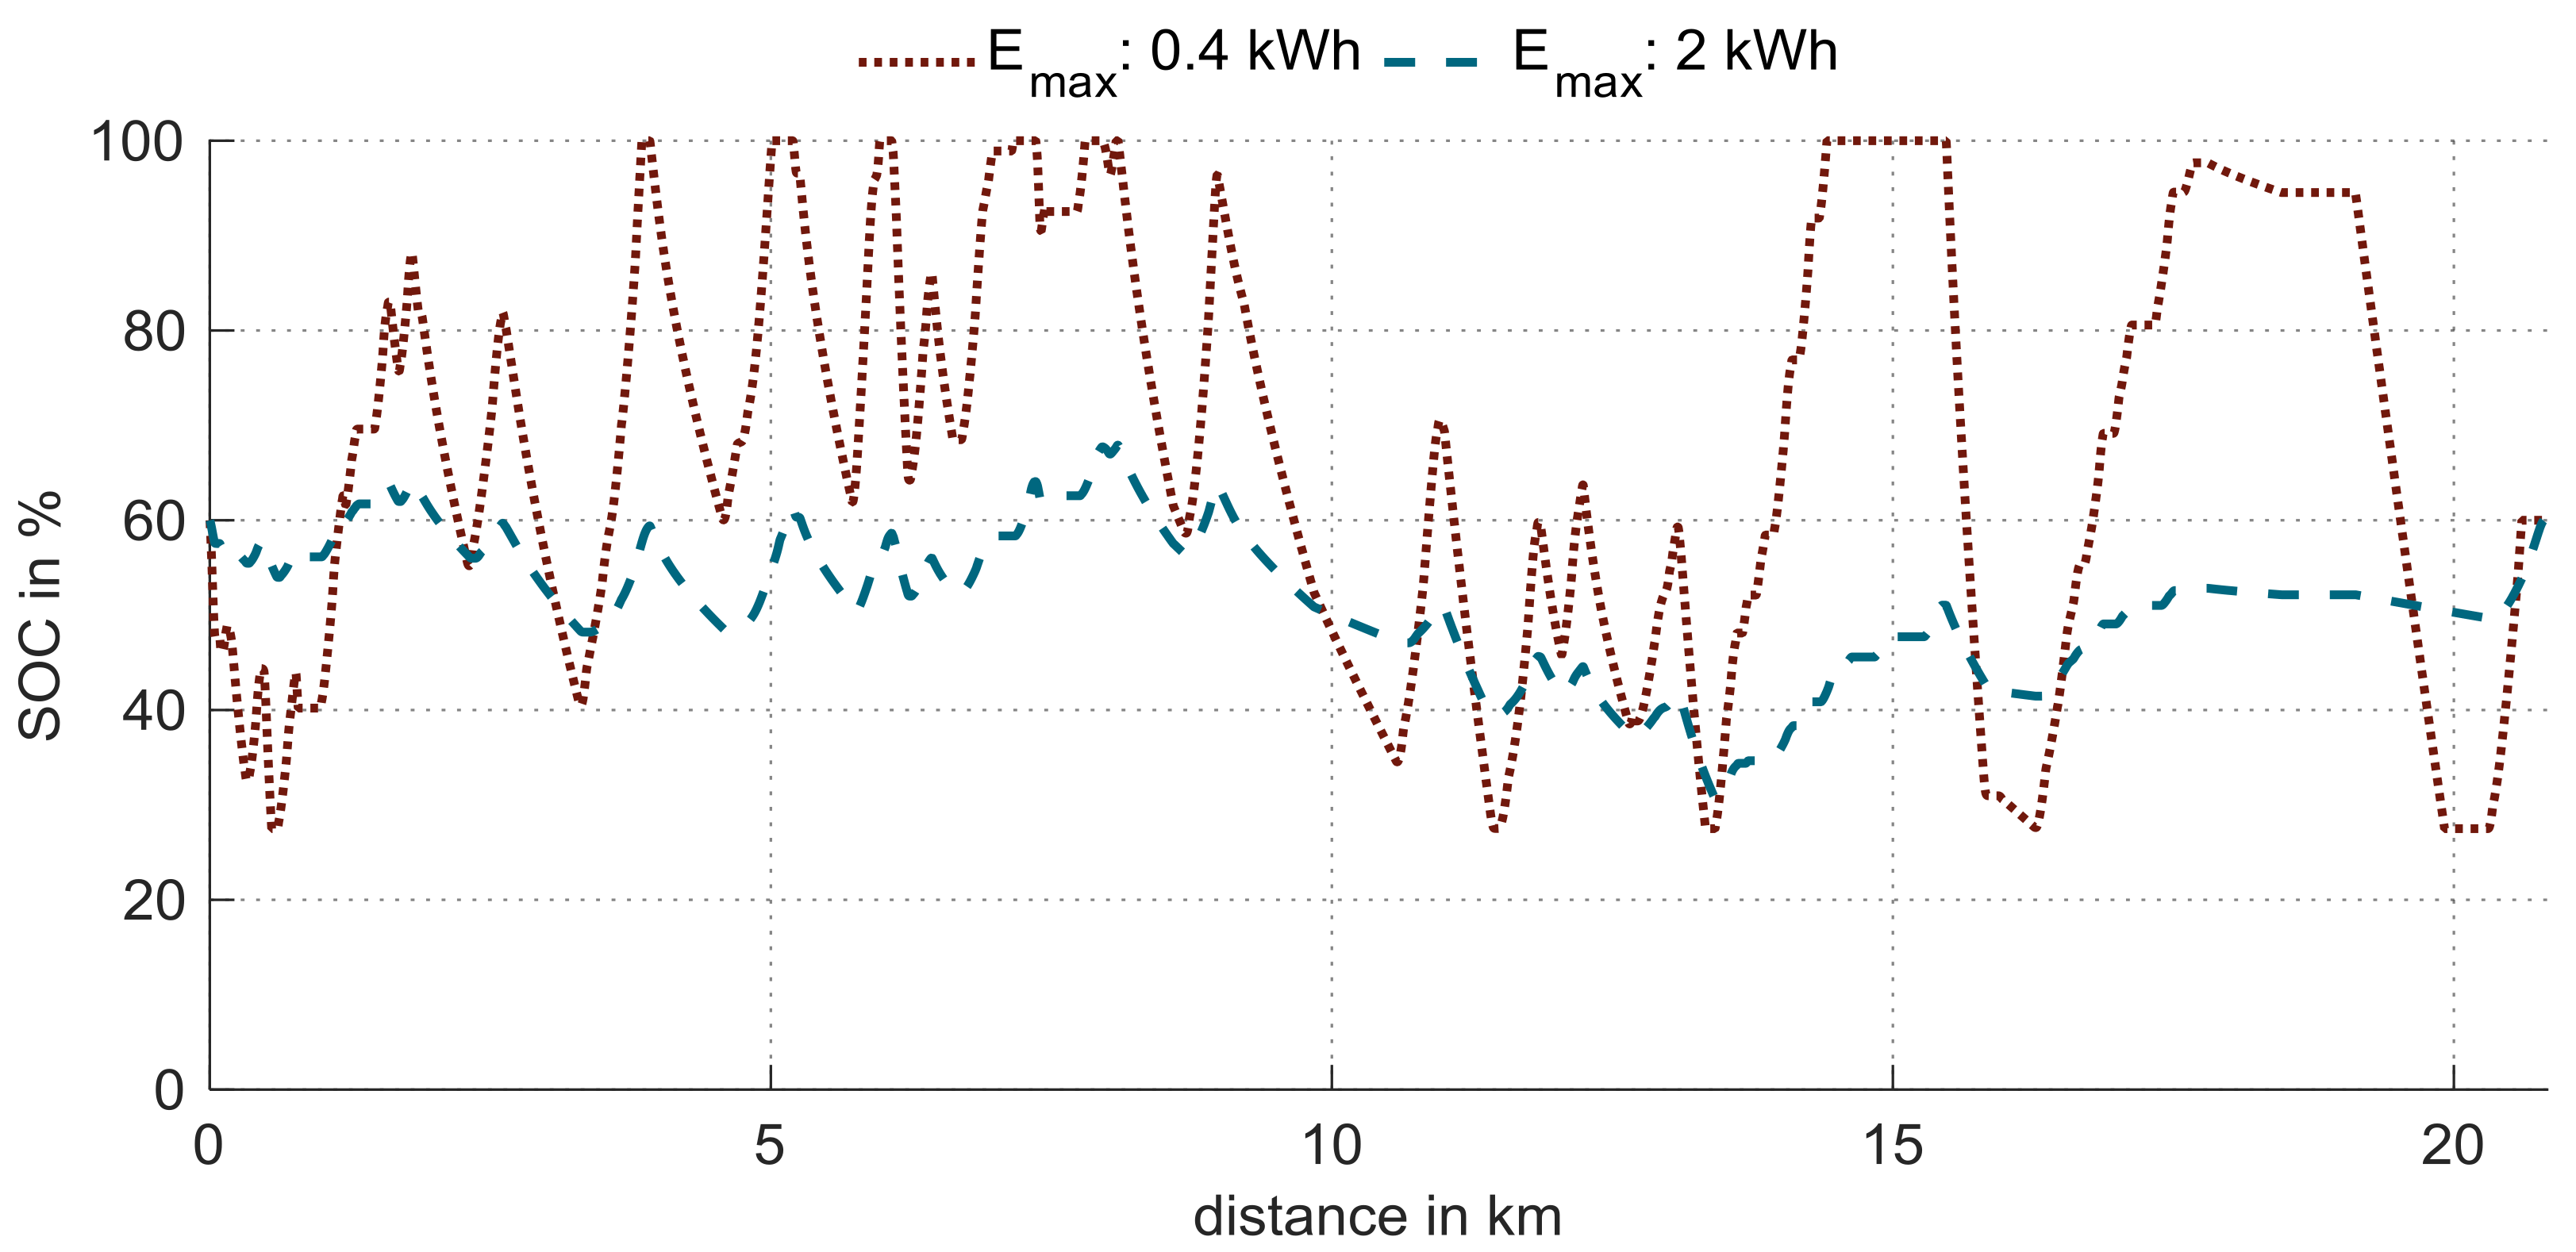
Figure 8 points out this functional restriction. The diagram contains the state of charge (SOC) over distance of two different energy content sizings of the optimal P4-TV design (
). The initial SOC is set to 60% for each energy content variation.
For the defined investigation scenario, Nürburgring, the boundary condition of reproducible lap times is set. Accordingly, just as much electric energy can be applied, as it can be recuperated over the track. Therefore, a restriction of recuperation limits the availability of the electric drive and, thus, limits the lap time. Such restrictions reveal the variant with a 0.4 kWh sizing of
. This is indicated by several plateaus at 100% SOC, which represents a fully charged battery. Consequently, no additional energy is recoverable at these track sections. For the variant with 2 kWh sizing, a limitation of the energy recovery is not recognizable. Compared to the 0.4 kWh sizing, the lap time improves from −5% to −5.7% (
Figure 5). A further increase in energy content results exclusively in a growing battery mass and, thus, in over dimensioning with decreasing lap times.
Across topologies, energy content sizing has the largest main impact on P2 topology. This is also represented in the local sensitivity analyses, since the P2 variant reveals higher gradients than the P4 and P4-TV variants. This higher gradient appears in sizings above 3 kWh, although the mass increase of the battery is approximately equal for all three topologies. A reason for the different gradients results from the interaction of the battery positioning and the powertrain topology. Due to the integration of the battery at the rear axle, a battery mass increase causes a shift in the centre of gravity towards the rear axle. This shift effects a reduction of the traction capability at the front wheels. Hence, this cause-effect relationship has a greater influence on the front-wheel-drive P2 variant than the all-wheel-drive capable P4 and P4-TV variants.
4.4. Sizing Variables within Each Topology
Within the individual topologies, the lap time’s curves in the local sensitivity analyses confirm the main impact results of FAST. For that, the local range and the gradients are utilized as indicators of the local sensitivity analyses. Therefore, the differences between the minimum and maximum of each lap time curve defines the local range. In terms of P2 topology, the and show the largest local ranges. Furthermore, the sizing of reveals greater gradients than the other two sizing variables. In conclusion, these aspects correlate with the main impacts of FAST. Within the P4 and P4-TV topology, the largest local range and main impact is recognizable for . The sizing of and display almost equal local ranges. A difference for these two variables appears when sizing towards small values. In that case, the curves of energy content show higher gradients than the curves of continuous power. That refers to the larger main impacts of compared to .
5. Conclusions
Within this paper, a method to quantify variable specific impacts of powertrain electrification on driving dynamics is introduced and applied. The application elucidates the correlations between various electrical machine and battery sizing variables, three different hybrid powertrain topologies and the required lap time for the Nürburgring race circuit. To achieve this, the main impacts, identified by FAST, are analysed in detail by local sensitivity analyses and additional examinations for defined designs.
In terms of the system design of an electrified powertrain, this method supports the identification of design relevance in an early stage of development. In addition to the main impact of the design variable, there are interactions between the single design variables. The presented method applying of FAST can be extended to quantify these interactions. This will be addressed in future works.


