Article

Development of a Dual-Mode Measurement and Control System with Energy Feedback Optimization for a Retrofitted NEV Powertrain Dynamometer


by
Zimou Chen
* and
Zhe Wang
School of Automotive Engineering, Changchun Technical University of Automobile, Changchun 130013, China
*
Author to whom correspondence should be addressed.
World Electr. Veh. J. 2026, 17(9), 476; https://doi.org/10.3390/wevj17090476
Submission received: 18 July 2026 / Revised: 28 August 2026 / Accepted: 6 September 2026 / Published: 9 September 2026
(This article belongs to the Section Propulsion Systems and Components)

Abstract

Retrofitting an internal combustion engine (ICE) dynamometer test bench for electric motor testing introduces significant measurement and control challenges. The two modes differ fundamentally in torque dynamics, communication protocols, and energy flow characteristics. This study presents a dual-mode measurement and control system for a retrofitted 250 kW test bench. The system retains ICE testing capability while adding motor testing through a shared LabVIEW interface. Three key technical problems are addressed: (i) a cross-mode PID controller with gain scheduling and bumpless mode switching; (ii) a wavelet-based dual-sensor torque fusion method using complementary filtering at a 50 Hz crossover frequency; and (iii) active front end (AFE) energy feedback optimization with quadrant-dependent DC bus voltage setpoints. Validation was performed on an 80 kW (240 kW peak) interior permanent magnet synchronous motor (IPMSM) across 823 operating points. The system achieved a peak system efficiency of 94.88%. Energy recovery efficiency improved from 58% to 82% through AFE parameter optimization. The proposed methodology offers a cost-effective template for extending existing ICE test infrastructure to support electric vehicle powertrain development.

1. Introduction

The global market share of electric vehicles (EVs) has grown substantially over the past decade, with global EV sales exceeding 17 million units in 2024 (approximately 20% of total vehicle sales [1]) and projections exceeding 30% by 2030. This rapid electrification has created two parallel demands for testing infrastructure: existing internal combustion engine (ICE) test facilities must be preserved for legacy and hybrid vehicle development, while new electric drive testing capabilities must be established. Meeting both demands is especially challenging for vocational and technical education institutions, whose single-mode ICE test benches are built for teaching and lack dual-mode measurement and control capabilities. In China alone, thousands of ICE dynamometer test benches remain in active use, yet relatively few have been retrofitted for dual ICE–electric motor operation. A systematic, reproducible retrofit methodology therefore holds great practical significance and broad application value.
The measurement and control system is the most critical subsystem in powertrain testing. It governs data acquisition fidelity, control loop performance, operator interface usability, and safety interlock reliability. When retrofitting an ICE dynamometer for dual-mode operation, the control system must accommodate fundamentally different physical processes. ICE testing involves combustion-driven torque with slow dynamics and well-characterized harmonics. Motor testing involves inverter-driven torque with high-bandwidth dynamics and pronounced electromagnetic interference (EMI) [2].
Previous research on motor test benches has largely assumed greenfield construction. He [3] developed a LabVIEW-based permanent magnet synchronous motor (PMSM) test bench using a PXI real-time controller with modular sub-VI architecture. This design effectively decoupled the user interface, configuration, and data acquisition functions. Endress and Bragard [4] presented a flexible test bench for automated recording of motor efficiency maps. Schupbach and Balda [5] developed a versatile motor test bench with regenerative loading capability. However, these studies did not address the specific challenges of adapting existing ICE control systems to motor testing, particularly harmonic interference compensation and control algorithm migration.
The energy efficiency aspect of dynamometer testing has received increasing attention. Boldea et al. [6] analyzed energy flow in motor test systems and demonstrated that regenerative configurations can recover 70–85% of input test energy. Dhote et al. [7] evaluated test bench setups for emulating electric vehicle on-road conditions. Roy and Bandyopadhyay [8] investigated regenerative braking with a PMSM drive on a dynamometer test bench emulating EV load profiles. Yet optimizing energy feedback strategies when transitioning from ICE to motor test modes on a shared test bench remains underexplored.
Despite these advances, a critical gap remains. No documented, reproducible methodology exists for retrofitting an existing ICE dynamometer test bench into a dual-mode platform that supports both ICE and motor testing with validated measurement accuracy and energy efficiency. Prior studies fall into three categories. Some assume greenfield construction with full freedom of hardware specification [3]. Others focus on a single technical subsystem, such as energy regeneration [6] or torque and speed measurement on electric machine test benches [9]. Still others evaluate PMSM efficiency on purpose-built motor dynamometers without the dual-use constraint.
This paper presents a complete dual-mode measurement and control system developed and validated on a retrofitted 250 kW test bench. The principal contribution is a documented, reproducible integration path for upgrading an ICE-only cell to a dual-mode test bench. First, a layered LabVIEW software architecture with modular sub-VI design integrates ICE and motor testing within a unified operator interface. Second, a wavelet-based dual-sensor torque fusion method reduces root-mean-square (RMS) torque noise by 90%. Third, an energy feedback optimization strategy improves recovery efficiency from 58% to 82%. All proposed methods are experimentally validated across 823 operating points, yielding a peak system efficiency of 94.88%.
The remainder of this paper is organized as follows. Section 2 presents the system architecture, including the hardware platform, the software architecture, and the dual-mode operation logic. Section 3 describes the three key technical solutions: cross-mode control migration, multi-sensor signal fusion, and energy feedback optimization. Section 4 reports the experimental results, including the external characteristic test, efficiency MAP generation, temperature rise analysis, and insulation monitoring verification. Section 5 concludes the paper and outlines future work.

2. System Architecture

2.1. Hardware Platform

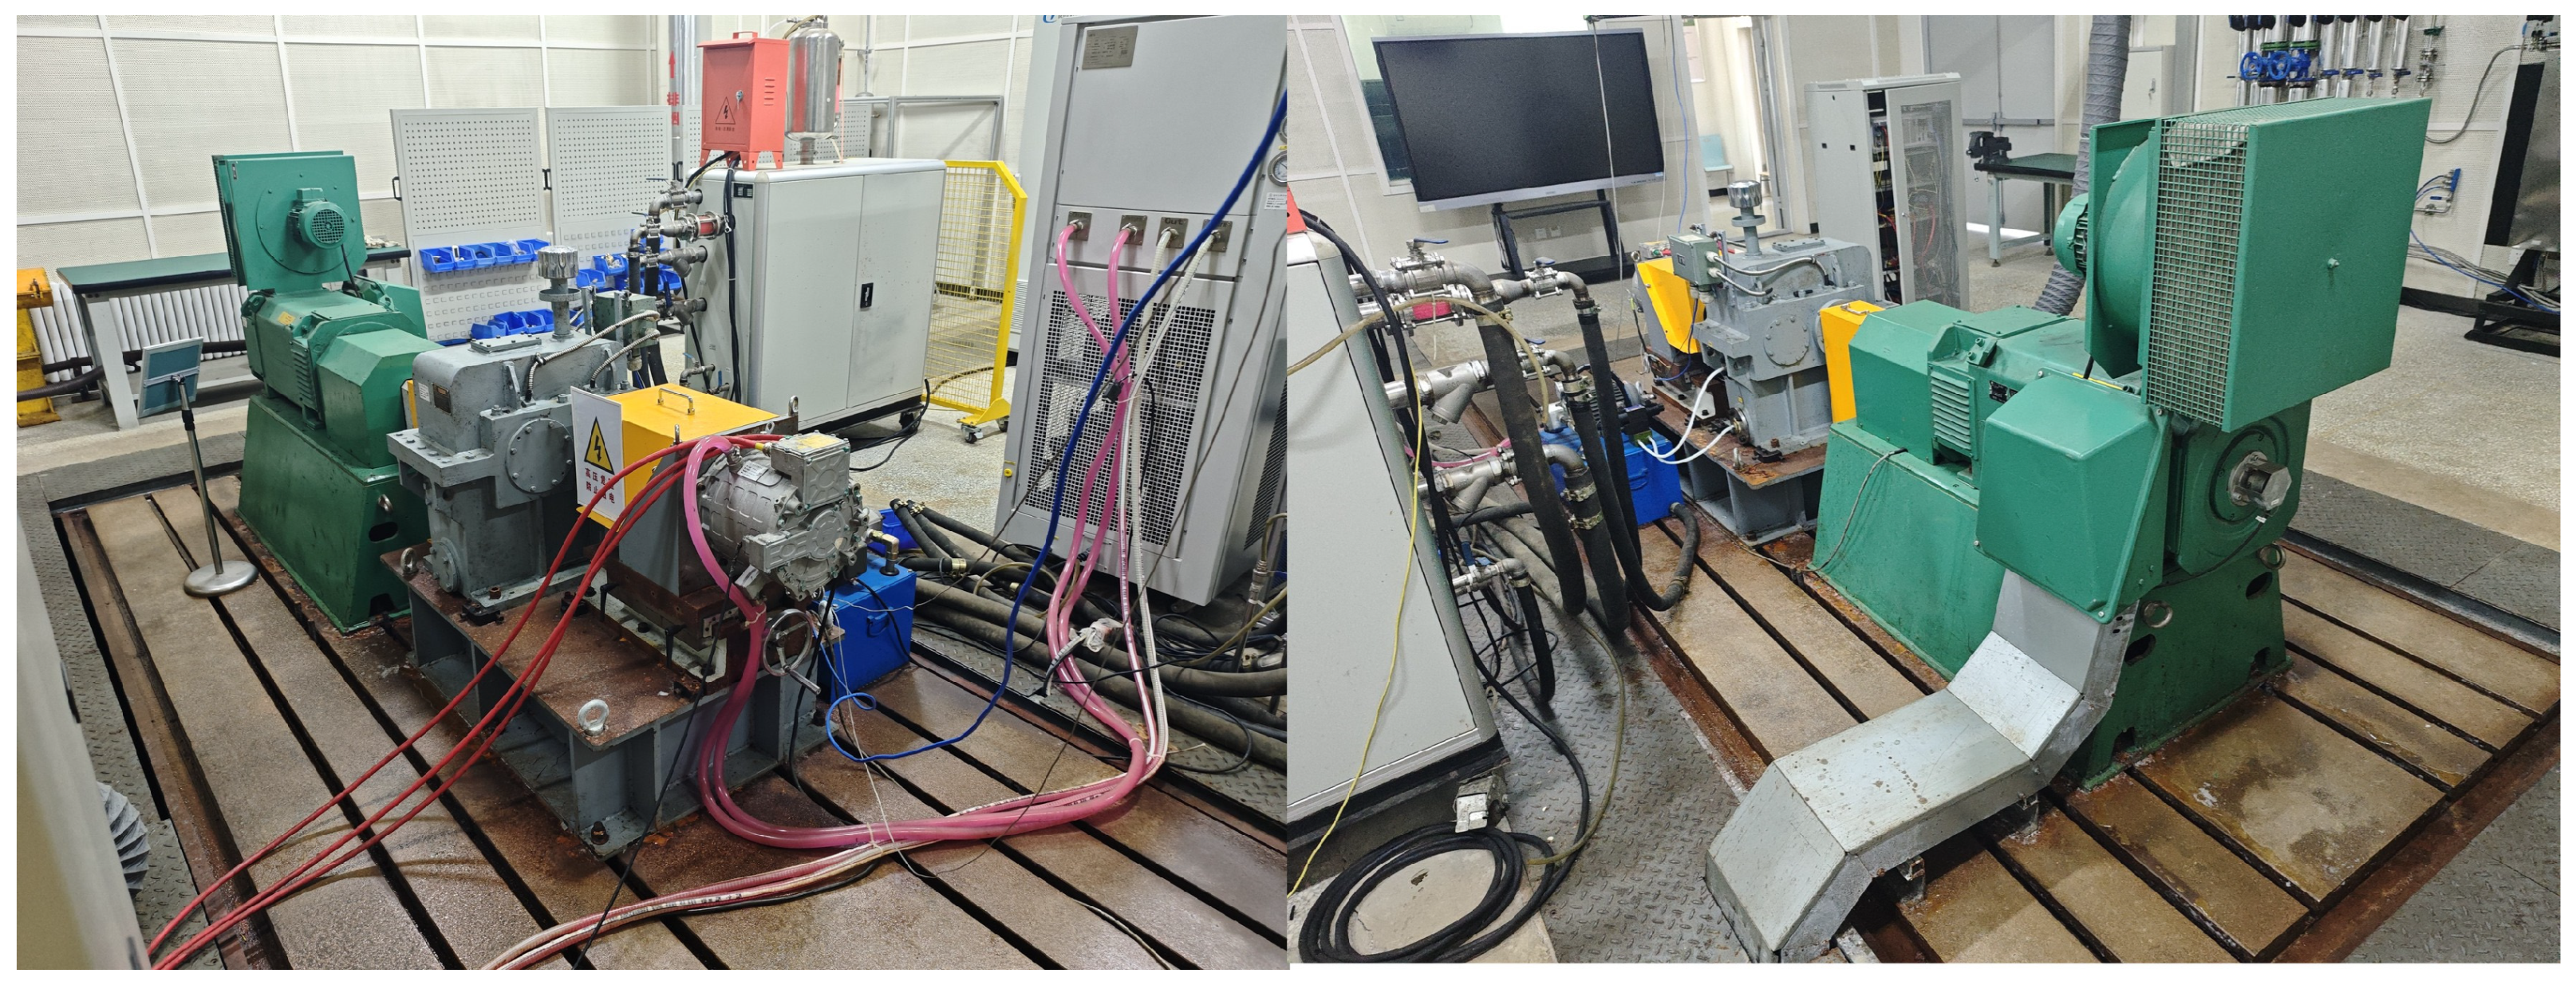
The measurement and control system is built on the existing 250 kW dynamometer test bench, with targeted upgrades for EV testing, as shown in Figure 1.
The hardware architecture comprises four functional layers:
Power Layer: An active front end (AFE) using Control Techniques Unidrive M600 [10] (Nidec Control Techniques, Newtown, UK) in regeneration mode, managing bidirectional power flow between the DC bus and the AC grid; a variable speed drive (VSD) in RFC-A mode for dynamometer control; an 80 kW programmable DC power supply serving as the motor controller power source; a three-phase 380 V/50 Hz grid connection with energy regeneration capability. During high-power motor testing, the DC bus is energized from the grid through the AFE operating in rectifier mode, while the 80 kW programmable supply serves as a low-power precharge and control-power source. The dynamometer absorbs the motor output and returns energy to the DC bus through the VSD, closing the power loop and supporting the 240.2 kW peak reported in Section 4.2.
Sensing Layer: A primary torque flange (0.05% full-scale (FS) accuracy, 0–500 Nm range); a newly added Kistler 4503B [9] piezoelectric torque sensor (Kistler Group, Winterthur, Switzerland; 0.05% FS, bandwidth 0–5 kHz), both mounted on the motor shaft; an incremental encoder (1024 pulses/revolution); PT100 resistance temperature detector (RTD) mounted on the motor winding, controller IGBT, and coolant inlet/outlet; a newly added GDEM GDIM-100 insulation monitor (GDEM, Tianjin, China; 0–100 MΩ, ±5%); an IEPE accelerometer (100 mV/g, 0.5–10 kHz); and a power analyzer for three-phase voltage, current, power factor, and total harmonic distortion (THD).
Control Layer: An NI PXIe-8840 (National Instruments, Austin, TX, USA) real-time controller (Intel Core i7 quad-core, 2.6 GHz); NI EL1008 digital input modules; NI EL4034 analog output modules (±10 V); NI EL3702 16-bit analog input modules; a newly added NI PXI-8513 high-speed CAN module.
Actuation Layer: Dynamometer torque/speed command via analog output (±10 V); motor controller enable/disable via digital output; cooling system valve control; safety contactor control with hardware interlock protection.

2.2. Software Architecture

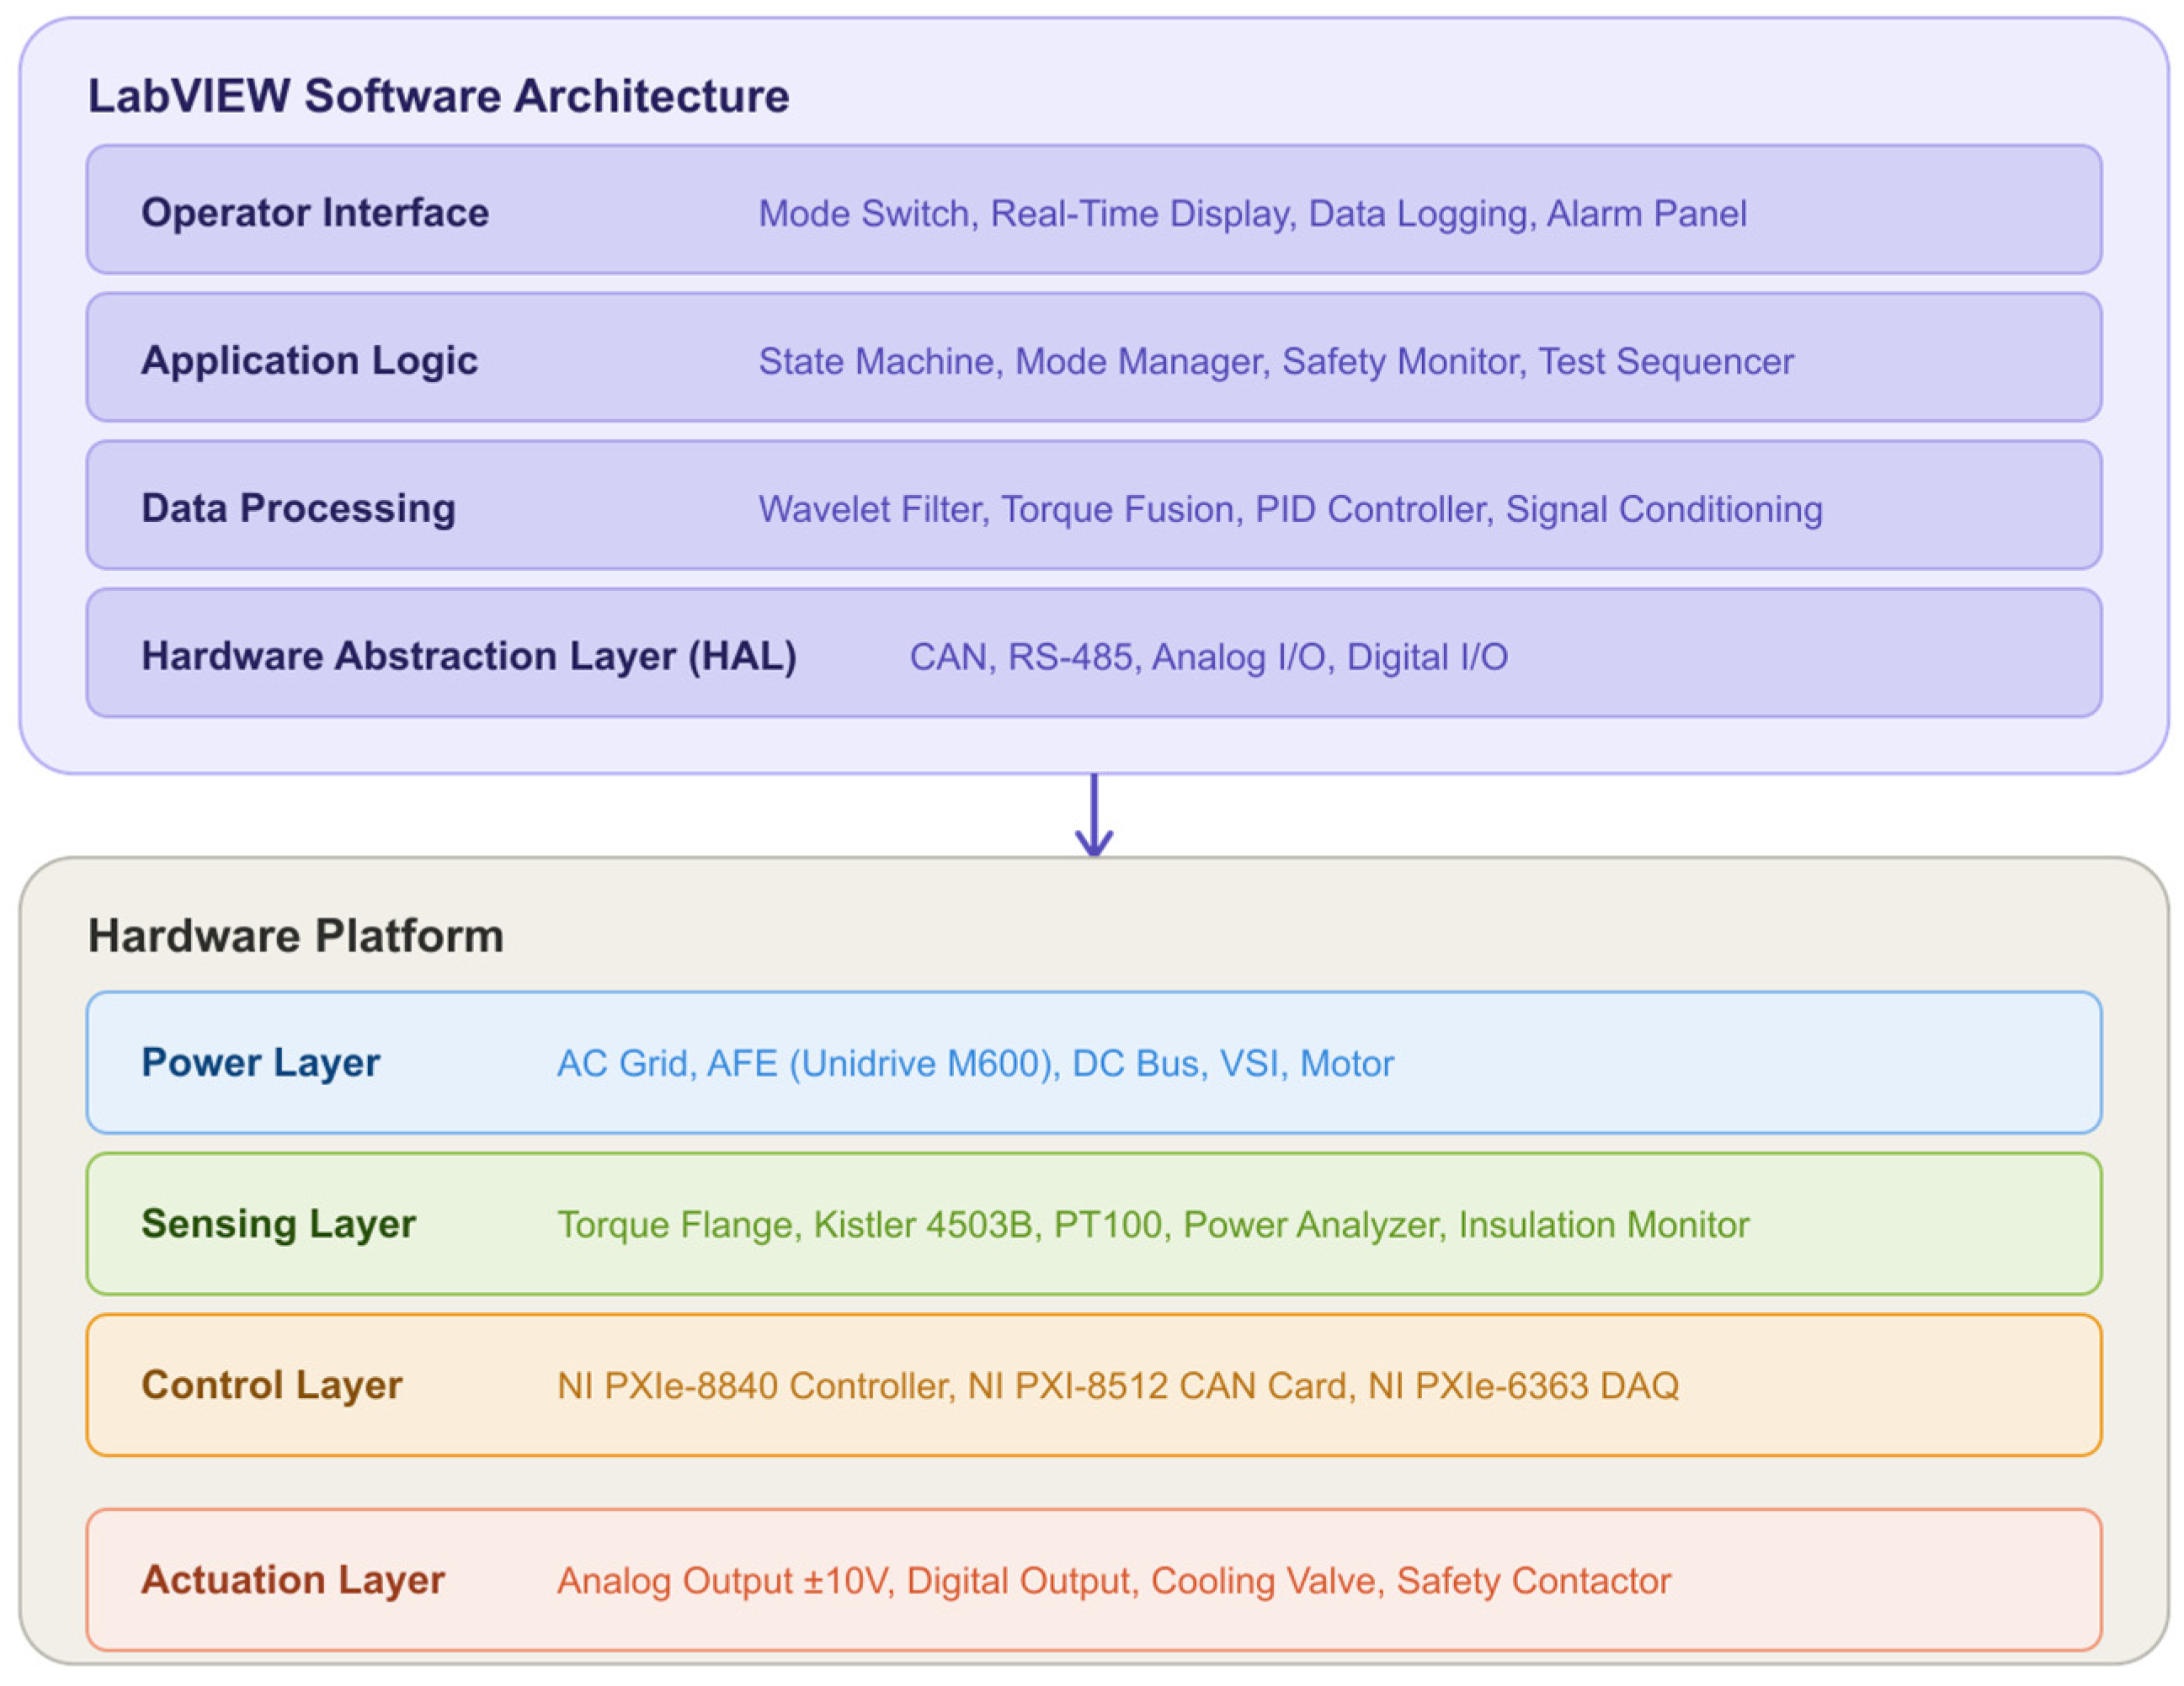
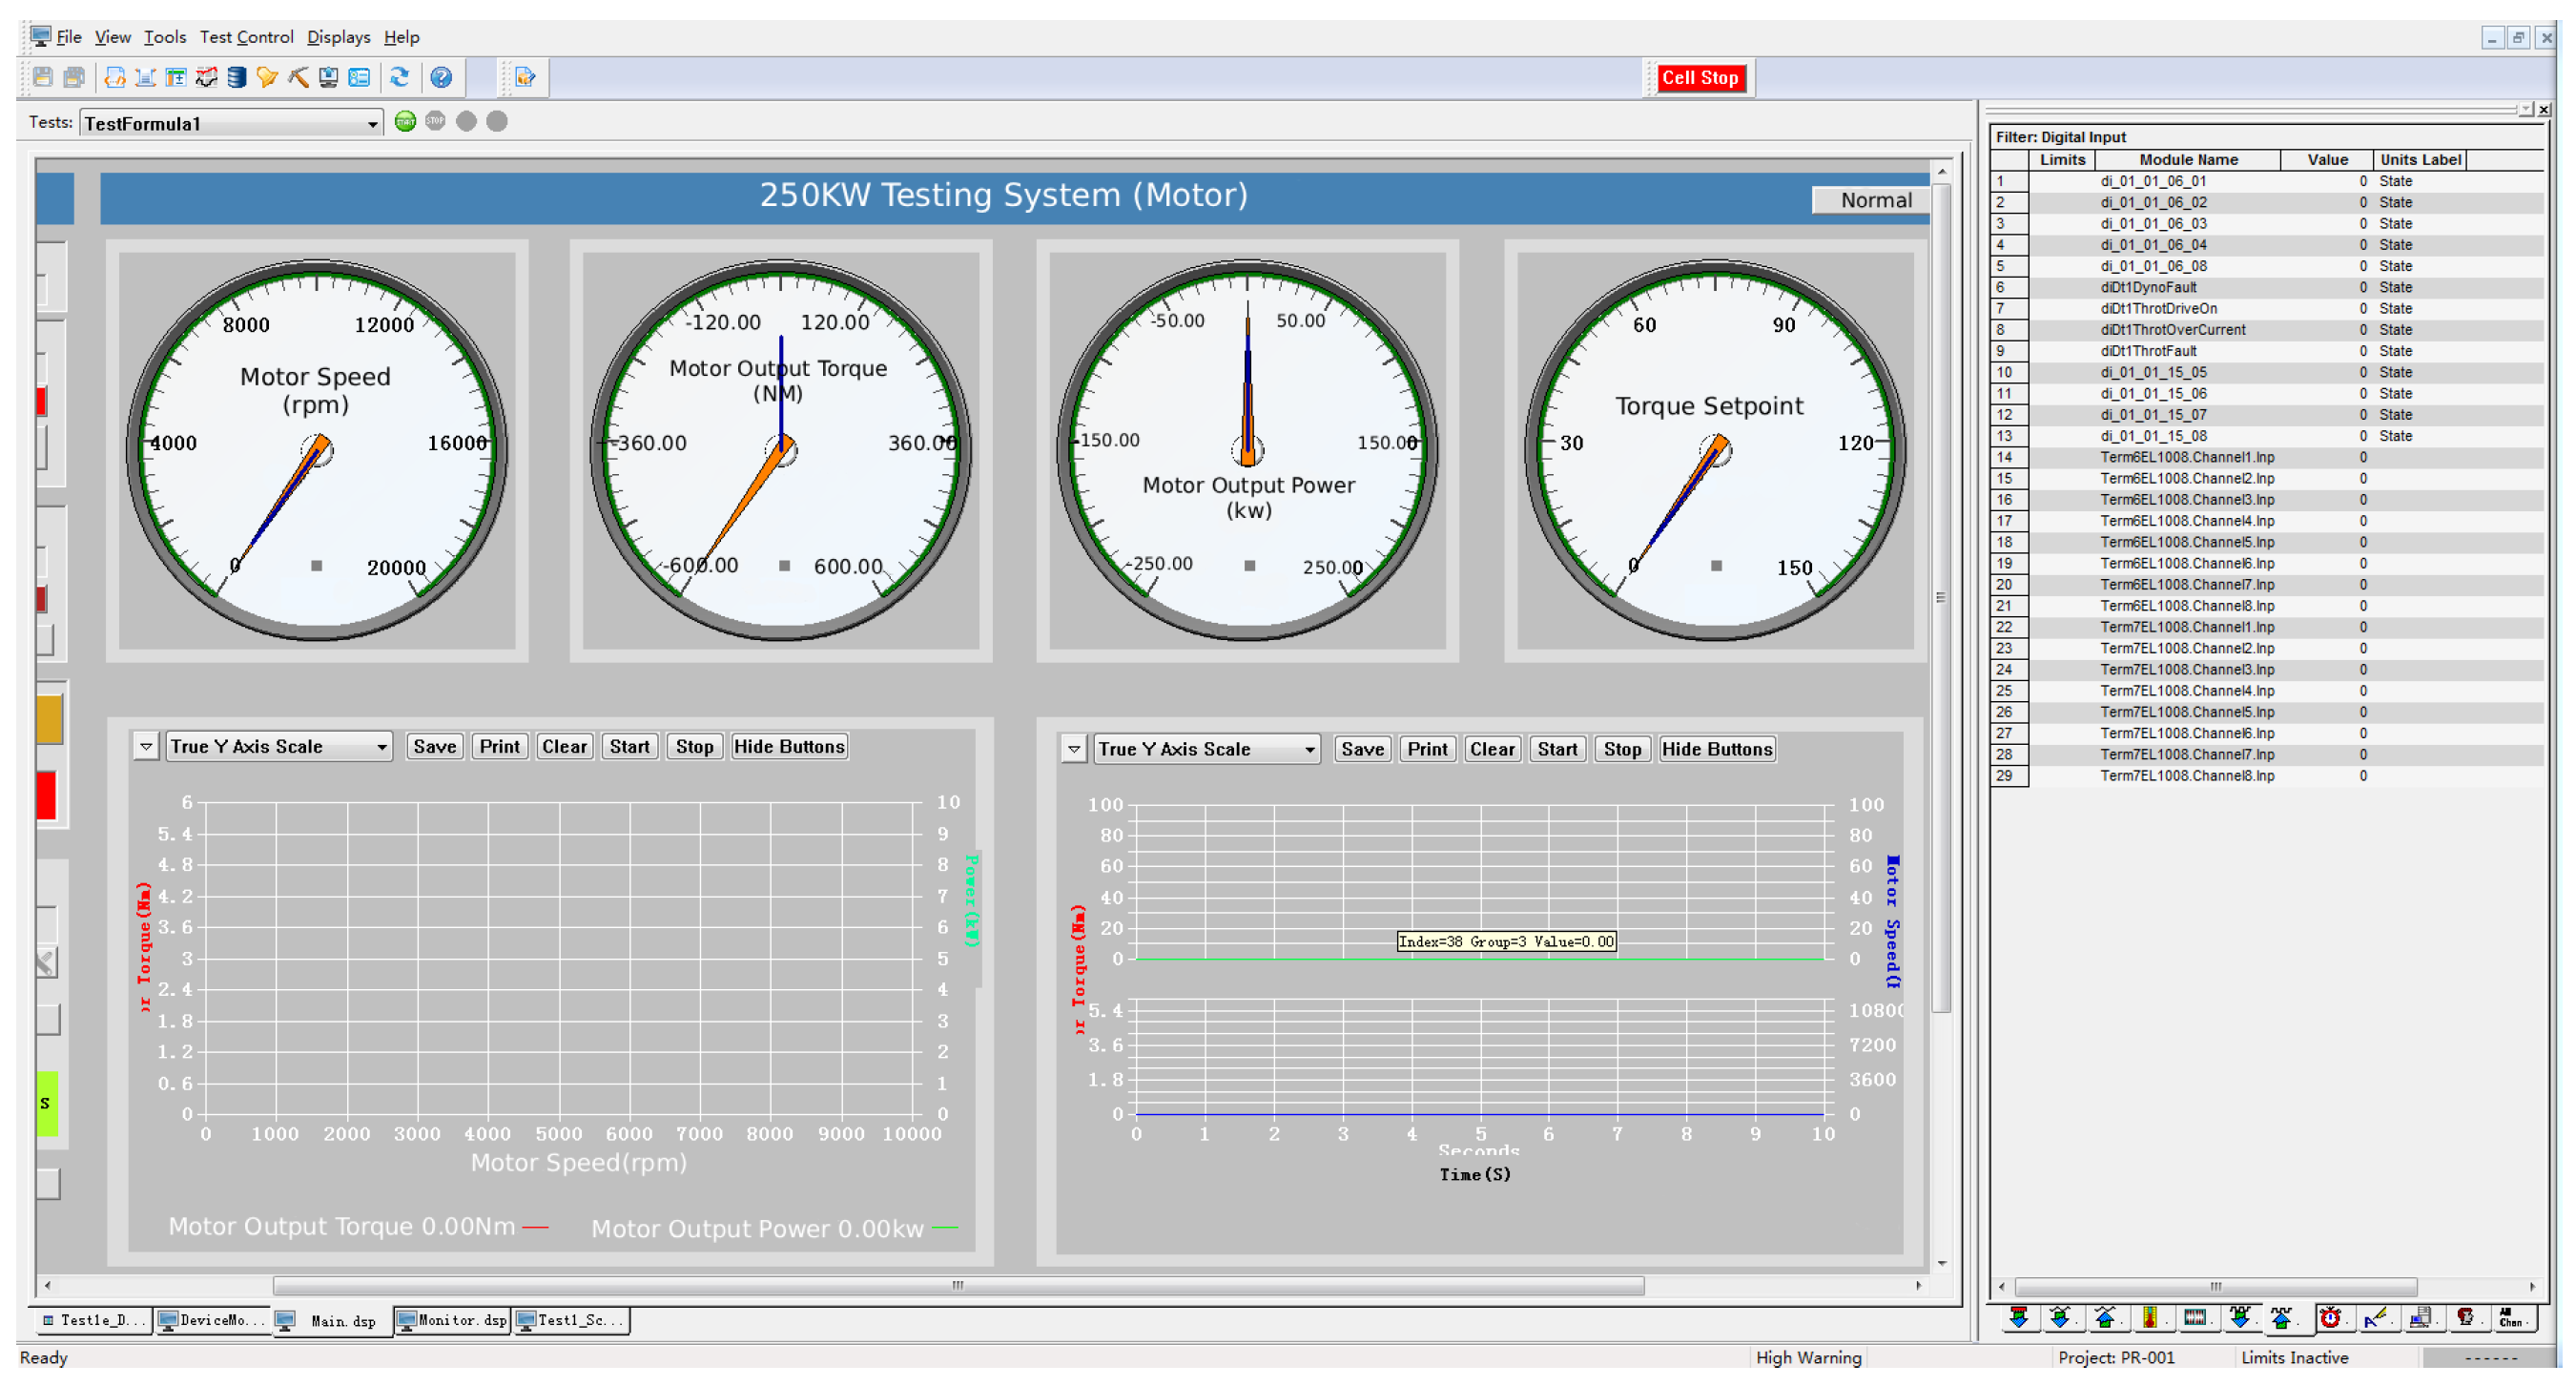
The software architecture follows a layered design pattern implemented in LabVIEW 2020 [11], comprising four hierarchical layers (Figure 2). The main operator interface is shown in Figure 3.
Layer 1—Hardware Abstraction Layer (HAL): Provides standardized interfaces to all hardware components, encapsulating device-specific communication protocols (CAN, RS-485, analog I/O, digital I/O).
Layer 2—Data Processing Layer: Implements real-time signal processing algorithms including wavelet-based torque signal denoising, speed calculation from encoder pulses, electrical power computation, and multi-stage data filtering.
Layer 3—Application Logic Layer: Hosts PID-based dynamometer speed/torque control with adaptive gain scheduling, motor constant-speed and constant-torque mode controllers, drive-cycle tracking controllers (available for future drive-cycle testing, not exercised in the present study), and energy management logic.
Layer 4—Operator Interface Layer: Features a modular sub-VI architecture with dynamic panel loading: login and user management, configuration (motor parameters, test protocol selection), manual control (real-time monitoring and command input), data acquisition and playback, and report generation.

2.3. Dual-Mode Operation Logic

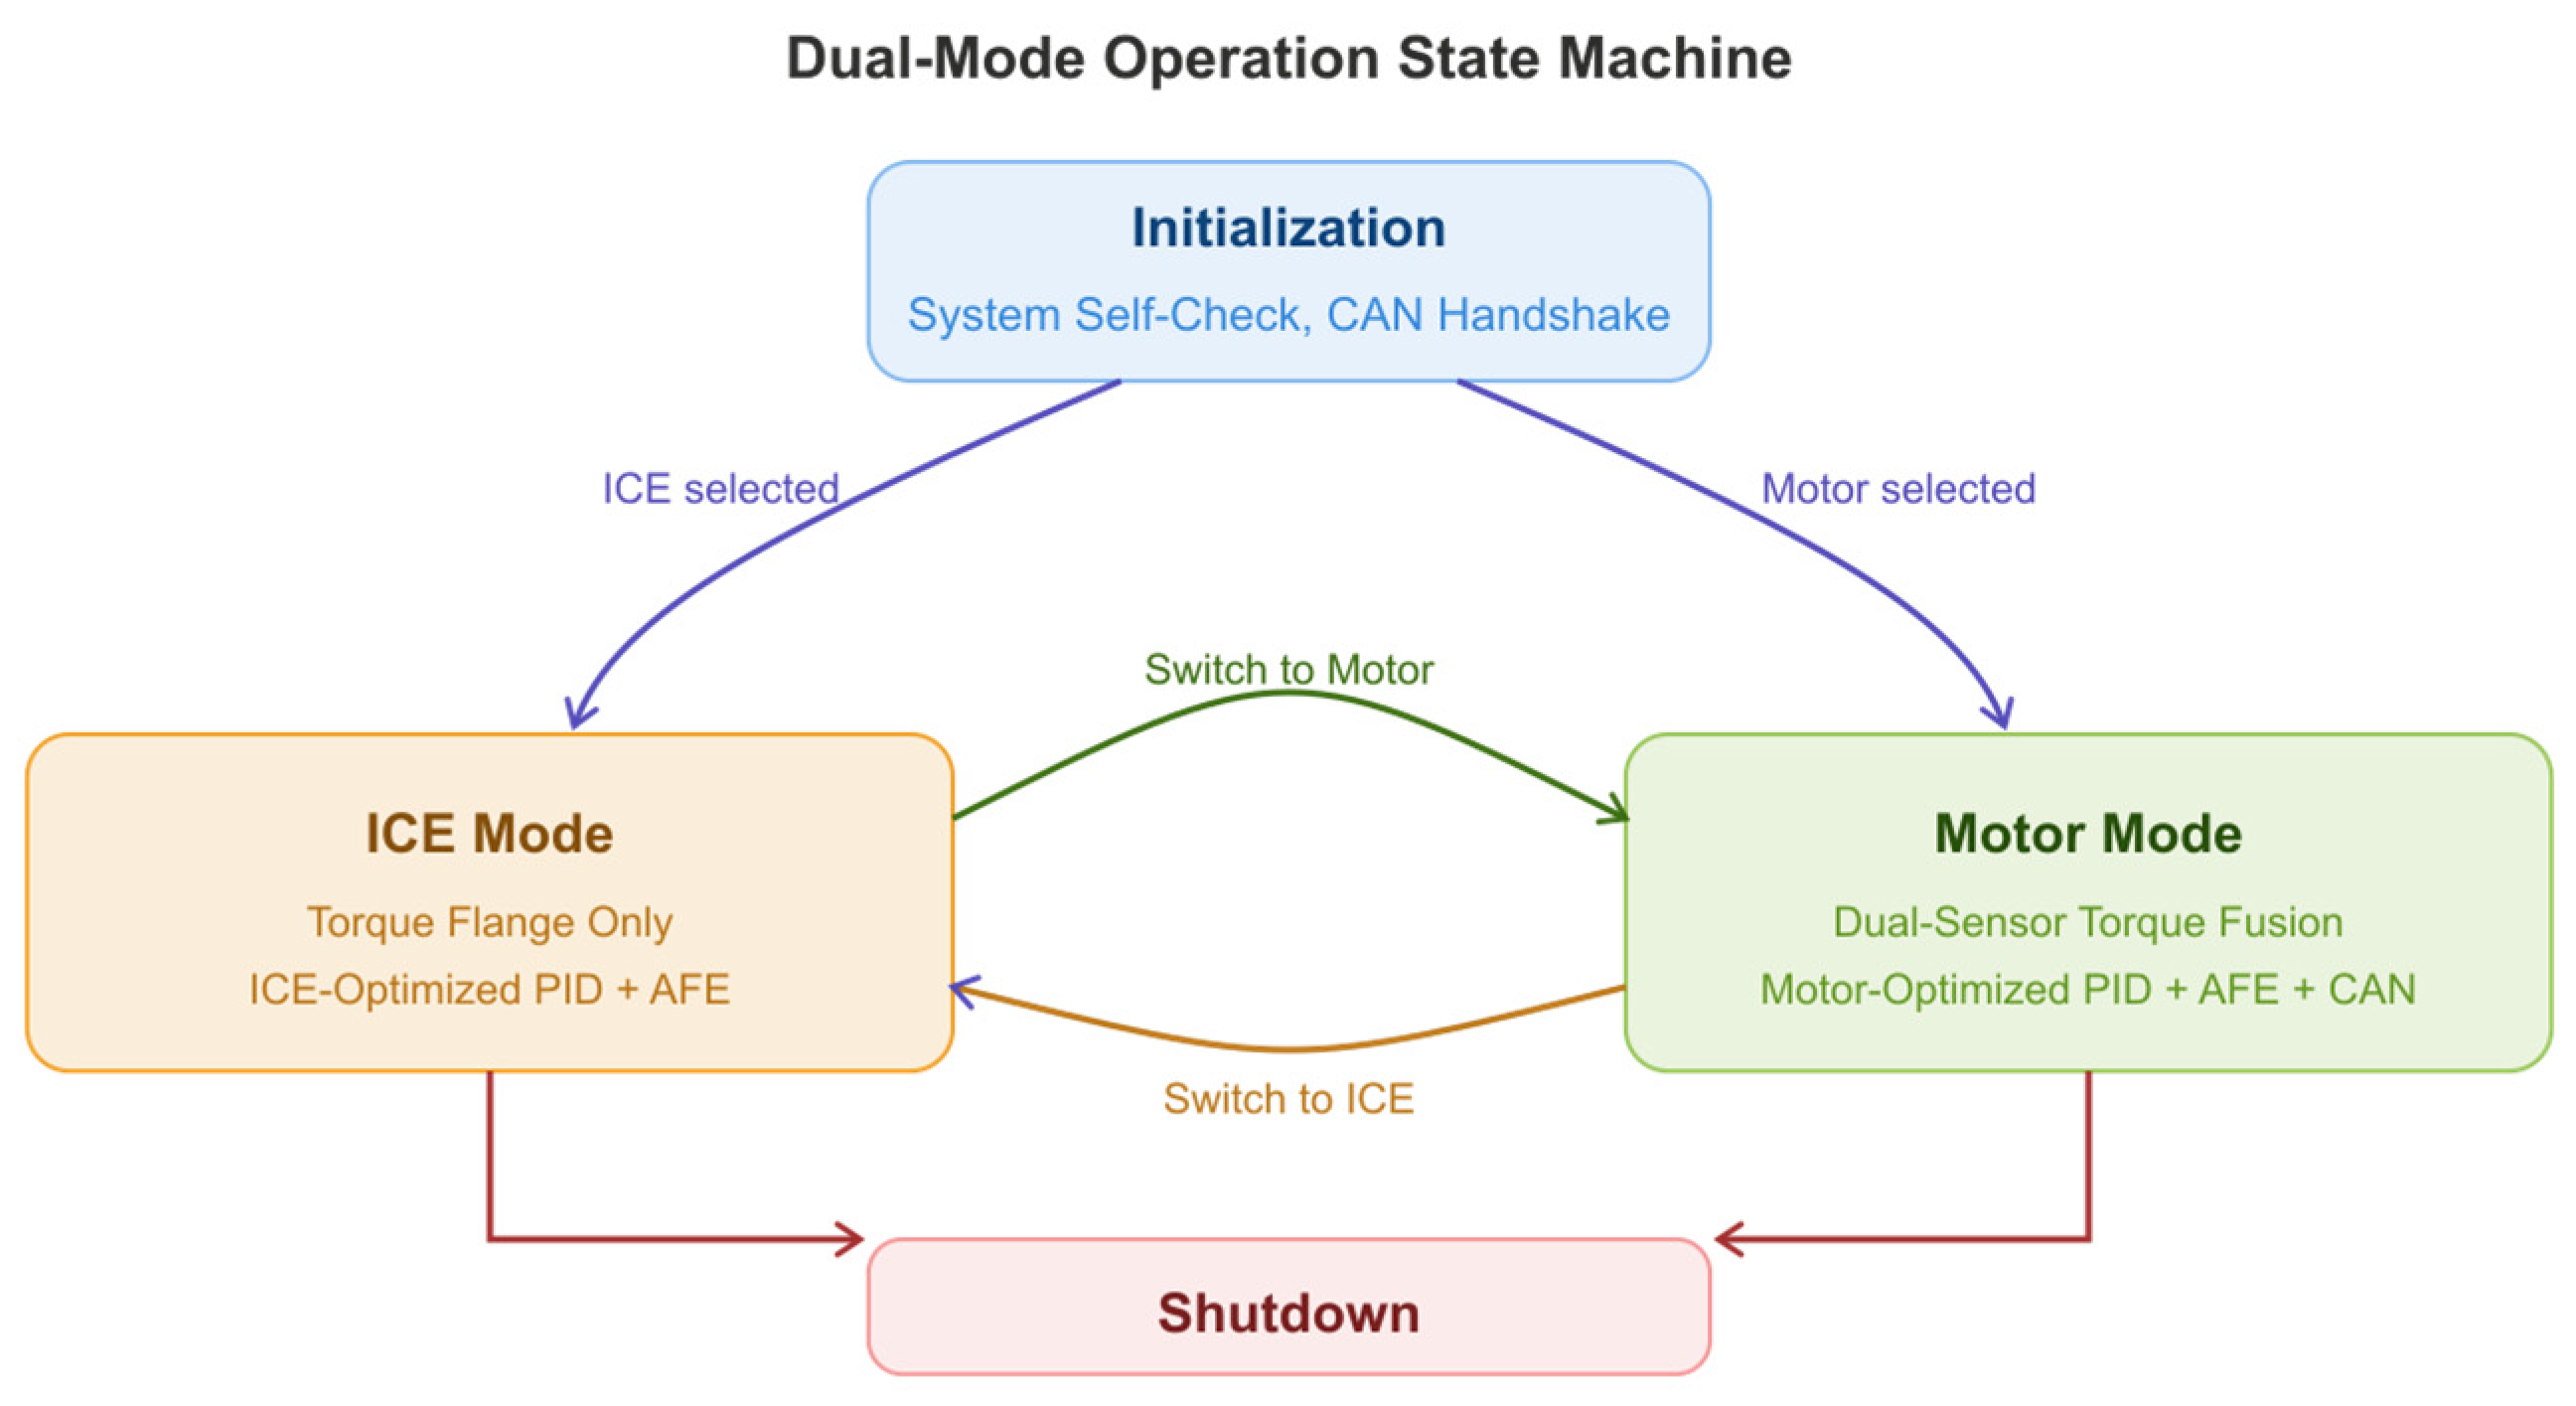
The dual-mode operation is managed through a state machine architecture with four primary states: Initialization, ICE Mode, Motor Mode, and Shutdown, as illustrated in Figure 4. All mode transitions require explicit operator confirmation and are followed by automated hardware reconfiguration.
In ICE Mode, the AFE regeneration strategy is optimized for ICE torque pulsation characteristics; PID gains are tuned for slower combustion dynamics; and ignition and fuel system interlocks are active. In Motor Mode, the AFE regeneration strategy is optimized for the inverter harmonic spectrum; wavelet-based torque filtering is active; CAN bus communication with the motor controller is enabled; insulation monitoring is active; and speed-reducing gearbox lubrication is engaged.

3. Key Technical Solutions

3.1. Cross-Mode Control Algorithm Migration

The original ICE dynamometer employed a standard PID controller for load regulation, tuned for the relatively slow dynamics of internal combustion engines (typical time constant 50–200 ms for torque response). When adapted to motor testing, two critical modifications were required.
Gain Scheduling: The PID gains are adjusted based on the operating regime. At low speeds (<1000 rpm), higher integral gain is required to compensate for static friction in the gearbox, consistent with recent work on low-speed performance enhancement in EV drives [12]. At high speeds (>8000 rpm), reduced derivative gain prevents amplification of encoder quantization noise. A gain-scheduling table with 10 breakpoints spanning the 0–18,000 rpm range was empirically determined through step response testing.
Mode Switching Logic: The controller supports seamless switching between constant-speed mode (regulating dynamometer speed while measuring motor torque) and constant-torque mode (regulating load torque while measuring motor speed response). The switching transition implements a bumpless transfer algorithm that initializes the integral term of the target mode to the current controller output value. To prevent integrator windup during large setpoint changes, the integral term is bounded by the controller output limits.
The PID control law for constant-speed mode is as follows:
u ( k ) = K p e ( k ) + K i T s i = 0 k e ( i ) + K d e ( k ) e ( k 1 ) T s + J d ω r e f d t
where K p , K i , and K d are the proportional, integral, and derivative gains, respectively; the feed forward term J d ω r e f d t compensates for the additional inertia introduced by the speed-reducing gearbox (2.4:1), J is the total moment of inertia reflected to the motor shaft (approximately 0.25 kg·m2, including the motor rotor and the dynamometer rotor reflected through the 2.4:1), and T s is the control loop sampling period (1 ms).

3.2. Multi-Source Signal Fusion and Precision Compensation

The most significant measurement challenge arises from the torque sensing system. The original torque flange (0.05% FS accuracy) performs adequately under ICE operating conditions, where torque fluctuations are dominated by combustion events with a fundamental frequency of 2–50 Hz. However, under motor testing conditions, the inverter’s pulse-width modulation (PWM) switching at 8–16 kHz introduces pronounced high-frequency electromagnetic interference that couples into the torque sensor signal path.
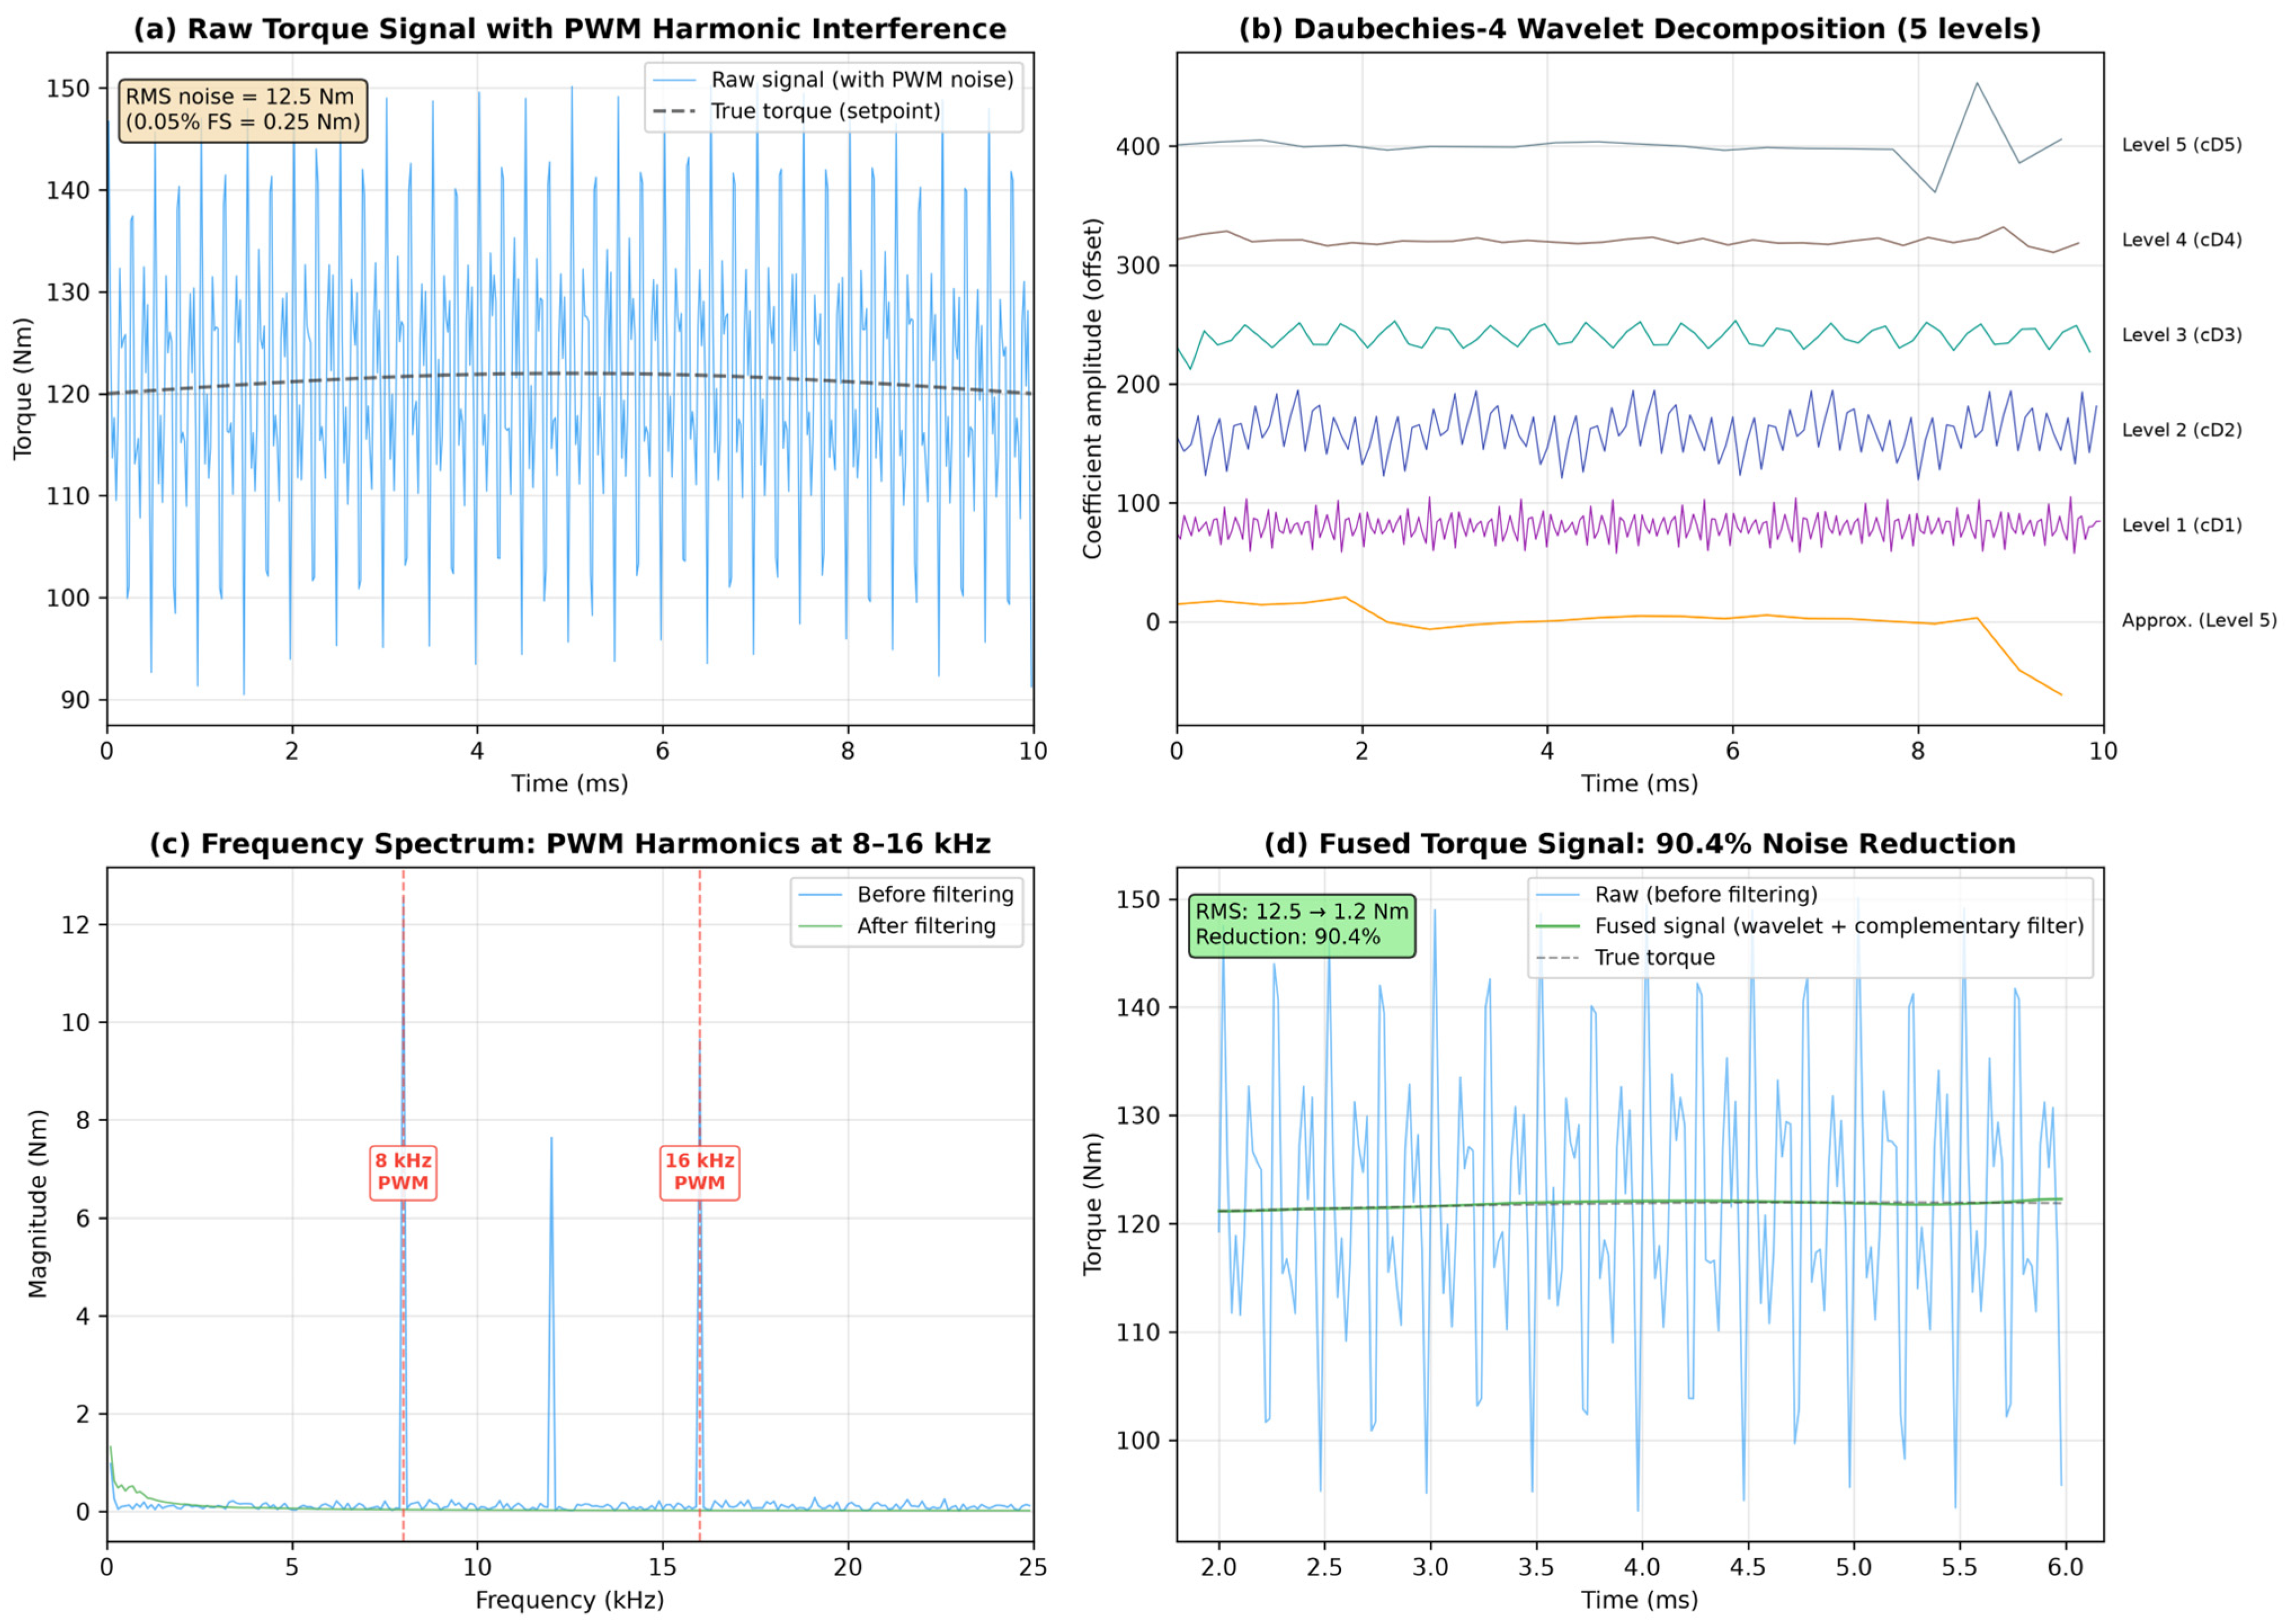
Problem Characterization: Measurement using the original torque flange during tests on an 80 kW-rated interior permanent magnet synchronous motor (IPMSM) at 5000 rpm and 150 Nm yielded an RMS noise amplitude of 12.5 Nm (compared to 1.8 Nm in ICE mode), peak-to-peak variation of ±27.5 Nm (±5.5% FS), and dominant noise frequencies at 8 kHz, 16 kHz, and their subharmonics.
Solution Approach: A dual-sensor fusion strategy combining the original torque flange (low-frequency, high-linearity) with the newly installed Kistler 4503B [9] high-bandwidth piezoelectric torque sensor:
The two sensors are complementary rather than redundant. The strain-gauge flange measures quasi-static torque with high DC accuracy (0.05% FS) but its analog bridge output is corrupted by the 8–16 kHz PWM harmonics, whereas the piezoelectric sensor offers 0–5 kHz bandwidth and intrinsic EMI immunity but cannot measure static torque because its charge output decays under constant load. Neither sensor alone can satisfy both the DC-accuracy and the high-frequency-immunity requirements of motor testing.
The Kistler sensor signal is sampled at 50 kHz and processed through a discrete wavelet transform (DWT) using a Daubechies-4 [13] (db4) wavelet with 5 decomposition levels. Among the Daubechies family, db4 was selected because its short support width best matches the transient duration of PWM-induced switching noise, while orthogonality ensures perfect signal reconstruction.
High-frequency components (Levels 1–2, corresponding to 6.25–25 kHz) are attenuated using soft thresholding (selected based on the PWM harmonic frequency range of 8–16 kHz, which maps to decomposition levels 1–2 at the 50 kHz sampling rate).
The dual-sensor fusion law operates as a frequency-domain complementary filter with a crossover frequency of 50 Hz. Below 50 Hz, the output relies on the torque flange signal, which provides high DC accuracy (0.05% FS) but is heavily affected by PWM-induced noise above this band. Above 50 Hz, the output transitions to the wavelet-denoised Kistler 4503B signal, which retains signal integrity up to 1 kHz after soft-threshold attenuation of the 6.25–25 kHz noise components.
T f u s e d = G l o w ( s ) T f l a n g e + G h i g h ( s ) T k i s t l e r
where T f u s e d is the final torque estimate used for closed-loop control and data logging, G l o w ( s ) and G h i g h ( s ) are complementary first-order low-pass and high-pass filters with unity DC gain sum, T f l a n g e is the low-bandwidth torque flange signal, and T k i s t l e r is the wavelet-denoised Kistler 4503B signal. This complementary filter structure ensures that the DC accuracy of the torque flange is preserved in the low-frequency band while the high-frequency PWM noise rejection of the Kistler signal is exploited above the 50 Hz crossover. The crossover frequency of 50 Hz was chosen because the torque flange maintains acceptable signal-to-noise ratio below this point, while the db4-denoised Kistler signal achieves a noise floor of approximately 0.62% FS above it. Below 10 Hz, the fused output is cross-calibrated against the torque flange to eliminate any DC offset drift in the Kistler signal path, ensuring long-term measurement stability across protracted test sequences. The complete fusion process is illustrated in Figure 5.
The reconstructed signal delivers high-fidelity torque measurements with an effective bandwidth of 0–1 kHz.
Cross-calibration with the original torque flange at low frequencies (<10 Hz) ensures DC accuracy.
The wavelet thresholding function is as follows:
λ j = σ j 2 ln N j
where σ j is the estimated noise standard deviation at decomposition level j, N j is the number of wavelet coefficients at that level, and ln N j denotes the natural logarithm. The universal threshold λ j = σ j 2 ln N j was adopted following [14].
After implementing the wavelet-based filtering, RMS noise amplitude was reduced from 12.5 Nm to 1.2 Nm, peak-to-peak variation from ±27.5 Nm to ±3.1 Nm (±0.62% FS).

3.3. CAN Bus Communication Integration

Communication with the motor controller is essential for EV testing, enabling real-time monitoring of controller-internal parameters (DC bus voltage, IGBT temperature, fault codes) and transmission of control commands. The system implements the SAE J1939 [15] application layer protocol over CAN 2.0B at 500 kbps.
The implemented parameter groups (PGs, with corresponding parameter group numbers, PGNs) include: Motor Control Command (PGN 0xFF01: torque setpoint, speed setpoint, enable/disable, direction); Motor Status Feedback (PGN 0xFF02: actual torque, actual speed, DC bus voltage, motor temperature, fault status); and Controller Parameters (PGN 0xFF03: configuration read/write for PID gains, current limits, protection thresholds).
The LabVIEW CAN implementation adopts the NI-XNET [16] driver with frame-based queued communication. A dedicated CAN message handler loop runs at 100 Hz in the PXI real-time system, managing message queuing, timeout detection (200 ms timeout triggers communication fault alarm), and data parsing. Although the CAN handler runs at 100 Hz, torque and speed setpoints are refreshed at the 1 ms control-loop rate through zero-order-hold interpolation between successive CAN updates, introducing a worst-case latency of 10 ms that is negligible relative to the 50–200 ms torque-response time constant.

3.4. Energy Feedback System Optimization

The AFE regeneration strategy was originally configured for ICE testing conditions. Analysis of energy flow during motor testing revealed that the regeneration trigger thresholds and DC bus voltage regulation parameters were suboptimal for the motor loading profile.
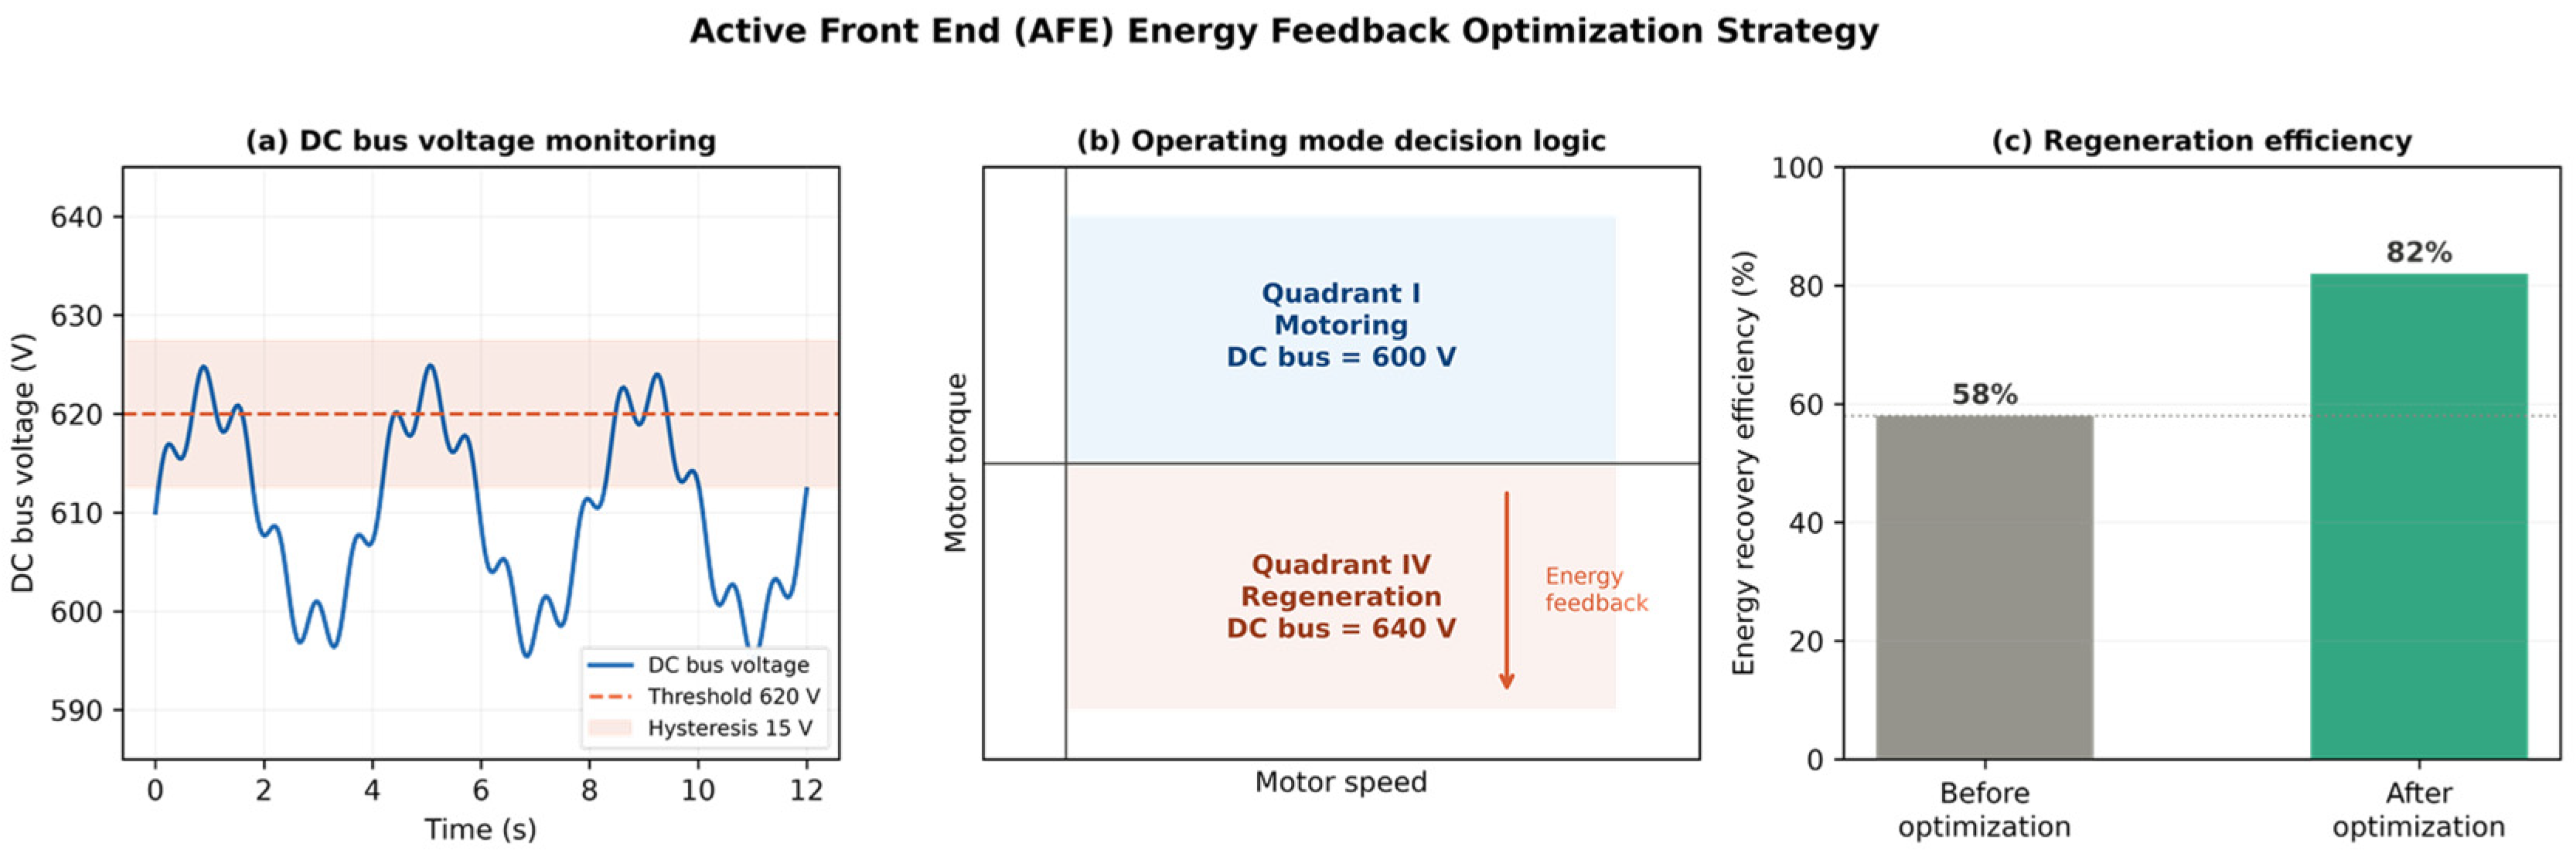
Regeneration initiated only when DC bus voltage exceeded 650 V. During motor testing, the DC bus voltage fluctuated in the 580–640 V range for most of the operating time, resulting in excess regenerative energy not being fed back to the grid and instead being consumed via the braking circuit or lost as ohmic heat. Here, the energy recovery efficiency is defined as the ratio of the electrical energy returned to the AC grid to the mechanical energy absorbed by the dynamometer during regenerative operation; with the original ICE-oriented AFE configuration, this efficiency was 58% when evaluated across all regenerative operating points (negative-torque quadrant) of the 823-point efficiency MAP, using the same 60 s steady-state dwell and final-10 s sampling window per point.
The optimized strategy involves three modifications. The regeneration threshold is lowered to 620 V with a 15 V hysteresis band to prevent chattering. The DC bus voltage setpoint is dynamically adjusted based on the motor operating quadrant: 600 V in motoring (Quadrant I) to maximize energy draw from the grid, and 640 V in regeneration (Quadrant IV) to initiate grid feedback as early as possible. Because the tests in this study involve only forward rotation, the reverse-rotation quadrants (II and III) are not exercised in this study. Additionally, the AFE current limit during regeneration is increased from 80% to 95% of rated capacity, as depicted in Figure 6, thereby maximizing power throughput during feedback.
The optimization results are summarized in Table 1.

3.5. Safety Interlock and Insulation Monitoring

The safety system integrates hardware interlocks with software-based monitoring.
Hardware Interlocks: Emergency stop circuit with redundant contactors (conforming to Safety Category 3 of ISO 13849-1 [17]); AFE fault relay (KA3) monitored by digital input module; VSD fault relay (KA8/KA6) providing drive health status; motor temperature over-temperature switch (Motor KT) for direct hardware trip; cooling system flow switch ensuring minimum coolant flow before enabling.
Software Monitoring: Insulation resistance continuously monitored (1 Hz update rate) with two alarm thresholds; vibration RMS trending with configurable warning and shutdown limits; communication watchdog (200 ms timeout) detecting CAN bus or controller faults; limit value configuration supporting up to 32 user-defined alarm channels.

4. Results and Discussion

4.1. Test Configuration

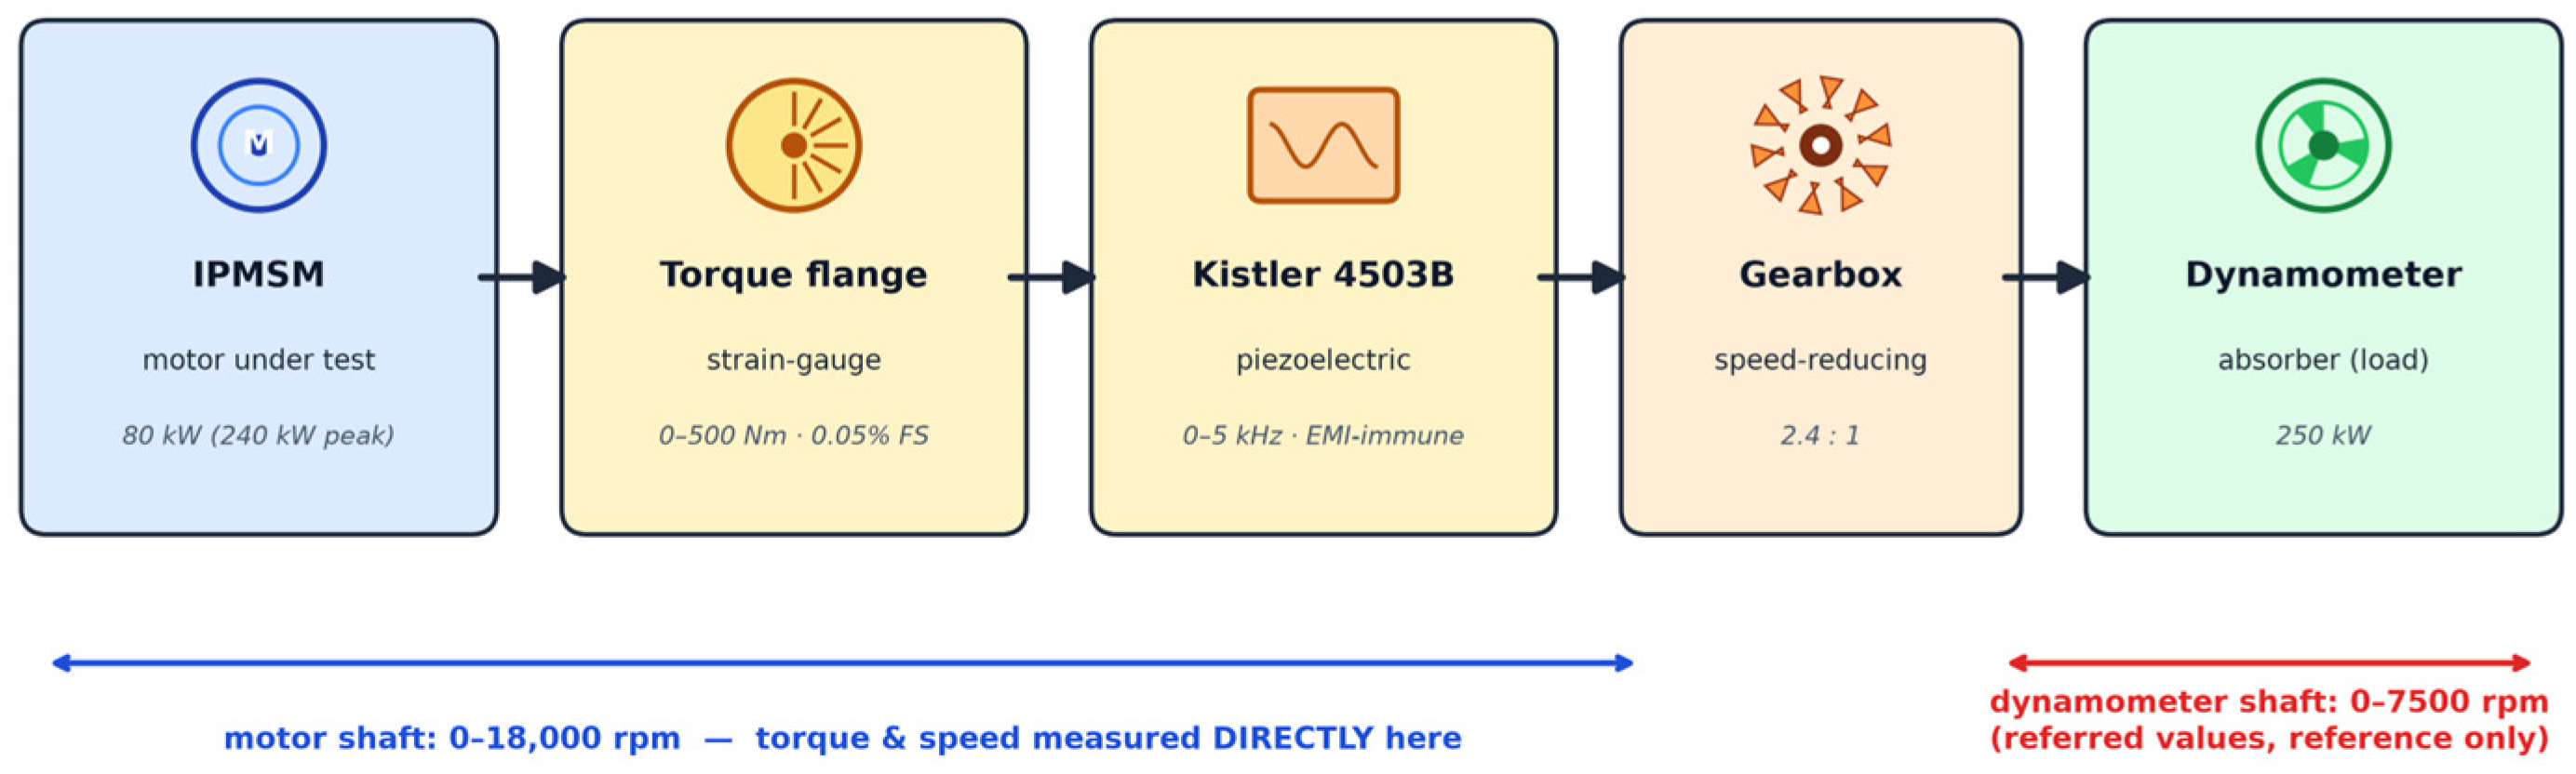
The developed dual-mode measurement and control system was validated using an interior permanent magnet synchronous motor (IPMSM) as the device under test (DUT). The retrofitted 250 kW test bench provides 10 kW of headroom over the motor’s 240 kW peak power (30 s). The motor was instrumented with the dual-sensor torque measurement system (original torque flange + Kistler 4503B [9]), PT100 winding temperature sensors, and an electrical power analyzer. All tests were conducted in compliance with GB/T 18488-2024 [18] test procedures. Data were acquired at 100 Hz through the NI PXIe-8840 real-time controller and logged to the host computer for post-processing. The complete test dataset comprised 823 steady-state operating points spanning the motor’s full torque-speed envelope. The motor was coupled to the dynamometer through a speed-reducing gearbox (2.4:1), such that motor shaft speeds of 237–18,000 rpm correspond to dynamometer shaft speeds of approximately 99–7500 rpm. All torque, speed, and power values reported in this paper refer to the motor shaft side and are measured directly by the motor-side torque sensors; the dynamometer-shaft values are listed only for reference. The mechanical measurement chain is illustrated in Figure 7.
The test motor was an 80 kW-rated IPMSM with the following specifications: rated power 80 kW, peak power 240 kW (30 s), rated torque 120 Nm, peak torque 450 Nm, rated speed 6400 rpm (motor shaft), maximum speed 18,000 rpm, DC bus voltage 600 V, cooling method: water-glycol (dual-circuit), insulation class H (180 °C), and 8 pole pairs. Through this gearbox, the motor’s rated speed of 6400 rpm corresponds to a dynamometer shaft speed of approximately 2667 rpm. All torque and speed values reported in this paper refer to the motor shaft side unless explicitly noted otherwise.

4.2. External Characteristic Test

The external characteristic test quantifies the motor’s torque and power delivery capability across its operating speed range. The dynamometer was operated in constant-speed mode at 24 discrete speed points from 500 to 18,000 rpm, while the motor controller delivered maximum available torque. Electrical input power (DC bus voltage × current) and mechanical output power (torque × angular velocity) were recorded at each operating point after a 30 s short-duration dwell at the peak torque envelope (consistent with the motor’s 30 s peak rating), with data sampled during the final 10 s steady-state window. Selected representative points are summarized in Table 2.
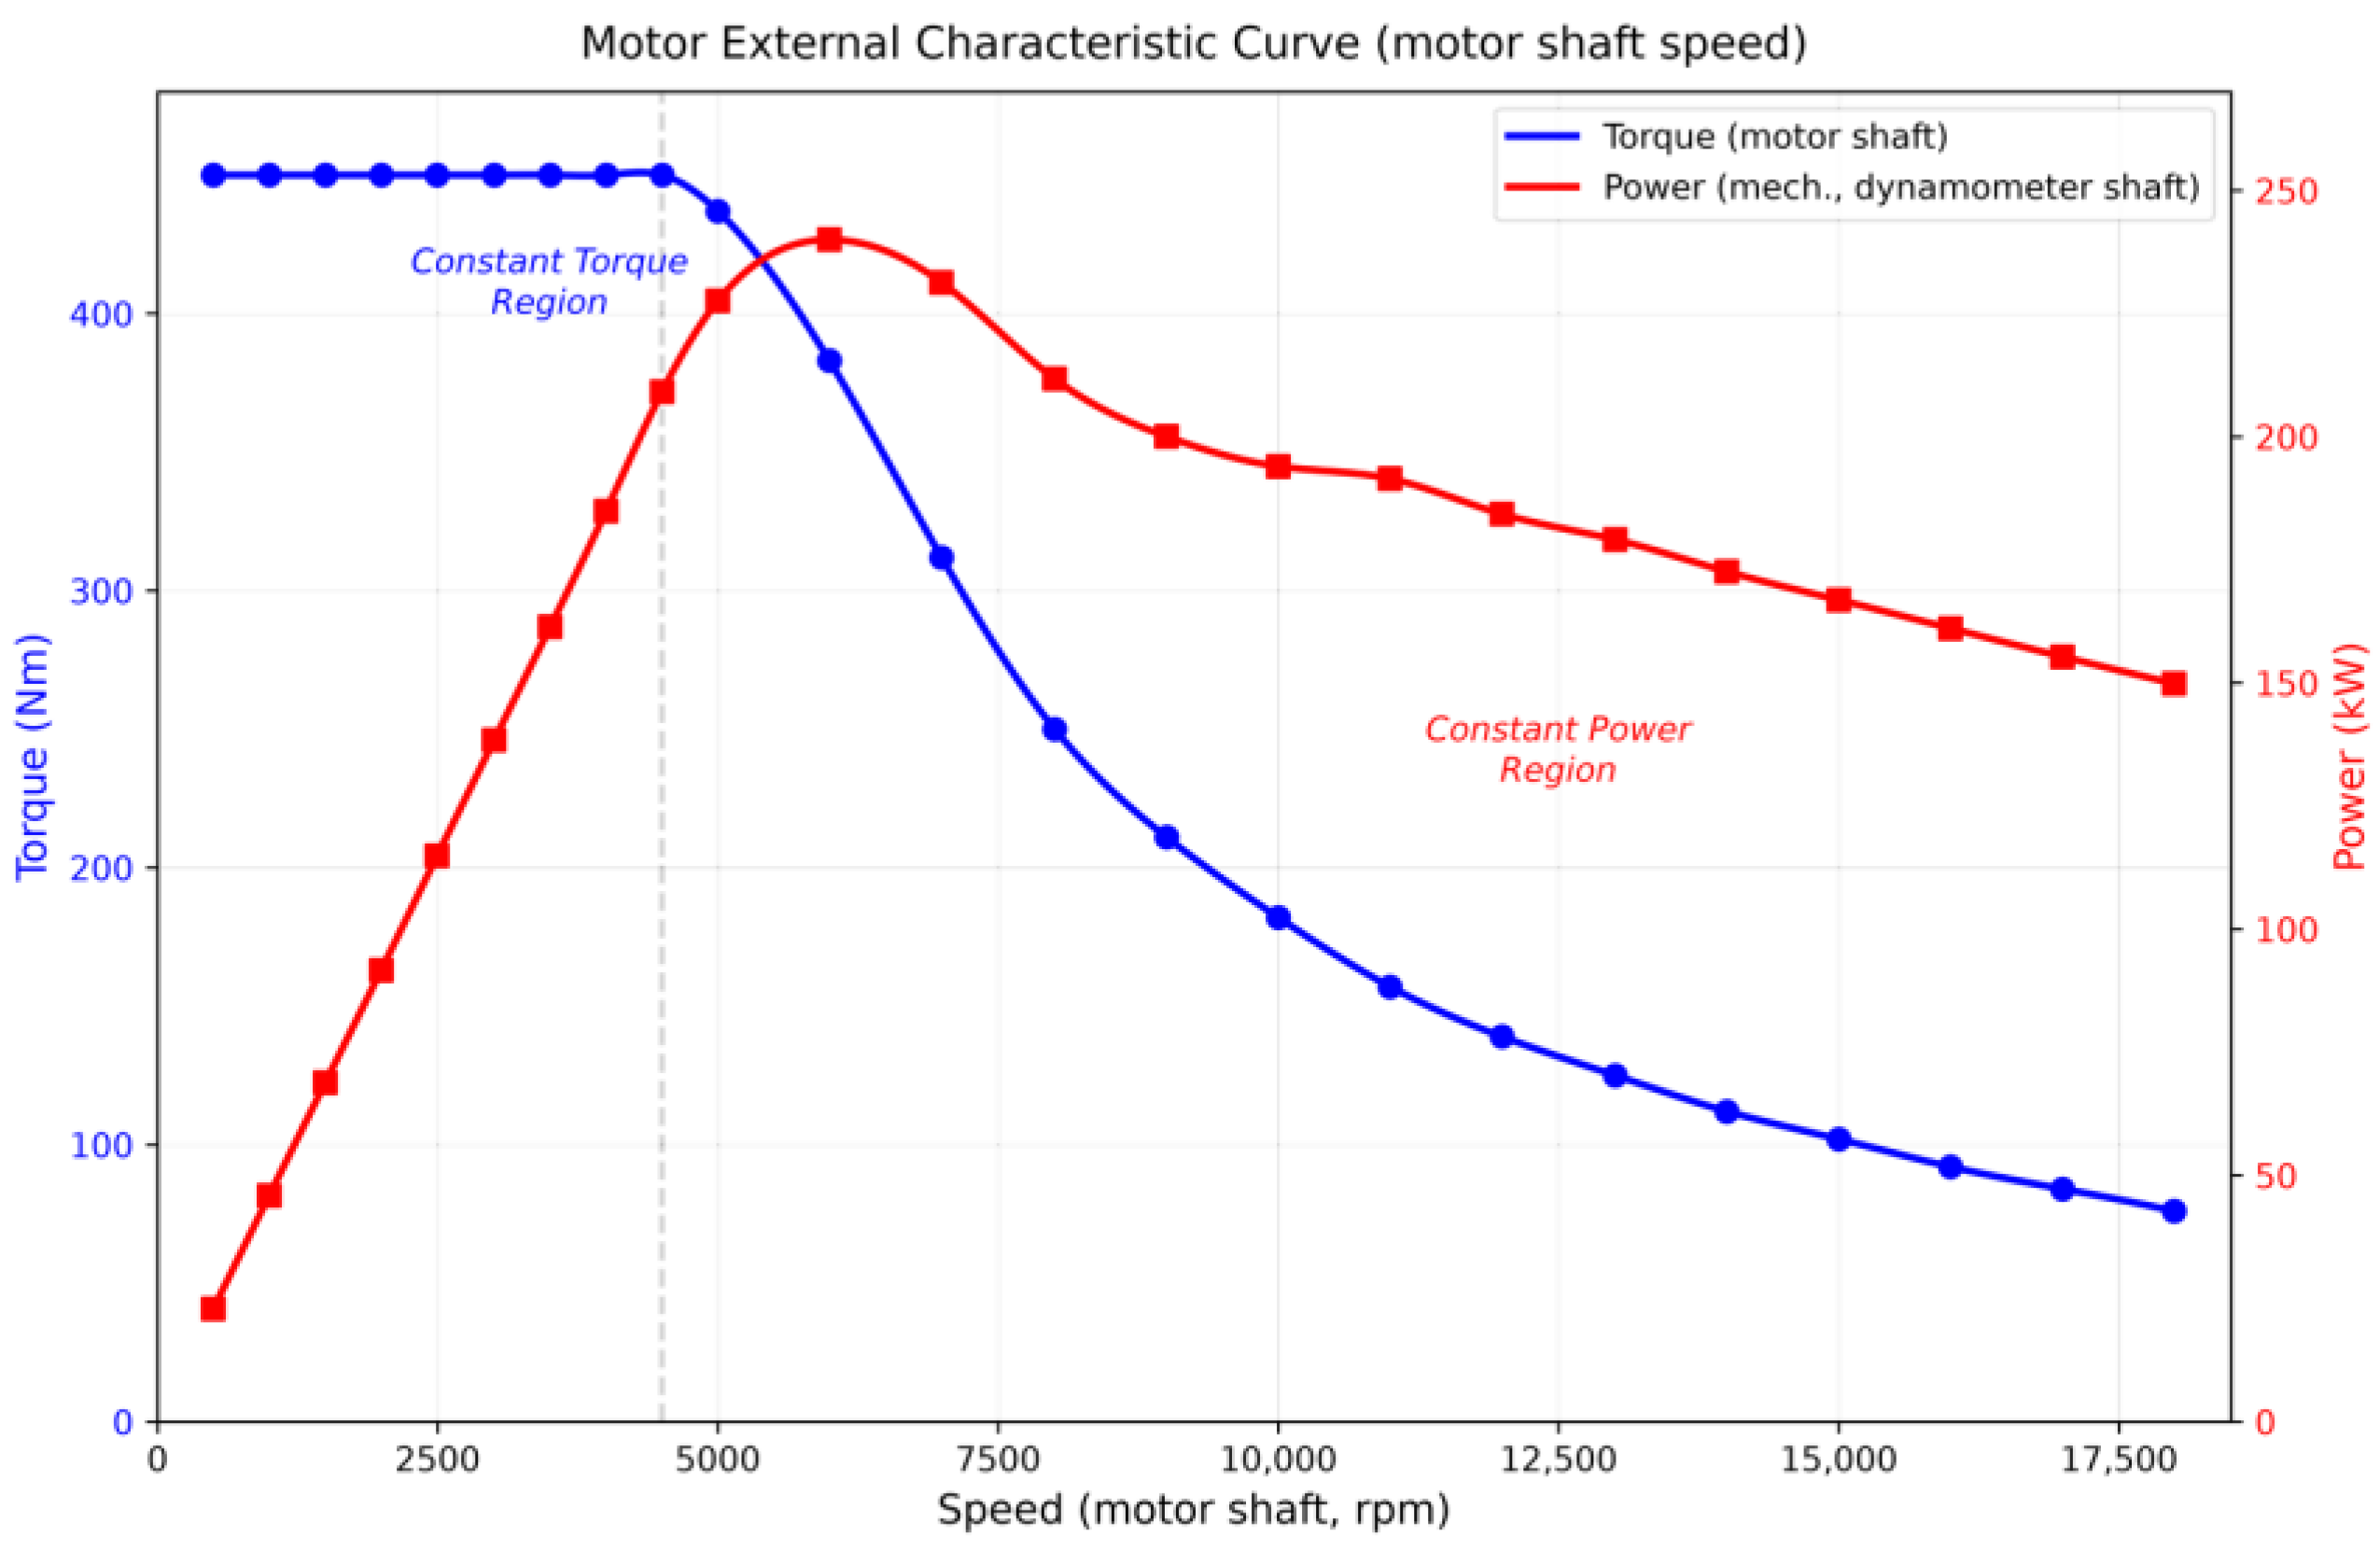
The motor exhibits a well-defined constant-torque region from 500 to 4500 rpm with peak torque maintained at 450 Nm, followed by a field-weakening region where torque decreases approximately inversely with speed. Maximum mechanical power of 240.2 kW was achieved at approximately 6000 rpm and 380 Nm, consistent with the motor’s peak power specification of 240 kW (30 s). The torque and power characteristics are summarized in Figure 8.
During the external characteristic test, system efficiency rises from 58.8% at the lowest operating point (500 rpm, 22.9 kW) to a peak of 92.8% at 9000 rpm, and remains above 90% up to the highest speed (18,000 rpm, 149.9 kW), consistent with the reduction in relative copper losses at higher speeds under reduced torque loading.

4.3. Efficiency MAP Generation

The system efficiency MAP was generated following the automated scanning methodology of Chang and Yeh [19] by executing a comprehensive grid of steady-state operating points across the torque-speed envelope. A total of 823 operating points were systematically measured, covering speeds from 237 to 18,000 rpm and torques from −440 to 450 Nm (regenerative braking conditions included). At each operating point, the system maintained steady-state conditions for 60 s, collected data at 100 Hz for the final 10 s, and computed the system efficiency as the ratio of mechanical output power to DC electrical input power:
η = T o u t ω V d c I d c × 100 %
where η is the system efficiency; T o u t is the average measured torque; ω is the angular velocity; V d c is the DC bus voltage and I d c is the DC bus current. For regenerative operating points (negative torque), the ratio is inverted, giving η = (V·I)/(T·ω), with the DC current I defined as positive during motoring and negative during regeneration. Using this definition, the efficiency was computed for all 823 operating points; the statistical summary is given in Table 3. The area fraction of 63.4% (grid cells) was obtained by rasterizing the torque–speed plane into a uniform grid (500 rpm × 25 Nm resolution), masking cells outside the feasible operating envelope defined by the motor’s torque–speed limit curve (Section 4.2), applying bilinear interpolation from the 823 measured points, and counting cells whose interpolated efficiency exceeded 90%. Because the mechanical power is measured at the motor shaft (upstream of the gearbox) while the electrical power is measured at the DC bus, the reported efficiency includes both the inverter and the motor losses and is therefore referred to as the system efficiency rather than a motor-only efficiency.
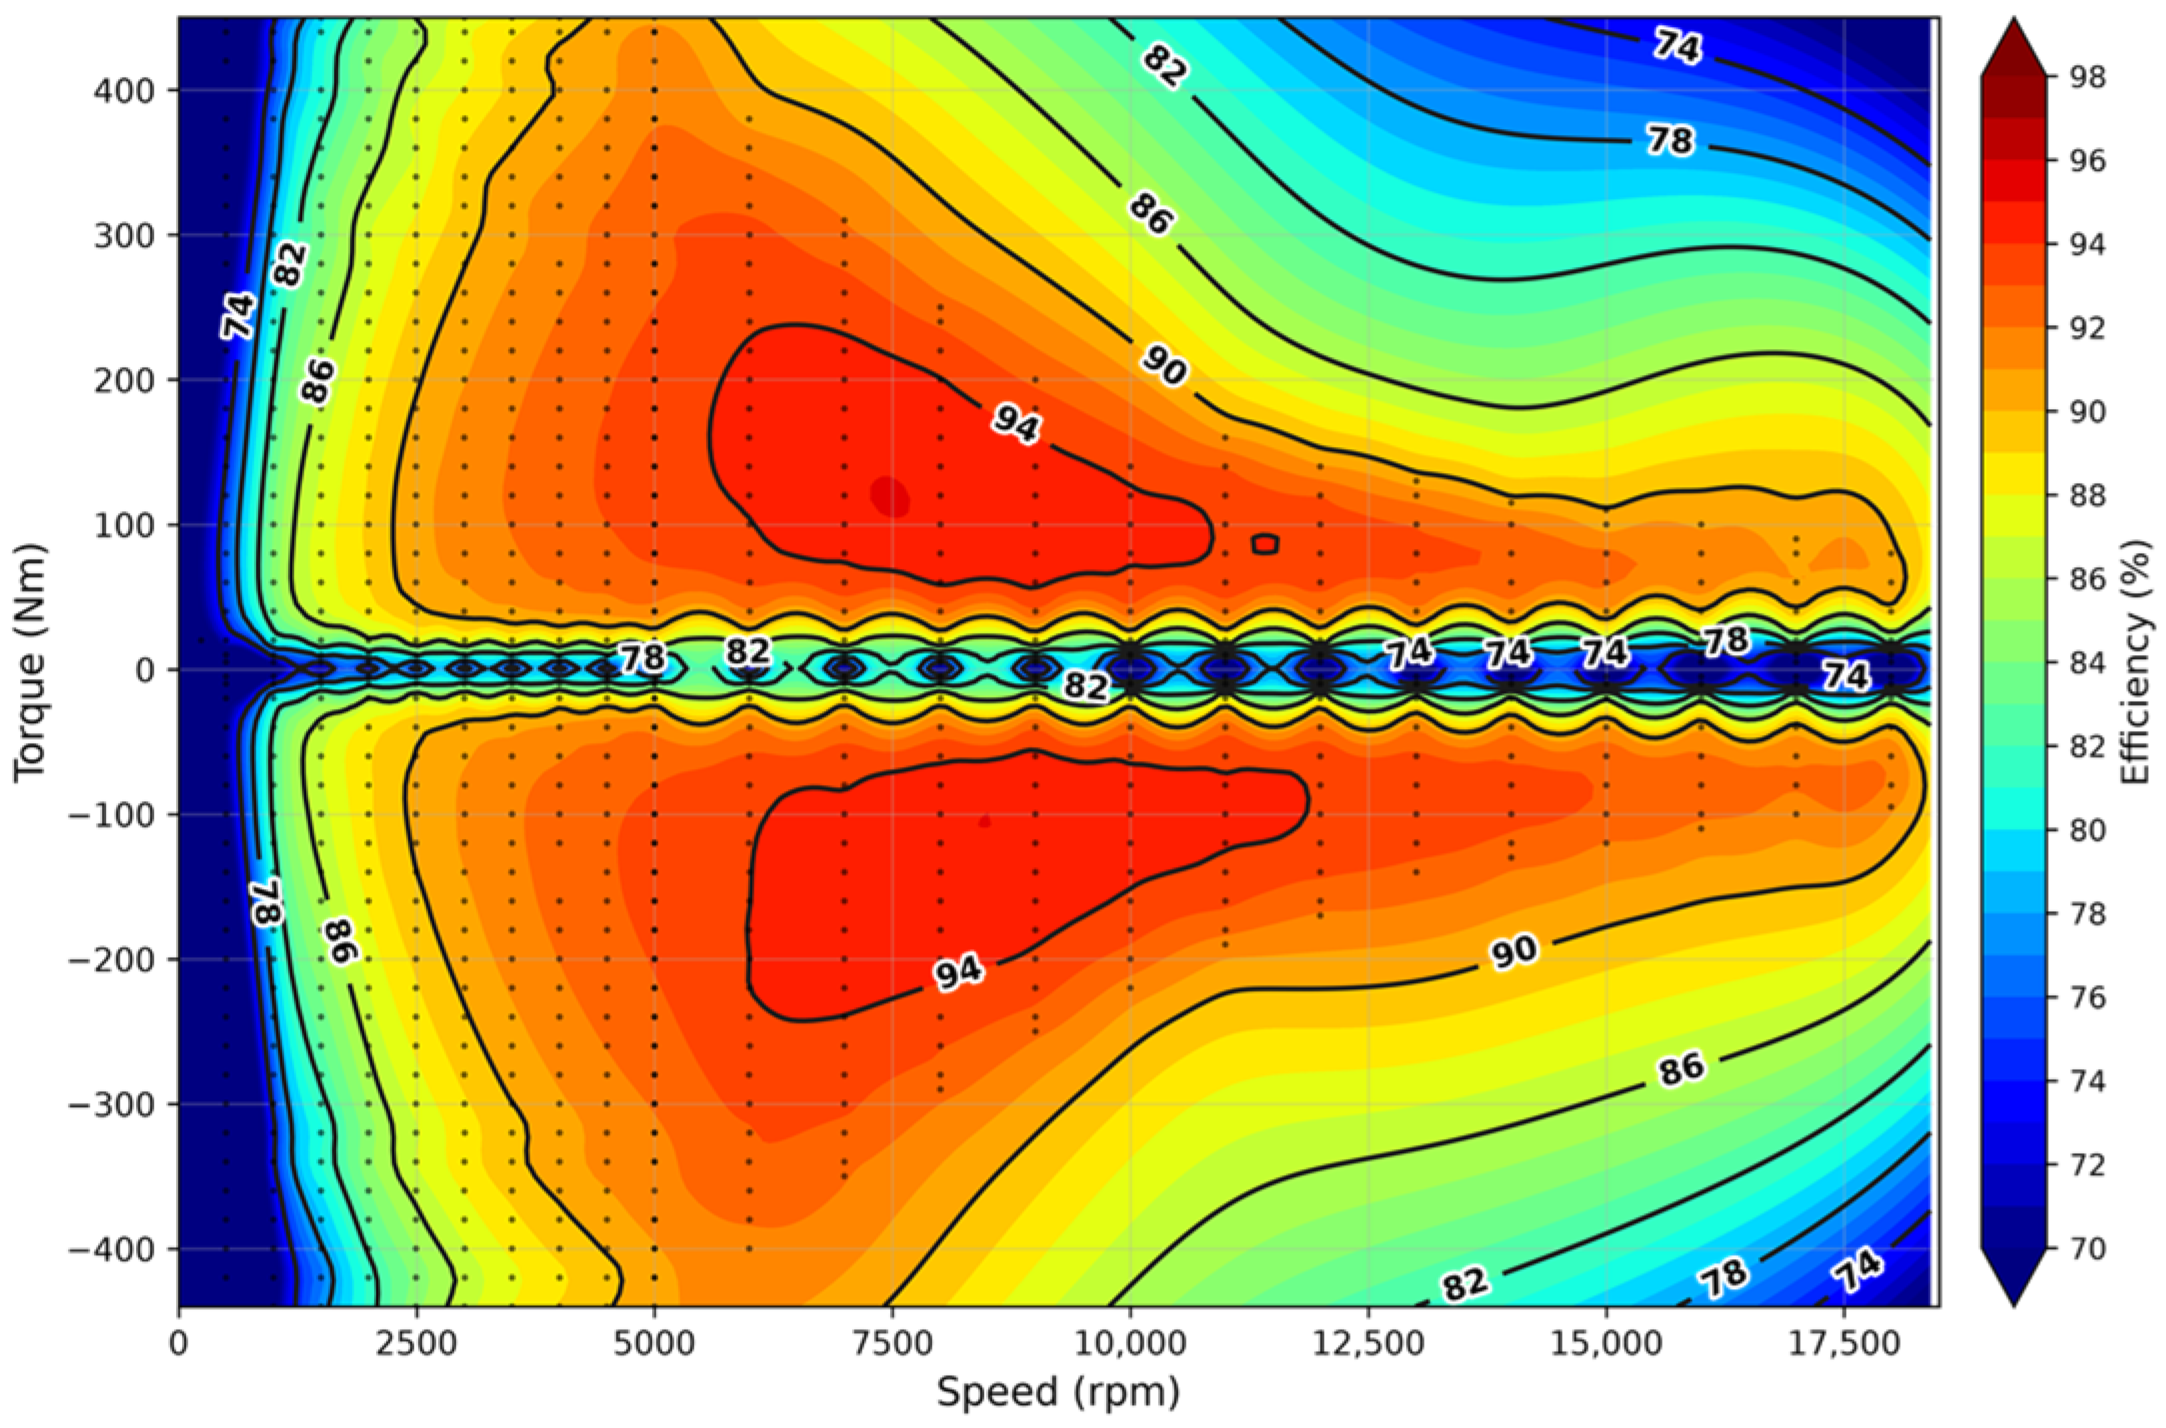
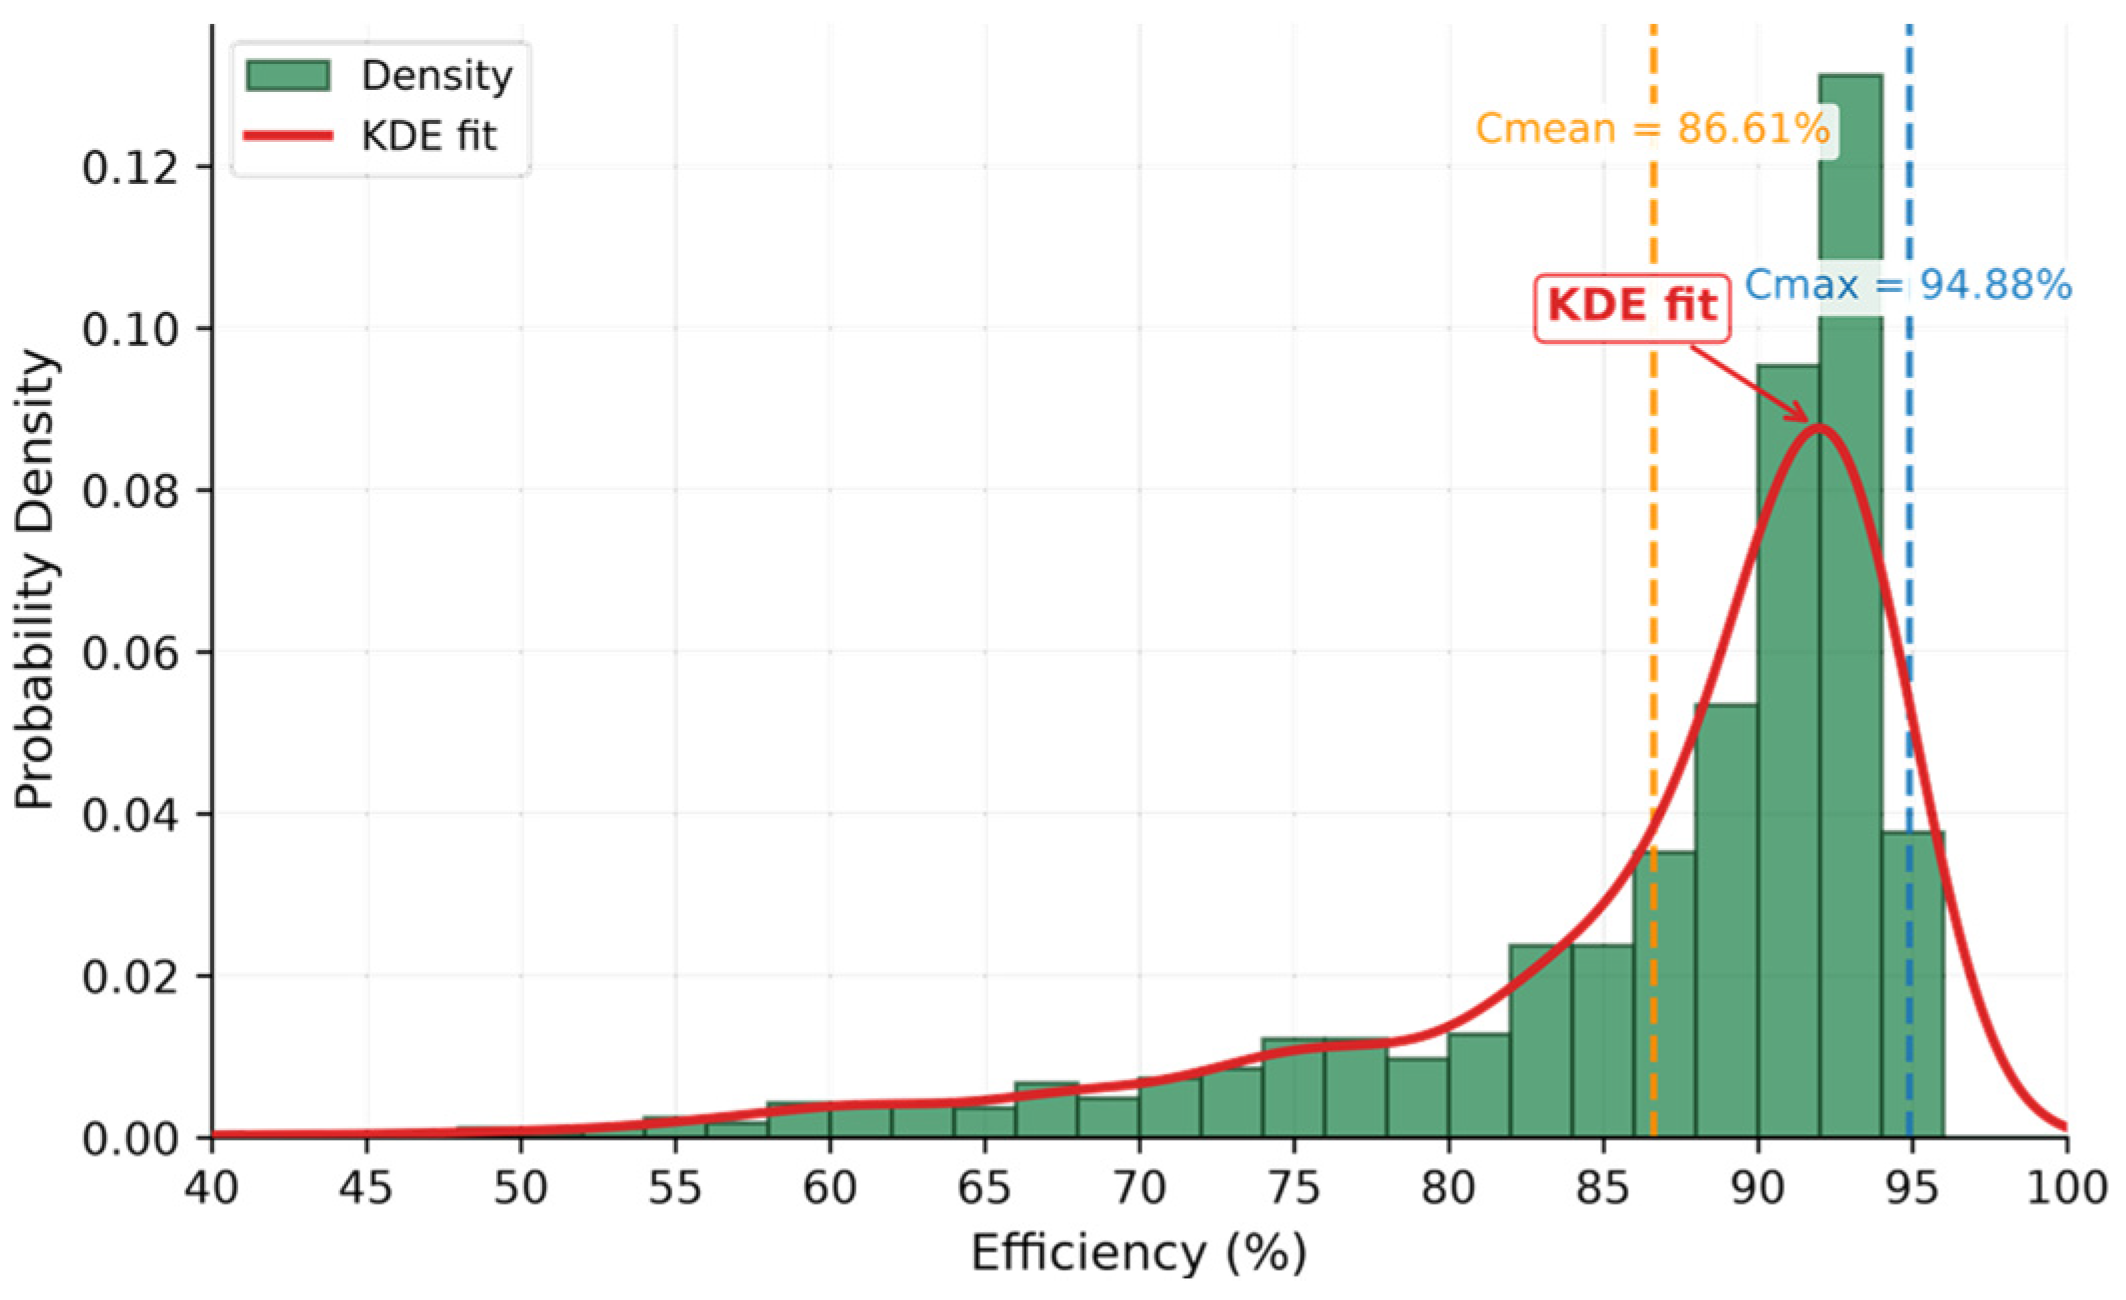
The measured peak system efficiency of 94.88% occurs at a moderate speed-torque combination of 7000 rpm and 120 Nm. This result is consistent with typical PMSM drive system performance, where peak efficiency occurs in the mid-speed, mid-load region with optimally balanced copper and iron losses. The high-efficiency region (η > 90%) encompasses 52.7% of all tested operating points, spanning a broad operating region at speeds above 2500 rpm. This broad efficient envelope suggests suitability for vehicle drive-cycle operation, as reflected by the broad high-efficiency region in Figure 9.
The efficiency distribution across all operating points is presented in Figure 10.
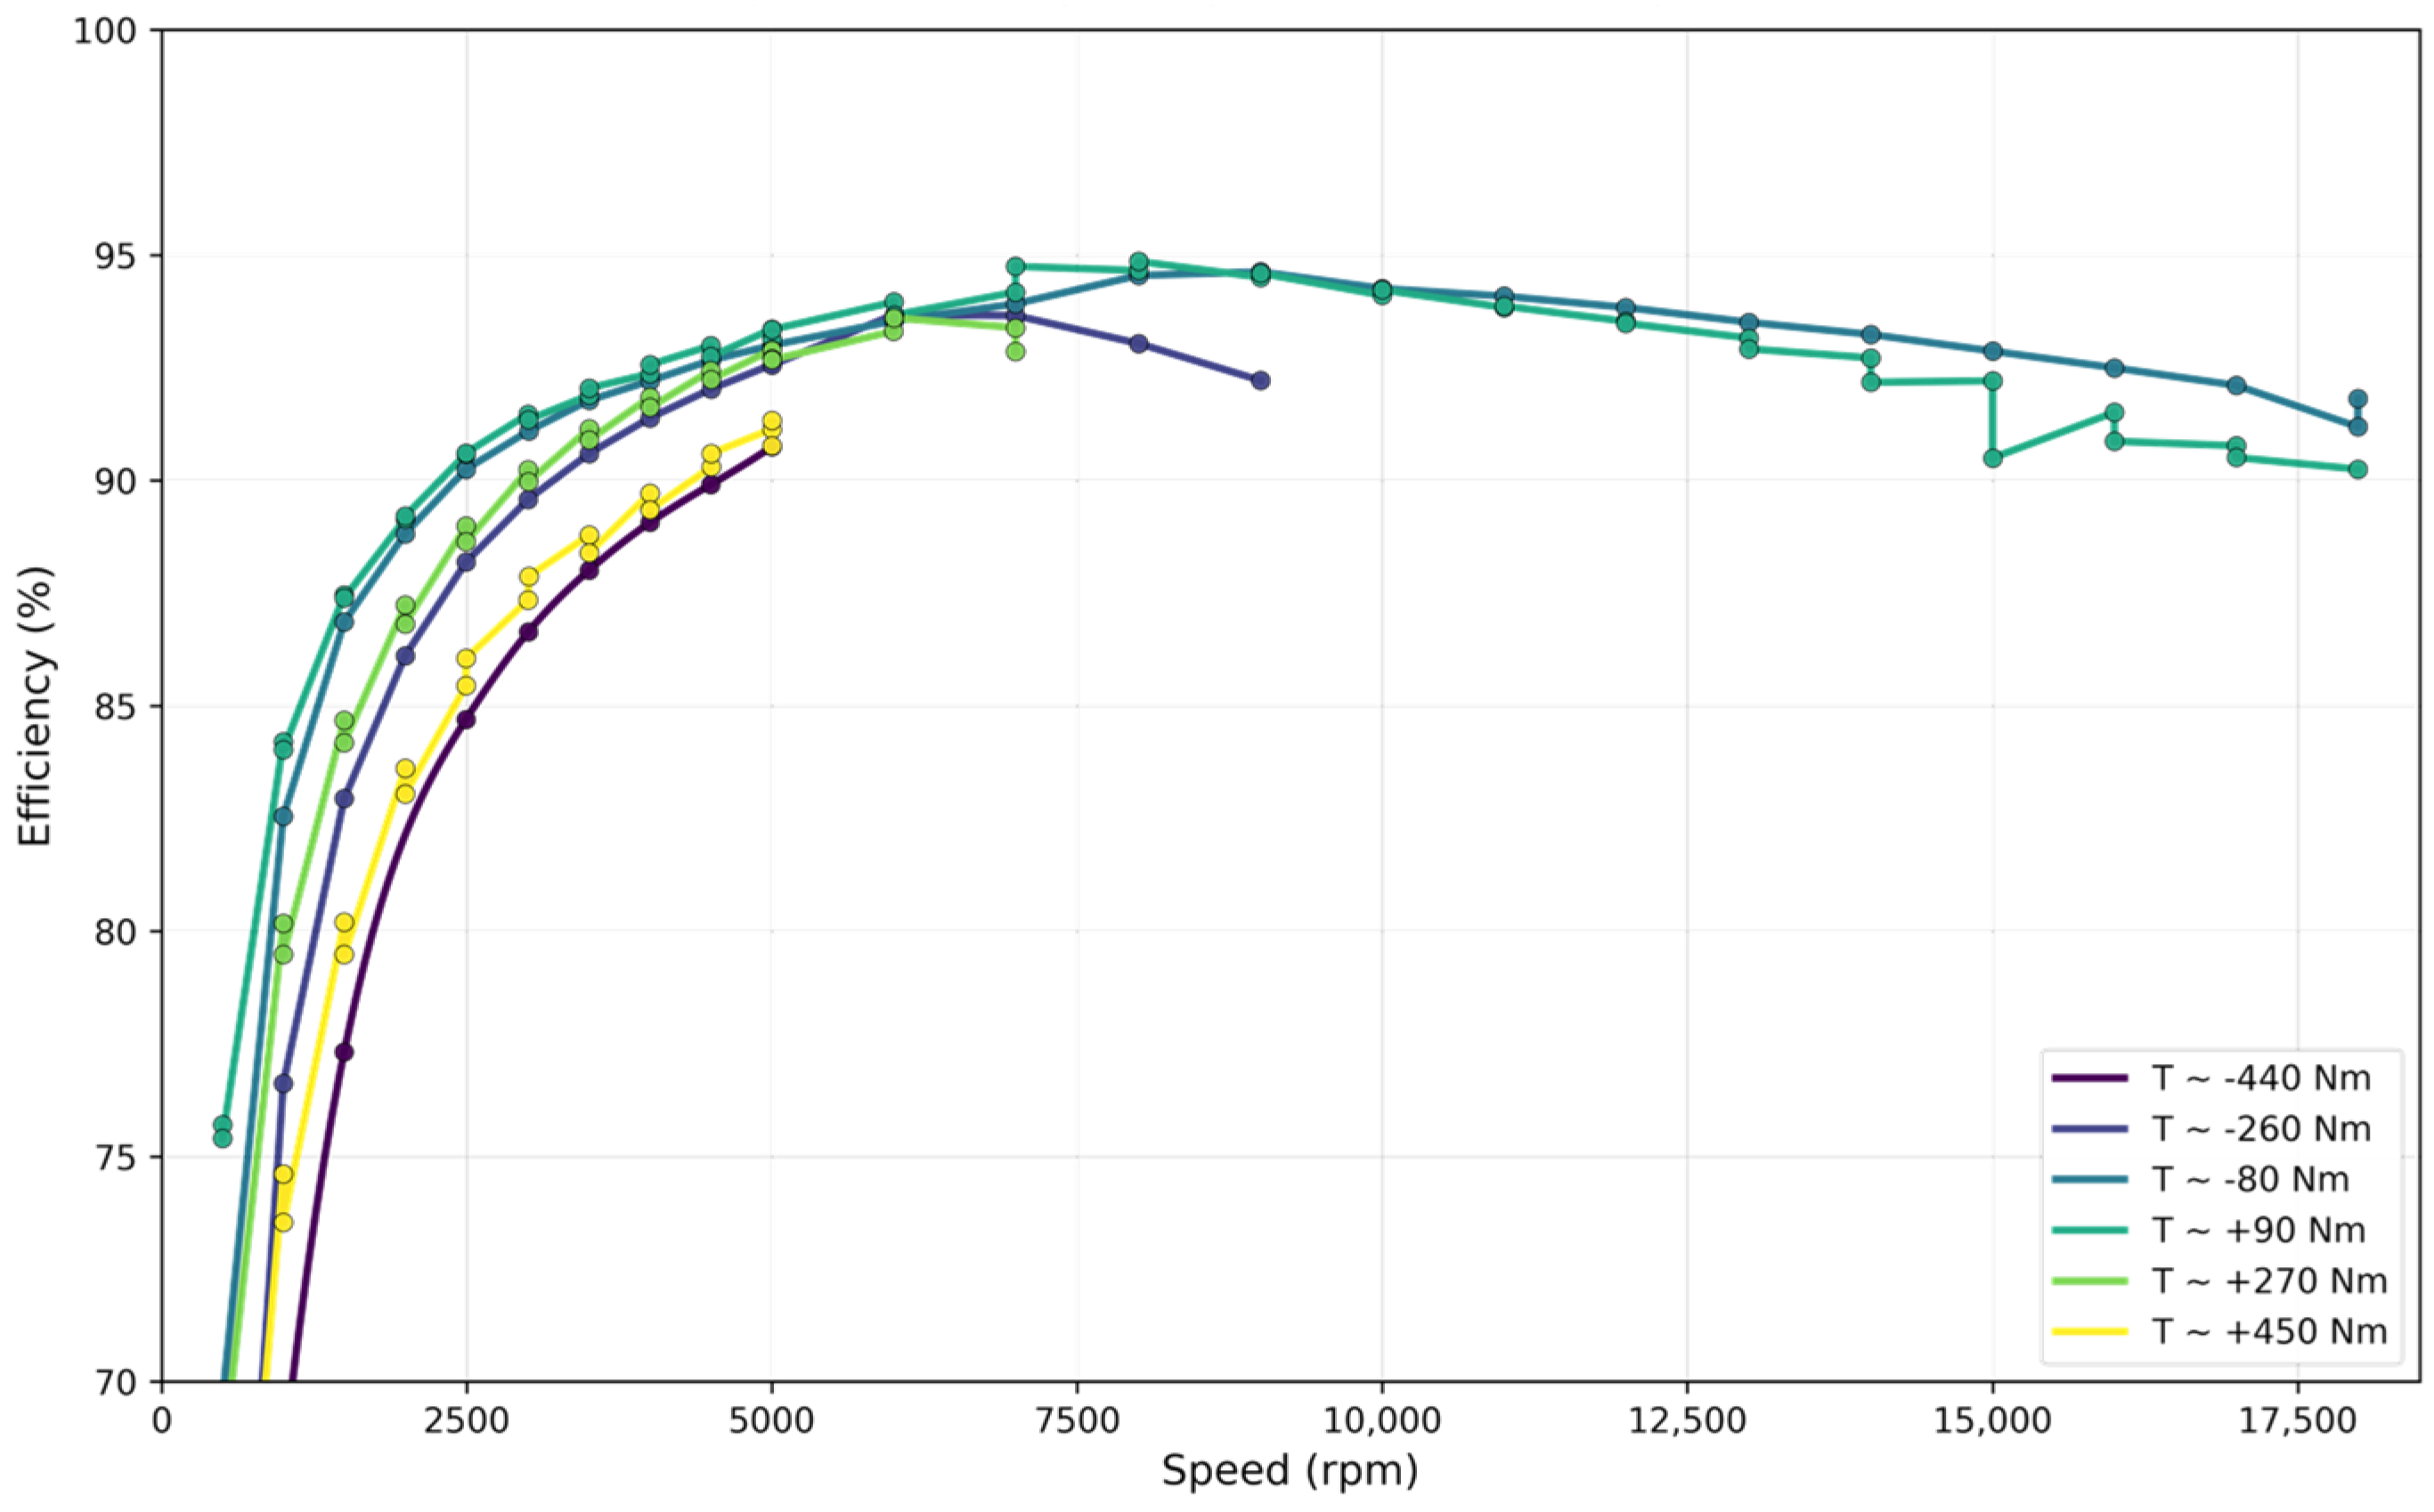
The self-consistency of the efficiency MAP was validated by comparing each measured point against a lumped-parameter loss model incorporating copper loss, iron loss, and fixed auxiliary losses, following the validation approach of Novak and Novak [20]. The RMS deviation between measured and modeled efficiency was 2.3 percentage points, confirming the reliability of the dual-sensor torque measurement system. The efficiency-versus-speed characteristic across selected torque levels is presented in Figure 11.
The combined measurement uncertainty of the system efficiency was estimated by propagating the individual sensor uncertainties (torque sensor ±0.05% FS on the 500 Nm full-scale flange, speed encoder ±0.01% FS, voltage transducer ±0.2% FS, and current transducer ±0.2% FS). Because the torque-sensor specification is a constant full-scale term (0.25 Nm in absolute terms) rather than a percentage of reading, its relative contribution increases at low torque. The resulting relative uncertainty (k = 2, 95% confidence interval) was ±1.15% at 50 Nm, ±0.70% at the rated torque of 120 Nm, and ±0.58% at the peak-power operating point (380 Nm, 240 kW). The DC voltage and current transducers were the dominant variance sources at high torque (each contributing approximately 48% of the total variance), whereas the torque sensor became co-dominant at low torque.

4.4. Temperature Rise Analysis

Temperature data were acquired at all 823 steady-state operating points for three critical components: motor winding (embedded PT100 sensor), inverter power module (internal NTC thermistor), and bearing housing (surface-mounted PT100). Table 4 summarizes the temperature statistics across all 823 operating points.
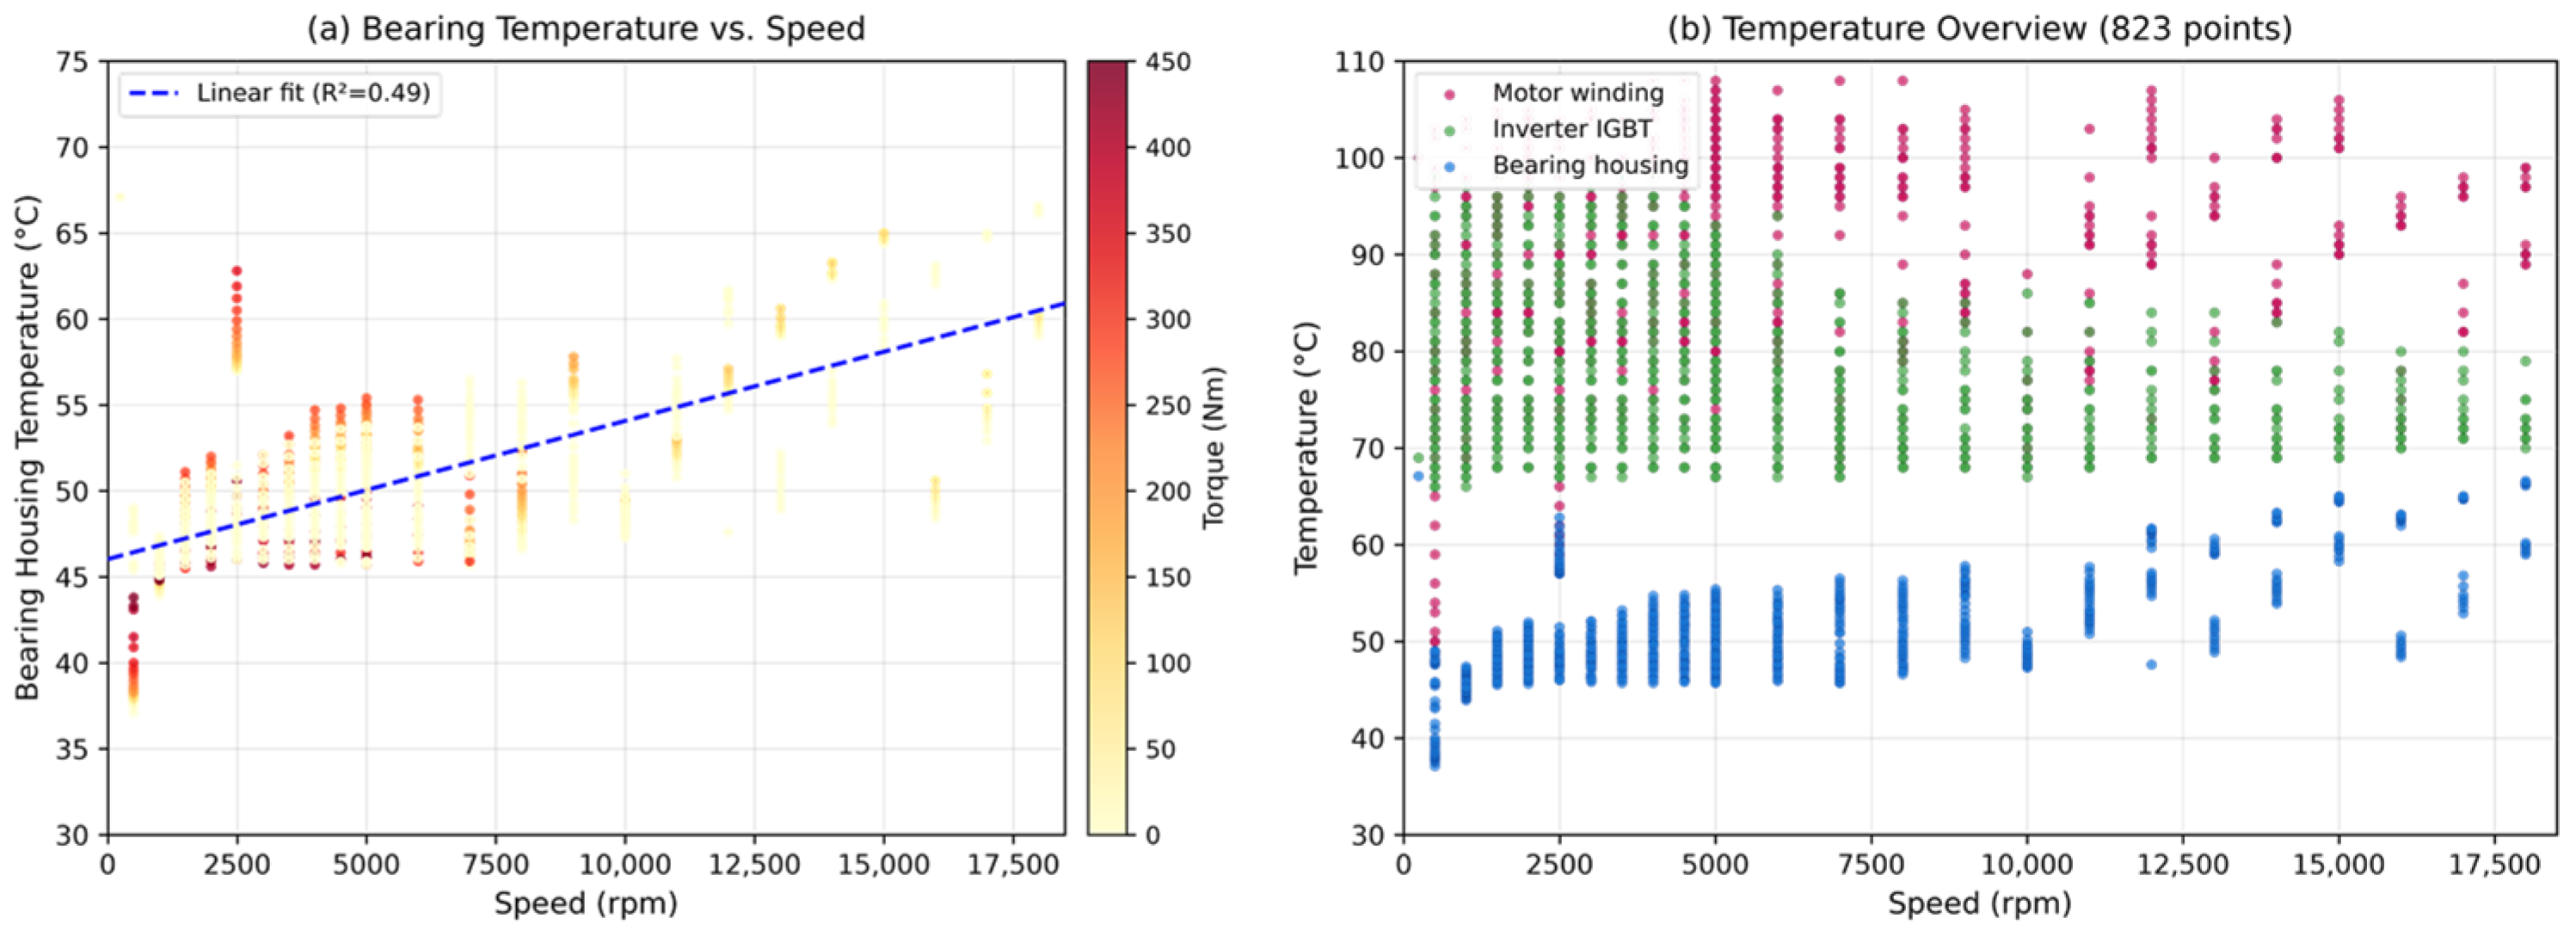
Across all 823 operating points, the linear correlation between temperature and motor shaft speed is weak for all measured components (R2 ≈ 0.49 for bearing housing temperature versus speed), indicating that thermal loading is dominated by torque and electrical losses rather than speed alone. The maximum motor winding temperature of 108.0 °C occurs at the peak-torque operating point (450 Nm, 4500 rpm, 209.2 kW), remaining below the Class H insulation limit of 180 °C with a margin of 72 °C. A single-variable linear regression of temperature on speed (R2 ≈ 0.49) was used here only to illustrate the overall trend rather than as a predictive model. Accordingly, the trend projection of 93.5 °C at the maximum motor speed of 18,000 rpm is lower than the peak observed at high-torque, lower-speed conditions, and remains well below any derating threshold. The complete thermal dataset is presented in Figure 12.
The inverter IGBT temperature follows a similar trend, peaking at 98.0 °C under maximum load conditions. This temperature is within the typical IGBT junction temperature limit of 150 °C, providing a safety margin of approximately 52 °C. The bearing housing temperature remained below 67.1 °C throughout the test, confirming adequate lubrication and cooling in the retrofitted driveline configuration.

4.5. Insulation Monitoring Verification

Insulation resistance was monitored continuously during all test protocols and remained above 50 MΩ under all normal operating conditions. A controlled test introducing a known leakage path (1 MΩ resistor) correctly triggered the warning alarm within 2 s, and a 100 kΩ leakage path correctly triggered emergency shutdown within 500 ms, validating the safety monitoring system. The insulation monitoring function complies with the requirements of IEC 61557-8 [21] for insulation monitoring devices.

4.6. System Performance Assessment

The developed dual-mode measurement and control system successfully addresses the three key technical challenges identified in the retrofitting project, along with thermal management validation:
Control Algorithm Migration: The gain-scheduled PID controller with inertia feedforward achieves speed control error below 5 rpm and torque control accuracy of ±0.35% FS across the entire motor operating range, representing a 15-fold improvement over the original ICE-only system’s ±5.5% FS error (attributed to analog signal conditioning and unshielded wiring). The external characteristic test (Section 4.2) confirmed that the system accurately tracks the motor’s torque-speed boundary, with measured power delivery of up to 240.2 kW matching the expected motor capability.
Signal Fusion and Precision Compensation: The wavelet-based dual-sensor torque measurement approach effectively suppresses inverter-induced harmonic interference while maintaining DC measurement accuracy. The 90% reduction in RMS torque noise (from 12.5 Nm to 1.2 Nm) enabled reliable acquisition of 823 efficiency MAP data points with a mean efficiency of 86.61% and peak of 94.88%. The self-consistency validation (RMS deviation of 2.3 percentage points between measured and modeled efficiency) further corroborates the measurement system’s accuracy.
Energy Feedback Optimization: The dynamic regeneration threshold strategy improved energy recovery efficiency from 58% to 82%, substantially enhancing grid energy recovery. This optimization is further supported by the measured efficiency MAP: the broad high-efficiency region (>90% across 52.7% of operating points) ensures that regenerative braking events consistently operate within the motor’s efficient zone, thereby maximizing the regenerative energy available for AFE grid feedback.
Thermal Management Validation: The temperature measurements across 823 operating points provide the first comprehensive thermal characterization of the retrofitted platform. Motor winding temperature peaked at 108.0 °C—well within the Class H insulation limit of 180 °C with a 72 °C safety margin—confirming that the dual-circuit cooling system provides adequate thermal management under worst-case continuous loading.
Collectively, the three technical contributions reinforce one another rather than operating in isolation. The cross-mode control migration provides the stable speed and torque regulation on which the other two modules depend. The dual-sensor torque fusion suppresses PWM-induced noise, thereby improving the fidelity of the efficiency MAP and the reliability of the energy feedback optimization. In turn, the AFE optimization maintains a stable DC bus voltage during regeneration, which reduces the electrical disturbances that would otherwise corrupt the torque measurements. This mutual reinforcement is reflected in the end-to-end results: a peak system efficiency of 94.88%, and an energy recovery efficiency improved from 58% to 82%.

4.7. Educational Value

Beyond its technical performance, the dual-mode system provides significant educational value. The modular LabVIEW architecture with sub-VI design enables students to understand measurement and control system principles through hands-on interaction. The system supports motor control algorithm parameter adjustment experiments, efficiency MAP interpretation and powertrain matching exercises, CAN bus communication protocol analysis, and real-time control system design and debugging. Drive-cycle-based energy-consumption analysis, although not performed in the present study, can be readily added as a future teaching module owing to the modular sub-VI architecture.

4.8. Limitations

The current implementation has several limitations. First, the wavelet filter parameters were empirically tuned for the specific IPMSM-under-test, so adaptation to motors with different PWM frequencies may require retuning. Second, the CAN bus interface currently supports only one motor controller protocol. Third, the energy feedback optimization was validated only with the existing AFE hardware. Fourth, the test bench was specified for the 400 V EV platform (600 V DC bus and 650 V battery emulator), which is well matched to the 80 kW-class motor tested here but would require upgrading the DC supply and battery emulator to support today’s higher-voltage (800 V) motor platforms.

5. Conclusions

  • A dual-mode measurement and control system has been developed and validated on a retrofitted 250 kW test bench, addressing the key challenges that arise when extending ICE-era test infrastructure to support electric motor testing. The system integrates three core technical contributions: a gain-scheduled PID controller with inertia feedforward and bumpless mode switching for cross-mode control migration; a wavelet-based dual-sensor torque fusion method using complementary filtering; and an active front end (AFE) energy feedback optimization with quadrant-dependent DC bus voltage setpoints and dynamic regeneration thresholds.
  • Comprehensive validation was conducted on an 80 kW (240 kW peak) interior permanent magnet synchronous motor (IPMSM) across 823 steady-state operating points spanning the full torque-speed envelope. The external characteristic, efficiency MAP, energy recovery, and thermal measurements all confirmed that the system meets the motor’s specifications and operates within safe limits throughout the test campaign.
  • The developed system provides a practical, cost-effective template for laboratories and vocational institutions seeking to modernize their powertrain testing capabilities while preserving existing investments in ICE testing infrastructure. The modular architecture and documented integration procedures enable adaptation to other dynamometer platforms with minimal re-engineering. Several limitations remain to be addressed in future research: the wavelet filter parameters were empirically tuned for the specific IPMSM and its 8–16 kHz PWM switching frequency, the CAN bus interface currently supports only one motor controller protocol, and validation was conducted on a single IPMSM type. Future work will focus on extending the wavelet fusion framework with automatic parameter adaptation for diverse PWM spectra, integrating additional motor controller communication protocols, and verifying the retrofit methodology on more motor topologies and dynamometer platforms.

Author Contributions

Conceptualization, Z.C. and Z.W.; Methodology, Z.C.; Software, Z.C.; Validation, Z.C.; Formal Analysis, Z.C.; Investigation, Z.C.; Resources, Z.W.; Data Curation, Z.C.; Writing—Original Draft Preparation, Z.C.; Writing—Review and Editing, Z.C. and Z.W.; Visualization, Z.C.; Supervision, Z.W.; Project Administration, Z.C.; Funding Acquisition, Z.C. All authors have read and agreed to the published version of the manuscript.

Funding

This research was funded by the Jilin Provincial Department of Education, grant number JJKH20261499KJ.

Data Availability Statement

The efficiency MAP dataset (823 operating points) supporting the findings of this study is available from the corresponding author upon reasonable request. The dataset was acquired using the retrofitted dual-mode test bench described herein, with data acquisition parameters as specified in Section 4.1.

Acknowledgments

The authors thank the 250 kW Powertrain Dynamometer Laboratory and the Testing Center of Shanghai Fuyulong Automotive Technology Co., Ltd. (Shanghai, China) for their support and technical assistance. We thank Xiaowan Zhao (School of Automotive Engineering, Changchun Technical University of Automobile) for his outstanding contributions during the laboratory’s ICE operational phase and for his forward-looking considerations regarding the future deployment of electric-motor testing.

Conflicts of Interest

The authors declare no conflicts of interest.

Nomenclature

EquationSymbolUnitDescription
(1) K p Proportional gain
K i Integral gain
K d Derivative gain
T f f NmFeedforward torque term compensating gearbox inertia
J kg·m2Total moment of inertia reflected to motor shaft (~0.25)
T s msControl loop sampling period (1 ms)
(2) T f u s e d NmFinal fused torque estimate (closed-loop and logging)
G l o w ( s ) Low-pass filter transfer function (unity DC gain)
G h i g h ( s ) High-pass filter transfer function (zero DC gain)
T f l a n g e NmLow-bandwidth torque flange signal
T k i s t l e r NmWavelet-denoised Kistler 4503B signal
(3) σ j Noise standard deviation at decomposition level j
N j Number of wavelet coefficients at level j
ln Natural logarithm
λ j Universal threshold (following [14])
(4) η %System efficiency (mech output/elec input)
T out NmAverage measured torque
ω rad/sAngular velocity
V d c VDC bus voltage
I d c ADC bus current
Abbr. R 2 Coefficient of determination
R M S Root mean square
F S Full scale

References

  1. International Energy Agency. Global EV Outlook 2025; IEA: Paris, France, 2025. [Google Scholar]
  2. Schubert, M.; Oertel, H. A Motor-Inverter Test Bed for Investigation of Conducted Emissions under Electric Fault Conditions. In 2022 ESA Workshop on Aerospace EMC (Aerospace EMC); IEEE: Piscataway, NJ, USA, 2022. [Google Scholar]
  3. He, G. Design and Implementation of Electric Vehicle Drive Motor Test Platform; Chang’an University: Xi’an, China, 2023. [Google Scholar]
  4. Endress, T.; Bragard, M. Recording of Efficiency-Maps of Low-Power Electric Drive Systems Using a Flexible Matlab-Based Test Bench. In Proceedings of the 2017 IEEE 58th International Scientific Conference on Power and Electrical Engineering of Riga Technical University (RTUCON); IEEE: Riga, Latvia, 2017; pp. 1–5. [Google Scholar]
  5. Schupbach, R.M.; Balda, J.C. A Versatile Laboratory Test Bench for Developing Powertrains of Electric Vehicles. In Proceedings of the IEEE 56th Vehicular Technology Conference, Vancouver, BC, Canada, 24–28 September 2002; IEEE: Piscataway, NJ, USA, 2002; Volume 3, pp. 1666–1670. [Google Scholar]
  6. Boldea, I.; Tutelea, L.N.; Parsa, L.; Dorrell, D. Automotive Electric Propulsion Systems with Reduced or No Permanent Magnets: An Overview. IEEE Trans. Ind. Electron. 2014, 61, 5696–5711. [Google Scholar] [CrossRef] [Scilit]
  7. Dhote, V.P.; Lokhande, M.M.; Gupta, S.C. Test Bench Setup for Emulating Electric Vehicle On-Road Conditions. Energy Rep. 2023, 9, 218–227. [Google Scholar] [CrossRef] [Scilit]
  8. Roy, P.; Bandyopadhyay, A. Control of a Three-Level T-Type Inverter-Fed PMSM with Regenerative Braking Tested with Dynamometer Test Bench Emulation and EV Load. IEEE Trans. Transp. Electrif. 2025, 12, 487–498. [Google Scholar] [CrossRef] [Scilit]
  9. Veyrat Durbex, A.F.; Nachajon Schwartz, Y.; Tacca, H. Solutions for Torque and Speed Measurement on Electric Machine Controllers Test Benches. Elektron 2021, 5, 20–31. [Google Scholar] [CrossRef] [Scilit]
  10. Control Techniques. Unidrive M600 User Guide; Emerson Industrial Automation: Eden Prairie, MN, USA, 2015. [Google Scholar]
  11. National Instruments. LabVIEW 2020 Real-Time Module Help; National Instruments: Austin, TX, USA, 2020. [Google Scholar]
  12. Singh, R.; Kachhwaha, M.; Fulwani, D. Active Disturbance Rejection and Low-Speed Performance Enhancement in EV Drives Using ASISMC under Dynamic Load Conditions. CES Trans. Electr. Mach. Syst. 2025, 9, 463–472. [Google Scholar] [CrossRef] [Scilit]
  13. Daubechies, I. Ten Lectures on Wavelets; SIAM: Philadelphia, PA, USA, 1992. [Google Scholar]
  14. Donoho, D.L.; Johnstone, I.M. Adapting to Unknown Smoothness via Wavelet Shrinkage. J. Am. Stat. Assoc. 1995, 90, 1200–1224. [Google Scholar] [CrossRef]
  15. SAE J1939; Serial Control and Communications Heavy Duty Vehicle Network. SAE International: Warrendale, PA, USA, 2013.
  16. National Instruments. NI-XNET CAN Hardware and Software Manual; National Instruments: Austin, TX, USA, 2019. [Google Scholar]
  17. ISO 13849-1:2023; Safety of Machinery—Safety-Related Parts of Control Systems—Part 1: General Principles for Design. ISO: Geneva, Switzerland, 2023.
  18. GB/T 18488-2024; Drive Motor System for Electric Vehicles—Specifications. Standardization Administration of China: Beijing, China, 2024.
  19. Chang, S.-H.; Yeh, H.-Y. Optimal Efficiency and Automatic Current Commands Map Generator for an Interior Permanent Magnet Synchronous Motor in Electric Vehicles. Appl. Sci. 2025, 15, 9838. [Google Scholar] [CrossRef] [Scilit]
  20. Novak, M.; Novak, J. Test Setup with a Permanent Magnet Synchronous Machine for Efficiency Maps of an Electric Vehicle. In Proceedings of the 2018 23rd International Conference on Electrical Machines (ICEM 2018), Alexandroupoli, Greece, 3–6 September 2018; IEEE: Piscataway, NJ, USA, 2018; pp. 2471–2477. [Google Scholar]
  21. IEC 61557-8; Electrical Safety in Low Voltage Distribution Systems up to 1000 V a.c. and 1500 V d.c.—Equipment for Testing, Measuring or Monitoring of Protective Measures—Part 8: Insulation Monitoring Devices for IT Systems. International Electrotechnical Commission: Geneva, Switzerland, 2014.
Figure 1. Front (left) and rear (right) views of the retrofitted 250 kW dynamometer test bench, illustrating the IPMSM under test, torque flange, and mechanical coupling assembly.
Wevj 17 00476 g001
Figure 2. Four-layer LabVIEW software architecture of the dual-mode measurement and control system.
Wevj 17 00476 g002
Figure 3. Main operator interface of the dual-mode measurement and control system developed in LabVIEW, consisting of a toolbar, control command panel, real-time data displays, waveform monitors, and status bar.
Wevj 17 00476 g003
Figure 4. Dual-mode state machine with four primary states and operator-confirmed transition paths.
Wevj 17 00476 g004
Figure 5. Experimental results of the torque signal fusion process, illustrating wavelet decomposition levels, frequency spectrum distribution, and filtering outputs.
Wevj 17 00476 g005
Figure 6. Schematic of the AFE energy feedback optimization strategy: (a) DC bus voltage monitoring with a 620 V regeneration threshold and 15 V hysteresis band; (b) operating mode decision logic with quadrant-dependent DC bus voltage setpoints (600 V for motoring, 640 V for regeneration); (c) comparison of energy recovery efficiency before (58%) and after (82%) optimization.
Wevj 17 00476 g006
Figure 7. Mechanical measurement chain of the retrofitted dual-mode test bench.
Wevj 17 00476 g007
Figure 8. External characteristic curves of the 80 kW IPMSM, showing the transition from the 450 Nm constant-torque region to the constant-power region above the base speed. The dashed vertical line at 4500 rpm separates the constant-torque and constant-power regions.
Wevj 17 00476 g008
Figure 9. Efficiency MAP of the 80 kW IPMSM measured on the retrofitted test bench (823 data points), with contours representing system efficiency as a function of speed and torque.
Wevj 17 00476 g009
Figure 10. Efficiency distribution of all 823 measured operating points, showing a left-skewed distribution with a mode in the 92–94% range. The red curve represents the kernel density estimate (KDE) of the efficiency distribution.
Wevj 17 00476 g010
Figure 11. Efficiency versus speed at selected torque levels, illustrating the efficiency plateau behavior typical of IPMSM drive systems.
Wevj 17 00476 g011
Figure 12. Thermal data from 823 MAP operating points: (a) bearing temperature versus speed (color-coded by torque); (b) temperature comparison of the three components. The linear fit yields R2 = 0.49.
Wevj 17 00476 g012
Table 1. Active Front End (AFE) Parameter Comparison and Energy Recovery Efficiency Before and After Optimization.
AFE ParameterICE Mode (Original)Motor Mode (Optimized)
Regeneration trigger threshold650 V620 V
DC bus setpoint (motoring)650 V600 V
DC bus setpoint (regeneration)650 V640 V
AFE current limit (regeneration)80% of rated95% of rated
Energy recovery efficiency58%82%
Table 2. External Characteristic Test Results—Selected Operating Points.
Speed (rpm)Torque (Nm)Mechanical Power (kW)System Efficiency (%)Winding Temp (°C)
50045022.958.8102
150045068.879.592
2500450114.986.075
3500450161.488.494
4500450209.290.392
6000380240.290.7104
9000200200.092.8103
12,000140184.391.194
15,000110166.890.1106
18,00080149.990.391
Table 3. Efficiency MAP Statistical Summary (N = 823 Operating Points).
StatisticValue
Mean efficiency86.61%
Standard deviation9.21%
Minimum efficiency40.36%
Maximum (peak) efficiency94.88%
Peak efficiency location7000 rpm, 120 Nm
Operating points with η > 90%434 (52.7%)
Area fraction with η > 90% (grid cells)63.4%
Area fraction with η > 90% (operating points)52.7%
Table 4. Temperature Measurement Summary Across 823 Operating Points.
ComponentSensor TypeMean (°C)Max (°C)Min (°C)Range (°C)
Motor windingEmbedded PT10087.7108.048.060.0
Inverter IGBTInternal NTC77.498.066.032.0
Bearing housingSurface PT10050.667.137.130.0
Disclaimer/Publisher’s Note: The statements, opinions and data contained in all publications are solely those of the individual author(s) and contributor(s) and not of MDPI and/or the editor(s). MDPI and/or the editor(s) disclaim responsibility for any injury to people or property resulting from any ideas, methods, instructions or products referred to in the content.