Article

Interpretable Station-Level Charging Congestion Pressure Assessment and Multi-Horizon Early Warning for Electric-Vehicle Charging Infrastructure

School of Naval Architecture, Ocean and Energy Power Engineering, Wuhan University of Technology, Wuhan 430081, China
World Electr. Veh. J. 2026, 17(9), 443; https://doi.org/10.3390/wevj17090443 (registering DOI)
Submission received: 5 July 2026 / Revised: 5 August 2026 / Accepted: 10 August 2026 / Published: 25 August 2026
(This article belongs to the Section Charging Infrastructure and Grid Integration)

Abstract

The rapid growth of electric-vehicle charging demand has increased the need for reliable station-level congestion monitoring and early warning. Existing studies mainly predict charging demand, load, occupancy, or availability, whereas charging congestion pressure is usually shaped by multiple operational factors. This study proposes an interpretable station-level charging congestion pressure assessment and multi-horizon early-warning framework. A Charging Congestion Pressure Index (CCPI) is constructed by integrating occupancy, arrival pressure, charging or occupation duration, service volume, and price–time context into a unified station–hour pressure representation. Based on temporally aligned current, lagged, and rolling features, future high-pressure states are predicted at 1 h, 3 h, and 6 h horizons. Using 1423 charging stations and 6,181,512 station–hour observations from September 2022 to February 2023, this study evaluates whether the proposed station–hour pressure representation can support multi-horizon high-pressure warning under temporal and station-level validation settings. Results show that current pressure is a strong short-term persistence baseline, while learning-based models provide larger F1-score gains at longer horizons. Extreme Gradient Boosting (XGBoost) achieved F1 gains of +0.022, +0.040, and +0.068 over the persistence baseline at the 1 h, 3 h, and 6 h horizons, respectively. Ablation, temporal validation, station holdout validation, and block-bootstrap tests further support the stability of the proposed framework. These findings indicate that interpretable pressure-index construction and temporally consistent multi-horizon warning can provide an engineering decision-support basis for charging-infrastructure operation, station-level congestion monitoring, and proactive resource management.

1. Introduction

The rapid growth of electric vehicles (EVs) has increased the operational pressure on public charging infrastructure. According to the International Energy Agency’s “Global EV Outlook 2026,” the continued expansion of electric mobility is increasing the importance of charging-infrastructure availability and service reliability for urban transport and energy systems [1]. Although the expansion of charging facilities can partly alleviate infrastructure constraints, charging stations in dense urban areas may still experience local congestion during peak periods, and uncoordinated charging can also create additional power-system stress [2,3]. Such congestion can lead to longer waiting times, reduced charger availability, additional search or cruising behavior, and service-capacity pressure at charging facilities [4,5,6,7]. From the perspective of electric-vehicle charging infrastructure operation, this problem requires a station-level monitoring framework that can translate heterogeneous charging records into interpretable pressure states and actionable early-warning outputs for smart charging management, user guidance, and charging-service coordination.
Despite substantial progress in EV charging prediction and operational planning [8,9], routinely available station–hour records have rarely been transformed into an interpretable multidimensional pressure state that supports consistent warning across multiple operational lead times. In addition, the evaluation of such warning should jointly account for temporal dependence, station heterogeneity, and strict information-leakage control [10,11]. These gaps motivate the integrated pressure-assessment and multi-horizon warning framework developed in this study.
To address these issues, this study proposes an interpretable station-level charging congestion pressure assessment and multi-horizon early-warning framework. Raw station-level charging records are aggregated into hourly observations, and a Charging Congestion Pressure Index (CCPI) is constructed by integrating occupancy, arrival pressure, charging or occupation duration, service volume, and price–time context. Based on temporally aligned current, lagged, and rolling features, future high-pressure states are predicted at 1 h, 3 h, and 6 h horizons. Using 1423 charging stations and 6,181,512 station–hour observations from September 2022 to February 2023, this study evaluates whether the proposed pressure indicator can support multi-horizon high-pressure warning under temporal and station-level validation settings. Multiple validation and ablation analyses are then used to evaluate predictive performance, generalization ability, feature contribution, and statistical robustness.
The main contributions of this study are summarized as follows.
  • This study develops an interpretable station-level Charging Congestion Pressure Index (CCPI) to represent EV charging congestion as a multidimensional operating state. Unlike single-indicator descriptions based only on occupancy or demand volume, the proposed CCPI integrates occupancy, arrival pressure, charging or occupation duration, service volume, and price–time context into a unified station–hour pressure representation. The index provides an interpretable pressure indicator for subsequent warning analysis.
  • This study formulates EV charging congestion management as a multi-horizon high-pressure warning task for charging-infrastructure operation. Future high-pressure states are predicted at 1 h, 3 h, and 6 h horizons, allowing the framework to distinguish short-term pressure persistence from longer-horizon early-warning capability. These horizons correspond to different operational response windows, ranging from immediate station monitoring and user guidance to charging-service coordination and local resource planning. Temporally aligned lagged and rolling features are constructed so that only information available at or before the prediction timestamp is used.
  • This study provides a deployment-oriented validation framework for evaluating EV charging pressure warning under temporal dependence and station heterogeneity. Chronological testing, month-wise temporal validation, and station holdout validation are used to examine performance under chronological, later-month, and unseen-station settings. Indicator ablation, feature ablation, mechanism analysis, and paired station–month block-bootstrap tests are further used to evaluate feature contributions, statistical stability, and the robustness of the proposed warning framework for charging-infrastructure operation.
The remainder of this paper is organized to progressively develop and evaluate the proposed framework. Section 2 reviews previous research on EV charging prediction, station operation, congestion-related factors, and validation methods. Section 3 describes the construction of the CCPI, the multi-horizon warning task, the feature design, and the validation protocol. Section 4 presents the warning performance and further examines the framework through indicator ablation, feature ablation, and temporal and station-level generalization analyses. The operational implications and main findings are discussed in Section 5, followed by the conclusions and future research directions in Section 6.

2. Related Work

EV charging prediction has been widely studied to support charging-network management, power-system operation, infrastructure planning, and user guidance. Earlier studies mainly employed probabilistic models, conventional time-series methods, and data-driven algorithms to predict aggregate charging load or demand [12,13,14,15,16,17,18,19]. Station occupancy and charger availability have been predicted using hybrid recurrent and federated-learning models [20,21]. Recent benchmark datasets have also provided transaction-level or aggregated station-level charging records for broader charging-behavior and demand analyses [22,23]. More recently, charging prediction has increasingly incorporated spatial dependencies, traffic conditions, weather variables, urban functional characteristics, price signals, and other contextual information through heterogeneous graph learning, adaptive graph recurrent networks, physics-informed models, federated graph learning, and language-model-based methods [9,24,25,26,27,28,29,30,31]. A recent review further indicates that the selection and evaluation of charging-demand forecasting methods should consider the prediction horizon, data scale, temporal coverage, and intended operational application [9]. These studies have substantially improved the representation of nonlinear and spatiotemporal charging patterns. However, their prediction outputs generally remain individual operational targets, such as charging load, demand volume, occupancy, energy consumption, or charger availability, rather than an integrated representation of station-level congestion pressure.
In parallel with prediction-oriented research, EV charging congestion has also been investigated through queueing theory and operations-research approaches. Queueing-based studies represent charging facilities as service systems and describe congestion using vehicle arrival rates, charging-service rates, charger capacities, queue lengths, waiting times, and blocking or utilization conditions [4,5,6]. Operations-research studies have further incorporated these quantities into charging-station location and capacity planning, vehicle-to-station assignment, route choice, reservation management, and charging scheduling under service-capacity and grid constraints [32,33,34]. Recent studies have used centralized coordination to redistribute charging demand among motorway stations and reduce waiting times, while queue-aware scheduling models have combined virtual waiting states, charger availability, and station power constraints within optimization frameworks [35,36,37]. These approaches provide direct prescriptive decisions for congestion mitigation when detailed service-process information is available. Nevertheless, they commonly require vehicle-level arrival and departure times, state-of-charge information, trip paths, queue positions, charger-level service states, or station power limits [4,5,6,32,33,34,35,36,37]. Such information differs from the aggregated station–hour observations available in many public charging datasets. Consequently, applying a complete queueing or vehicle-assignment model to aggregated data may require service-process assumptions that cannot be directly verified.
Existing charging studies have also introduced operational indicators for different monitoring objectives. Occupancy- and availability-based measures describe the current use of charging resources, energy or charging-volume measures characterize service intensity, and queueing-related measures describe the relationship between service demand and available capacity [4,5,6,20,21,22,23]. Price, time, driver heterogeneity, and seasonal variation have also been shown to influence charging behavior and station utilization [38,39,40]. These specialized measures are informative when the monitored outcome is directly aligned with their definitions. For example, occupancy-oriented indicators are appropriate for identifying highly occupied stations, whereas energy-utilization indicators are more suitable for measuring delivered charging service. However, a station may experience operational pressure through the combined effects of high resource occupation, rapid demand inflow, prolonged charger occupation, intensive service activity, and unfavorable temporal or pricing conditions. A single-purpose measure does not necessarily represent all of these mechanisms simultaneously. Composite-indicator methodology provides a means of normalizing and aggregating heterogeneous variables into a common representation [41]. Within this setting, the CCPI provides an interpretable station–hour pressure representation for integrated monitoring and multi-horizon warning.
Validation design is another important issue in EV charging prediction. Charging observations from the same station and adjacent timestamps are temporally dependent, and station-level operating patterns may also differ substantially across locations. A purely random sample split may therefore place closely related observations in both the training and test partitions and produce an optimistic estimate of deployment performance. General studies of structured and time-dependent data emphasize that validation procedures should reflect the intended prediction setting and prevent information from the test period entering feature construction, parameter selection, normalization, or target definition [8,10,11,42,43]. For station-level warning, chronological testing examines performance on later observations, month-wise validation evaluates temporal distribution shifts, and station holdout validation assesses whether the learned relationship can be transferred to stations excluded from model development. In addition, the general model-comparison literature emphasizes that performance differences between supervised classifiers should be assessed statistically rather than from point estimates alone [44]. For temporally dependent observations, the resampling unit should preserve the relevant grouped dependence structure [45,46]. Although these validation principles are individually established, temporal generalization, unseen-station generalization, leakage-controlled pressure-target construction, and dependence-aware statistical comparison are not always examined together within the same EV charging-warning framework.
Taken together, the existing literature provides strong foundations for charging-demand forecasting, station-state prediction, queueing analysis, infrastructure planning, and charging-service optimization. However, several methodological gaps remain relevant to station-level congestion warning. First, most prediction studies formulate a variable-specific target rather than an interpretable multidimensional pressure state. Second, queueing and operations-research approaches generally depend on detailed vehicle-, trip-, queue-, or charger-level information that is unavailable in many station–hour datasets. Third, improvements in predictive accuracy do not necessarily yield an operational indicator that can be interpreted consistently across stations and warning horizons. Fourth, temporal and station-level generalization are not always evaluated together under leakage-controlled feature normalization and threshold construction. Accordingly, multidimensional pressure representation, multi-horizon warning, and generalization assessment are examined within a common station-level framework based on routinely available station–hour observations.

3. Methodology

3.1. Overall Framework and Data Preparation

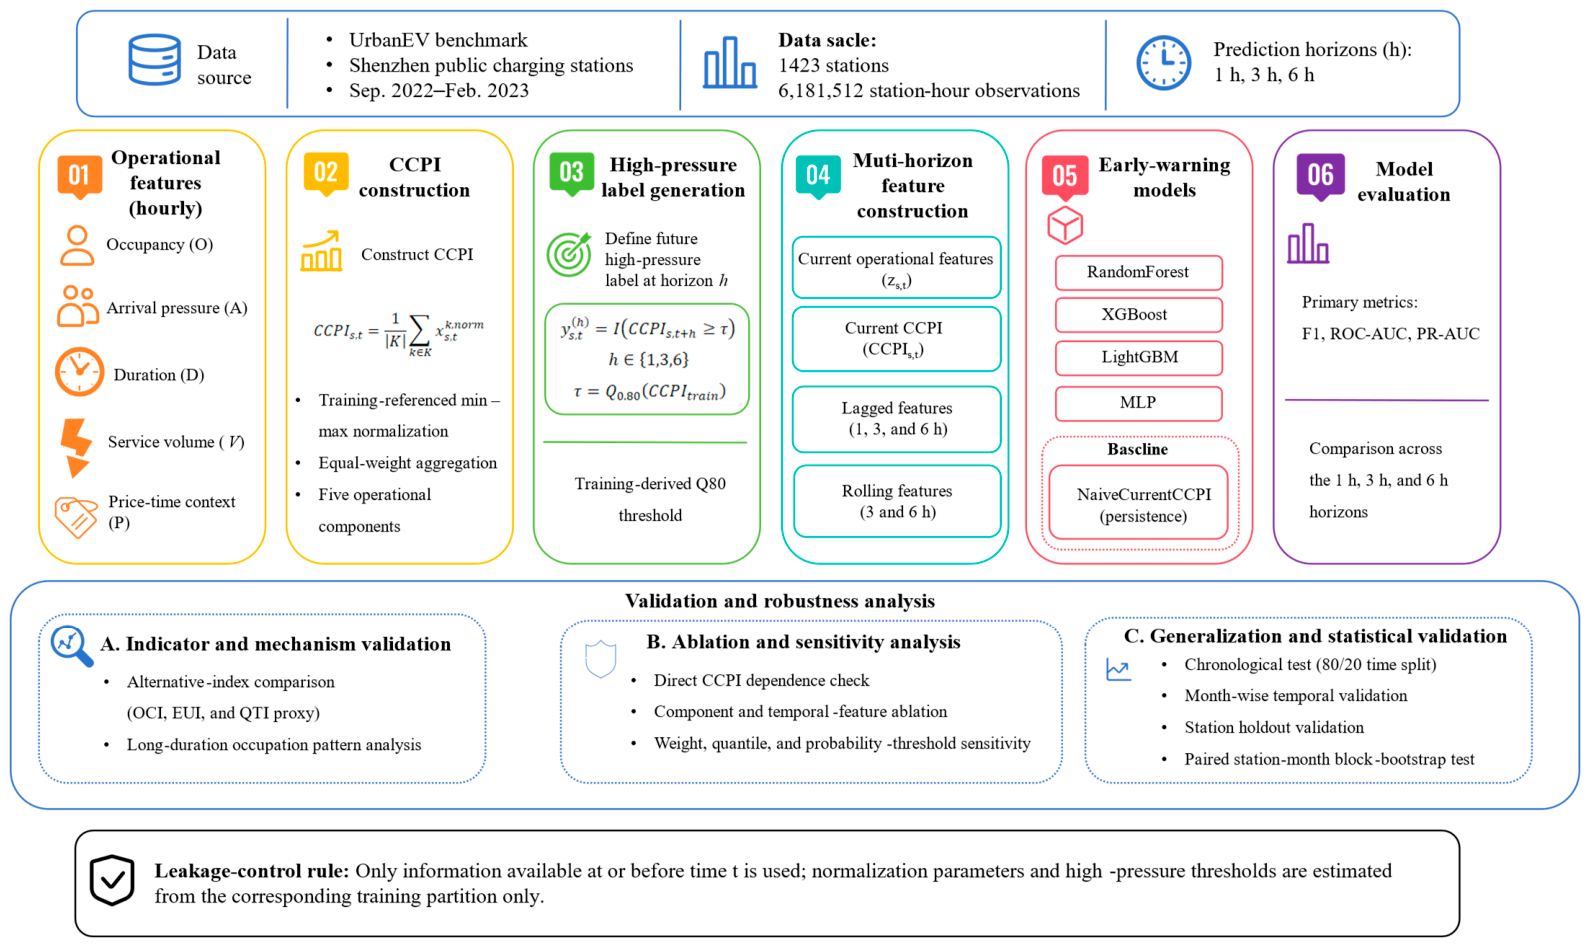
Figure 1 summarizes the six-stage engineering workflow used to construct and evaluate the proposed station-level charging-pressure warning framework. The analysis is based on the publicly available UrbanEV benchmark [23], covering public charging stations distributed across Shenzhen. The original charging information was automatically collected from a mobile charging-service platform at 5 min intervals from 1 September 2022 to 28 February 2023 and included charging-pile availability, pricing information, and station coordinates. After data cleaning and temporal aggregation, the records were organized into the hourly station-level panel used in this study. The CCPI is constructed before supervised modeling and is used as an operational pressure indicator for subsequent warning evaluation.
Let s denote a charging station and t denote an hourly timestamp. Based on the station-level operational variables available in the UrbanEV benchmark [23], each station–hour observation is represented in this study by the operational vector in Equation (1).
z s , t = O s , t , A s , t , D s , t , V s , t , P s , t
where O s , t denotes occupancy level, A s , t denotes arrival pressure, D s , t denotes the total active-charging duration aggregated across charging piles during the station–hour, V s , t denotes charging volume or service volume, and P s , t denotes the price–time-related factor. This vector defines the basic station–hour unit used for pressure-index construction, feature generation, model training, and validation. The analysis used the publicly available UrbanEV dataset. After applying the matrix-alignment, temporal-aggregation, and feature-processing procedure described in Supplementary Note S1, the final dataset was organized as a station–hour panel with 1423 charging stations and 4344 hourly timestamps from 1 September 2022 to 28 February 2023, resulting in 6,181,512 station–hour observations. The benchmark is organized at the station–hour level and therefore represents aggregate station operation rather than individual vehicle origins or mobility histories.
Table 1 reports the descriptive statistics used to characterize the data scale and the empirical CCPI distribution.
For all validation experiments, scaling parameters and high-pressure thresholds are estimated from the corresponding training data and then applied to validation or test observations.

3.2. Charging Congestion Pressure Index Construction

Charging congestion is not fully captured by a single operational indicator. High occupancy reflects direct resource occupation, arrival pressure reflects short-term demand inflow, long duration reflects slow turnover, volume reflects charging service intensity, and the price–time factor reflects operational context. These components are selected according to the operational factors emphasized in previous EV charging studies. Occupancy and availability are closely related to station-state and occupancy prediction [20,21,22,23]. Arrival pressure and service volume are consistent with charging demand and load forecasting studies [12,18,19,25,26]. Long charging or occupation duration and limited service capacity are related to waiting time, queuing, and charging-infrastructure planning analyses [4,5,6,32,33,34]. Price and time-related context are further motivated by studies on electricity price effects, driver heterogeneity, and seasonal charging variation [38,39,40]. The CCPI integrates these heterogeneous components into a unified station-level pressure representation.
Because the pressure components have different units and numerical ranges, training-referenced min–max normalization was applied to place all components on a common bounded scale compatible with equal-weight aggregation, as shown in Equation (2) [41].
x s , t k , n o r m = x s , t k x m i n , t r a i n k x m a x , t r a i n k x m i n , t r a i n k + ϵ
where x s , t k denotes the kth pressure component of station s at time t , x m i n , t r a i n k and x m a x , t r a i n k denote the minimum and maximum values of the kth component estimated from the training partition, and ϵ is a small constant used to avoid division by zero. The normalized component is denoted as x s , t k , n o r m . For validation and test observations, normalized values outside the training-data range were clipped to [0, 1].
Let K = O , A , D , V , P denote the set of pressure components, corresponding to occupancy, arrival pressure, duration, service volume, and price–time context, respectively. The composite Charging Congestion Pressure Index is defined through weighted arithmetic aggregation in Equation (3) [41,47,48].
C C P I s , t = 1 K k K x s , t k , n o r m
where K denotes the set of pressure components and K is the number of components. Equal-weight aggregation provides a transparent and consistent reference for combining normalized pressure components in the absence of application-specific component preferences, although alternative weights may affect the resulting composite indicator [47,48]. This design avoids introducing additional subjective weights when field-observed waiting time, queuing labels, or operator-defined service priorities are unavailable. It also supports consistent interpretation across stations and warning horizons within each validation setting. In practical deployment, the same framework can be extended to calibrated or operator-specific weights when local queuing observations, service-quality targets, or grid-operation constraints are available.
A tation–hour is defined as a high-pressure state when its CCPI is greater than or equal to the 80th percentile threshold estimated from the corresponding training partition. The sample quantile was calculated using the convention described in ref. [49]. Q80 was used as the reference high-pressure definition, while Q75 and Q90 were evaluated as broader and more restrictive alternatives in the sensitivity analysis. In each validation split, the threshold is estimated from the training data only. To examine the robustness of the CCPI specification, supplementary sensitivity analyses were conducted for both the component weights and the high-pressure quantile definition. The equal-weight setting was compared with occupancy-emphasis and duration-emphasis settings, while the Q80 definition was compared with Q75 and Q90. The detailed results are provided in Supplementary Note S6 and Supplementary Tables S11–S14.
The CCPI serves two roles in this study: it provides an interpretable tation–hour pressure indicator and defines the future high-pressure target for the warning task. In this way, the CCPI links operational pressure assessment with supervised warning-target construction.

3.3. Multi-Horizon Warning Task and Feature Construction

The warning task predicts whether a charging station will enter a high-pressure state after a specified lead time. Three horizons are considered: 1 h, 3 h, and 6 h. The 1 h horizon captures short-term pressure persistence, whereas the 3 h and 6 h horizons provide a more informative assessment of longer-horizon early-warning capability because they require the model to anticipate pressure evolution further ahead.
Following the lead-time structure of out-of-sample forecasting evaluation [50], the binary target used in this study is defined by Equation (4).
y s , t h = I C C P I s , t + h τ h 1 , 3 , 6 , τ = Q 0.80 C C P I t r a i n
where I · is the indicator function and τ is the 80th percentile of the training-set CCPI distribution. This definition formulates the warning task as a lead-time prediction problem, where the target state is evaluated at t + h and the predictors are constructed at time t .
Consistent with leakage-controlled out-of-sample forecasting, only information available at or before the prediction time is used [10,11,50], and the temporal availability constraint is expressed in Equation (5).
X s , t = z s , t , C C P I s , t , L a g 1 , 3 , 6 z , C C P I , R o l l 3 , 6 z , C C P I ,     X s , t F s , t
where F s , t denotes the information available for station s at or before time t . Lagged features summarize previous pressure and operational states, while rolling features summarize short-term temporal patterns over 3 h and 6 h windows. No observation after time t is used when constructing X s , t , which maintains temporal consistency in the feature matrix.
The feature design also enables ablation analysis. In addition to the full feature set, alternative settings remove Current CCPI, remove the CCPI-family variables, retain only raw lagged operational features, or retain only current operational variables. These variants are used to quantify the contribution of temporal operating patterns.

3.4. Models, Evaluation Metrics, and Validation Protocol

Random Forest [51], Extreme Gradient Boosting (XGBoost) [52,53], Light Gradient Boosting Machine (LightGBM) [54], and a multilayer perceptron (MLP) [55] were selected as representative supervised-learning models covering bagging-based ensemble learning, gradient boosting, and neural-network-based nonlinear approximation. Tree-based ensemble methods provide strong benchmarks for structured tabular data [56], while RandomForest, XGBoost, and neural-network models have also been applied to EV charging behavior prediction [57]. The benchmark focuses on station-level tabular models because the available UrbanEV records do not provide empirically observed inter-station flows, road-network travel times, or rerouting behavior required to define a reliable interaction topology. All models were therefore evaluated using the same temporally aligned tation–hour feature matrix to ensure a controlled comparison across model families. Spatial extensions based on observed mobility and network relationships are discussed as a direction for future research.
The primary evaluation metrics are F1 score, the area under the receiver operating characteristic curve (ROC-AUC), and the area under the precision–recall curve (PR-AUC). F1 is used to summarize the balance between precision and recall under class imbalance [58], while ROC-AUC and PR-AUC evaluate ranking performance [59,60]. PR-AUC is emphasized because the Q80-defined high-pressure state constitutes the minority class. By focusing on precision and recall, it reflects both missed congestion events and false warnings, whereas ROC-AUC may appear optimistic when the large number of normal station–hours dominates the negative class. The F1 definition is given in Equation (6) [61].
P r e c i s i o n = T P T P + F P , R e c a l l = T P T P + F N ,   F 1 = 2 × P r e c i s i o n × R e c a l l P r e c i s i o n + R e c a l l
For each warning horizon, the supervised classifier maps the temporally available feature vector to a future high-pressure probability. The binary warning decision is then obtained by comparing this probability with a decision threshold, as shown in Equation (7) [62].
p ^ s , t h = f h X s , t , y ^ s , t h = 1 p ^ s , t h θ h
where X s , t denotes the feature vector available at or before time t , f h · denotes the trained classifier for warning horizon h , p ^ s , t h is the predicted probability of a future high-pressure state, θ h is the decision threshold, and y ^ s , t h is the resulting binary warning output.
In the empirical evaluation, a common decision threshold of 0.5 was retained across all horizons, models, and validation settings after validation-based comparison (Supplementary Table S15). For the NaiveCurrentCCPI baseline, the binary warning was obtained by comparing the Current CCPI score with the high-pressure threshold estimated from the corresponding training partition.
For temporal consistency, all features are aligned to the prediction timestamp. For a prediction made at station s and time t , only current, lagged, and rolling observations available at or before t are used. High-pressure thresholds and normalization parameters are estimated from the training data and then applied unchanged to validation or test observations, following the general principle that temporal prediction evaluation should avoid future-information leakage [10,11,42,43].
Three validation settings are used to evaluate chronological performance, temporal generalization, and station-level generalization. These settings follow the broader recommendation that dependent temporal or spatial observations should be evaluated under validation splits that reflect the intended deployment scenario rather than under purely random splits [10,11]. In the chronological test setting, all stations are retained, and hourly observations are split by time using an 80/20 chronological partition. The training period covers the earlier 80% of hourly timestamps, from 1 September 2022 00:00 to 23 January 2023 18:00, and the test period covers the remaining timestamps, from 23 January 2023 19:00 to 28 February 2023 23:00. This setting is used for the main model comparison, indicator ablation, and feature ablation.
In the month-wise temporal validation setting, models are trained on observations from 1 September 2022 to 31 December 2022 and evaluated on later-month observations from 1 January 2023 to 28 February 2023. This setting evaluates whether the warning relationship remains stable under temporal distribution shifts. In the station holdout validation setting, 20% of stations are randomly selected as held-out stations using a fixed random seed, and all observations from these stations are excluded from model training, threshold estimation, and scaling. The remaining 80% of stations are used for training, and the held-out stations are used only for testing. This setting evaluates station-level generalization, which is consistent with validation concerns for spatially or hierarchically structured data [10]. Additional details of the validation splits and leakage-control rules are summarized in Supplementary Table S1.
Model hyperparameters were specified before the final evaluation. The model configurations and implementation settings are reported in Supplementary Tables S7 and S8. RandomForest, XGBoost, LightGBM, and MLP use the same predefined configurations across horizons and validation settings, except that each model is refitted on the corresponding training data. Performance metrics were computed on the corresponding held-out test partitions.
Following the principles of temporally and structurally appropriate data partitioning described in refs. [10,11], the temporal and station-level validation settings are summarized in Equation (8).
D t r a i n t i m e = s , t t < T 0               D t e s t t i m e = s , t t T 0 D t r a i n s t a t i o n = s , t s S t r a i n ,     D t e s t s t a t i o n = s , t s S t e s t   ,     S t r a i n S t e s t =
where T 0 denotes the temporal split point, and S t r a i n and S t e s t denote the training and held-out station sets, respectively. The temporal split separates earlier and later timestamps, whereas the station holdout split separates disjoint training and testing station sets. To summarize uncertainty in the reported F1-score differences, paired station–month block-bootstrap tests were further conducted. The bootstrap unit was defined as a station–month block rather than an individual station–hour observation, because observations from the same station and adjacent hours are temporally dependent [45,46]. For each comparison, station–month blocks in the test set were resampled with replacement, and the F1-score difference between the paired methods was recalculated over 5000 bootstrap iterations. The 2.5th and 97.5th percentiles of the bootstrap distribution were used as the 95% confidence interval. A two-sided paired bootstrap p-value was estimated from the resampled distribution. This statistical procedure was applied to the main model comparison, the feature ablation, and the temporal and station-level generalization analyses reported in the Supplementary Materials. The detailed split settings, leakage-control rules, and model configurations are reported in Supplementary Tables S1, S7, and S8. These settings were applied consistently across horizons and validation protocols.
To complement the model-to-model comparison, the CCPI was also evaluated against three study-defined single-purpose operational measures constructed from occupancy-, energy-, utilization-, and queueing-related concepts [4,5,6,20,21,22,23]: an Occupancy Capacity Index (OCI), an Energy Utilization Index (EUI), and a queueing-inspired Traffic Intensity proxy (QTI proxy). The indicators were evaluated under the same chronological partition and warning horizons against future high occupancy, long service duration, and high energy utilization. The definitions and calculation procedures of these indicators are provided in Supplementary Note S5, and the outcome-specific results are reported in Supplementary Table S10.

4. Results and Analysis

This section evaluates the proposed framework from four aspects: whether current pressure provides a strong short-term persistence reference, whether learning-based models add value at longer horizons, how the composite CCPI differs from and complements representative single-purpose indicators, and whether the warning relationship remains stable under temporal and station-level validation.

4.1. Main High-Pressure Warning Performance

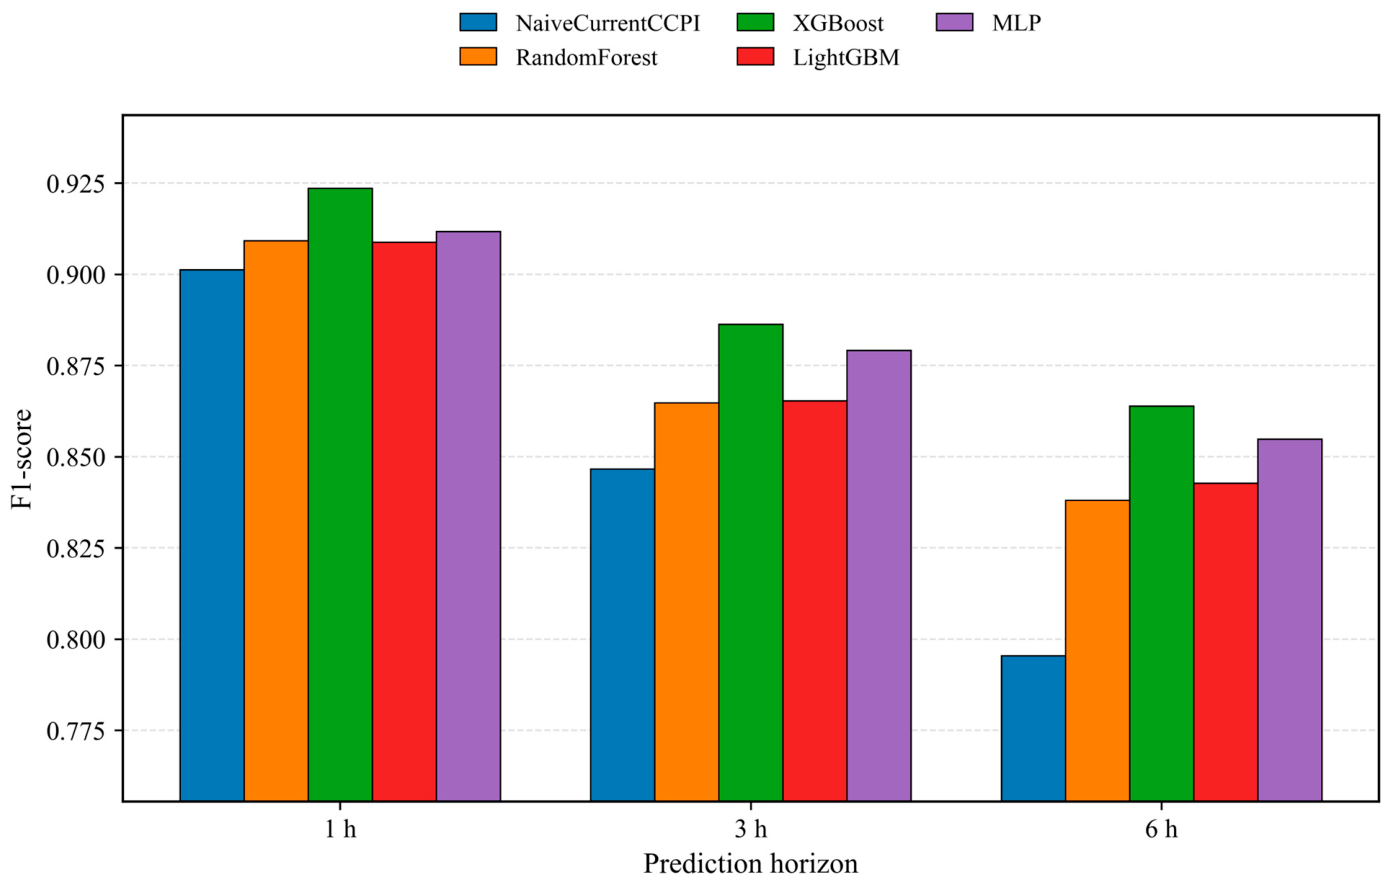
Table 2 summarizes the main high-pressure warning results under the chronological test setting, where the earlier 80% of hourly timestamps were used for training and the remaining 20% were used for testing; Figure 2 presents the corresponding grouped F1-score comparison across the 1 h, 3 h, and 6 h warning horizons. At the 1 h horizon, the current-pressure baseline achieved a strong F1 score of 0.901, indicating that near-term charging pressure has substantial temporal persistence. The learning-based models achieved comparable or moderately higher performance, with XGBoost obtaining the highest F1 score and LightGBM producing the highest PR-AUC. This pattern suggests that the 1 h task is largely persistence-driven, while nonlinear models can still capture additional short-term variations in station pressure. Additional precision, recall, and positive-rate statistics for the main warning task are reported in Supplementary Table S9.
The advantage of the learning-based models became more evident as the warning horizon increased. Compared with the persistence baseline, XGBoost improved the F1 score from 0.847 to 0.886 at 3 h and from 0.795 to 0.864 at 6 h. RandomForest, LightGBM, and MLP showed the same overall trend, with larger gains at longer horizons than at the 1 h horizon. These results indicate that temporally structured operational features provide additional warning information beyond current pressure persistence, with a consistent pattern across different model families.
To summarize the reliability of the observed gains, paired station–month block-bootstrap tests were conducted for XGBoost against the NaiveCurrentCCPI baseline. As shown in Table 3, the F1-score improvements were positive across all horizons. The gain increased from +0.022 at the 1 h horizon to +0.040 at the 3 h horizon and +0.068 at the 6 h horizon, with all 95% confidence intervals (CIs) above zero and all p-values below 0.001. These results indicate statistically consistent improvements over the persistence baseline, especially at longer horizons.
For charging-infrastructure operation, these results indicate that the proposed warning framework is most valuable when the operator needs more than an immediate persistence signal. The increasing F1-score gains from 1 h to 6 h suggest that temporally structured station-level features can provide useful lead-time information for proactive station monitoring, charging-service coordination, and local resource preparation.

4.2. Component-Level Ablation, Indicator Comparison, and Mechanism Analysis

The component-level feature ablation results in Table 4 examine how individual CCPI components contribute to future high-pressure warnings. Occupancy-only, duration-only, volume-only, and price–time feature sets each contained partial warning information, but none of them consistently matched the full CCPI feature set. At 3 h, the full feature set reached an F1 score of 0.865, compared with 0.813 for occupancy-only, 0.749 for duration-only, and 0.756 for volume-only. At 6 h, the full feature set maintained an F1 score of 0.838, exceeding the corresponding single-component feature settings. These results indicate that information relevant to the future CCPI target is distributed across multiple operational components rather than being dominated by a single component. The price–time-only setting produced weaker standalone performance, indicating that price–time information is more useful as contextual information when combined with direct operational variables such as occupancy, duration, and service volume.
An additional comparison with OCI, EUI, and the QTI proxy examined indicator performance for future high occupancy, long service duration, and high energy utilization. OCI achieved the strongest discrimination for future high occupancy, whereas EUI performed best for future high energy utilization. The QTI proxy showed weaker performance across the evaluated outcomes, potentially because the hourly records did not contain directly observed queue lengths or waiting times. In comparison, the CCPI produced relatively balanced discrimination across the three outcomes, reflecting its integrated representation of charger occupation, demand inflow, turnover, service activity, and operating context. The indicator definitions and calculation procedures are provided in Supplementary Note S5, and the complete outcome-specific results are reported in Supplementary Table S10.
Beyond predictive performance, the analysis further examined the relationship between long-duration occupation and future pressure outcomes under three target definitions: default CCPI high pressure, CCPI without duration, and future high occupancy. Across all horizons and target definitions, long-duration observations showed higher future pressure rates than short-duration observations, with all chi-square tests significant at p < 0.001. The detailed rates, confidence intervals, and long/short ratios are reported in Supplementary Table S5. These results support an operational association between long occupation duration and future station pressure.

4.3. Feature Ablation and Temporal Feature Contribution

Feature ablation was conducted using a fixed base classifier and the same chronological split. Table 5 compares the performance changes after removing Current CCPI, removing CCPI-family variables, or restricting the feature set to operational subsets. Removing Current CCPI led to modest F1 changes across horizons, with reductions of 0.002 at 1 h, 0.001 at 3 h, and 0.001 at 6 h. Removing the broader CCPI-family features also produced modest changes, with F1 reductions of 0.008 at 1 h, 0.008 at 3 h, and 0.008 at 6 h. These results indicate that the warning performance is mainly supported by broader operational and temporal patterns. Because CCPI is derived from the same operational components, the modest reduction after removing CCPI-family predictors suggests that related operational variables retain part of the pressure information. These ablation results clarify how multidimensional operational information and temporal structure contribute to warning performance.
The largest performance reduction occurred when the feature space was restricted to current operational variables only, where F1 decreased by 0.033, 0.051, and 0.075 at the 1 h, 3 h, and 6 h horizons, respectively. The larger decline at 6 h indicates that lagged and rolling operational patterns are particularly important for longer-horizon warning.
The paired station–month block-bootstrap results further support this interpretation. Compared with the current-operational-only setting, the full feature setting improved F1 by +0.033, +0.051, and +0.075 at the 1 h, 3 h, and 6 h horizons, respectively. The corresponding 95% confidence intervals remained above zero, indicating that temporally structured features provide consistent additional information. Detailed confidence intervals are reported in Supplementary Table S2.

4.4. Temporal and Station Generalization

The generalization analysis evaluated the warning framework under two out-of-sample settings: month-wise temporal validation and station holdout validation.
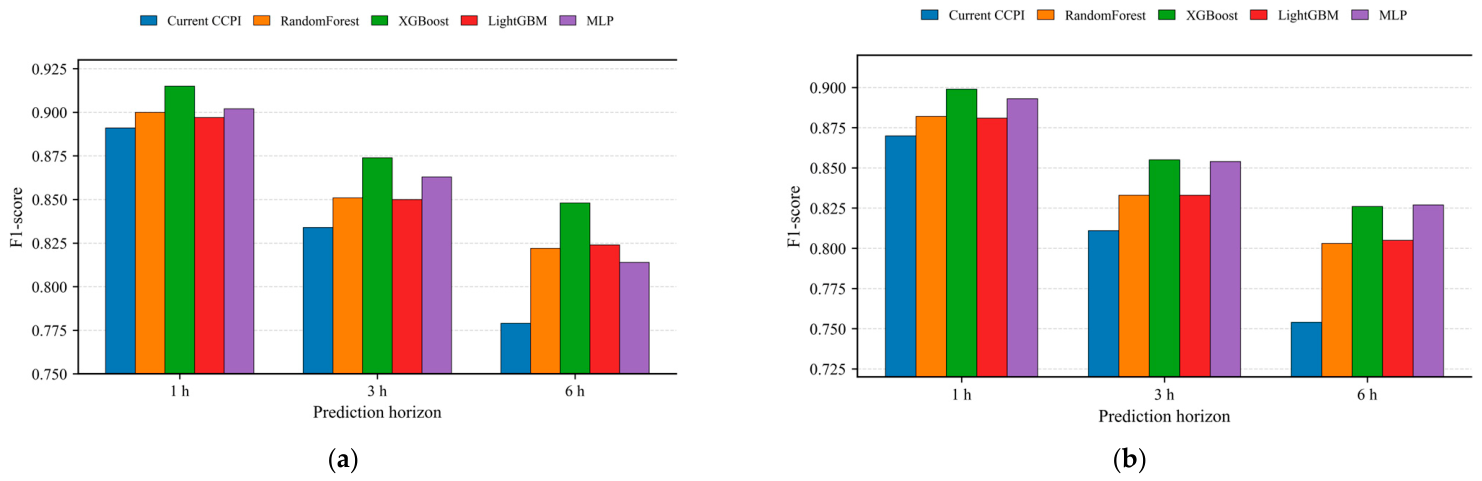
Figure 3 visualizes the F1-score comparison of the Current CCPI persistence baseline and four learning-based models, including RandomForest, XGBoost, LightGBM, and MLP, under the two validation settings. Table 6 reports the corresponding F1-score values.
The generalization results show that Current CCPI remains a strong 1 h baseline, reflecting the short-term persistence of station pressure. As the warning horizon increases, the learning-based models show larger F1-score improvements over the persistence baseline under both month-wise temporal validation and station holdout validation. In the month-wise temporal setting, the 6 h F1 score increased from 0.779 for Current CCPI to 0.822–0.848 for the learning-based models. In the station holdout setting, the 6 h F1 score increased from 0.754 to 0.803–0.828. These results suggest that the learned warning relationship remains stable under later-month and held-out-station settings. Paired station–month block-bootstrap tests further quantified the uncertainty of the generalization gains across all learning-based models, with detailed confidence intervals reported in Supplementary Tables S3 and S4.
Overall, the results indicate that the proposed framework produces stable warning outputs across chronological, later-month, and held-out-station settings. This property is relevant for engineering applications where operators require warning models that remain reliable under deployment-oriented validation conditions.

5. Discussion

Charging-station congestion develops through the interaction of several operating processes. High occupancy directly reduces charger availability, but pressure may also accumulate when arrivals increase, occupied chargers turn over slowly, or charging activity becomes concentrated within particular periods. This helps explain why occupancy, duration, service volume, and price–time context each retained useful warning information, while no individual component reproduced the overall pattern obtained from their combination. Existing charging studies have generally focused on specific outcomes such as demand, load, occupancy, or charger availability [12,13,14,15,16,17,18,19,20,21,22,23,24,25,26,27,28,29], whereas queueing and operations-research studies describe congestion through arrival rates, service capacity, waiting conditions, and assignment decisions [4,5,6,32,33,34]. The CCPI links these perspectives at the station–hour level by providing a common representation of operational pressure from routinely available charging records. The comparison with OCI, EUI, and the QTI proxy further shows that indicator performance depends on the monitored outcome. Specialized indices are particularly suitable for definition-matched objectives, whereas the CCPI supports integrated station-level monitoring across multiple operational mechanisms. Taken together, these findings extend variable-specific prediction and service-process optimization research by linking multidimensional pressure representation, temporally consistent warning, and deployment-oriented validation within a unified station-level framework.
The different warning horizons reveal how the information underlying congestion prediction changes over time. Current pressure remains highly informative for the immediate future, so the 1 h task is influenced strongly by persistence. At longer horizons, the current state alone becomes less representative of the future condition, and recent changes in occupancy, arrivals, duration, and service activity provide increasingly useful information. Lagged and rolling features can capture whether pressure is accumulating, remaining stable, or beginning to decline, which is consistent with their larger contribution to the 3 h and 6 h warning tasks. In operation, these horizons provide different but connected response windows. A 1 h warning can support immediate monitoring and user guidance, while 3 h and 6 h warnings allow more time for service coordination, maintenance preparation, demand management, and local resource planning. The warning results can therefore serve as an input to subsequent operational decisions, with the specific response determined by local queue conditions, charger configurations, pricing policies, service priorities, and grid constraints.

6. Conclusions

This study developed an interpretable station-level framework for charging congestion pressure assessment and multi-horizon early warning. Based on 1423 public charging stations and 6,181,512 station–hour observations from September 2022 to February 2023, the CCPI was constructed from occupancy, arrival pressure, charging or occupation duration, service volume, and price–time context. Future high-pressure states were then predicted at 1 h, 3 h, and 6 h horizons using temporally aligned current, lagged, and rolling features. XGBoost achieved F1 scores of 0.924, 0.886, and 0.864 at the three horizons, representing gains of +0.022, +0.040, and +0.068 over the Current CCPI persistence baseline.
The results show that current pressure provides a strong reference for immediate warning, whereas temporal operating patterns contribute greater additional information as the warning horizon increases. Component and feature ablation analyses support the use of multidimensional and temporally structured station-level information. The comparison with specialized indicators further characterizes the CCPI as an integrated measure for multi-factor station monitoring. The main warning pattern remained consistent under chronological testing, later-month validation, station holdout validation, paired station–month block-bootstrap analysis, and alternative CCPI weighting and high-pressure definitions. These findings support the use of the proposed framework for station-level congestion monitoring across complementary short- and longer-horizon operational windows.
The study is limited by the spatial and temporal coverage of the available data, which represent one city over a six-month period. The station–hour records do not include individual vehicle origins, local or non-local user identities, observed queue lengths, waiting times, trip paths, or vehicle transitions between stations. These limitations restrict direct queueing validation and the construction of empirically supported inter-station networks. In addition, the equal-weight CCPI and Q80 definitions provide transparent reference settings but may require recalibration for specific operational objectives. Future research should examine longer-term and multi-city datasets, incorporate observed queueing, mobility, road-network, grid, and pricing information, and evaluate the effects of integrating pressure warnings with user guidance, service coordination, and smart-charging operation.

Supplementary Materials

The following supporting information can be downloaded at: https://www.mdpi.com/article/10.3390/wevj17090443/s1, Table S1: Summary of validation split settings and leakage-control rules; Table S2: Strict feature ablation confidence intervals; Table S3: Month-wise temporal validation confidence intervals; Table S4: Station holdout validation confidence intervals; Table S5: Statistical validation of the relationship between long-duration occupation and future charging pressure; Table S6: Consolidated summary of paired block-bootstrap statistical tests; Table S7: Model hyperparameter settings; Table S8: Implementation and validation settings; Table S9: Precision, recall, and positive-rate statistics for the main high-pressure warning task; Table S10: Comparison of the CCPI with representative alternative congestion measures; Table S11: Predictive-performance sensitivity to alternative CCPI weighting schemes; Table S12: Similarity of CCPI rankings and high-pressure labels under alternative weighting schemes; Table S13: Predictive-performance sensitivity to alternative high-pressure quantile definitions; Table S14: PR-AUC and target-label overlap under alternative high-pressure quantile definitions; Table S15: Validation-based sensitivity of XGBoost performance to the probability decision threshold.

Funding

This research received no external funding.

Informed Consent Statement

Not applicable.

Data Availability Statement

The original UrbanEV dataset is publicly available from UrbanEV [23]. The processed station–hour feature matrices, derived experimental outputs, and analysis scripts are available from the author upon reasonable request.

Conflicts of Interest

The author declares no conflicts of interest.

References

  1. International Energy Agency. Global EV Outlook 2026; IEA: Paris, France, 2026; Available online: https://www.iea.org/reports/global-ev-outlook-2026 (accessed on 5 August 2026).
  2. Muratori, M. Impact of uncoordinated plug-in electric vehicle charging on residential power demand. Nat. Energy 2018, 3, 193–201. [Google Scholar] [CrossRef] [Scilit]
  3. Pal, A.; Bhattacharya, A.; Chakraborty, A.K. Planning of EV charging station with distribution network expansion considering traffic congestion and uncertainties. IEEE Trans. Ind. Appl. 2023, 59, 3810–3825. [Google Scholar] [CrossRef] [Scilit]
  4. Zhang, B.; Zhao, M.; Hu, X. Location planning of electric vehicle charging station with users’ preferences and waiting time: Multi-objective bi-level programming model and HNSGA-II algorithm. Int. J. Prod. Res. 2023, 61, 1394–1423. [Google Scholar] [CrossRef] [Scilit]
  5. Guillet, M.; Hiermann, G.; Kröller, A.; Schiffer, M. Electric vehicle charging station search in stochastic environments. Transp. Sci. 2022, 56, 483–500. [Google Scholar] [CrossRef] [Scilit]
  6. Pourvaziri, H.; Sarhadi, H.; Azad, N.; Afshari, H.; Taghavi, M. Planning of electric vehicle charging stations: An integrated deep learning and queueing theory approach. Transp. Res. Part E Logist. Transp. Rev. 2024, 186, 103568. [Google Scholar] [CrossRef] [Scilit]
  7. Saki, S.; Hagen, T. What drives drivers to start cruising for parking? Modeling the start of the search process. Transp. Res. Part B Methodol. 2024, 188, 103058. [Google Scholar] [CrossRef] [Scilit]
  8. Yaghoubi, E.; Yaghoubi, E.; Khamees, A.; Razmi, D.; Lu, T. A systematic review and meta-analysis of machine learning, deep learning, and ensemble learning approaches in predicting EV charging behavior. Eng. Appl. Artif. Intell. 2024, 135, 108789. [Google Scholar] [CrossRef] [Scilit]
  9. Kim, M.; Park, W.Y.; Moon, H.S.; Kim, Y.-S. A review of electric vehicle charging demand forecasting models by prediction horizon: A multi-criteria decision analysis approach. J. Electr. Eng. Technol. 2026, 21, 1457–1476. [Google Scholar] [CrossRef] [Scilit]
  10. Roberts, D.R.; Bahn, V.; Ciuti, S.; Boyce, M.S.; Elith, J.; Guillera-Arroita, G.; Hauenstein, S.; Lahoz-Monfort, J.J.; Schröder, B.; Thuiller, W.; et al. Cross-validation strategies for data with temporal, spatial, hierarchical, or phylogenetic structure. Ecography 2017, 40, 913–929. [Google Scholar] [CrossRef] [Scilit]
  11. Bergmeir, C.; Hyndman, R.J.; Koo, B. A note on the validity of cross-validation for evaluating autoregressive time series prediction. Comput. Stat. Data Anal. 2018, 120, 70–83. [Google Scholar] [CrossRef] [Scilit]
  12. Zhang, X.; Chan, K.W.; Li, H.; Wang, H.; Qiu, J.; Wang, G. Deep-learning-based probabilistic forecasting of electric vehicle charging load with a novel queuing model. IEEE Trans. Cybern. 2021, 51, 3157–3170. [Google Scholar] [CrossRef] [Scilit] [PubMed]
  13. Ostermann, A.; Haug, T. Probabilistic forecast of electric vehicle charging demand: Analysis of different aggregation levels and energy procurement. Energy Inform. 2024, 7, 13. [Google Scholar] [CrossRef] [Scilit]
  14. Tian, J.; Liu, H.; Gan, W.; Zhou, Y.; Wang, N.; Ma, S. Short-term electric vehicle charging load forecasting based on TCN-LSTM network with comprehensive similar day identification. Appl. Energy 2025, 381, 125174. [Google Scholar] [CrossRef] [Scilit]
  15. Sreekumar, A.V.; Lekshmi, R.R. Electric vehicle charging station demand prediction model deploying data slotting. Results Eng. 2024, 24, 103095. [Google Scholar] [CrossRef] [Scilit]
  16. Zamee, M.A.; Han, D.; Cha, H.; Won, D. Self-supervised online learning algorithm for electric vehicle charging station demand and event prediction. J. Energy Storage 2023, 71, 108189. [Google Scholar] [CrossRef] [Scilit]
  17. Yi, Z.; Liu, X.C.; Wei, R.; Chen, X.; Dai, J. Electric vehicle charging demand forecasting using deep learning model. J. Intell. Transp. Syst. 2022, 26, 690–703. [Google Scholar] [CrossRef] [Scilit]
  18. Wang, S.; Zhuge, C.; Shao, C.; Wang, P.; Yang, X.; Wang, S. Short-term electric vehicle charging demand prediction: A deep learning approach. Appl. Energy 2023, 340, 121032. [Google Scholar] [CrossRef] [Scilit]
  19. Orzechowski, A.; Lugosch, L.; Shu, H.; Yang, R.; Li, W.; Meyer, B.H. A data-driven framework for medium-term electric vehicle charging demand forecasting. Energy AI 2023, 14, 100267. [Google Scholar] [CrossRef] [Scilit]
  20. Ma, T.-Y.; Faye, S. Multistep electric vehicle charging station occupancy prediction using hybrid LSTM neural networks. Energy 2022, 244, 123217. [Google Scholar] [CrossRef] [Scilit]
  21. Chen, Q.; You, L.; Qu, H.; Abdelmoniem, A.M.; Yuen, C. AFML: An asynchronous federated meta-learning mechanism for charging station occupancy prediction with biased and isolated data. IEEE Trans. Big Data 2025, 11, 1772–1786. [Google Scholar] [CrossRef] [Scilit]
  22. Baek, K.; Lee, E.; Kim, J. A dataset for multi-faceted analysis of electric vehicle charging transactions. Sci. Data 2024, 11, 262. [Google Scholar] [CrossRef] [Scilit] [PubMed]
  23. Li, H.; Qu, H.; Tan, X.; You, L.; Zhu, R.; Fan, W. UrbanEV: An open benchmark dataset for urban electric vehicle charging demand prediction. Sci. Data 2025, 12, 523. [Google Scholar] [CrossRef] [Scilit] [PubMed]
  24. Wang, S.; Li, Y.; Shao, C.; Wang, P.; Wang, A.; Zhuge, C. An adaptive spatio-temporal graph recurrent network for short-term electric vehicle charging demand prediction. Appl. Energy 2025, 383, 125320. [Google Scholar] [CrossRef] [Scilit]
  25. Yan, J.; Zhang, J.; Liu, Y.; Lv, G.; Han, S.; Alfonzo, I.E.G. EV charging load simulation and forecasting considering traffic jam and weather to support the integration of renewables and EVs. Renew. Energy 2020, 159, 623–641. [Google Scholar] [CrossRef] [Scilit]
  26. Wang, S.; Chen, A.; Wang, P.; Zhuge, C. Predicting electric vehicle charging demand using a heterogeneous spatio-temporal graph convolutional network. Transp. Res. Part C Emerg. Technol. 2023, 153, 104205. [Google Scholar] [CrossRef] [Scilit]
  27. Qu, H.; Kuang, H.; Wang, Q.; Li, J.; You, L. A physics-informed and attention-based graph learning approach for regional electric vehicle charging demand prediction. IEEE Trans. Intell. Transp. Syst. 2024, 25, 14284–14297. [Google Scholar] [CrossRef] [Scilit]
  28. You, L.; Chen, Q.; Qu, H.; Zhu, R.; Yan, J.; Santi, P.; Ratti, C. FMGCN: Federated meta learning-augmented graph convolutional network for EV charging demand forecasting. IEEE Internet Things J. 2024, 11, 24452–24466. [Google Scholar] [CrossRef] [Scilit]
  29. Qu, H.; Li, H.; You, L.; Zhu, R.; Yan, J.; Santi, P.; Ratti, C.; Yuen, C. ChatEV: Predicting electric vehicle charging demand as natural language processing. Transp. Res. Part D Transp. Environ. 2024, 136, 104470. [Google Scholar] [CrossRef] [Scilit]
  30. Kuang, H.; Deng, K.; You, L.; Li, J. Citywide electric vehicle charging demand prediction approach considering urban region and dynamic influences. Energy 2025, 320, 135170. [Google Scholar] [CrossRef] [Scilit]
  31. Huang, Y.; Wu, S.; Wang, Z.; Liu, X.; Li, C.; Hu, Y. Causality-aware multi-graph convolutional networks with critical node dynamics for electric vehicle charging station load forecasting. IEEE Trans. Smart Grid 2025, 16, 3210–3225. [Google Scholar] [CrossRef] [Scilit]
  32. Wu, T.; Fainman, E.; Maïzi, Y.; Shu, J.; Li, Y. Allocate electric vehicles’ public charging stations with charging demand uncertainty. Transp. Res. Part D Transp. Environ. 2024, 130, 104178. [Google Scholar] [CrossRef] [Scilit]
  33. Zhang, J.; Wang, Z.; Miller, E.J.; Cui, D.; Liu, P.; Zhang, Z.; Sun, Z. Multi-period planning of locations and capacities of public charging stations. J. Energy Storage 2023, 72, 108565. [Google Scholar] [CrossRef] [Scilit]
  34. Wang, H.; Meng, Q.; Wang, J.; Zhao, D. An electric-vehicle corridor model in a dense city with applications to charging location and traffic management. Transp. Res. Part B Methodol. 2021, 149, 79–99. [Google Scholar] [CrossRef] [Scilit]
  35. Dudkina, E.; Scarpelli, C.; Apicella, V.; Ceraolo, M.; Crisostomi, E. Optimised centralised charging of electric vehicles along motorways. Sustainability 2025, 17, 5668. [Google Scholar] [CrossRef] [Scilit]
  36. Wang, B.; Ge, X.; Jin, Y.; Xu, M.; Huang, Z. Orderly charging scheduling for EVs with a novel queuing model under power capacity constraints. Appl. Sci. 2025, 15, 12038. [Google Scholar] [CrossRef] [Scilit]
  37. Wang, B.; Yao, Y.; Gao, J.; Luo, D. Two-stage orderly charging scheduling for large-scale electric vehicle charging stations via the SMPD framework. World Electr. Veh. J. 2026, 17, 320. [Google Scholar] [CrossRef] [Scilit]
  38. Kuang, H.; Zhang, X.; Qu, H.; You, L.; Zhu, R.; Li, J. Unraveling the effect of electricity price on electric vehicle charging behavior: A case study in Shenzhen, China. Sustain. Cities Soc. 2024, 115, 105836. [Google Scholar] [CrossRef] [Scilit]
  39. Wang, Y.; Yao, E.; Pan, L. Electric vehicle drivers’ charging behavior analysis considering heterogeneity and satisfaction. J. Clean. Prod. 2021, 286, 124982. [Google Scholar] [CrossRef] [Scilit]
  40. Yang, X.; Peng, Z.; Wang, P.; Zhuge, C. Seasonal variance in electric vehicle charging demand and its impacts on infrastructure deployment: A big data approach. Energy 2023, 280, 128230. [Google Scholar] [CrossRef] [Scilit]
  41. Nardo, M.; Saisana, M.; Saltelli, A.; Tarantola, S.; Hoffmann, A.; Giovannini, E. Handbook on Constructing Composite Indicators: Methodology and User Guide; OECD Publishing: Paris, France, 2008. [Google Scholar] [CrossRef] [Scilit]
  42. Varma, S.; Simon, R. Bias in error estimation when using cross-validation for model selection. BMC Bioinform. 2006, 7, 91. [Google Scholar] [CrossRef] [Scilit] [PubMed]
  43. Cawley, G.C.; Talbot, N.L.C. On over-fitting in model selection and subsequent selection bias in performance evaluation. J. Mach. Learn. Res. 2010, 11, 2079–2107. [Google Scholar]
  44. Dietterich, T.G. Approximate statistical tests for comparing supervised classification learning algorithms. Neural Comput. 1998, 10, 1895–1923. [Google Scholar] [CrossRef] [Scilit] [PubMed]
  45. Efron, B. Bootstrap methods: Another look at the jackknife. Ann. Stat. 1979, 7, 1–26. [Google Scholar] [CrossRef] [Scilit]
  46. Künsch, H.R. The jackknife and the bootstrap for general stationary observations. Ann. Stat. 1989, 17, 1217–1241. [Google Scholar] [CrossRef] [Scilit]
  47. Becker, W.; Saisana, M.; Paruolo, P.; Vandecasteele, I. Weights and importance in composite indicators: Closing the gap. Ecol. Indic. 2017, 80, 12–22. [Google Scholar] [CrossRef] [Scilit] [PubMed]
  48. Greco, S.; Ishizaka, A.; Tasiou, M.; Torrisi, G. On the methodological framework of composite indices: A review of the issues of weighting, aggregation, and robustness. Soc. Indic. Res. 2019, 141, 61–94. [Google Scholar] [CrossRef] [Scilit]
  49. Hyndman, R.J.; Fan, Y. Sample quantiles in statistical packages. Am. Stat. 1996, 50, 361–365. [Google Scholar] [CrossRef] [Scilit]
  50. Tashman, L.J. Out-of-sample tests of forecasting accuracy: An analysis and review. Int. J. Forecast. 2000, 16, 437–450. [Google Scholar] [CrossRef] [Scilit]
  51. Breiman, L. Random forests. Mach. Learn. 2001, 45, 5–32. [Google Scholar] [CrossRef] [Scilit]
  52. Friedman, J.H. Greedy function approximation: A gradient boosting machine. Ann. Stat. 2001, 29, 1189–1232. [Google Scholar] [CrossRef] [Scilit]
  53. Chen, T.; Guestrin, C. XGBoost: A scalable tree boosting system. In Proceedings of the 22nd ACM SIGKDD International Conference on Knowledge Discovery and Data Mining, San Francisco, CA, USA, 13–17 August 2016; pp. 785–794. [Google Scholar] [CrossRef] [Scilit]
  54. Ke, G.; Meng, Q.; Finley, T.; Wang, T.; Chen, W.; Ma, W.; Ye, Q.; Liu, T.-Y. LightGBM: A highly efficient gradient boosting decision tree. In Proceedings of the 31st International Conference on Neural Information Processing Systems (NIPS’17), Long Beach, CA, USA, 4–9 December 2017; Volume 30, pp. 3146–3154. Available online: https://proceedings.neurips.cc/paper/2017/hash/6449f44a102fde848669bdd9eb6b76fa-Abstract.html (accessed on 9 August 2026).
  55. Rumelhart, D.E.; Hinton, G.E.; Williams, R.J. Learning representations by back-propagating errors. Nature 1986, 323, 533–536. [Google Scholar] [CrossRef] [Scilit]
  56. Grinsztajn, L.; Oyallon, E.; Varoquaux, G. Why do tree-based models still outperform deep learning on typical tabular data? In Proceedings of the Advances in Neural Information Processing Systems 35, New Orleans, LA, USA, 28 November–9 December 2022; pp. 507–520. [Google Scholar] [CrossRef] [Scilit]
  57. Shahriar, S.; Al-Ali, A.R.; Osman, A.H.; Dhou, S.; Nijim, M. Prediction of EV charging behavior using machine learning. IEEE Access 2021, 9, 111576–111586. [Google Scholar] [CrossRef] [Scilit]
  58. He, H.; Garcia, E.A. Learning from imbalanced data. IEEE Trans. Knowl. Data Eng. 2009, 21, 1263–1284. [Google Scholar] [CrossRef] [Scilit]
  59. Fawcett, T. An introduction to ROC analysis. Pattern Recognit. Lett. 2006, 27, 861–874. [Google Scholar] [CrossRef] [Scilit]
  60. Saito, T.; Rehmsmeier, M. The precision-recall plot is more informative than the ROC plot when evaluating binary classifiers on imbalanced datasets. PLoS ONE 2015, 10, e0118432. [Google Scholar] [CrossRef] [Scilit] [PubMed]
  61. Sokolova, M.; Lapalme, G. A systematic analysis of performance measures for classification tasks. Inf. Process. Manag. 2009, 45, 427–437. [Google Scholar] [CrossRef] [Scilit]
  62. Hernández-Orallo, J.; Flach, P.; Ferri, C. A unified view of performance metrics: Translating threshold choice into expected classification loss. J. Mach. Learn. Res. 2012, 13, 2813–2869. Available online: https://www.jmlr.org/papers/v13/hernandez-orallo12a.html (accessed on 9 August 2026).
Figure 1. Overall framework of the proposed station-level congestion assessment and multi-horizon warning method.
Wevj 17 00443 g001
Figure 2. F1-score comparison across 1 h, 3 h, and 6 h warning horizons.
Wevj 17 00443 g002
Figure 3. F1-score comparison of Current CCPI, RandomForest, XGBoost, LightGBM, and MLP under temporal and station-level generalization settings. (a) Month-wise temporal validation. (b) Station holdout validation.
Wevj 17 00443 g003
Table 1. Descriptive statistics of the station-level charging pressure dataset.
ItemValue
Number of stations1423
Station–hour samples6,181,512
Time period1 September 2022 to 28 February 2023
Mean occupancy3.553
Mean aggregated charging duration2.587
Mean volume20.250
Mean CCPI0.115
CCPI Q750.125
CCPI Q800.126
CCPI Q900.136
Table 2. Main high-pressure warning performance and model robustness.
HorizonMethodF1ROC-AUCPR-AUC
1 hNaiveCurrentCCPI0.9010.9800.945
1 hRandomForest0.9090.9930.976
1 hXGBoost0.9240.9930.977
1 hLightGBM0.9090.9930.978
1 hMLP0.9120.9910.972
3 hNaiveCurrentCCPI0.8470.9590.891
3 hRandomForest0.8650.9850.954
3 hXGBoost0.8860.9860.957
3 hLightGBM0.8670.9850.957
3 hMLP0.8800.9840.950
6 hNaiveCurrentCCPI0.7950.9360.840
6 hRandomForest0.8380.9790.936
6 hXGBoost0.8640.9810.940
6 hLightGBM0.8450.9800.941
6 hMLP0.8540.9780.930
Table 3. Paired station–month block-bootstrap confidence intervals for F1-score gains over the persistence baseline.
HorizonBaseline F1XGBoost F1Delta F195% CIp-Value
1 h0.9010.924+0.022[+0.021, +0.024]<0.001
3 h0.8470.886+0.040[+0.036, +0.043]<0.001
6 h0.7950.864+0.068[+0.062, +0.075]<0.001
Note. Baseline denotes NaiveCurrentCCPI. Delta F1 denotes the F1-score difference between XGBoost and NaiveCurrentCCPI. Confidence intervals were estimated using paired station–month block bootstrap with 5000 resampling iterations. Test samples were 1,235,164, 1,232,318, and 1,228,049 for the 1 h, 3 h, and 6 h horizons, respectively; all comparisons used 2846 station–month blocks. Delta F1 values were calculated from the unrounded F1 scores, whereas the displayed F1 values were rounded to three decimal places.
Table 4. Component-level feature ablation results for high-pressure warning.
HorizonOccupancy-Only F1Duration-Only F1Volume-Only F1Price–Time F1Full CCPI Features F1
1 h0.8480.7810.7900.4530.909
3 h0.8130.7490.7560.4530.865
6 h0.7950.7320.7410.4550.838
Note. RandomForest was used as the fixed base classifier in this component-level feature-ablation analysis. The full CCPI feature set combines current, lagged, and rolling information derived from multiple operational pressure components.
Table 5. Feature ablation results for evaluating temporal feature contributions.
HorizonFull Features Excl. Current CCPI Excl. CCPI-FamilyRaw Lagged Ops.Current Ops. Only
1 h0.9090.908 (−0.002)0.901 (−0.008)0.897 (−0.012)0.876 (−0.033)
3 h0.8650.864 (−0.001)0.857 (−0.008)0.856 (−0.009)0.814 (−0.051)
6 h0.8380.837 (−0.001)0.830 (−0.008)0.828 (−0.010)0.763 (−0.075)
Note. RandomForest was used as the fixed base classifier in this feature-ablation analysis. Values are F1 scores, and values in parentheses indicate ΔF1 relative to the full-feature setting within the same prediction horizon. Delta F1 values were calculated from the unrounded F1 scores, whereas the displayed F1 values were rounded to three decimal places.
Table 6. Temporal and station-level generalization results.
Validation SettingHorizonCurrent CCPI F1RandomForest F1XGBoost F1LightGBM F1MLP F1
Month-wise temporal1 h0.8910.9000.9150.8970.902
Month-wise temporal3 h0.8340.8510.8740.8500.863
Month-wise temporal6 h0.7790.8220.8480.8240.814
Station holdout1 h0.8700.8820.8990.8810.893
Station holdout3 h0.8110.8330.8550.8330.854
Station holdout6 h0.7540.8030.8280.8050.827
Note. Current CCPI is used as a persistence baseline. RandomForest, XGBoost, LightGBM, and MLP represent bagging-based ensemble learning, boosting-based learning, and neural-network models in the generalization analysis.
Disclaimer/Publisher’s Note: The statements, opinions and data contained in all publications are solely those of the individual author(s) and contributor(s) and not of MDPI and/or the editor(s). MDPI and/or the editor(s) disclaim responsibility for any injury to people or property resulting from any ideas, methods, instructions or products referred to in the content.