1. Introduction
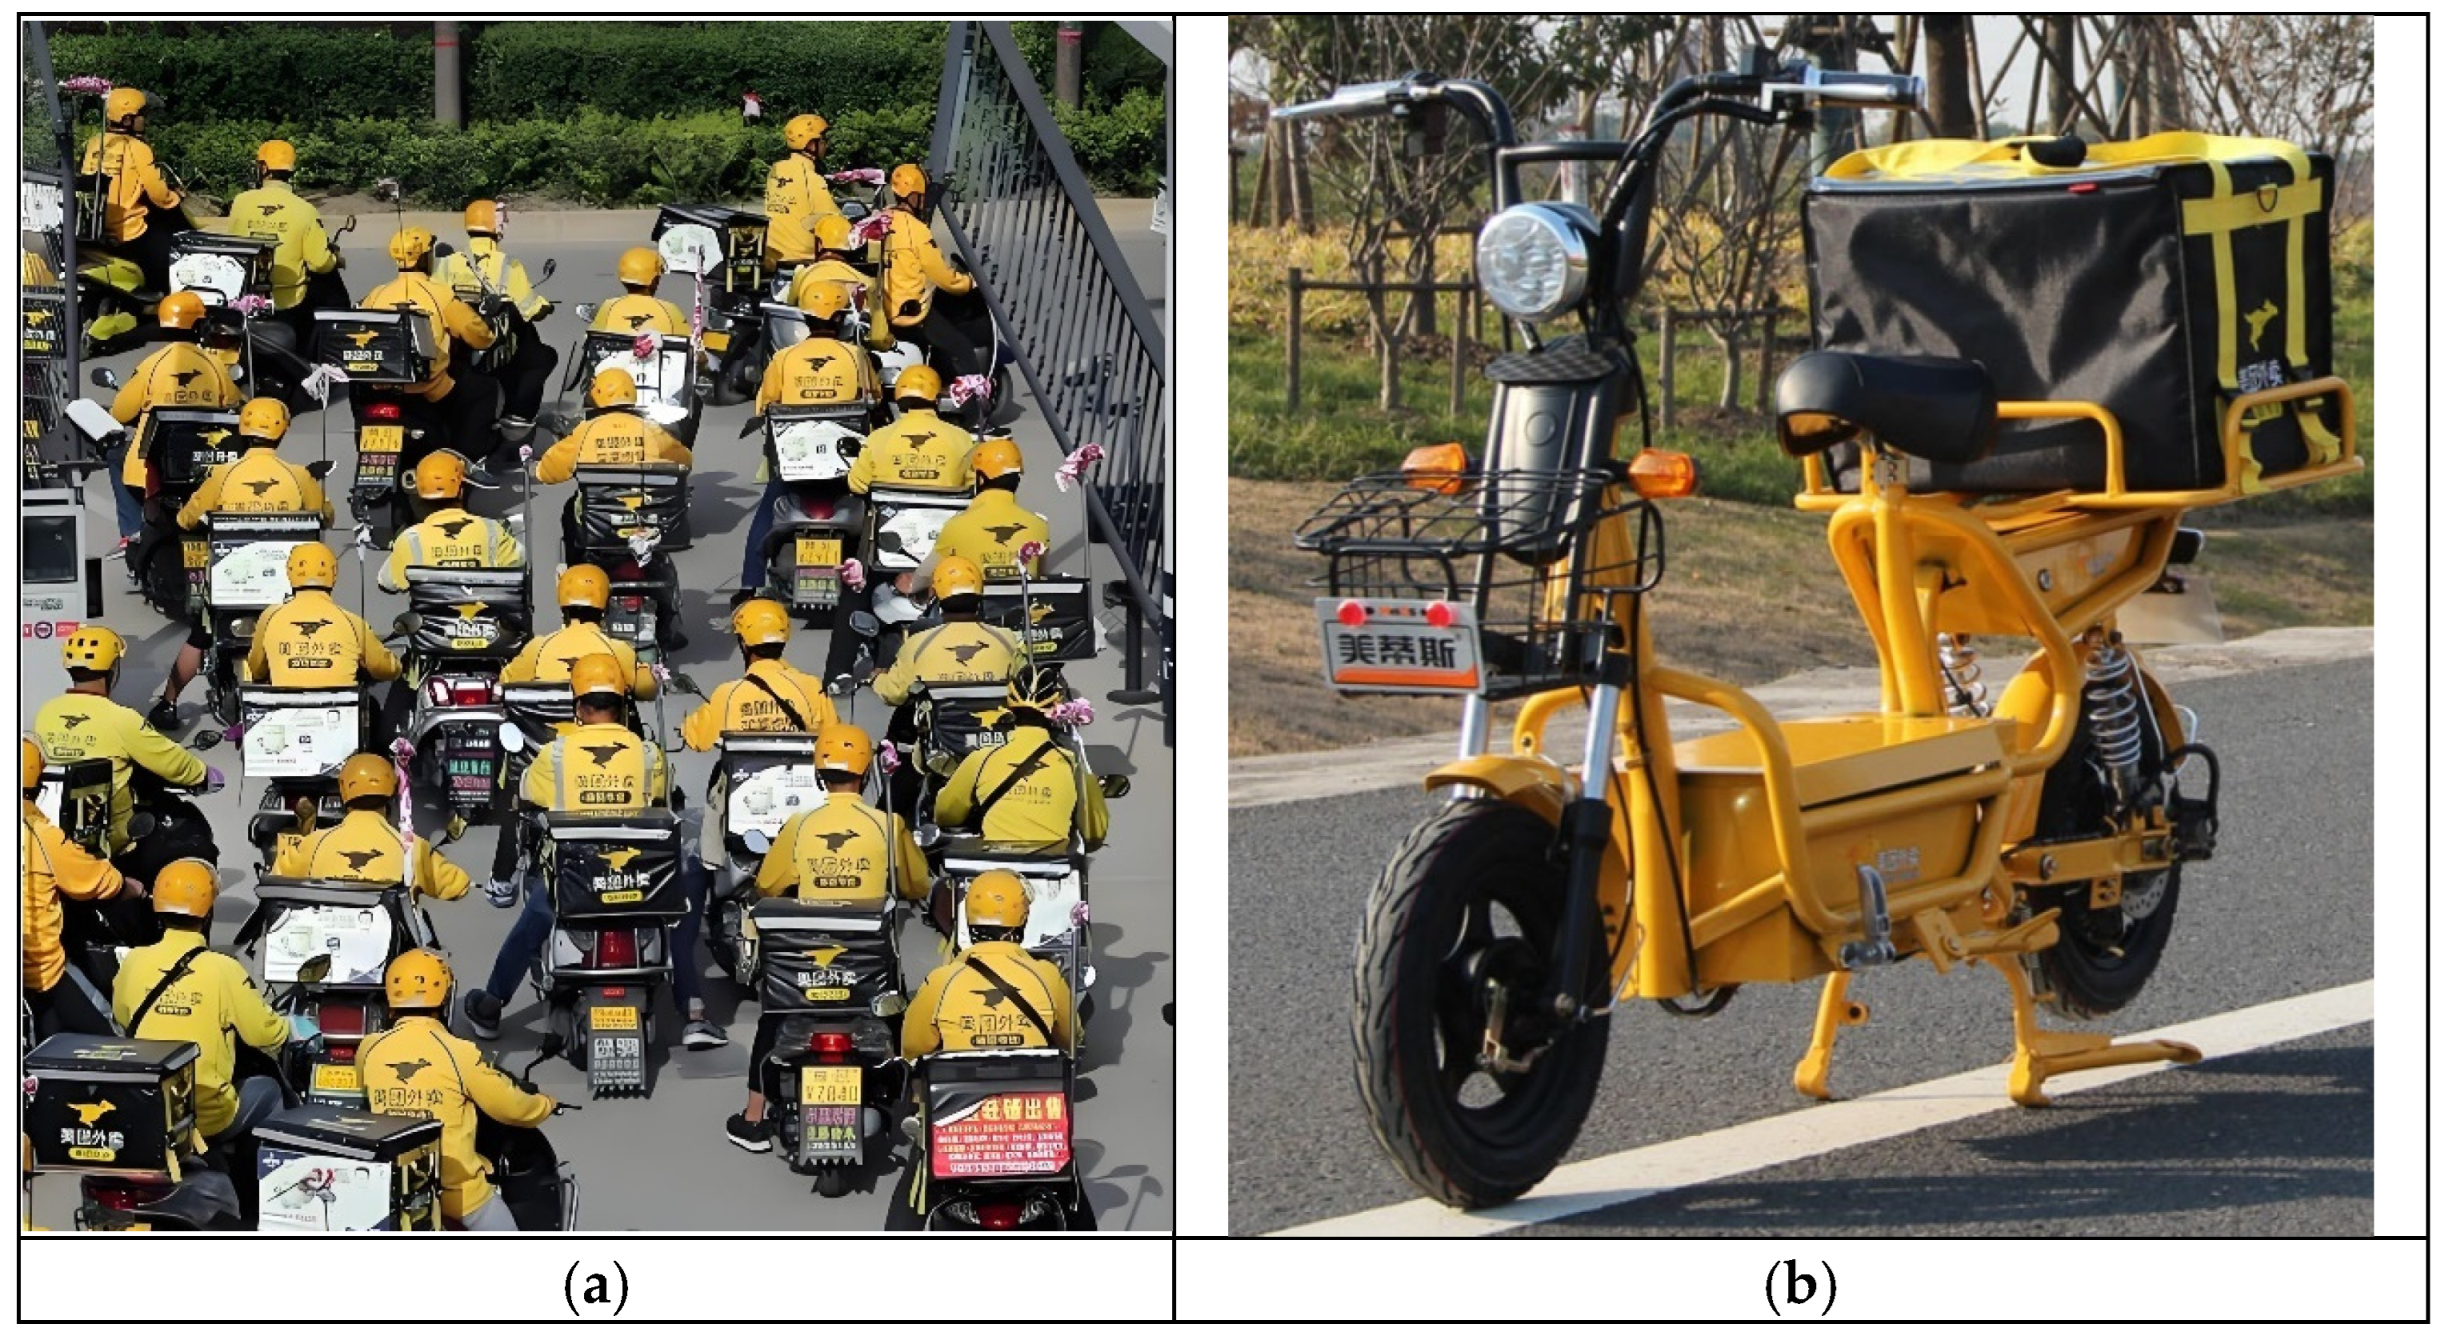
In recent years, the rise of the online-to-offline business model in local life services has spawned instant delivery services, a novel logistics paradigm driven mainly by the food delivery industry and supported by the new retail sector, as shown in
Figure 1a. The emergence of food delivery platforms has significantly transformed residents’ dining habits, making food access more convenient and efficient. As the primary workforce in the delivery sector, food delivery riders—with the number of active riders on Meituan and Alibaba alone exceeding 11.5 million—have become indispensable to this ecosystem. Electric bikes (E-bikes) offer numerous advantages, such as low noise, low emissions, affordability, and ease of operation, as well as greater mobility than traditional bikes, making them the primary mode of transport for delivery riders [
1].
However, the surge in e-bike ownership has exacerbated various problems, such as excessive speed and illegal modifications. These issues have become increasingly serious, resulting in not only severe congestion in non-motorized lanes but also frequent traffic accidents. On 31 December 2024, the Chinese authorities issued the GB 17761-2024 Safety Technical Standards for E-bikes, with their formal enforcement scheduled to take effect on 1 September 2025 [
2]. According to the new regulation, e-bikes must meet several requirements to be deemed compliant: the permissible top speed is capped at 25 km/h, while the overall mass of e-bikes equipped with lead-acid power sources shall not exceed 63 kg (while those using other battery types must weigh ≤ 55 kg), the motor power must be ≤400 W, and battery voltage must not exceed 48 V. Additionally, e-bikes are required to be equipped with pedal-assisted driving devices and receive mandatory 3C certification [
2], as shown in
Figure 1b. The implementation of the updated regulatory requirements has exerted a profound and transformative impact on the on-demand catering delivery sector. First, in terms of industrial operations and management, the stringent restrictions on speed and voltage imposed by the new regulations directly challenge the logic of instant delivery centered on “efficiency”. As both delivery radius and timeliness depend heavily on e-bike performance, speed limits may reduce delivery turnover rates, leading to insufficient platform capacity and fluctuations in distribution costs. Second, from the individual perspective of riders, the compliance requirements introduced by the new regulations not only increase the direct financial burden of purchasing e-bikes but also place them in a dilemma between policy compliance and the strict timeliness assessment of platforms. Under the constraints of the new regulation, the previous advantages in range and power obtained by increasing battery capacity or modifying motors no longer exist. Consequently, riders experience a significant elevation in physical fatigue and delivery anxiety when confronted with long-distance and high-intensity delivery tasks. In view of this, analyzing riders’ continued usage intentions amid these policy changes is crucial not only for ensuring the stability of urban last-mile delivery systems and the livelihoods and adaptation of millions of workers, but also for providing data-driven insights to guide industry adjustments during the policy transition period and optimize future e-bike management. Such efforts could mitigate the risk of soaring social costs caused by policy adjustments.
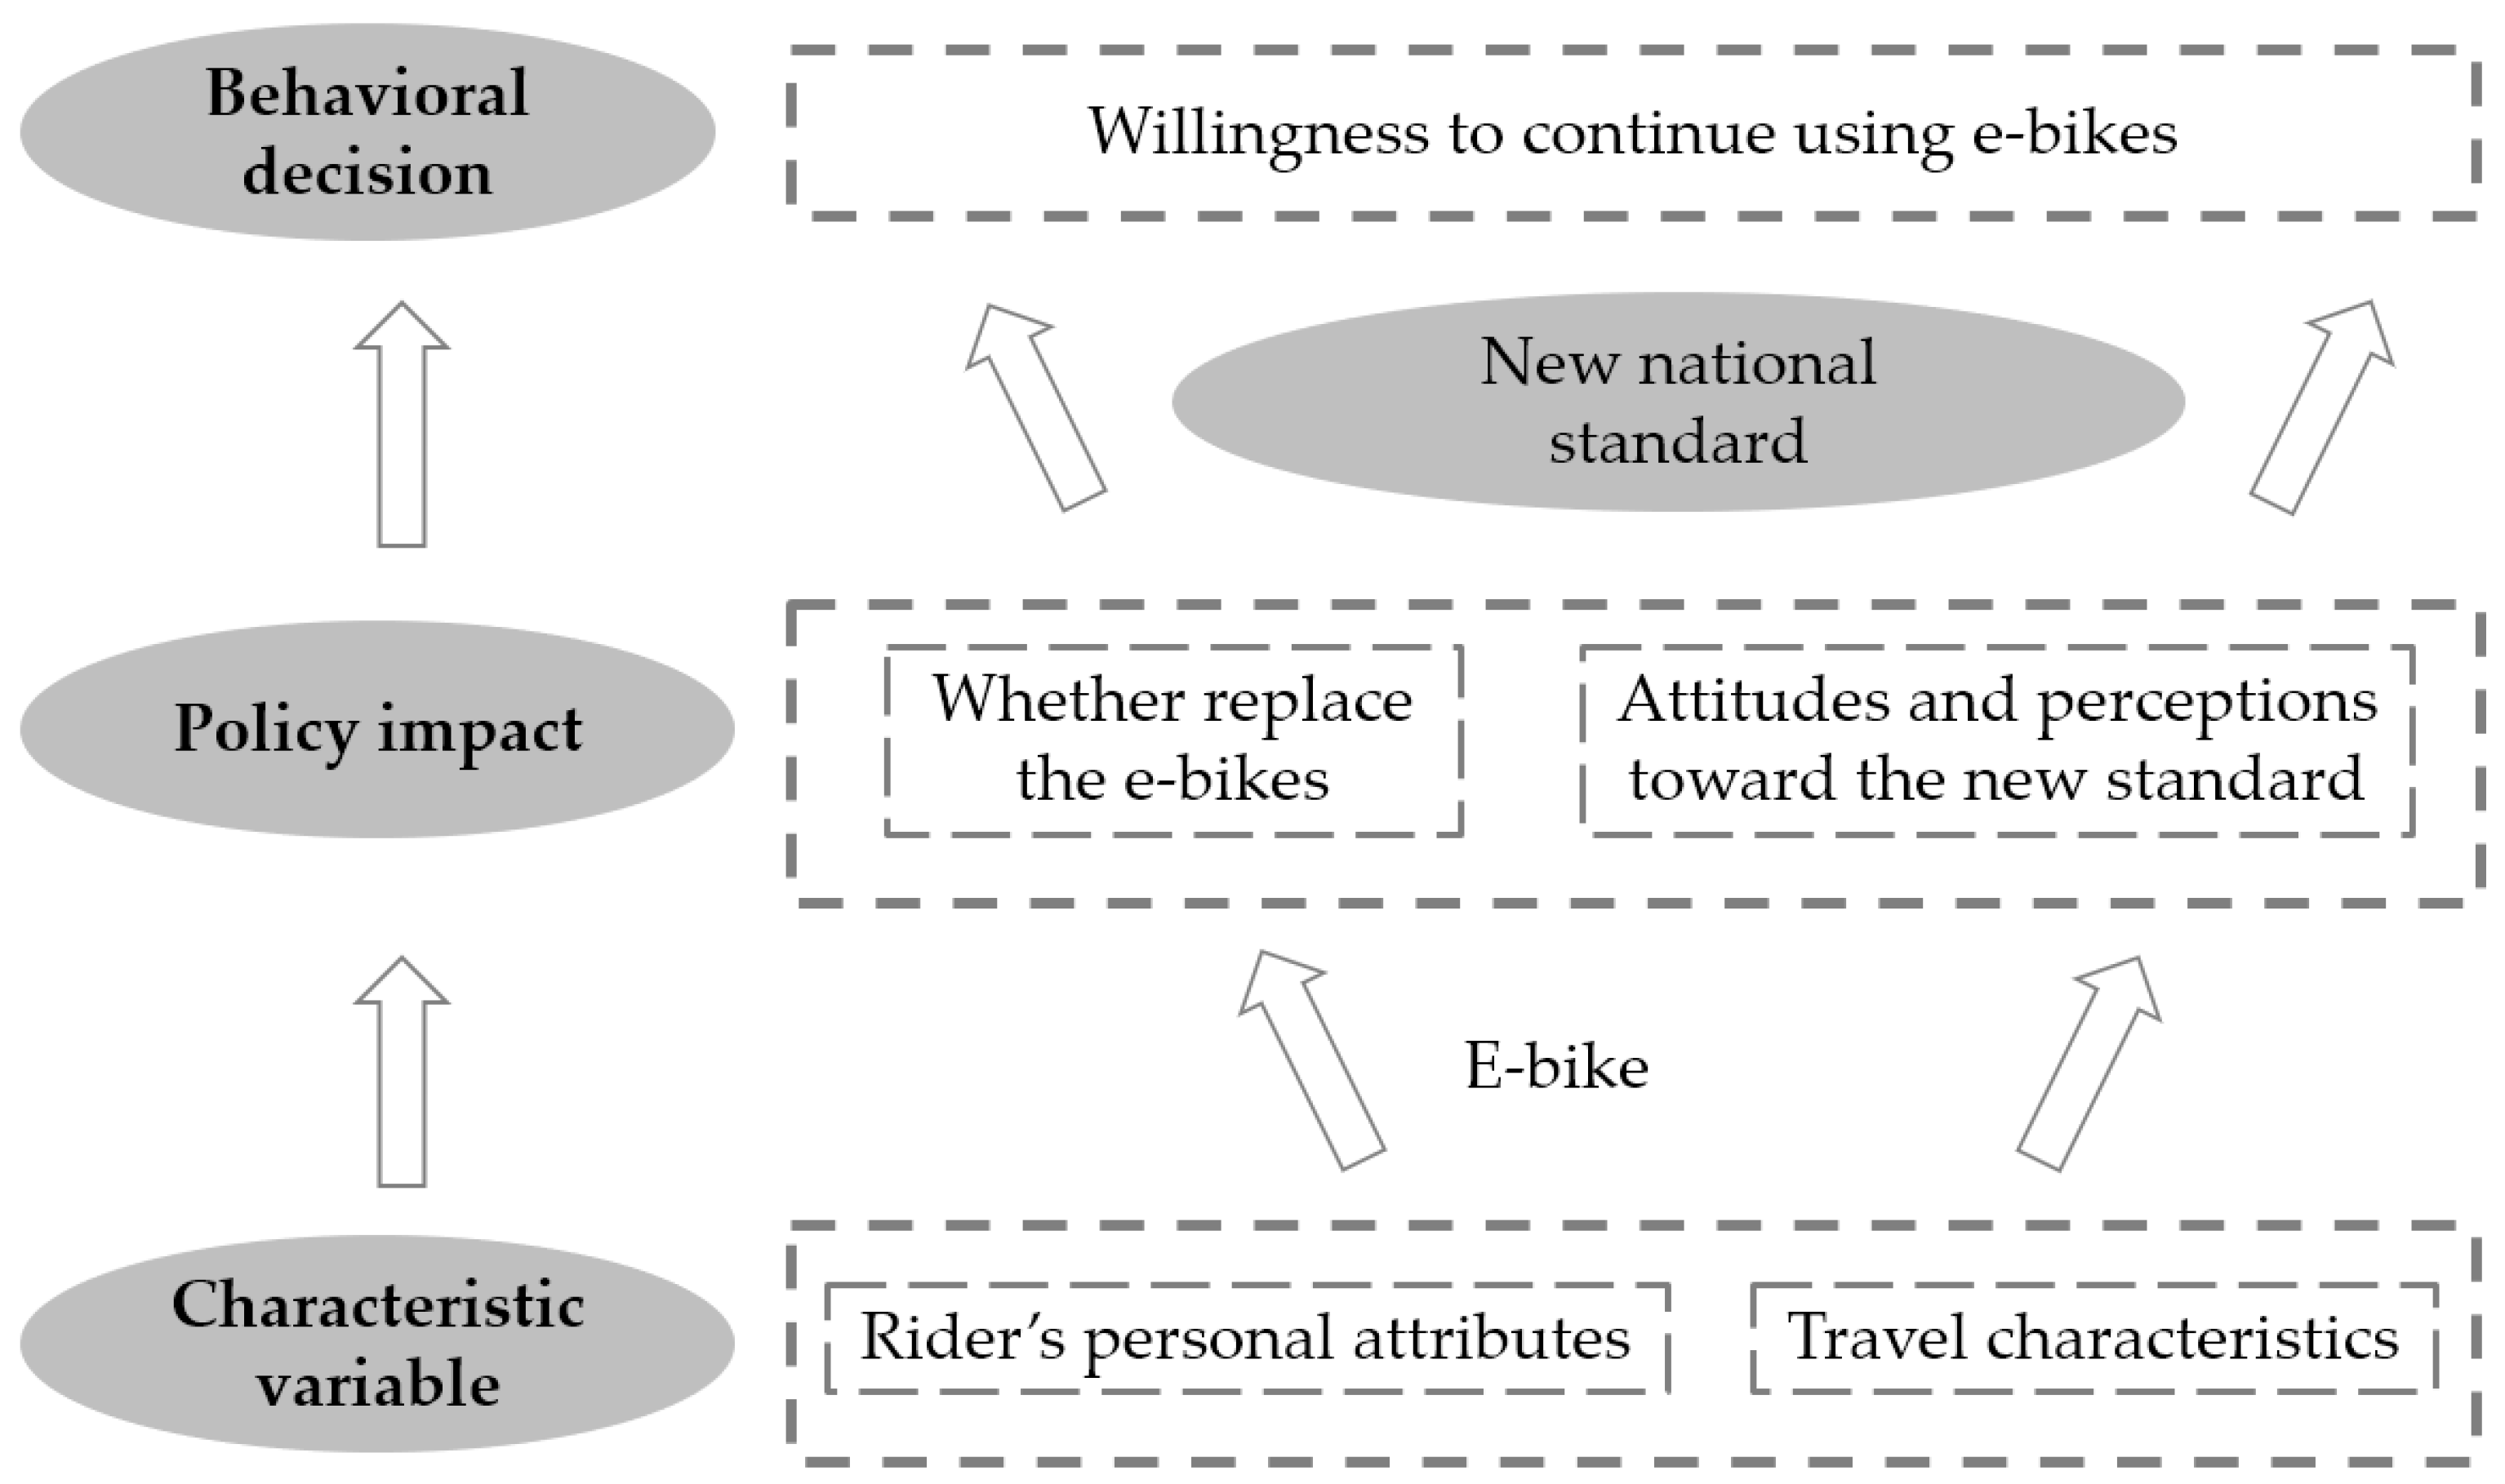
As a widely recognized theoretical model, the Theory of Planned Behavior (TPB) offers a robust analytical structure for explaining individuals’ behavioral inclinations. According to this framework, an individual’s propensity to perform a given action is collectively shaped by three core dimensions: personal attitude toward the behavior, subjective norms, and perceived behavioral control. In the specific context of policy changes, food delivery riders’ intention to continue using e-bikes is essentially a behavioral intention formed through their rational trade-off between compliance costs (e-bike purchase, speed limit impacts) and occupational benefits (delivery efficiency, livelihood security). Therefore, introducing behavioral decision-making theories to analyze the evolution of riders’ intentions after policy regulation adjustments, and constructing a logical chain of “policy perception–psychological attitude–usage intention,” constitute the core theoretical foundation for exploring the deep-seated motivations underlying food delivery riders’ behavioral decisions. Although scholars have extensively studied the factors influencing delivery riders’ e-bike usage behavior, most research has focused on risky riding behaviors, such as how demographic characteristics (gender, age, education level, marital status), subjective norms, perceived behavioral control, and platform-specific features correlate with unsafe riding [
1,
3,
4]. However, little in-depth exploration has been conducted on the decision-making mechanisms behind riders’ continued e-bike adoption in the context of the new policy. This gap may lead to a disconnect between policy adjustments and actual demand, exacerbating industry transition challenges and the pass-on of compliance costs, or even triggering collective job burnout and covert non-compliance due to unmet riders’ needs.
To address this, this study focuses on food delivery riders and examines the mechanisms influencing their continued e-bike usage in the context of updated national e-bike safety standards. The contributions are threefold: first, this study provides a detailed analysis of riders’ e-bike usage patterns based on survey data. Second, this study uses ordered logit regression to systematically investigate the determinants of riders’ continued e-bike usage under the new policy, thereby providing new insights into their occupational decision-making. Third, drawing on the empirical findings, this study proposes targeted policy suggestions to help policymakers improve e-bike regulations while helping delivery platforms design rider-centric operational strategies, thereby promoting the standardized development of urban logistics systems.
2. Literature Review
Existing studies indicate that research on e-bike travel behavior primarily focuses on usage patterns and the key determinants shaping such behavior, whereas studies on food delivery riders emphasize traffic safety issues. These existing studies lay a foundation for our research.
2.1. Travel Characteristics of E-Bike Behavior
Investigating the travel characteristics and determinants of travel behavior choices among e-bike users can not only improve the understanding of users’ travel patterns but also provide a reference for optimizing urban e-bike management. Existing studies have mainly focused on two aspects: differences in usage patterns and multi-dimensional driving factors. In terms of usage patterns and substitution effects, users in different regions show significant differences. MacArthur et al. [
5] conducted an online survey in North America and found that residents mainly purchased e-bikes to overcome the disadvantages of traditional bikes, including long distances, hilly terrain, and physical fatigue. In addition, e-bikes were used for health maintenance, transporting goods or children, leisure activities, and maintaining social connections. Through an integrated analysis of survey data from 1398 e-bike users in Austria, Wolf et al. [
6] concluded that e-bikes were predominantly used for recreational travel, with limited use as a substitute for commuting. In a separate empirical study using transportation data from Germany, Hagedorn et al. [
7] identified e-bike ownership as a key determinant influencing local travel choices. Their findings revealed that e-bikes significantly reduce the likelihood of residents choosing public transport, traditional bikes, private cars, or walking, with this substitution effect being more pronounced for short-distance trips (under 15 km). However, in long-distance travel, the dominance of e-bikes in travel choices diminished substantially. Cherry and Cervero [
8] pointed out that people who used e-bikes made significantly more trips than those using traditional bikes. If e-bikes were unavailable, most users would switch to public transport, implying that e-bikes complemented and substituted for public transit and represented a more economical and efficient travel option. Drawing on the TPB, Wu et al. [
9] analyzed data from 150 questionnaires completed by delivery riders in Guangzhou, China, and found that riders showed an increased tendency to engage in technology-related non-travel activities, such as manually operating mobile phones.
Regarding the factors influencing e-bike usage, scholars have gradually expanded their research from purely demographic characteristics to psychological and environmental factors (basic variables), which is consistent with the core theoretical logic of the TPB. First, individual and family attributes play a fundamental role. Qu et al. [
10] found significant differences in the effects of gender and income on e-bike usage. On one hand, women, due to their caregiving responsibilities, often adopted multi-purpose, combined travel patterns, which notably increased the likelihood of choosing e-bikes. On the other hand, income levels were closely associated with transportation mode decisions, with low-income households showing a significantly higher dependency on e-bikes compared to other income groups. Second, product attributes and infrastructure (perceived behavioral control) serve as key constraining factors. Plazier et al. [
11] found that students exhibited a strong willingness to use e-bikes, with their primary concerns centered on travel efficiency, ease of use, riding enjoyment, and travel autonomy. Nevertheless, the substantial financial burden associated with e-bikes continued to act as a major obstacle, preventing this group from converting potential usage into actual practice. Jaber et al. [
12] investigated questionnaire data collected from 1061 students at An-Najah National University in Palestine. According to their findings, gender, private car ownership, and daily travel modes exerted impacts on individual preferences and safety awareness. Moreover, the readiness to adopt micro-mobility options was identified as a significant factor influencing e-bike usage behavior. Third, psychological awareness and social environment (attitudes and subjective norms) play a decisive role. Himasmita et al. [
13] emphasized that individual-level factors, including psychological, social, and behavioral motivations such as environmental awareness, social identity, peer recommendations, and social influence, served as critical drivers, substantially boosting adoption rates. Ravishankar et al. [
14] analyzed data from 354 e-bike users across major cities in Tamil Nadu and revealed that perceived behavioral control, environmental benefits, and cost-effectiveness significantly influenced usage intentions among young people. Supportive policies such as government subsidies, incentives, and infrastructure development also promoted long-term usage. Das et al. [
13] found that personal subjective awareness played a significant role in influencing the continued use of e-bikes. When users perceived e-bikes as contributing positively to the urban transportation system, their likelihood of continued use increased significantly. Conversely, if users experienced cycling anxiety or had been involved in related accidents, their intention to use or adopt this mode in the future was notably reduced. Lee and Sene [
15] analyzed public perceptions of e-bikes in the U.S. and found that disabilities and advanced age negatively influenced attitudes toward e-bikes, whereas positive perceptions were shaped by previous usage experience, personal cycling background, and receptivity to innovative technologies. Finally, at the e-bike attribute level, Jaber et al. [
12] identified product characteristics as the core variable influencing users’ experience with e-bikes. Key factors included purchase cost, driving range, charging efficiency, durability, and safety. When e-bikes frequently broke down or posed safety hazards, such issues directly and significantly increased users’ willingness to switch to alternative transportation modes. Based on interviews with users in the Greater Sacramento area, Popovich et al. [
16] revealed that notable advantages in travel speed, low energy consumption, and operational simplicity of e-bikes not only greatly boosted riding frequency and expanded travel range, but also motivated some users to reduce or completely discontinue private car usage. Lin et al. [
17] demonstrated that, compared with cars, e-bikes had lower infrastructure requirements and maintained flexibility in peak-hour congestion, which significantly improved long-term user retention. Furthermore, suppliers’ pricing strategies, product performance, and after-sales support exerted significant effects on consumer decision-making and loyalty. While some users tended to choose budget-friendly e-bike models, a continued demand was observed for premium versions equipped with longer travel ranges and upgraded safety functions.
2.2. Travel Behavior of Food Delivery Riders Using E-Bikes
Existing literature analyzes the travel behavior characteristics of e-bike use among food delivery riders, which provides a fundamental basis for behavior-level research. Ordinary users and food delivery riders show high similarity in the use of road facilities and dependence on e-bike attributes (e.g., range, safety). Research on usage intentions of ordinary users provides a basic variable framework for this study. However, there are essential differences in the instrumental attributes between these two groups: ordinary users regard e-bikes as “consumer-oriented transportation tools,” and their usage intention focuses on the convenience of personal travel; in contrast, food delivery riders take them as core “means of production,” whose usage intention is directly anchored in livelihood maintenance and economic benefits. The performance restrictions imposed by the new regulations only represent an “experience adjustment” for ordinary users, but constitute a “shock to production efficiency” for delivery riders. This shift from “daily living demand” to “production and survival demand” makes the continuous usage intention of food delivery riders more sensitive and economically constrained to policy adjustments [
3,
4,
18]. At the level of travel behavior characteristics, e-bikes have become the core productive tool for food delivery riders to maintain their livelihoods. Zhang and Liu [
19] conducted a GPS-based cycling survey of food delivery riders in Changsha, China, and revealed that delivery riders exhibited significantly higher e-bike usage intensity than ordinary residents. The results showed that they undertook delivery tasks throughout the day rather than exclusively during peak meal times. Most delivery activities were confined to a 3 km radius around the station, with an average riding radius of 2.39 km. Krier et al. [
20] conducted a survey in February 2021 involving over 500 delivery riders in the northeastern region of Paris. The results revealed that 46.4% of riders chose bikes as their delivery mode, and 38.8% of them used Paris’s public bike-sharing service, Vélib’. Wang et al. [
21] interviewed 480 delivery riders via retrospective street-intercept surveys. Their findings indicated that nearly 46.5% of the participants reported daily e-bike riding exceeding 8 h. In terms of crash-related risks, as many as 76.5% of those surveyed had encountered at least one traffic collision, with 13.9% of these incidents happening on major roads and 8.2% on walkways.
Investigating the determinants of e-bike usage behavior among food delivery riders provides a foundation for identifying critical indicators and serves as a reference for subsequent studies on their sustained usage intentions under new policies. In terms of behavioral decision-making and risk perception, existing studies have mostly focused on the trade-off between efficiency and safety. Constrained by the platform’s stringent on-time delivery assessment (subjective normative pressure), riders are often forced to balance compliant riding with on-time delivery. On the one hand, compensatory violations caused by time pressure have received extensive attention. Using structural equation modeling, Lu and Liu [
18] analyzed questionnaire data collected from 121 food delivery riders in Chaoyang District, Beijing. The empirical results demonstrated that personal attitudes and social norms had a significant negative influence on riders’ inclination to use a mobile phone while cycling. In contrast, perceived behavioral control and perceived road conditions had a distinct positive effect on such behavioral inclination. In addition, both behavioral intention and perceived behavioral control exerted a significant positive influence on riders’ actual phone usage practices while riding e-bikes. Dong et al. [
22] conducted an on-site questionnaire survey in Tianjin, aiming to examine how external constraints and internal ethical factors (i.e., traffic law enforcement and personal norms) affect aggressive riding behaviors among ordinary e-bike users and delivery riders. The empirical results demonstrated that both traffic regulation enforcement and individual norms were significantly negatively associated with self-reported aggressive riding behavior in the two sample groups. However, time pressure among delivery riders was positively correlated with their aggressive riding behaviors. Based on the riding data at intersections, Qin et al. [
3] selected four signalized intersections in Beijing, recorded eight hours of video footage, and analyzed the travel behavior of 1891 food delivery riders crossing intersections. They found that running red lights and occupying motor vehicle lanes stood out as the two most commonly reported unsafe riding practices. Zhang et al. [
4] collected data on the crossing behavior of e-bike riders, documenting 3335 observations across four signalized intersections in Xi’an, China. Their results indicated that food delivery riders exhibited a higher probability of running red lights than ordinary e-bike riders, with different influential factors between these two groups. Qian et al. [
1] conducted an empirical study in a small Chinese city, and the findings indicated that higher self-assessed safety knowledge was significantly correlated with fewer risky riding behaviors, and this relationship was mediated by the riders’ heightened perception of risk severity and improved compliance attitudes. On the other hand, e-bike choice is dominated by economic rationality. Ye et al. [
23] conducted a survey on unsafe riding practices among food delivery riders, based on 605 valid samples in Ningbo, China. Using structural equation modeling, they analyzed the factors affecting rider safety. The results indicated that the purchase cost, maintenance expenses, and energy consumption of e-bikes directly impacted riders’ income. Users tended to favor cost-effective and durable models while prioritizing ease of maintenance and after-sales service to minimize operational disruptions. Du et al. [
24] conducted one-on-one interviews with 10 delivery riders in Hanoi in May 2023 and found that while personal factors had some influence on riders’ adoption of electric motorcycles, work-related factors had a more significant impact.
2.3. Summary of Key Theories
Based on the above analysis, the TPB and the Random Utility Theory (RUT) are classic social psychological frameworks for explaining individual behavioral intentions. The former offers theoretical support for analyzing riders’ continuous usage intentions through three dimensions: attitude (evaluation of efficiency and cost), subjective norm (pressure from the industry and platforms), and perceived behavioral control (policy and resource constraints); the latter, as the theoretical foundation of the ordered logit model, assumes that riders are rational decision-makers who pursue utility maximization by weighing individual characteristics and policy perceptions. These two frameworks enable the transition from psychological intentions to probability models, providing a scientific basis for empirically examining the marginal contributions of various influential factors under the new regulations.
2.4. Research Summary
While the extant literature has comprehensively explored the usage characteristics of e-bikes, factors influencing riders’ e-bike behavior, and safe riding behaviors among food delivery riders, most studies have focused on e-bike usage in general scenarios. The limitations of existing research are mainly as follows:
First, the limitations of research perspectives. Most existing studies have focused on the traffic safety attributes of e-bikes (e.g., illegal riding, accident causes) or the usage intention of the general public. However, few studies regard food delivery riders as rational users of productivity-enhancing tools and explore the decision-making mechanisms underlying their continued e-bike use under the dual pressures of strict policy constraints (e.g., speed limits, weight limits) and strong livelihood demands (e.g., timeliness, income).
Second, the lag of policy contexts. Most existing literature has been conducted in normalized traffic environments. In response to the 2025 new national standard—a policy shock involving mandatory phase-outs and performance restrictions—there is a lack of timely empirical evidence. It has not been sufficiently quantified how the perceived barriers (e.g., limited e-bike selection) and perceived benefits (e.g., compliance and safety) brought by the policy dynamically reshape riders’ willingness to sustain their participation in the delivery industry.
To accurately identify the behavioral patterns of food delivery riders’ e-bike usage under updated regulations and elucidate the multifaceted factors that influence their continued usage intention, this research employs ordered logit regression to analyze the critical determinants and underlying mechanisms that shape riders’ continued e-bike usage behavior under the new national standard policy. Furthermore, this study puts forward targeted policy recommendations based on the empirical findings.
5. Model Results and Discussion
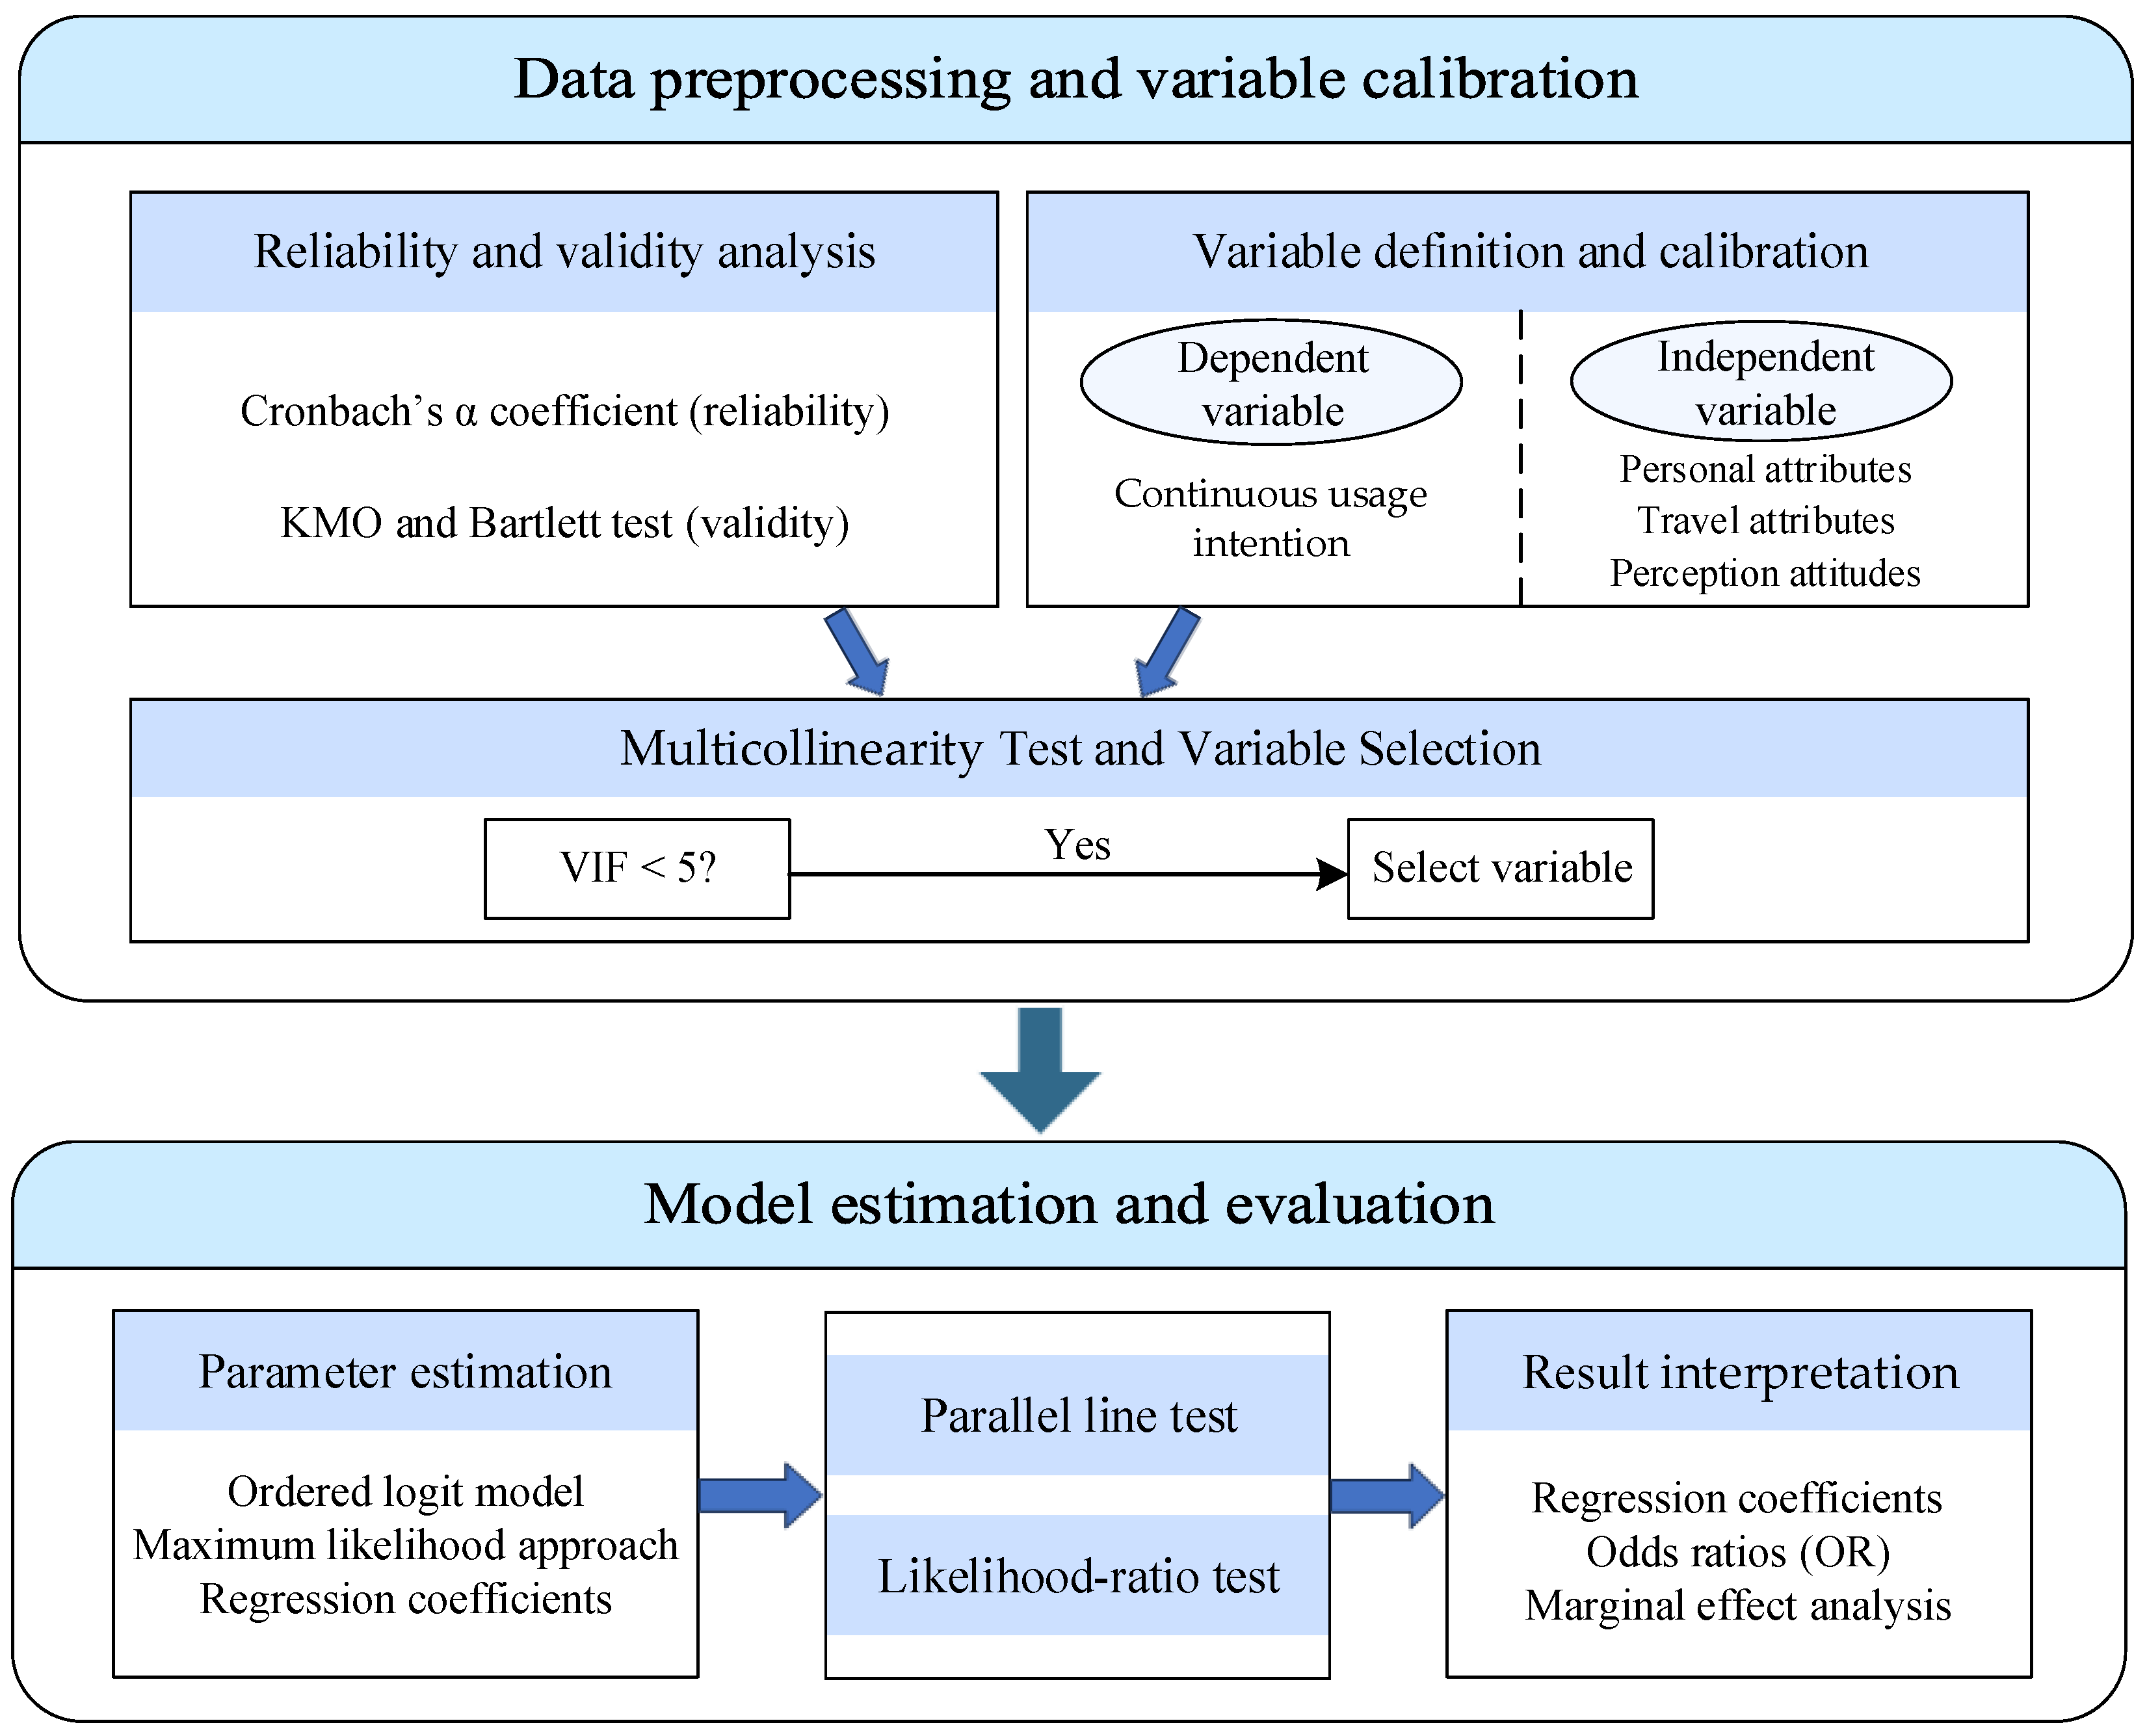
The reliability and validity tests show that the Cronbach’s α coefficient of the data is 0.811, which is greater than 0.7, indicating satisfactory data reliability. The KMO statistic is 0.880, exceeding the threshold of 0.6, and Bartlett’s test is significant at the 0.05 level, confirming the acceptable validity of the measurement scale. Furthermore, a multicollinearity diagnosis reveals that all VIF values for the explanatory variables are less than 5, with the highest value being 1.602. These results confirm that no severe multicollinearity exists and provide solid support for subsequent empirical analysis.
Table 3 reports the results from the ordered logit model, which investigates food delivery riders’ intention to continue using e-bikes, considering both individual and travel-related attributes. As shown in
Table 4, the estimation results are obtained from an expanded model that incorporates personal attributes, travel characteristics, and perceptual indicators.
Table 5 and
Table 6 reports the results of the marginal effect analysis as for the two types of models. The parallel lines test for the ordinal logit models shows that the
p-values for both models exceed 0.05, suggesting that the parallelism hypothesis holds and supporting the appropriateness of using the ordinal logit method in this study [
31]. The Cox and Snell R
2, Nagelkerke R
2, and McFadden R
2 values for the two final models are 0.047, 0.052, 0.021 and 0.031, 0.035, 0.014, respectively. Given that pseudo-R
2 values for ordered logit models are generally low, the above goodness-of-fit statistics are consistent with the general characteristics of such models, suggesting that the models have acceptable explanatory power. Likelihood ratio tests for the ordered logit models show that the −2 log-likelihood values of the two final models are 1454.496 and 1503.082, respectively, whereas the null models yield values of 1476.132 and 1535.720. The significance levels of the likelihood ratio tests are 0.010 and 0.008 (both < 0.05), indicating that the proposed models fit significantly better than the null models and thus confirming satisfactory model fit.
From the results in
Table 4, gender has a significant influence on the continued usage intention of e-bikes among food delivery riders, with male riders showing a negative coefficient of −0.307 and an odds ratio of exp(−0.307) = 0.735. This implies that, holding other variables constant, the odds of a male rider exhibiting high versus low continued usage intention are 0.735 times lower than those of female riders under the new national e-bike standards [
33,
34]. The results of the marginal effect analysis also support this finding: a one-unit increase in the probability of being male is associated with a 3.3% decrease and a 3.9% decrease in the probability of reporting “willing” and “very willing” to continue using e-bikes, respectively. This contrast reveals the profound dilemma faced by male riders, who constitute the main force in delivery services: they have the highest demand for e-bike performance, yet show a lower willingness to continue using e-bikes. Studies by Zhou et al. and Krier et al. have shown that male riders generally take on more intensive delivery tasks, such as long-distance orders, heavy orders, and deliveries under severe weather conditions [
20,
35]. However, the new national standard has imposed strict physical limits on e-bikes, which fail to meet the minimum performance requirements for high-intensity delivery riders. For instance, the upper limit of 400 W rated motor power leads to slow starting and acceleration, as well as significantly weakened climbing capacity when the e-bike is fully loaded with delivery boxes. Meanwhile, the requirement that the gross e-bike weight must not exceed 55 kg often results in lighter frames and narrower tires, which substantially reduce chassis stability and grip during high-speed riding or full-load operation. The overall decline of performance and lack of stability not only increase physical exertion and potential safety hazards during riding but also directly extend the average delivery time per order, undermining the “high order volume–high income” profit model on which high-intensity male riders rely. Consequently, when they cannot freely choose high-performance e-bikes according to delivery demands (which is also consistent with the significantly negative coefficient of the “limited e-bike type selection” variable in the model), their willingness to continue using e-bikes decreases considerably.
Age, on the other hand, has a significant positive influence on the continued usage intention of e-bikes among food delivery riders. The coefficient is 0.190 (
p = 0.014) with an odds ratio of exp(0.190) = 1.210, suggesting that for each one-unit increase in a rider’s age, the odds of high to low continuous usage willingness among food delivery workers is 1.210 times. The results of the marginal effect analysis also support this finding: with each unit increase in age, the probabilities of reporting “willing” and “very willing” to continue using e-bikes increase by 2.1% and 2.3%, respectively. Research by Zhang and Liu indicates that compared with young food delivery riders, middle-aged riders have a lower tendency to speed or drive aggressively [
36]. With advancing age, riders experience a gradual decline in physical strength and a higher risk perception threshold for traffic hazards. Their delivery strategies tend to shift from “pursuing extreme speed” to “balancing of stability, legitimacy, and safety”. The relatively low curb weight of new national standard e-bikes (which eases uprighting the e-bike after a fall) and the restricted maximum speed of 25 km/h are well aligned with the defensive driving habits of older riders, who aim to avoid serious traffic accidents. In contrast to the strong resistance of young male riders, whose income drops sharply due directly to performance limitations, older riders rely less on the extreme performance of e-bikes. They place greater emphasis on the legal road access and basic mobility functions of e-bikes. Consequently, they demonstrate a higher level of tolerance and a stronger willingness to continue using e-bikes under the new national standard policy.
Monthly income also has a significant positive effect on the continued usage intention of e-bikes (coefficient = 0.151, p = 0.012, odds ratio = exp(0.151) = 1.163). The results of the marginal effect analysis also support this finding: with each unit increase in monthly income, the probabilities of reporting “willing” and “very willing” to continue using e-bikes increase by 1.7% and 1.8%, respectively. Higher-income riders are more likely to continue using e-bikes, despite the potential performance limitations imposed by the new standards. This group’s strong dependence on delivery work for their livelihood motivates them to keep using the e-bikes, even when their performance is compromised.
Interestingly, the need to replace the e-bike is positively correlated with continued usage intention. The results of the marginal effect analysis also support this finding: with each unit increase in the likelihood of needing to replace an e-bike, the probabilities of reporting “willing” and “very willing” to continue using e-bikes increase by 4.2% and 4.2%, respectively. Even when replacement is necessary, the better performance of newer models may improve range, comfort, and other attributes, thereby reducing work fatigue and promoting continued usage intention. Furthermore, from the endogenous perspective of behavioral decision-making, “the need to replace the e-bike” and “continued usage intention” are largely characterized by joint determination and reciprocal causality. Riders with long-term career planning (and thus high continued usage intention) tend to be more proactive in seeking e-bike replacement to comply with new regulations. Conversely, the sunk costs already incurred from e-bike replacement inevitably increase their intention to continue using e-bikes.
Although daily usage frequency is positively correlated with continued usage intention, the effect is not statistically significant. This suggests that frequent users develop stronger habits and greater dependence on their e-bikes [
22], thus achieving higher efficiency in their delivery tasks. The economic and time benefits brought by frequent use also strengthen their intention to maintain their current delivery mode.
Current usage satisfaction exhibits a positive but statistically non-significant relationship with continued usage intention (p = 0.698). This is primarily attributed to the high-intensity, time-sensitive nature of food delivery, in which e-bikes serve as indispensable tools rather than optional choices. High turnover rates in the industry, where many riders are short-term part-timers, also lead riders to prioritize immediate earnings (e.g., daily income) and platform incentives (e.g., late penalties) rather than long-term experience. Consequently, satisfaction’s predictive power is overshadowed by more direct economic factors (e.g., costs, efficiency), rendering this relationship statistically non-significant. This finding also indicates potential complex endogeneity between the two variables. Faced with strong livelihood pressure, some riders compelled to continue using the service may passively adjust their subjective satisfaction scores due to cognitive dissonance. This potential bidirectional causality reduces the explanatory power of satisfaction as an independent antecedent variable.
Regarding the new policy’s impact on attitudes, limited e-bike type selection significantly reduces riders’ continued usage intention toward e-bikes. The results of the marginal effect analysis also support this conclusion: with each unit increase in the likelihood of limited e-bike type selection, the probabilities of reporting “willing” and “very willing” for the continued use of e-bikes decrease by 1.9% and 2.1%, respectively. The new regulations impose restrictions on key performance parameters (e.g., speed, weight, battery voltage) and prevent riders from selecting the most suitable e-bikes based on their needs. Since delivery riders typically require e-bikes with higher power and greater load capacity, restricted options may hinder their ability to complete tasks efficiently, thereby reducing their usage intention. However, increased usage costs and strengthened regulatory enforcement exert no significant effects on usage intention.
Although enhanced safety performance strengthens riders’ intention to continue using e-bikes, this effect does not reach statistical significance. Similarly, reduced e-bike speed exerts no significant influence on their continued usage intention. Existing empirical studies on the gig economy and food delivery platform algorithms indicate that platform dispatching systems (e.g., estimated time of arrival algorithms) and late penalty mechanisms prioritize efficiency and consumer experience, impose stringent time constraints, and rarely relax delivery deadlines proportionally in response to speed limits imposed by e-bike policies [
37,
38]. According to the TPB, when a severe conflict arises between subjective norms and actual behavior, individuals who do not alter their intentions will inevitably seek to adjust their perceived behavioral control. Riders compensate for efficiency losses caused by reduced speed through high-risk compensatory behaviors such as illegally removing speed limiters (decoding) and running red lights, thereby psychologically maintaining their original utility balance. This accounts for why the variable does not exert a statistically significant negative impact. Under the dual pressure of “reduced e-bike speed” and “stringent platform time constraints,” riders’ continued usage intention has not been significantly weakened by speed reduction. The underlying reasons may include the following three aspects: First, the irreplaceability of e-bikes as a means of transportation (rigid demand). In current urban last-mile delivery, e-bikes have irreplaceable comprehensive advantages in maneuverability, purchase cost, and maintenance expenses. Even with speed reductions under the new national standard, delivery riders cannot switch to walking or traditional bikes, which are extremely inefficient, or motor vehicles, which incur excessively high costs. This lack of alternative options leads riders to passively maintain their usage intention. Second, riders adopt compensatory behaviors such as illegal driving or unauthorized modification. As noted in studies by Zhang and Liu [
36] and Dong et al. [
22], under strict platform algorithm assessments, delivery riders tend to adopt high-risk behaviors—including running red lights and driving in the wrong direction—to recover lost time, rather than abandoning the use of e-bikes. Third, livelihood pressure outweighs the disadvantages of degraded e-bike performance. For delivery riders who prioritize economic returns, as confirmed by the monthly income variable above, continuing to use e-bikes is a basic livelihood necessity. This economic dependence weakens the negative impact of individual performance indicators such as reduced speed on riders’ overall usage intention.
6. Suggestions and Implications
Drawing on the findings about factors affecting food delivery riders’ continued usage intention of e-bikes, this study presents the following policy implications and countermeasures to promote the long-term use of e-bikes.
- (1)
Launch age-adaptive delivery modes and safety-oriented assessment systems for elderly riders
The estimation outcomes indicate that age has a significantly positive effect on riders’ continued usage intention among food delivery riders. Given that older riders demonstrate stronger continued usage intention toward standard-compliant e-bikes due to their defensive driving habits and physical limitations, platforms are advised to recognize and leverage the unique advantages of this group to better support their stable employment. Platforms may establish “stable-operation” short-distance delivery routes through algorithmic dispatching and prioritize community-based short-haul or lightweight orders for elderly riders. This practice aligns with their physical capacity and fully exploits the advantages of lightweight standard-compliant e-bikes in short-distance scenarios. Meanwhile, platforms should restructure performance evaluation mechanisms by appropriately lowering the weighting of on-time rate and extreme speed, and introducing positive incentive indicators such as accident-free and violation-free riding. Safety bonuses should be used to replace pure order-volume competition.
- (2)
Establish income security mechanisms and reduce compliant operation costs for food delivery riders
According to the model estimation, monthly income is significantly and positively associated with delivery riders’ willingness to continue using e-bikes. In response to this finding, policymakers and food delivery platforms should work together to alleviate the negative impacts of the new national standard on riders’ incomes. On the one hand, platforms should optimize piece-rate compensation and order-dispatching algorithms and establish a reasonable “compliant minimum income” or dynamic unit-price adjustment mechanism. For instance, when speed limits objectively reduce delivery efficiency per unit time, platforms may appropriately increase the average delivery price per order or provide “compliant delivery subsidies” to ensure that riders’ total monthly income does not decrease significantly under legal and compliant operation. On the other hand, for low-income or price-sensitive riders, governments and platforms can jointly introduce favorable policies such as rent-to-own schemes for standard-compliant e-bikes, interest-free installment financial support, and battery rental/swapping subsidies, thereby reducing the upfront purchase and daily maintenance costs for riders.
- (3)
Improve platform delivery time allocation and algorithm optimization
The new national standards, which reduce the speed of e-bikes, may increase delivery time pressures on riders. To alleviate the time pressure caused by speed limits under the new national standard, several measures are proposed. First, platforms should adjust the algorithm’s preset average speed to a compliant range (e.g., below 20 km/h), and automatically activate a “time delay protection mechanism” during peak hours or severe weather conditions, granting an additional 15–20% delivery buffer time. Second, platforms should optimize dispatching logic to match e-bike performance, focusing on high-frequency delivery radii within an efficient zone of 3–5 km, and implementing “stepped time compensation” or “relay delivery” for orders exceeding 5 km. Furthermore, platforms should reform the simplistic “time-only” assessment system by introducing traffic safety credit scores and compliance replacement incentives. Qualified riders should be granted a monthly quota of “no-fault timeout exemptions”, and traffic safety records can be converted into targeted subsidies to encourage riders to adapt to the new regulations.
7. Conclusions
To explore the continued usage intention of e-bikes among delivery riders under China’s new e-bike policy regulations, this study constructs ordered logit models using valid survey data to investigate the key influential factors and the influencing mechanism underlying food delivery riders’ continued use of e-bikes. The results show that: (1) Under new policy regulations, male food delivery riders exhibit a weaker inclination to continue using e-bikes, whereas older riders are more willing to maintain their usage. (2) High-income riders and those needing to replace their e-bikes are more likely to continue using them. (3) Limited e-bike type selection significantly reduces riders’ propensity to keep using e-bikes, whereas lower riding speed exerts no significant effect on their continued usage intention. In light of the above results, three policy recommendations are proposed to promote the continued usage of e-bikes: launching age-friendly delivery models, establishing an income guarantee mechanism for food delivery riders, and optimizing platform delivery time allocation.
This study has several limitations. (1) Future research may further explore cross-group and cross-regional differences among riders with respect to regions, platforms, or full-time/part-time statuses and investigate the moderating effects of economic, policy, and cultural factors. (2) This research is based on cross-sectional data collected over a limited period. In future research, longitudinal data or panel data models may be used to continuously track the long-term effects of policy changes and further explore the long-term evolutionary trends of policies on travel behavior and usage intentions of food delivery riders. (3) Technological substitution effects could be incorporated by investigating emerging alternatives (e.g., battery-swapping models, autonomous delivery e-bikes) to evaluate their potential substitutive or complementary effects on e-bike usage intention. (4) This study mainly uses cross-sectional data to construct ordered logit models for analysis, which cannot fully eliminate potential endogeneity bias. As mentioned earlier, some explanatory variables (e.g., current usage satisfaction, the need to replace the e-bike) and the dependent variable (continued usage intention) may involve joint determination or bidirectional causality. In addition, unobserved omitted variables—such as individual risk preferences and financial constraints—may simultaneously affect usage perceptions and intentions.