Article

Investigation of Flow Channel Configurations in Liquid-Cooled Plates for Electric Vehicle Battery Thermal Management

by
Muhammad Hasan Albana
1,*,
Ninda Hardina Batubara
1,
Novebriantika Novebriantika
1,
Meschac Timothee Silalahi
1,
Yogantara Yogantara
1 and
Harus Laksana Guntur
2
1
Department of Mechanical Engineering, Politeknik Negeri Batam, Batam 29461, Indonesia
2
Department of Mechanical Engineering, Institut Teknologi Sepuluh Nopember, Surabaya 60111, Indonesia
*
Author to whom correspondence should be addressed.
World Electr. Veh. J. 2025, 16(9), 536; https://doi.org/10.3390/wevj16090536
Submission received: 20 August 2025 / Revised: 11 September 2025 / Accepted: 18 September 2025 / Published: 19 September 2025
(This article belongs to the Section Storage Systems)

Abstract

Mitigating heat generation in electric vehicle (EV) batteries is crucial for safety, operational efficiency, and battery lifespan. Liquid-cooled cold plates are widely used; however, comparative studies of channel geometries are often hindered by inconsistent experimental conditions. This study systematically compares six cold plate configurations under identical cross-sectional areas and uniform thermal boundary conditions. These controls isolate the effect of geometry on performance. Computational fluid dynamics (CFDs) was used to evaluate six configurations, derived from three main channel layouts (serpentine with eight U-turns, serpentine with six U-turns, and elliptical) and two cross-sectional shapes (circular and square). The serpentine square-tube design with eight U-turns exhibited the lowest thermal resistance (0.0159 K/W). The circular-tube variant achieved the most uniform temperature distribution (TUI > 0.53). The six U-turn circular-tube configuration demonstrated the lowest pressure drop (11.7 kPa). The results indicate that no single design optimizes all performance metrics, highlighting trade-offs between cooling effectiveness, temperature uniformity, and hydraulic efficiency. By isolating geometric variables, this study offers targeted design recommendations for engineers developing battery thermal management systems (BTMS).

1. Introduction

Internal combustion engines (ICEs) have been the main vehicle propulsion system since the 1890s. They are known to be a major contributor to CO2 emissions in the transportation sector [1]. The high greenhouse gas emissions and air pollutants from ICEs have led many countries to adopt energy transition policies. These include stricter emission standards, incentives for low-emission vehicles, and targets for phasing out fossil fuel vehicles [2].
On the other hand, research on batteries is increasing public acceptance of electric vehicles (EVs), as batteries with high energy density can significantly extend vehicle range while alleviating concerns about the EV running out of electricity in the middle of a journey [3]. However, EV batteries still face several challenges, including battery health degradation, complex battery management, power electronics integration, the development of effective charging strategies [4], and sustainability concerns related to raw materials and recycling processes [5].
Another battery problem is excessive heat during charging or discharging. This excessive heat reduces efficiency, accelerates cell degradation, and can even cause battery explosions [6]. During the charge–discharge cycle, the volumetric heat generated can raise the cell temperature beyond critical limits [7]. Conversely, operating the battery at temperatures below the optimal range can lead to reduced capacity and energy density [8]. Temperature deviations—either above or below—impact both battery performance and lifespan [9,10].
The recommended temperature range for battery cells to perform optimally is between 15 °C and 35 °C at room temperature [11], although some studies suggest a slightly higher optimal range of 25 °C to 40 °C [12]. A deviation of just ±5 °C from this ideal range can result in a 1.5–2% reduction in capacity and a decrease of up to 10% in power capability [13].
A battery thermal management system (BTMS) is utilized to regulate cell temperatures within the optimal range [14]. The most commonly studied and implemented cooling media include air, liquid, phase change materials (PCMs), and heat pipes, each offering distinct characteristics, advantages, and limitations [15]. BTMS can vary depending on the application, available space, weight, maintenance, and manufacturing costs [16]. Researchers categorize BTMS into three types based on their control strategy: active, passive, and hybrid [17]. Active thermal systems, such as air, liquid, or refrigerant-based systems, require an external power source to regulate the cooling or heating rate [18]. In contrast, passive thermal systems do not require additional energy and use natural air cooling, PCM, and heat pipes [19]. A hybrid thermal system refers to a combination of active and passive approaches [20].
Air cooling represents a cost-effective and space-efficient approach that addresses leakage issues, thus supporting a range of battery types. It demonstrates low thermal efficiency due to insufficient heat transfer properties of air, high energy consumption by fans, sensitivity to ambient conditions, and uneven temperature distribution [21]. In contrast, liquid cooling systems exhibit superior thermal performance owing to higher specific heat capacity, greater mass flow rates, and improved heat transfer rates. Nevertheless, these systems are more complex, require higher installation and maintenance costs, occupy more space, add weight, and carry risks such as fluid leakage and shorter operational lifespan [22].
Phase change material (PCM) based cooling systems offer a lightweight, power-free solution with fewer components, a lower environmental impact, and cost efficiency. They provide efficient heat absorption during the phase change process. However, PCMs suffer from low thermal conductivity, limited temperature regulation once entirely melted, difficulty in maintaining continuous thermal control, and potential leakage issues [23].
Passive operation and high thermal conductivity are the hallmarks of heat pipes (HPs), which transfer heat without the need for moving elements or power consumption. Ideal for space-constrained applications, they are compact, lightweight, and silent. Despite these benefits, HPs have a limited contact area, reduced efficiency under high loads, an inability to heat the battery when needed, and relatively high initial and operational costs [24].
The most widely used cooling system in BTMS is the liquid cooling system [25]. Efforts to optimize the liquid cooling system include optimizing the cooling channels, enhancing the performance of the heat transfer jacket, utilizing cold plates, modifying the cooling fluid, and employing a refrigeration cooling system [26]. The U-shaped coolant and serpentine channels show similar cooling performance, but the U-shaped channel has the advantage of a slight pressure loss. The optimal design of a U-shaped channel can reduce the pressure difference by 24.18% [27]. Enhancements in cooling jackets are generally achieved by replacing heat-conductive materials or altering geometrical configurations, such as applying a water-based sodium polyacrylate hydrogel plate as the heat transfer jacket [28].
A cooling plate is a liquid cooling system in which coolant flows through internal channels within a plate with one or more cooling pathways. The optimal design of a single serpentine channel in a cooling plate depends on input parameters and boundary conditions, such as the type of battery pack and the coolant flow rate. The optimal cooling plate design is not universal; each battery and its specific operating conditions require a tailored design [29]. Studies of mini-channel cold plates placed between prismatic LiFePO4 (lithium iron phosphate) battery cells have shown that a parallel flow cold plate with five mini-channels, each 4 mm wide, operating at 25 °C and a flow rate of 0.003 kg/s, can provide improved heat transfer and lower pressure drop [30]. Mousavi et al. [31] designed a hybrid cooling system for Li-ion battery packs, using PCM (n-eicosane) added to straight mini-channel cold plates. The research method employed is computational fluid dynamics (CFDs), and the results indicate that incorporating phase change material (PCM) reduces battery temperature by 10.35 K compared to using liquid cooling exclusively.
Sheng et al. [32] developed a cooling plate with two inlets and two outlets to manage unwanted temperature distribution in the battery cell module. The results show that the cooling performance of the plate with dual inlet and outlet channels is better than that of the single inlet and outlet channels. Increasing the flow rate increased the cold plate’s cooling capacity. Patil et al. [33] developed a cold plate with ‘U-turn’ shaped microchannels. With a surface area of 0.750 square feet and a hydraulic diameter of 1.54 mm, this configuration provided the optimum cooling effect. The unidirectional flow with multiple inlets on one side resulted in a 32.2% reduction in maximum temperature compared to the model with alternating inlets and outlets. Li et al. [34] studied three cooling channels on a cold plate: a single channel, multiple small channels, and an S-shaped channel. The findings indicated that the cooling plate featuring several tiny channels exhibits the most efficient cooling performance.
Wang et al. [35] studied a liquid-cooled BTMS using a serpentine microchannel cooling plate. The results showed that staggered inlets and outlets have the best cooling performance. Mousavi et al. [36] combined vertical mini-channel cooling plates with PCM. The results showed that using three PCM plates at discharge rates of 2 C and 3 C could reduce the maximum battery temperature by 5.6 K and 16.2 K, respectively, compared to the system without PCM. Wang et al. [37] also combined PCM with a corrugated microchannel cooling plate. The crossflow was more effective than the unidirectional flow in reducing the maximum temperature of the battery. Khan et al. [38] investigated U-shaped cooling channels to minimize the weight of the cold plate, and their results demonstrated that the U-shaped cooling channel design reduced the cold plate’s weight by 45% while also lowering the maximum battery temperature by 21%.
Tang et al. [39] studied the effect of diameter and coolant flow velocity on a cold plate. Increasing the coolant flow velocity improves the performance of the cold plate; however, this effect becomes inefficient when the flow velocity reaches a certain threshold. Increasing the tube’s inner diameter at a constant velocity effectively increases heat transfer and temperature uniformity. Zhao et al. [40] compared the number of channels in a liquid-cooling plate (LCP) to the heat dissipation performance. The results showed that a single-channel LCP had the best heat dissipation efficiency. Wu et al. [41] designed grooves with varying geometric sizes on both sides of the cooling channel on the cold plate, thereby altering the heat transfer path between the battery and the coolant. The presence of grooves increases the surface temperature of the battery at the inlet of the cold plate, thereby improving the uniformity of the battery temperature. Rabiei et al. [42] investigated the impact of wavy cooling channels on the cold plate, revealing that the wavy channels reduced the maximum temperature of the battery by 4–6 °C, depending on the amplitude of the waves.
Karthik et al. [43] examined a cold plate with a multichannel construction, where the coolant flow rate varies in each channel. Differentiating flow rates for each channel resulted in a 43.56% reduction in power consumption and a 38.10% reduction in maximum pressure. Zhu et al. [44] researched cold plates with fins and rib grooves constructed discretely, slanted, and alternately within the plate. Fins help balance fluid flow between channels, and Grooves produce longitudinal swirl flow that improves temperature distribution. Wang et al. [45] experimentally studied straight channels on a cold plate and found that the cold plate can significantly restrain the temperature rise in the battery at high discharge rates, thereby improving the battery’s safety at high ambient temperatures. Shen et al. [46] researched microchannels configured in I-shaped and S-shaped designs integrated with phase change material (PCM), and the results show that S-shaped channels produce a better cooling effect than I-shaped channels. Li et al. [47] studied cold plates with spiral channels and found that spiral channels produce better temperature reduction than serpentine channels.
While previous research on cold plates has explored aspects such as different cooling media, flow rates, and basic channel counts, a critical gap remains in the literature. To our knowledge, no systematic study has performed a true ‘apples-to-apples’ comparison of distinct channel geometries (serpentine, elliptical, etc.) where key confounding variables are eliminated. Specifically, comparisons under identical cross-sectional areas and uniform thermal boundary conditions are lacking. Such a controlled approach is essential for decoupling the influence of geometry from other design parameters. Therefore, this study aims to fill this gap by providing a rigorous computational analysis to isolate the intrinsic impact of channel geometry on the thermal and hydraulic performance of BTMS cold plates.

2. Materials and Methods

2.1. Geometry and Design Variations

The cold plate consists of aluminum plates and copper tubes. The rectangular plate measures 210 mm by 160 mm, with a thickness of 5 mm. The 1338 mm-long tube comes in circular or square forms, with a 0.5 mm wall thickness. The square tube has an internal side length of 3.633 mm, while the circular tube has an inner radius of 2.25 mm and an outer radius of 2.55 mm. A 2.5 mm deep groove, in serpentine or spiral patterns, is machined on the plate’s upper surface, and the tube is shaped to follow this groove and secured in place. These cold plates are easy to manufacture, require no complex machining, and have a reduced risk of fluid leakage [48]. Figure 1 illustrates the components.
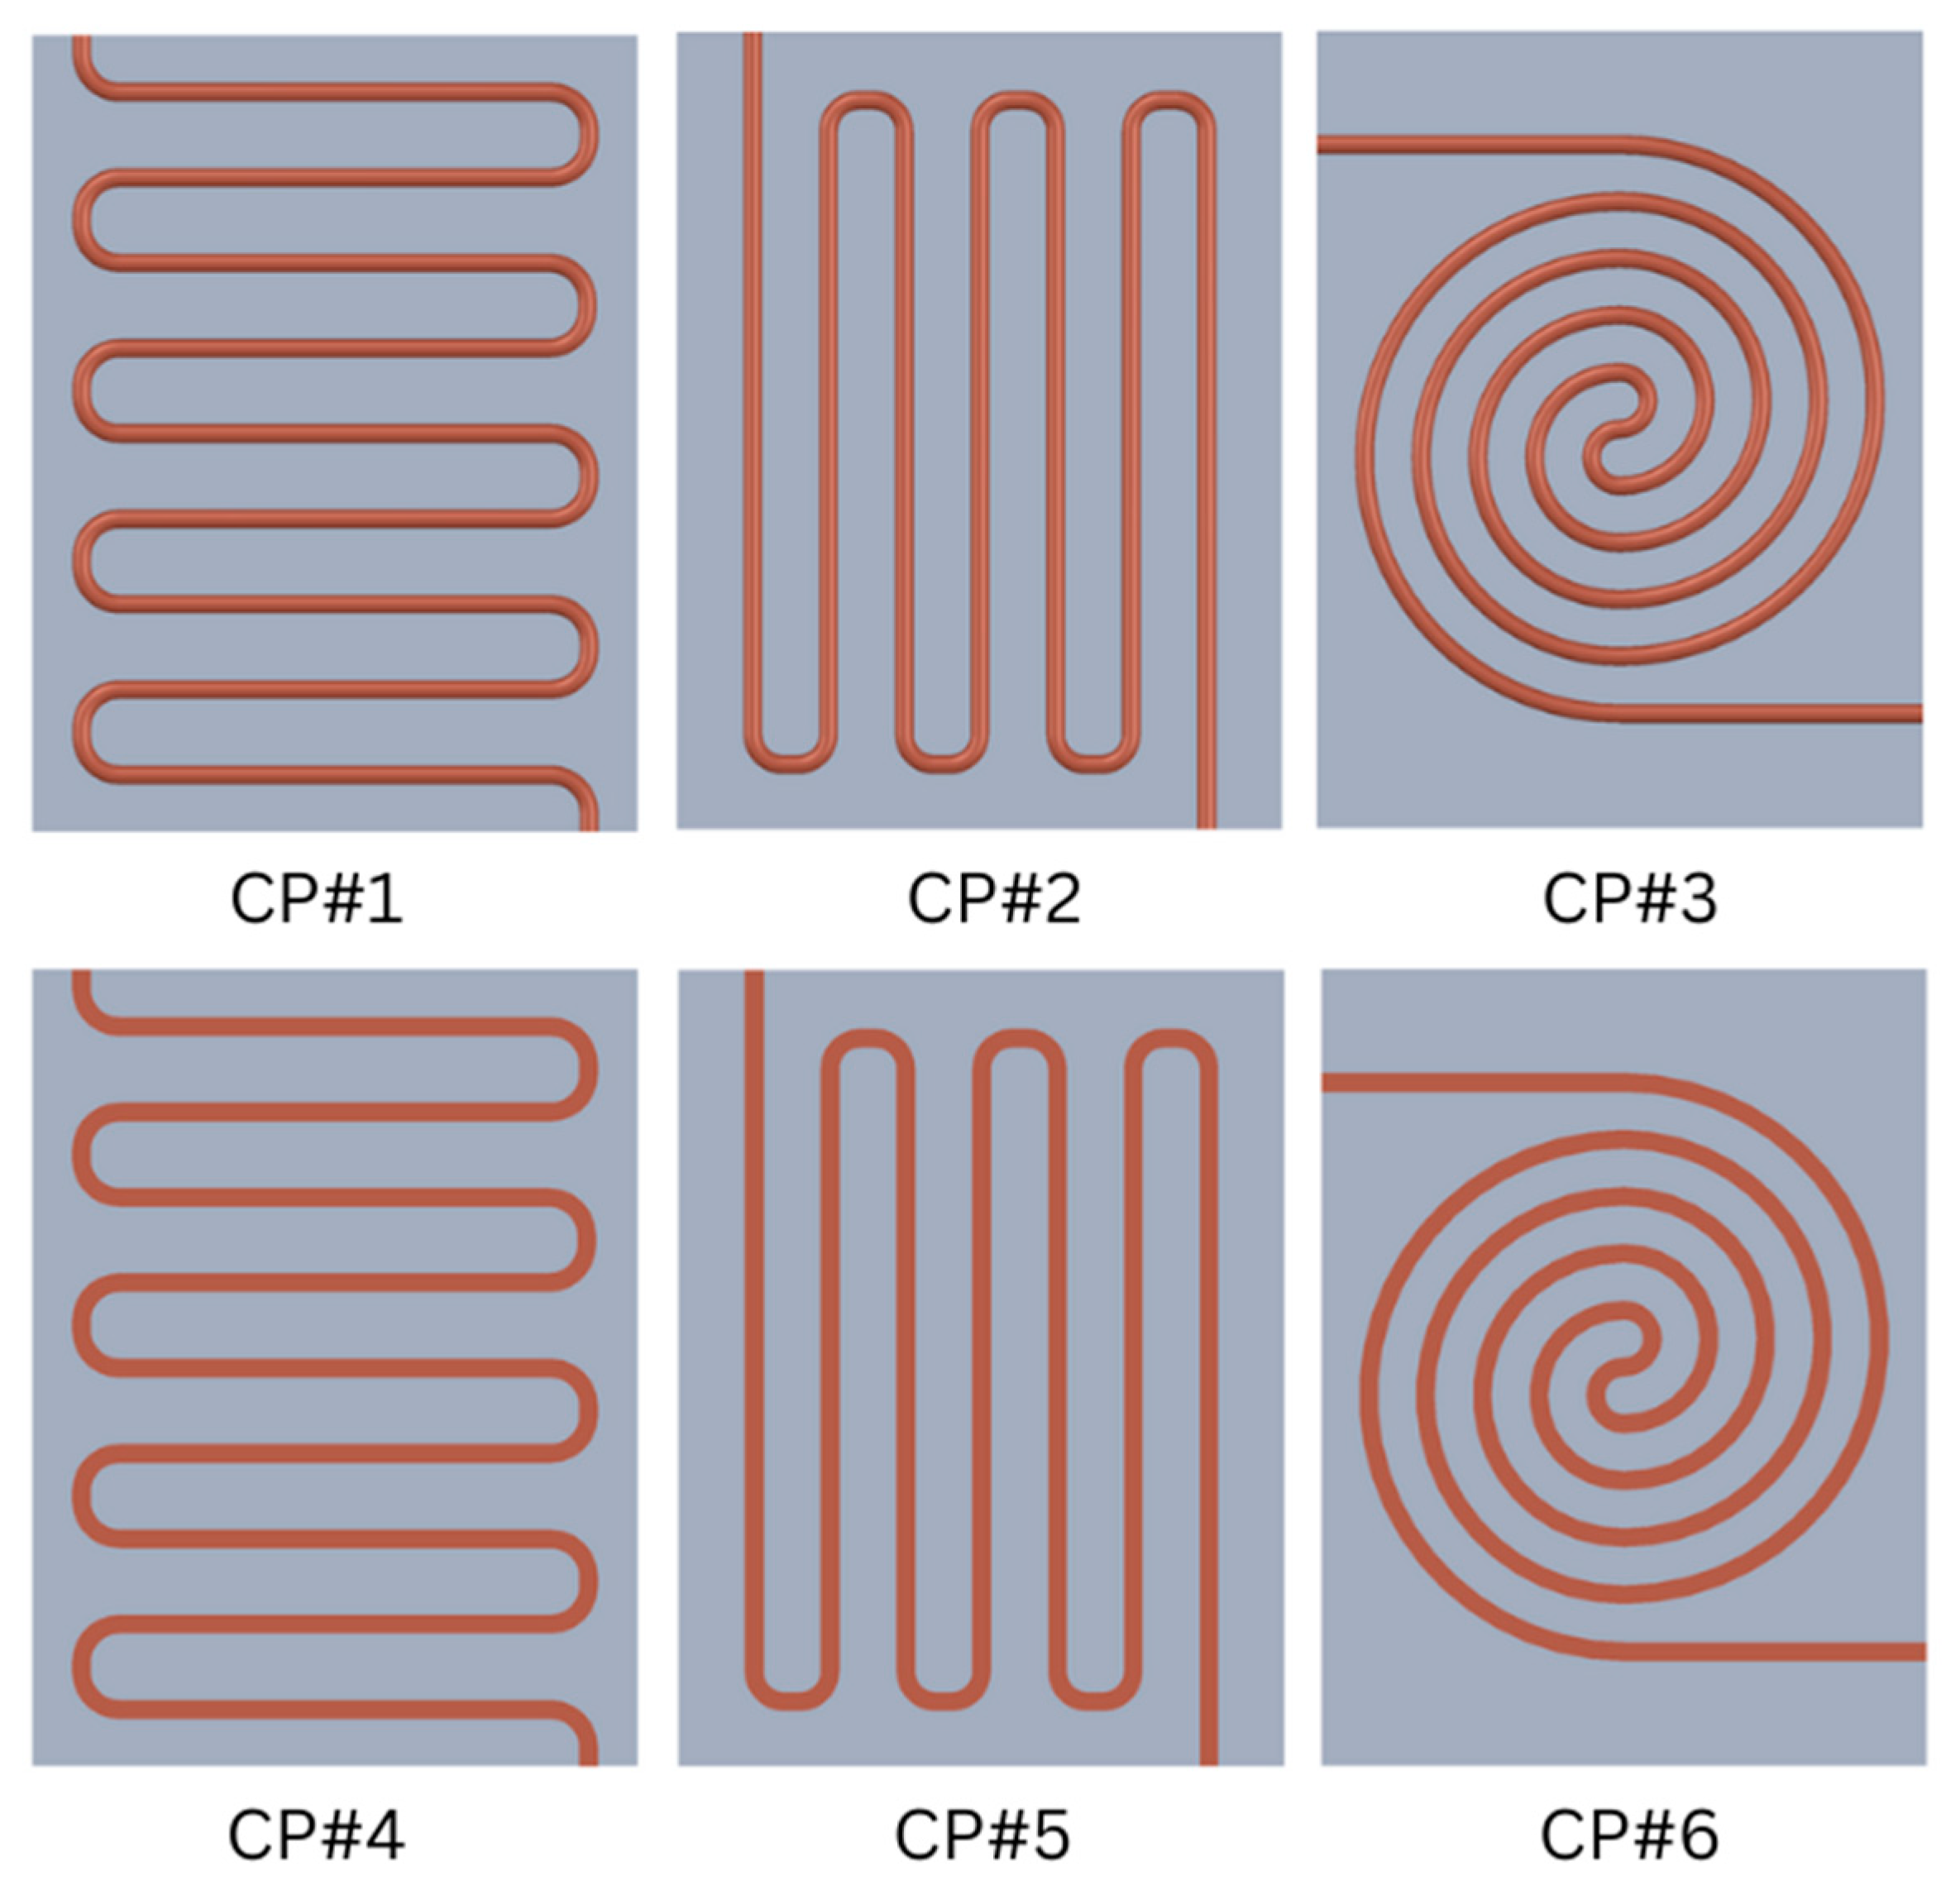
Figure 2 shows the six-channel configurations studied: CP#1 is a serpentine circular tube with eight U-turns, CP#2 is a circular tube with six U-turns, and CP#3 is a spiral cylindrical tube. CP#4, CP#5, and CP#6 repeat the layouts of CP#1, CP#2, and CP#3, respectively, but use square tubes. All tube types have the same cross-sectional area (12.566 mm2), channel length, and coolant volume (16.8 mL or 16,805 mm3). The cold plate in Figure 1 and Figure 2 was designed in SolidWorks 2025. The design created is then saved in Parasolid format for analysis using Ansys Fluent.

2.2. Mesh Generations and Grid Independence

An unstructured tetrahedral mesh was employed to discretize the computational domain of the cold plate model. To improve the resolution of temperature and velocity gradients, the mesh density was increased in the fluid channel region. The mesh was generated using the ANSYS 2025 R1 Meshing software. The mesh growth rate was set to 1.3. The height of the first inflation layer was selected to ensure that the dimensionless wall distance (y+) remained below 1, thereby enhancing the accuracy of heat transfer predictions.
Following mesh generation, this study evaluated four mesh densities, with element counts from 705,891 to 1,015,787, to determine the minimum number of elements for mesh-independent results. For each configuration, the maximum temperature on the cold plate surface and the pressure drop across the fluid channel were measured. Table 1 summarizes these results.
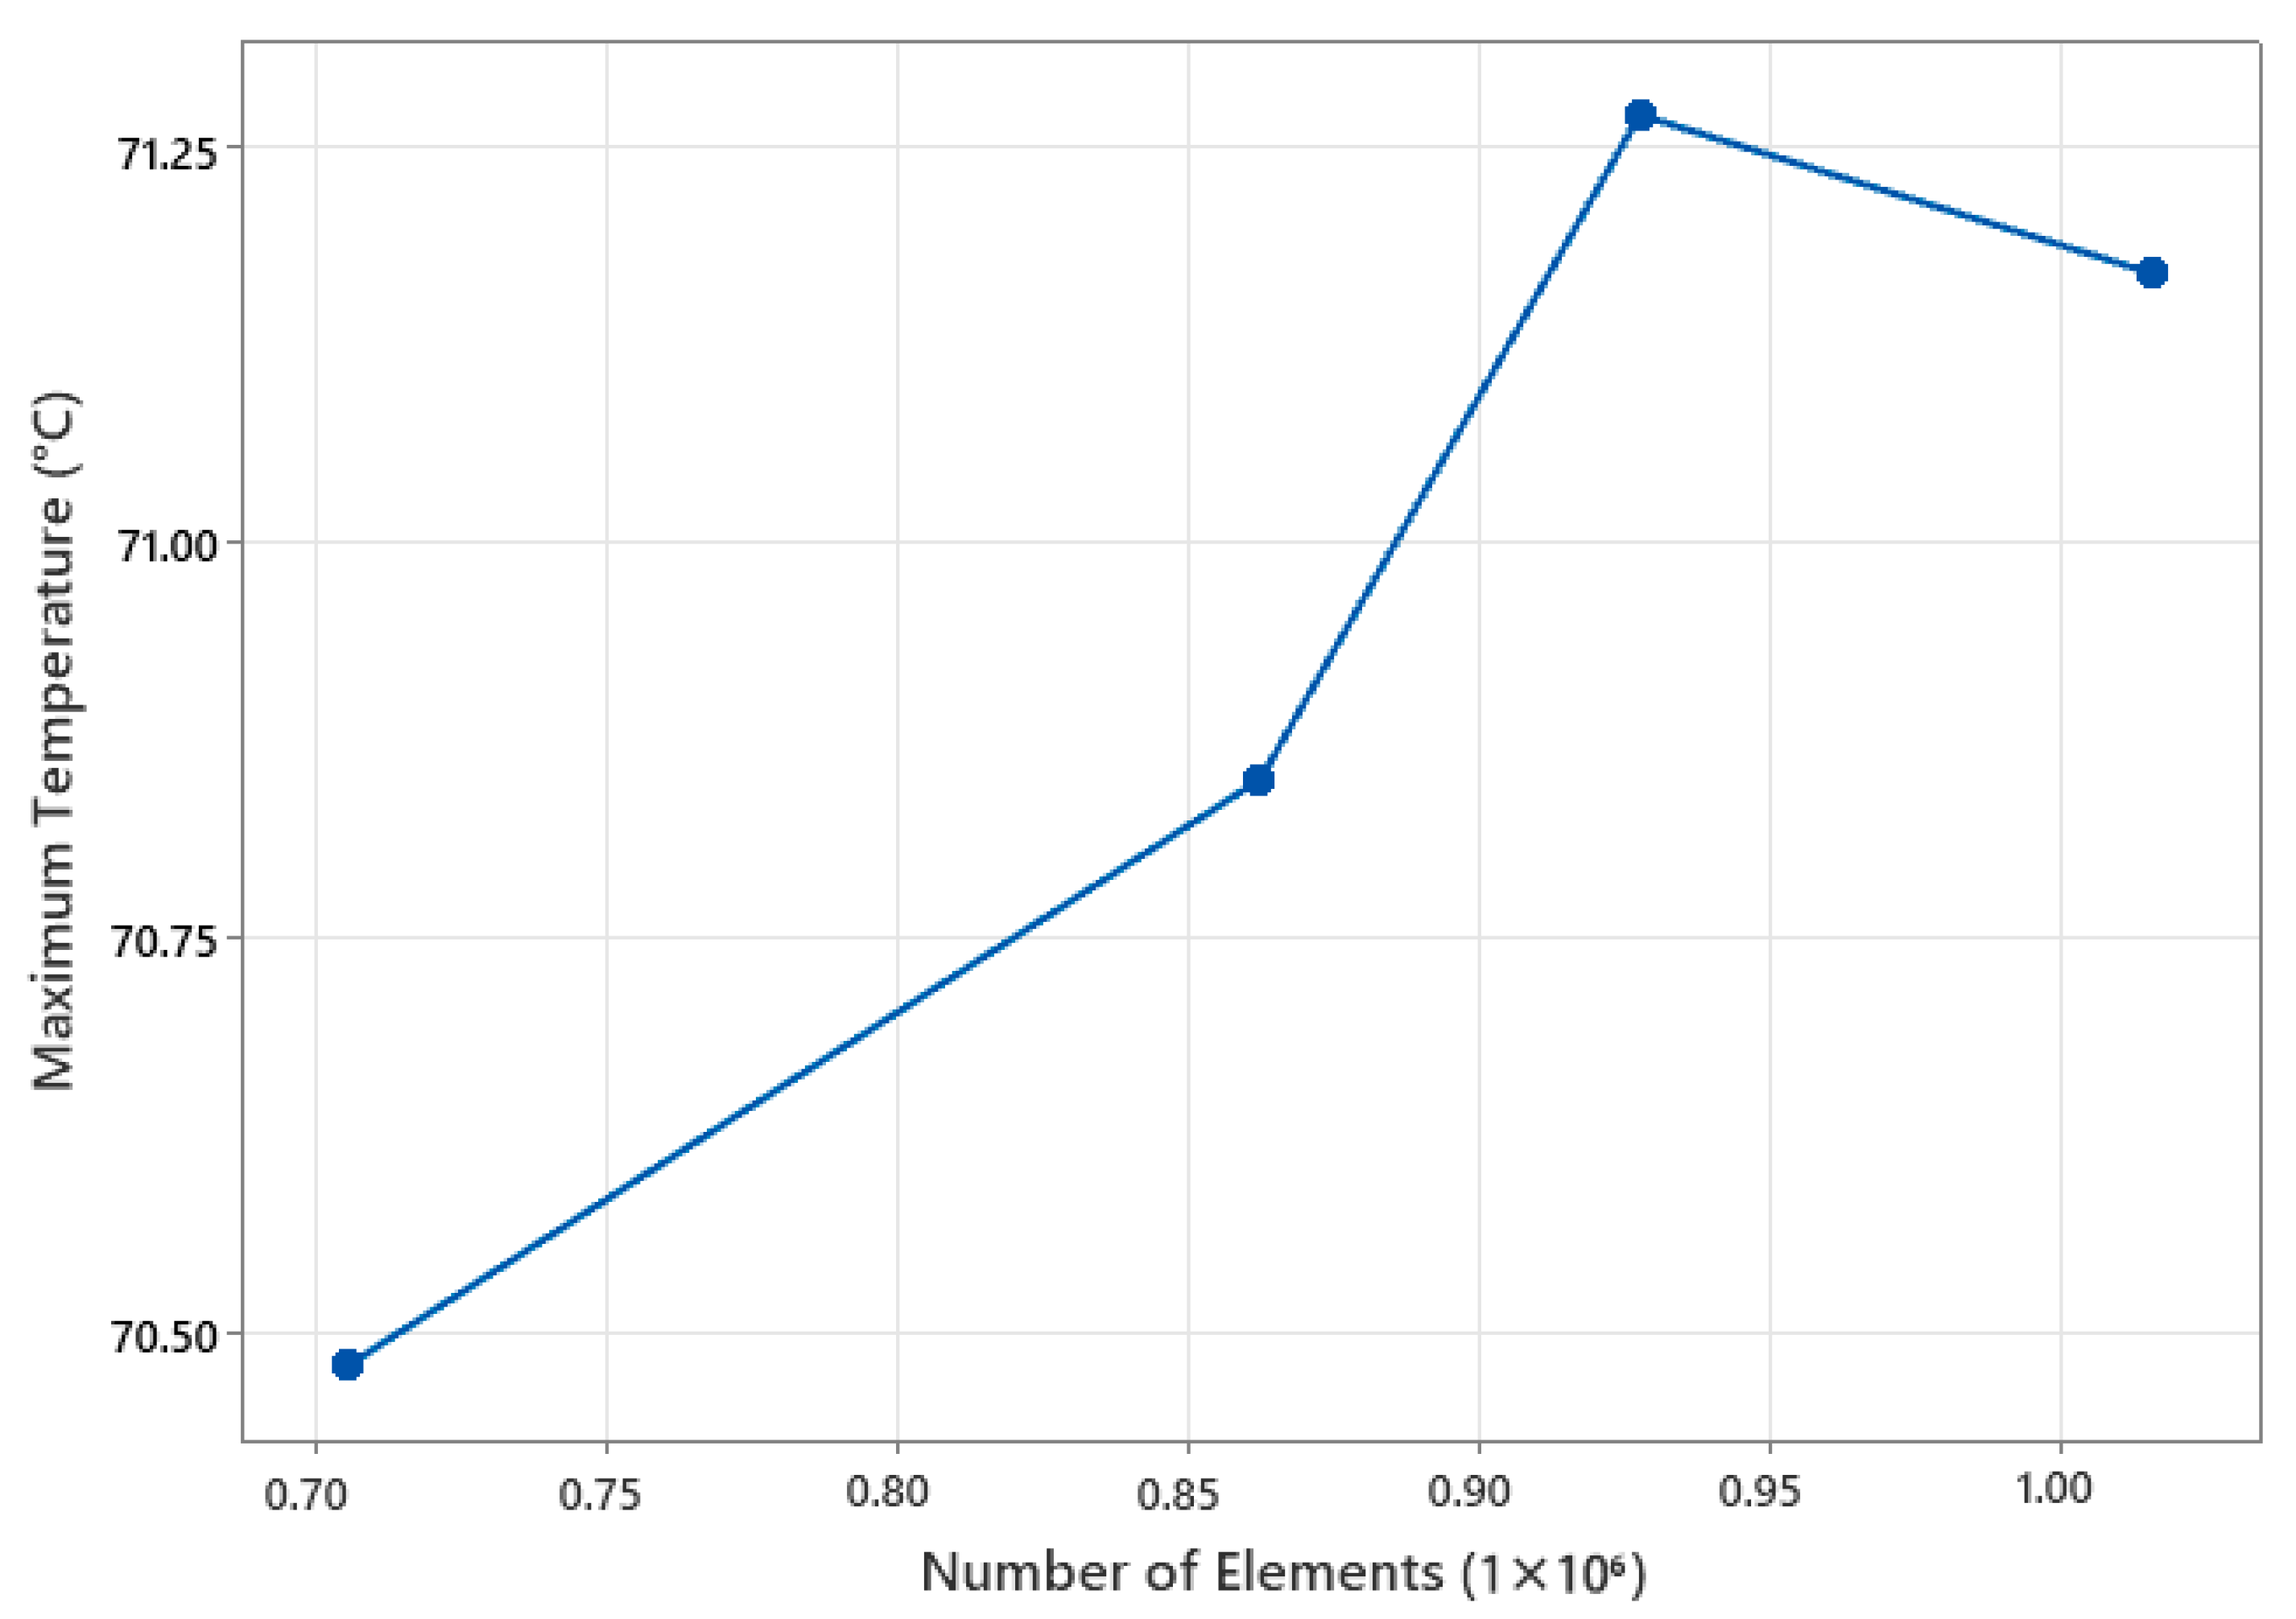
Increasing the mesh element count beyond approximately 927,000 alters the maximum temperature by less than 0.15 percent and the pressure drop by less than 1.1 percent. These findings indicate that mesh independence is achieved for element counts exceeding approximately 930,000. Therefore, a mesh comprising 927,875 elements was selected for subsequent simulations to balance computational accuracy and resource efficiency. Figure 3 shows the grid independence study for maximum temperature.

2.3. Computational Model Setup

Three-dimensional simulations were conducted in ANSYS Fluent 2025 R1, using water as the coolant. Table 2 lists the thermal properties of the cold plate components. The inlet velocity and temperature were set to 1.3 m/s and 300 K. The energy equation in ANSYS Fluent was enabled to set the coolant temperature, and the outlet was defined as 0 Pa Gauge Pressure. On the bottom surface of the cold plate, heat flux values of 20,000 W/m2, 30,000 W/m2, and 40,000 W/m2 are given. No-slip conditions were applied at the channel wall. The inlet temperature used in the energy equation varies across different simulation scenarios. The coolant flows through the tube, removes heat from the solid cooling plate, and supports both convection and conduction. The study examines heat conduction between the cooling plates and the coolant, as well as convection and conduction within the coolant. No convective or radiative heat transfer occurs between the cold plate and ambient air in this study.
The coolant is presumed to be incompressible. The velocity-pressure coupling is a property resolved by the COUPLED algorithm. The energy and momentum equations are discretized using the second-order upwind scheme. The simulation solves the Navier–Stokes equations and the energy equation for a steady, incompressible, and turbulent flow. The equations governing the system include conservation of energy, momentum, and mass continuity. The continuity equation is stated as follows:
ρ t + · ρ v = 0
where
  • ρ  is fluid density  ( k g / m 3 ) ;
  • v  is a fluid velocity vector  ( m / s ) ;
  • t  is time (s).
The momentum equation is stated as follows:
ρ v t + · ρ v v = p + · μ e f f v + v T + F
where
  • p  is pressure  ( P a ) ;
  • μ e f f  is the effective dynamic viscosity, including the contribution of turbulence  ( P a · s ) ;
  • F  are other forces (e.g., gravity).
The energy equation is expressed as follows:
ρ h t + · ρ v h = · k e f f T + Φ
where
  • h  is the total enthalpy  ( J / k g ) ;
  • k e f f  is an effective thermal conductivity  ( W / m · K ) ;
  • T  is temperature (K);
  • Φ  is the heat source due to viscosity or pressure work.
The Shear Stress Transport (SST) k–ω model was used to model the effects of turbulence. This model combines the k–ε model in the far field with the k–ω model near walls to obtain more accurate results in areas with high pressure gradients and separation [50]. SST k-ω matches experimental data well and is the best balance between cost, accuracy, and computational stability [51]. The formula for Turbulent Energy (k) is articulated as follows:
ρ k t + · ρ v k = P k β * ρ k ω + · μ + ρ k μ t k
The equation for Specific Dissipation Rate  ( ω )  is expressed as follows:
ρ ω t + · ρ v ω = α ω k P k β ρ ω 2 + · μ + ρ ω μ t ω + 2 1 F 1 ρ σ w 2 1 ω k · k
where
  • P k  is turbulence energy production;
  • μ t  is turbulent viscosity;
  • α ,   β , β * ,   ρ k ,   ρ k  is model constants;
  • F 1  is blending function;
The solid regions (copper tubes and aluminum plates) were modeled using the Fourier heat conduction equation.
T t = α 2 T  
α = k ρ c p
where
  • k  is thermal conductivity  ( W / m · K ) ;
  • c p  is the specific heat capacity  ( J / k g · K ) ;
  • α  is thermal diffusivity  ( m 2 / s ) .
Newton’s law of cooling governed the convective heat transfer between the coolant and the tube wall. The equation is as follows:
q = h T s T f  
where
  • q  is heat flux  ( W / m 2 ) ;
  • h  is the convection heat transfer coefficient  ( W / m 2 · K ) ;
  • T s  is surface temperature (wall/copper tube);
  • T f  is fluid temperature (water).

2.4. Model Validation

To assess the accuracy and reliability of the numerical framework, results were compared with those published by Khoshvaght-Aliabadi et al. [48]. The reference study examined a cold plate with serpentine channels cooled by carbon dioxide (CO2). The geometry, consisting of an aluminum plate measuring 210 × 160 × 5 mm and stainless steel tubes with a circular cross-section (outer diameter 5 mm, inner diameter 3 mm, tube length 1210 mm), closely matches the CP#1 configuration in this study.
For direct comparison and validation of the simulation methodology, the working fluid in the CFD model was temporarily changed from water to CO2. The temperature-dependent thermophysical properties of CO2, including density, specific heat capacity, thermal conductivity, and viscosity, were specified using the standard material database in Ansys Fluent 2025 R1. The operational conditions from the reference study, specifically a mass flux of 300 kg/(m2·s), an inlet temperature of 298.15 K, and a pressure of 7.5 MPa, were exactly replicated in the validation simulations.
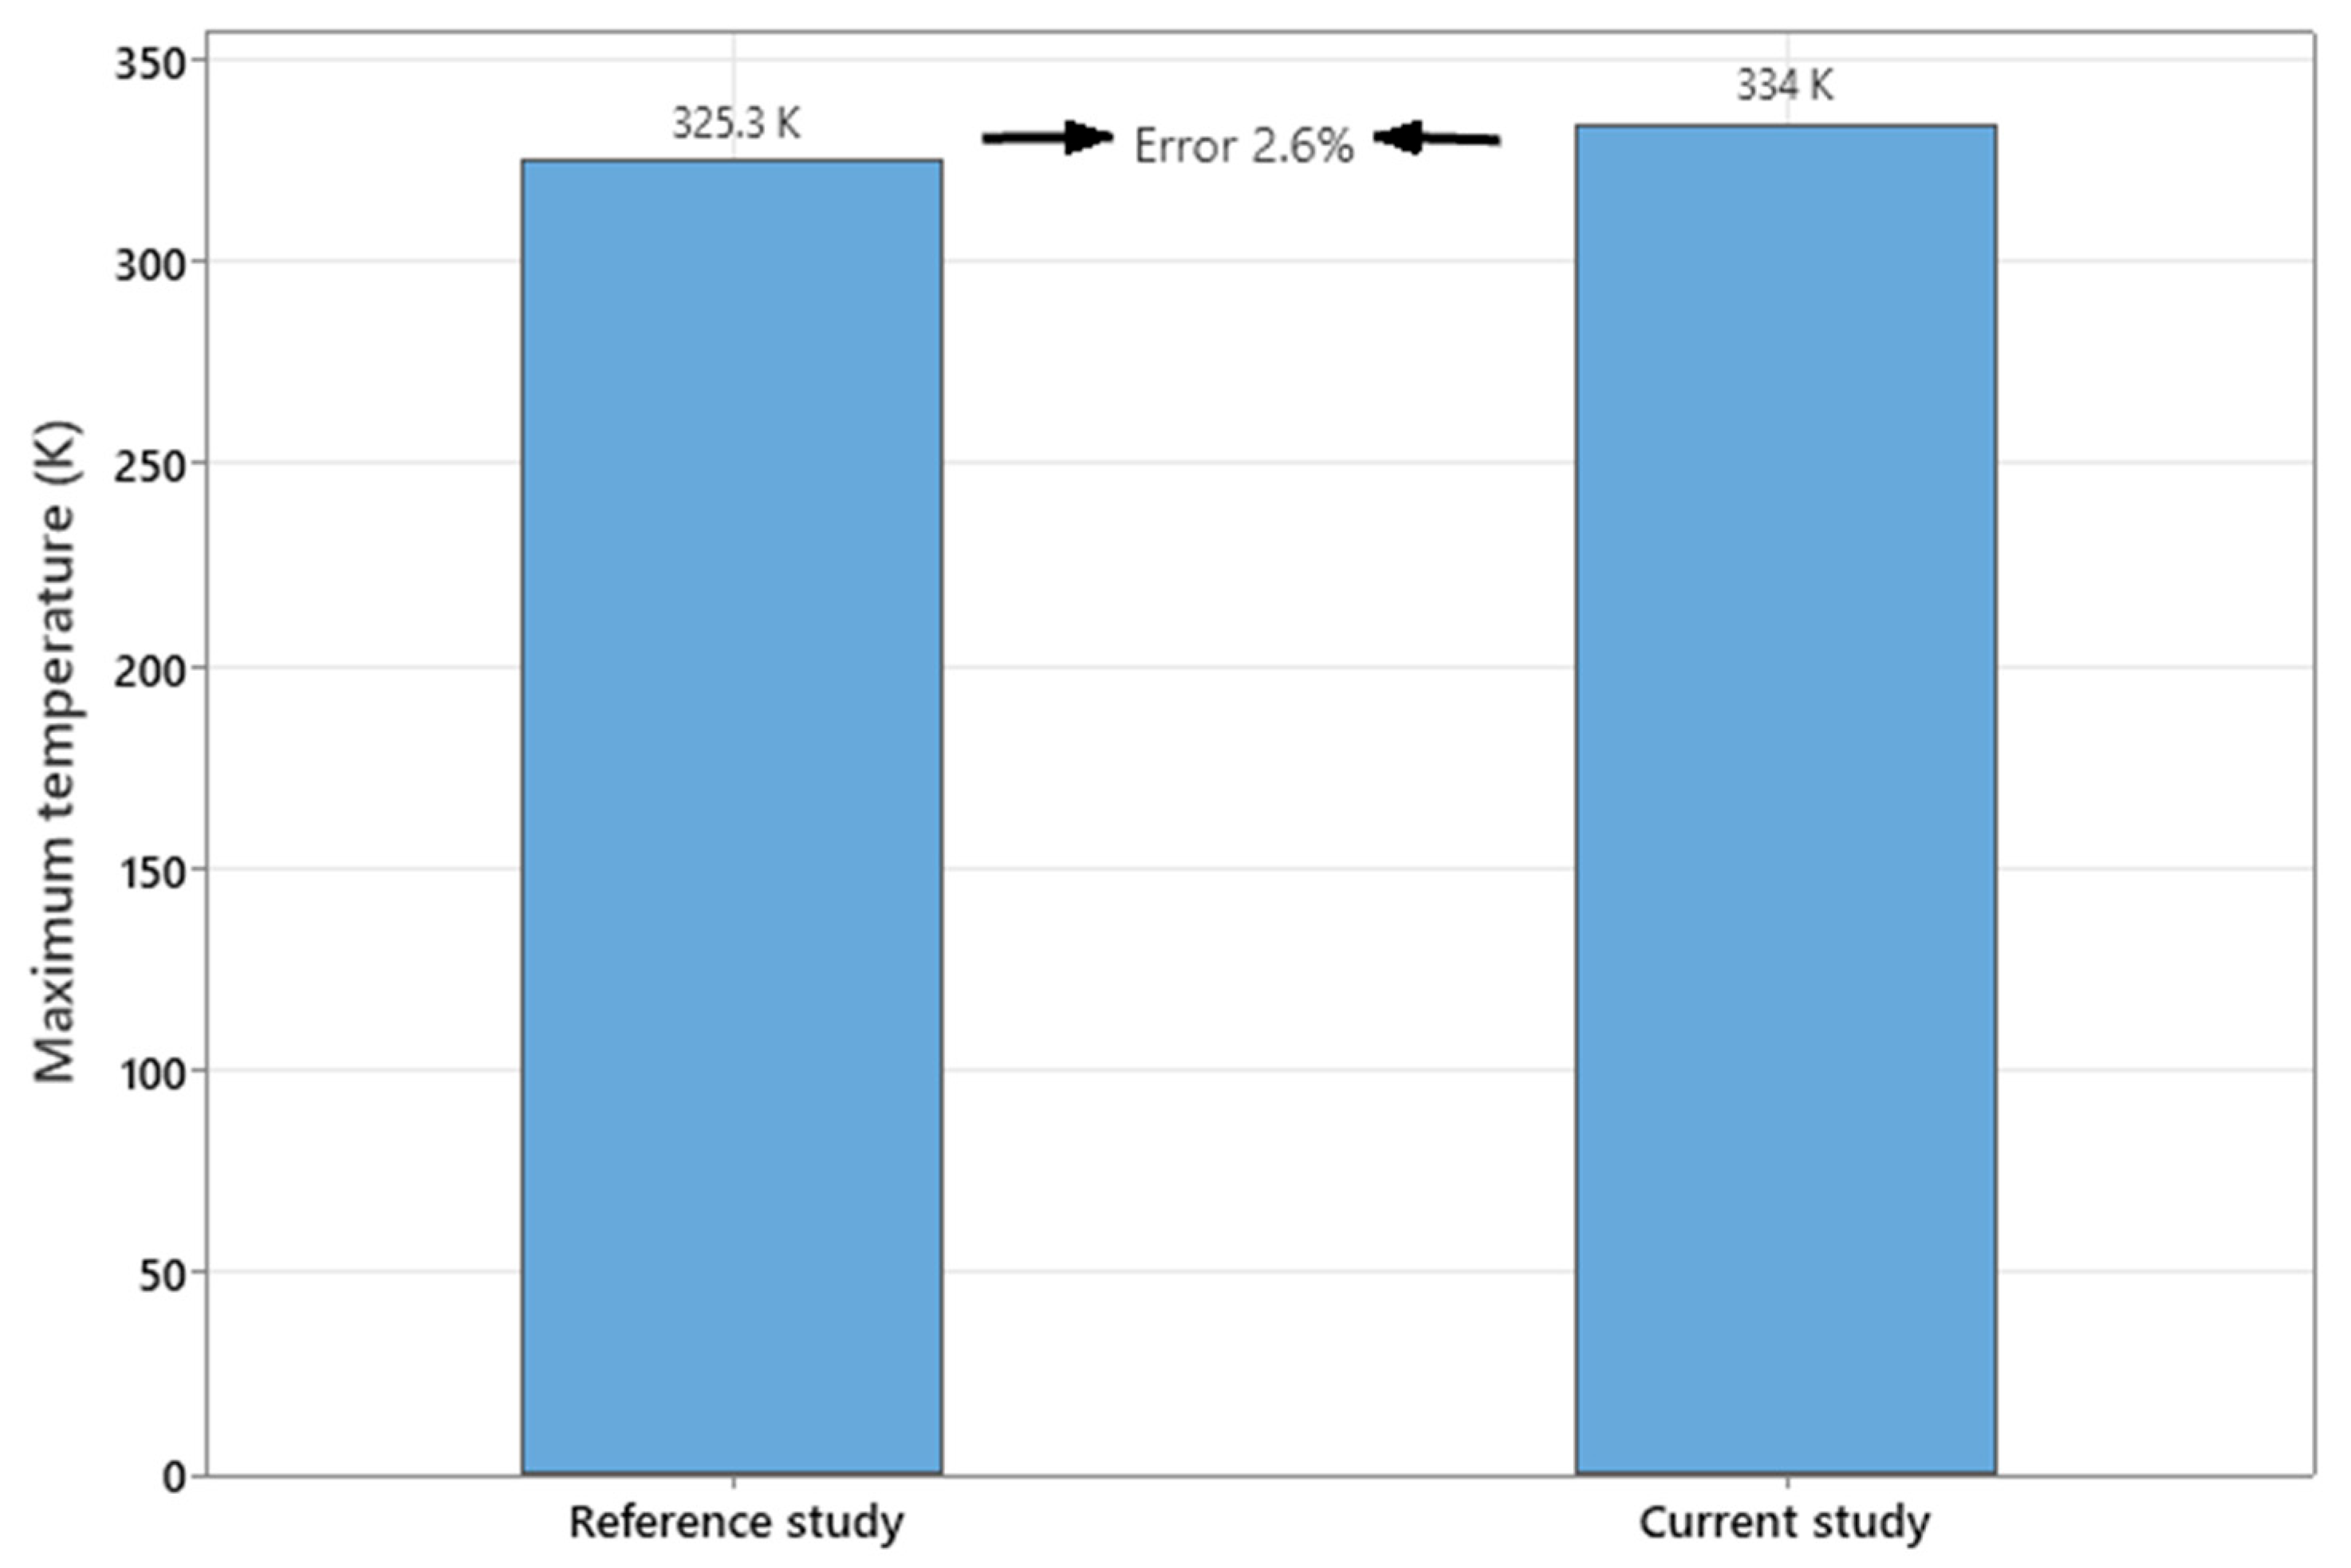
The results in Figure 4 indicate strong agreement between the current simulation and the reference data. The maximum temperature predicted by the model (using CO2) is 334 K, differing by only 2.6% from the value reported by Khoshvaght-Aliabadi et al. (325.3 K). This successful validation, demonstrated by the low percentage error, confirms the capability of our numerical methodology to accurately predict thermo-hydraulic performance. This provides high confidence in the primary results of this study, which were obtained using water as the cooling fluid.

2.5. Assumptions and Limitations

To simplify the model and focus on the cold plate’s intrinsic thermo-hydraulic performance, several modeling assumptions were made. This subsection details these key assumptions and their implications on the results.
First, the analysis was conducted under steady-state conditions. This approach was intentionally chosen to represent thermally demanding scenarios, such as prolonged fast charging or continuous high-load operation. Assessing system performance under sustained peak thermal loads is critical for determining the maximum cooling capacity and identifying potential hot spots. Although battery heating is inherently transient, this steady-state analysis is essential for ensuring a robust thermal design, an approach consistent with similar studies [52,53].
Second, convection and radiation heat exchange between the cold plate’s surfaces and the ambient air were neglected. This is a conservative simplification, consistent with methodologies reported by other researchers [54], that isolates the performance of the internal cooling channels by excluding external heat dissipation paths. Consequently, the predicted battery temperatures are likely to be slightly higher than in actual operation, thus providing an inherent safety margin in the design guidelines derived from this study.

3. Results and Discussion

3.1. Temperature Distribution

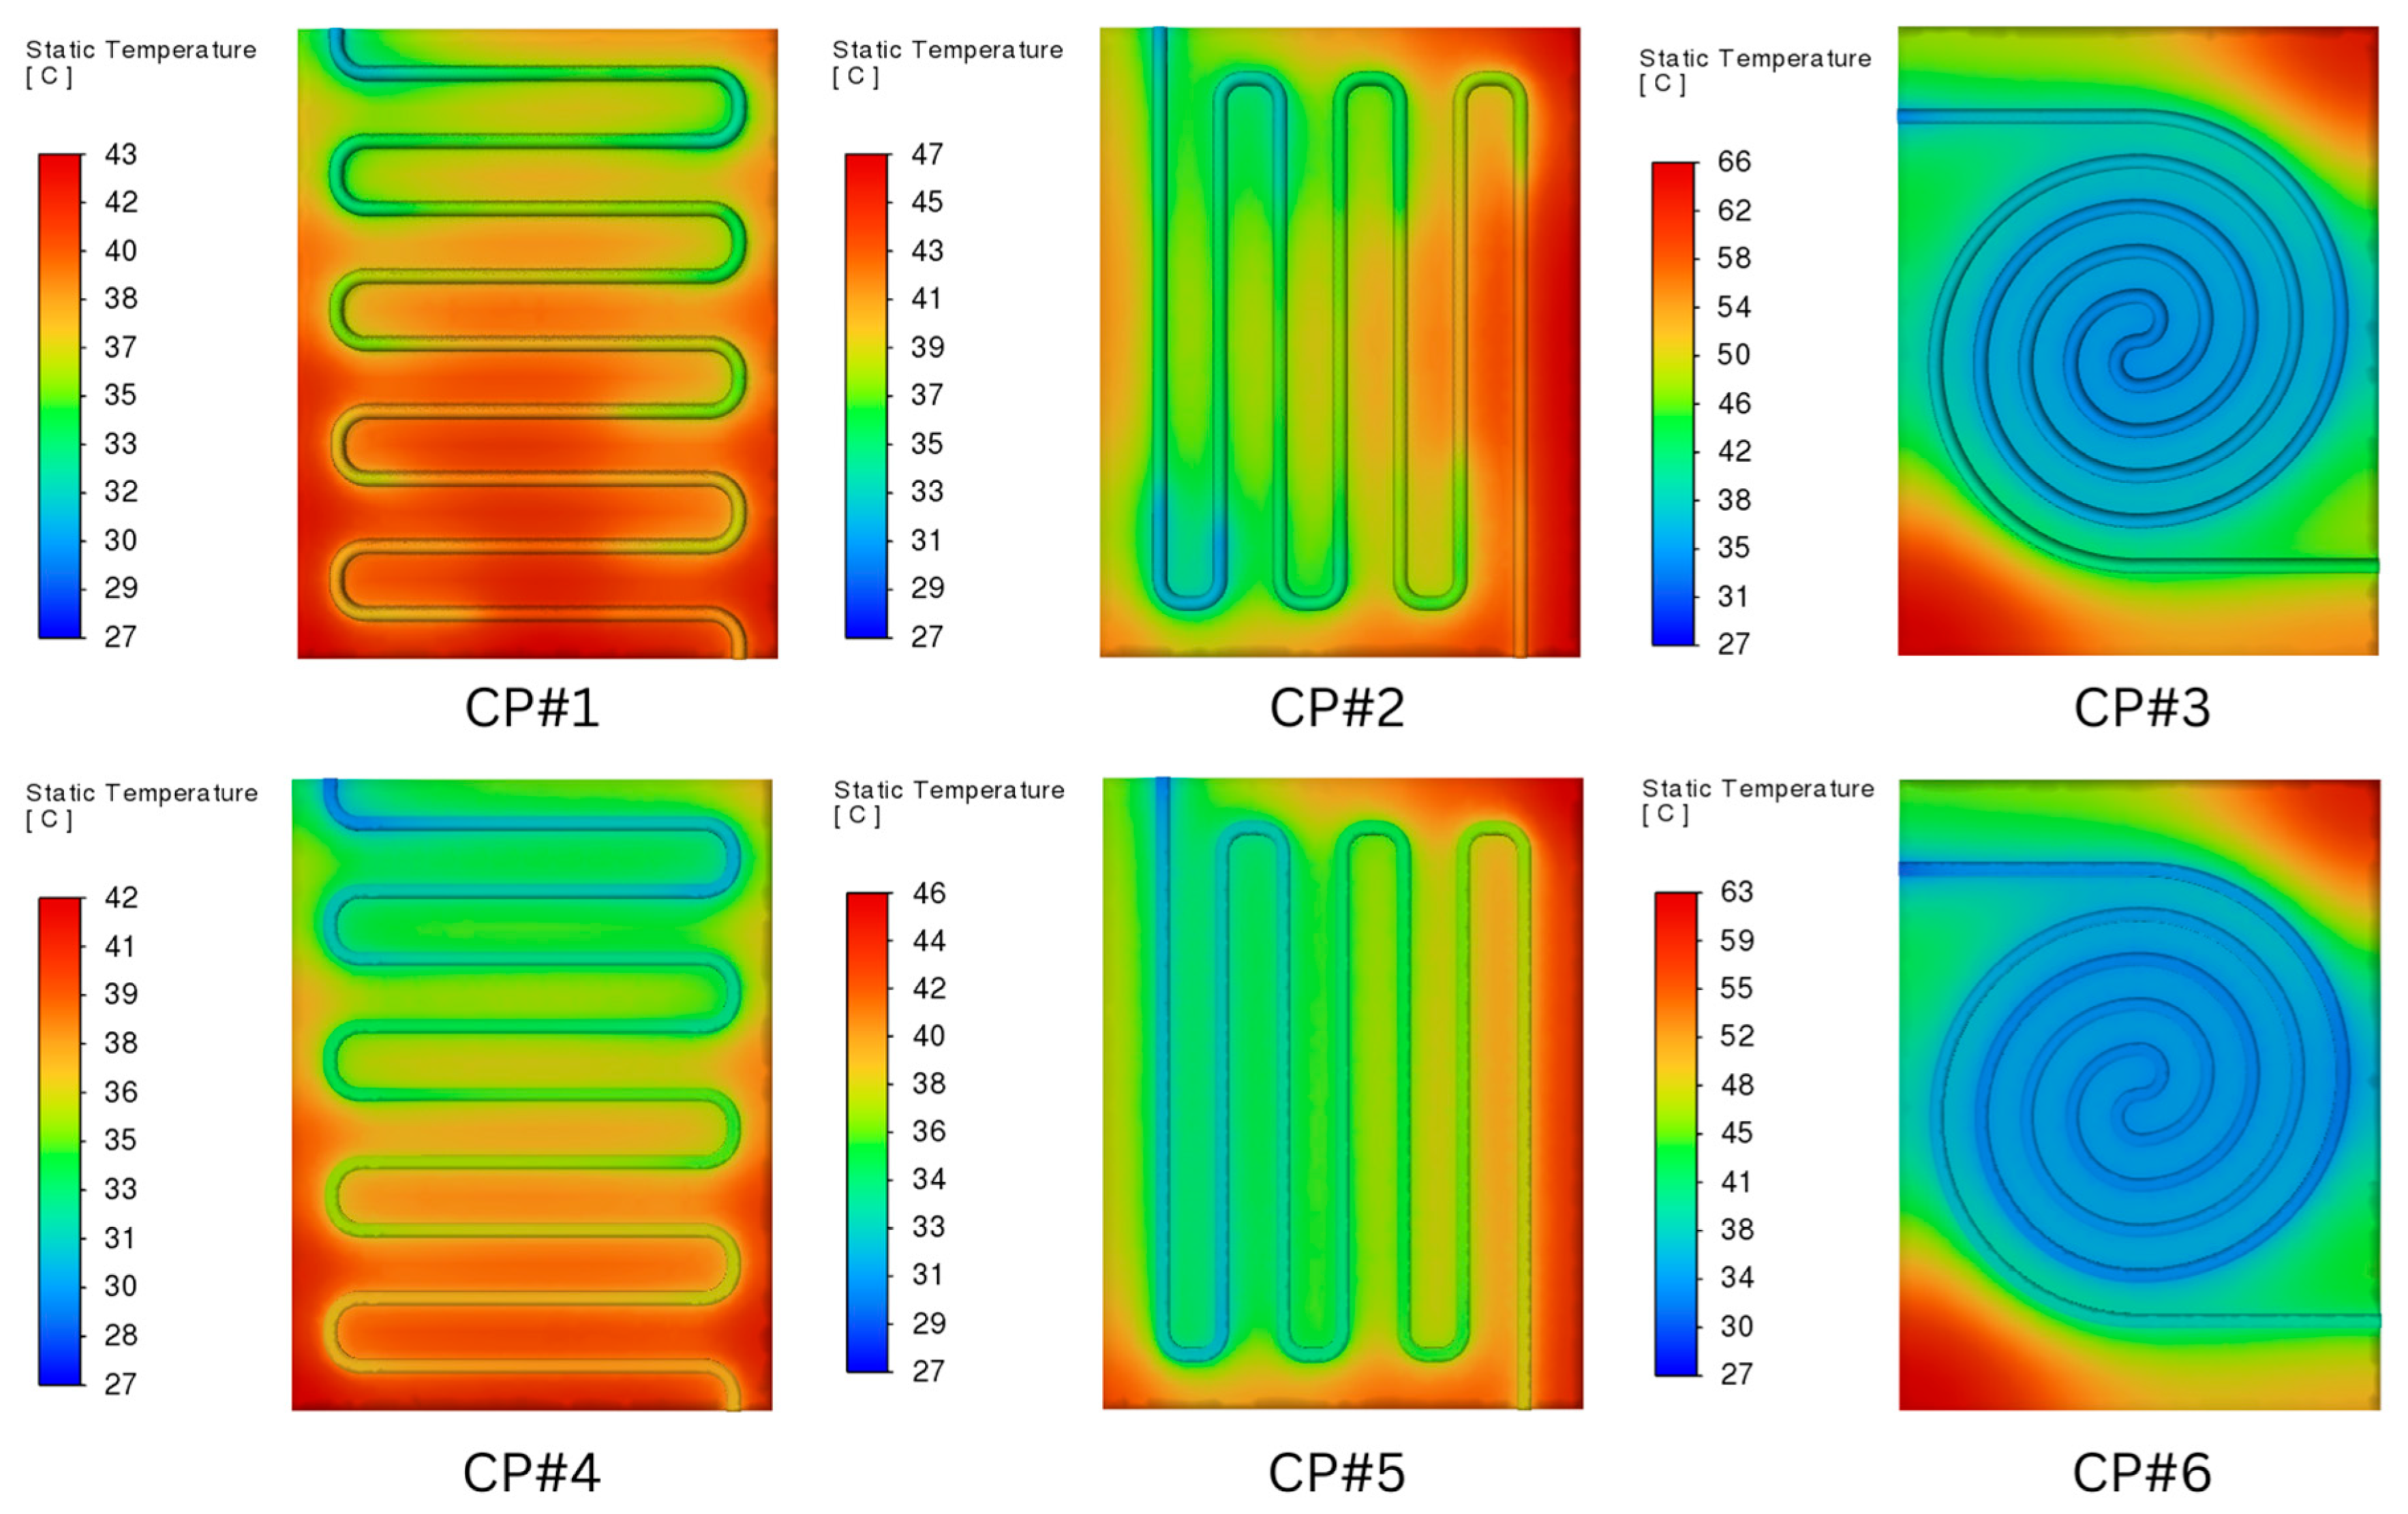
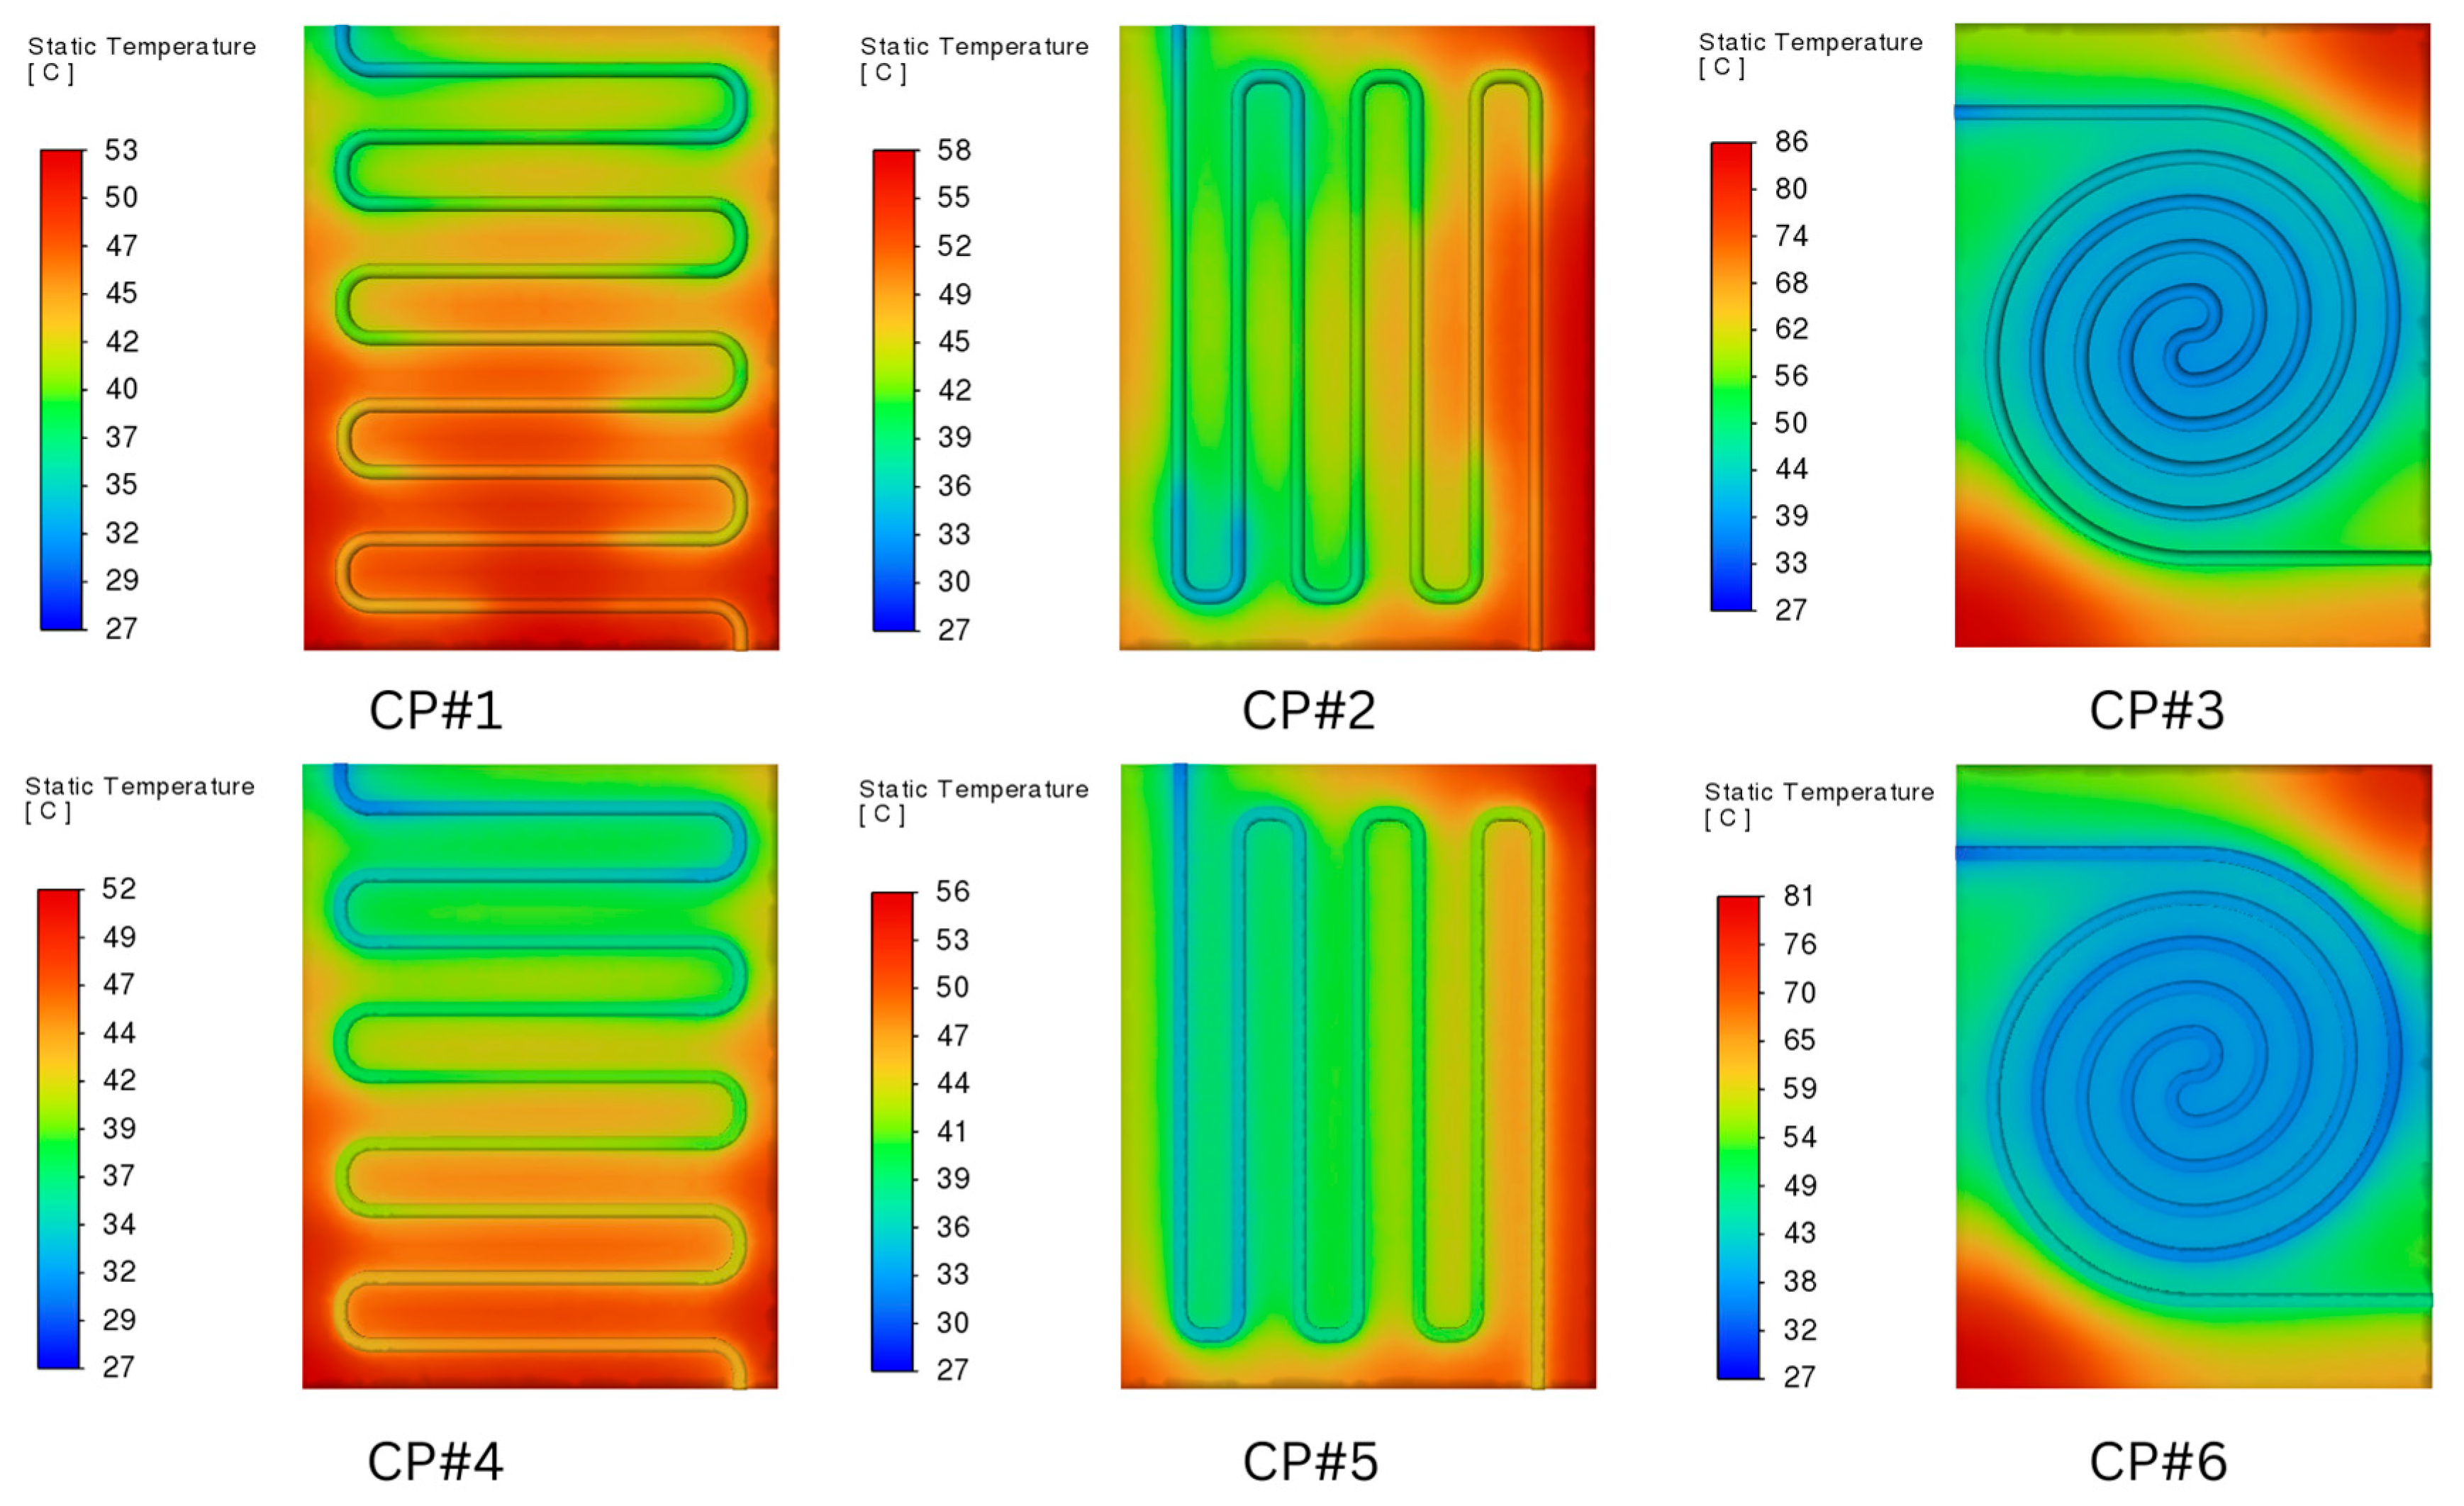
Figure 5 shows simulation results from ANSYS Fluent, with a heat flux of 20,000 W/m2 applied to the bottom of the plate. Cold plates with serpentine channels are more effective in reducing maximum temperatures than those with spiral channels. Specifically, CP#1 (43 °C), CP#2 (47 °C), CP#4 (42 °C), and CP#5 (46 °C) consistently exhibit lower maximum temperatures than CP#3 (66 °C) and CP#6 (63 °C). When comparing CP#3 to CP#1, CP#3’s maximum temperature is 34.85% higher. Compared to CP#2, it is 28.79% higher. Similarly, CP#6’s maximum temperature is 33.33% higher than CP#4 and 26.98% higher than CP#5. Therefore, in this study, the spiral-shaped channel results in a 26–35% higher maximum temperature than the serpentine-shaped channel. This finding contrasts with that of Li et al. [47]. They reported that the spiral channel reduced the maximum temperature by 15.61% compared to the serpentine channel. The reason for this discrepancy is the design difference between the two studies. Li et al. [47] used a spiral channel with a length of 1116.65 mm, while the present study uses a 1338 mm spiral channel. The spiral channel in Li et al. [47] study had bends that occurred less frequently and with less restriction, resulting in a lower pressure drop of 43.78 Pa, compared to a much higher pressure drop of 12,719.46 Pa in the current study. A lower pressure drop enables a higher sustained fluid flow rate, thereby improving heat transfer efficiency. In Li et al. [47], the flow in the spiral channel exhibited characteristics of plug flow, meaning the fluid moved linearly along the spiral without stagnation. This, despite irregular heat distribution, helped maintain a lower overall cold plate temperature. Thus, Li et al. [47]’s spiral channel had a lower temperature than the serpentine channel due to its design, which allowed for a lower pressure drop and higher flow. Conversely, in this study, the spiral channel’s higher pressure drop limits fluid velocity, resulting in higher temperatures versus the serpentine channel. While this analysis clearly shows a dependence of cold plate cooling effectiveness on channel shape and the resulting pressure drop, it does not allow for a universal conclusion about whether serpentine or spiral channels are more effective. The performance depends on the detailed specifications and dimensions of the channels under consideration.
Figure 5 also shows that the serpentine channel with more turns produces a lower temperature at the cold plate than the serpentine channel with fewer turns. The maximum temperature at CP#1 is 8.51% lower than that at CP#2, and the maximum temperature at CP#4 is 8.7% lower than that at CP#5. This is because each bend in the serpentine channel forces the fluid flow to change direction. This change in direction disrupts the fluid boundary layer formed at the channel walls. This disruption enhances the mixing of the hot fluid near the walls with the cooler fluid in the center of the flow, thereby increasing the heat transfer coefficient. More bends increase turbulence, thus enhancing heat transfer [55].
Figure 5 shows that the channel with a square tube produces better temperature reduction compared to the channel with a circular tube. The maximum temperature at CP#4 is 2.33% lower than the maximum temperature at CP#1, the maximum temperature at CP#5 is 2.13% lower than the maximum temperature at CP#2, and the maximum temperature at CP#6 is 4.55% lower than the maximum temperature at CP#3. In square tubes, the angles cause different flow patterns, creating secondary flow or recirculation zones that disrupt the boundary layer and increase local turbulence. This increases the Nusselt number, leading to improved heat transfer. In circular tubes, however, the flow pattern is more streamlined, and the boundary layer develops more stably, resulting in slightly lower heat transfer [56].
Figure 6 shows the temperature distribution on various types of cold plates with a heat flux of 30,000 W/m2 on the bottom surface. The serpentine channel cools the cold plate more effectively than the elliptical channel. The square tube provides better cooling than the circular tube. Additionally, a serpentine channel with more turns cools the plate more effectively than one with fewer turns. This pattern remains the same when the cold plate is subjected to a heat flux of 20,000 W/m2. The escalation in heat flux from 20,000 to 30,000 results in a maximum temperature rise in the serpentine channel with 8 U-turns, from 18.87% to 19.23%, in the serpentine channel with 6 U-turns, from 17.86% to 18.97%, and in the spiral channel, from 22.22% to 23.26%. The elliptical channel in this investigation exhibited a greater temperature increase than the serpentine channel.
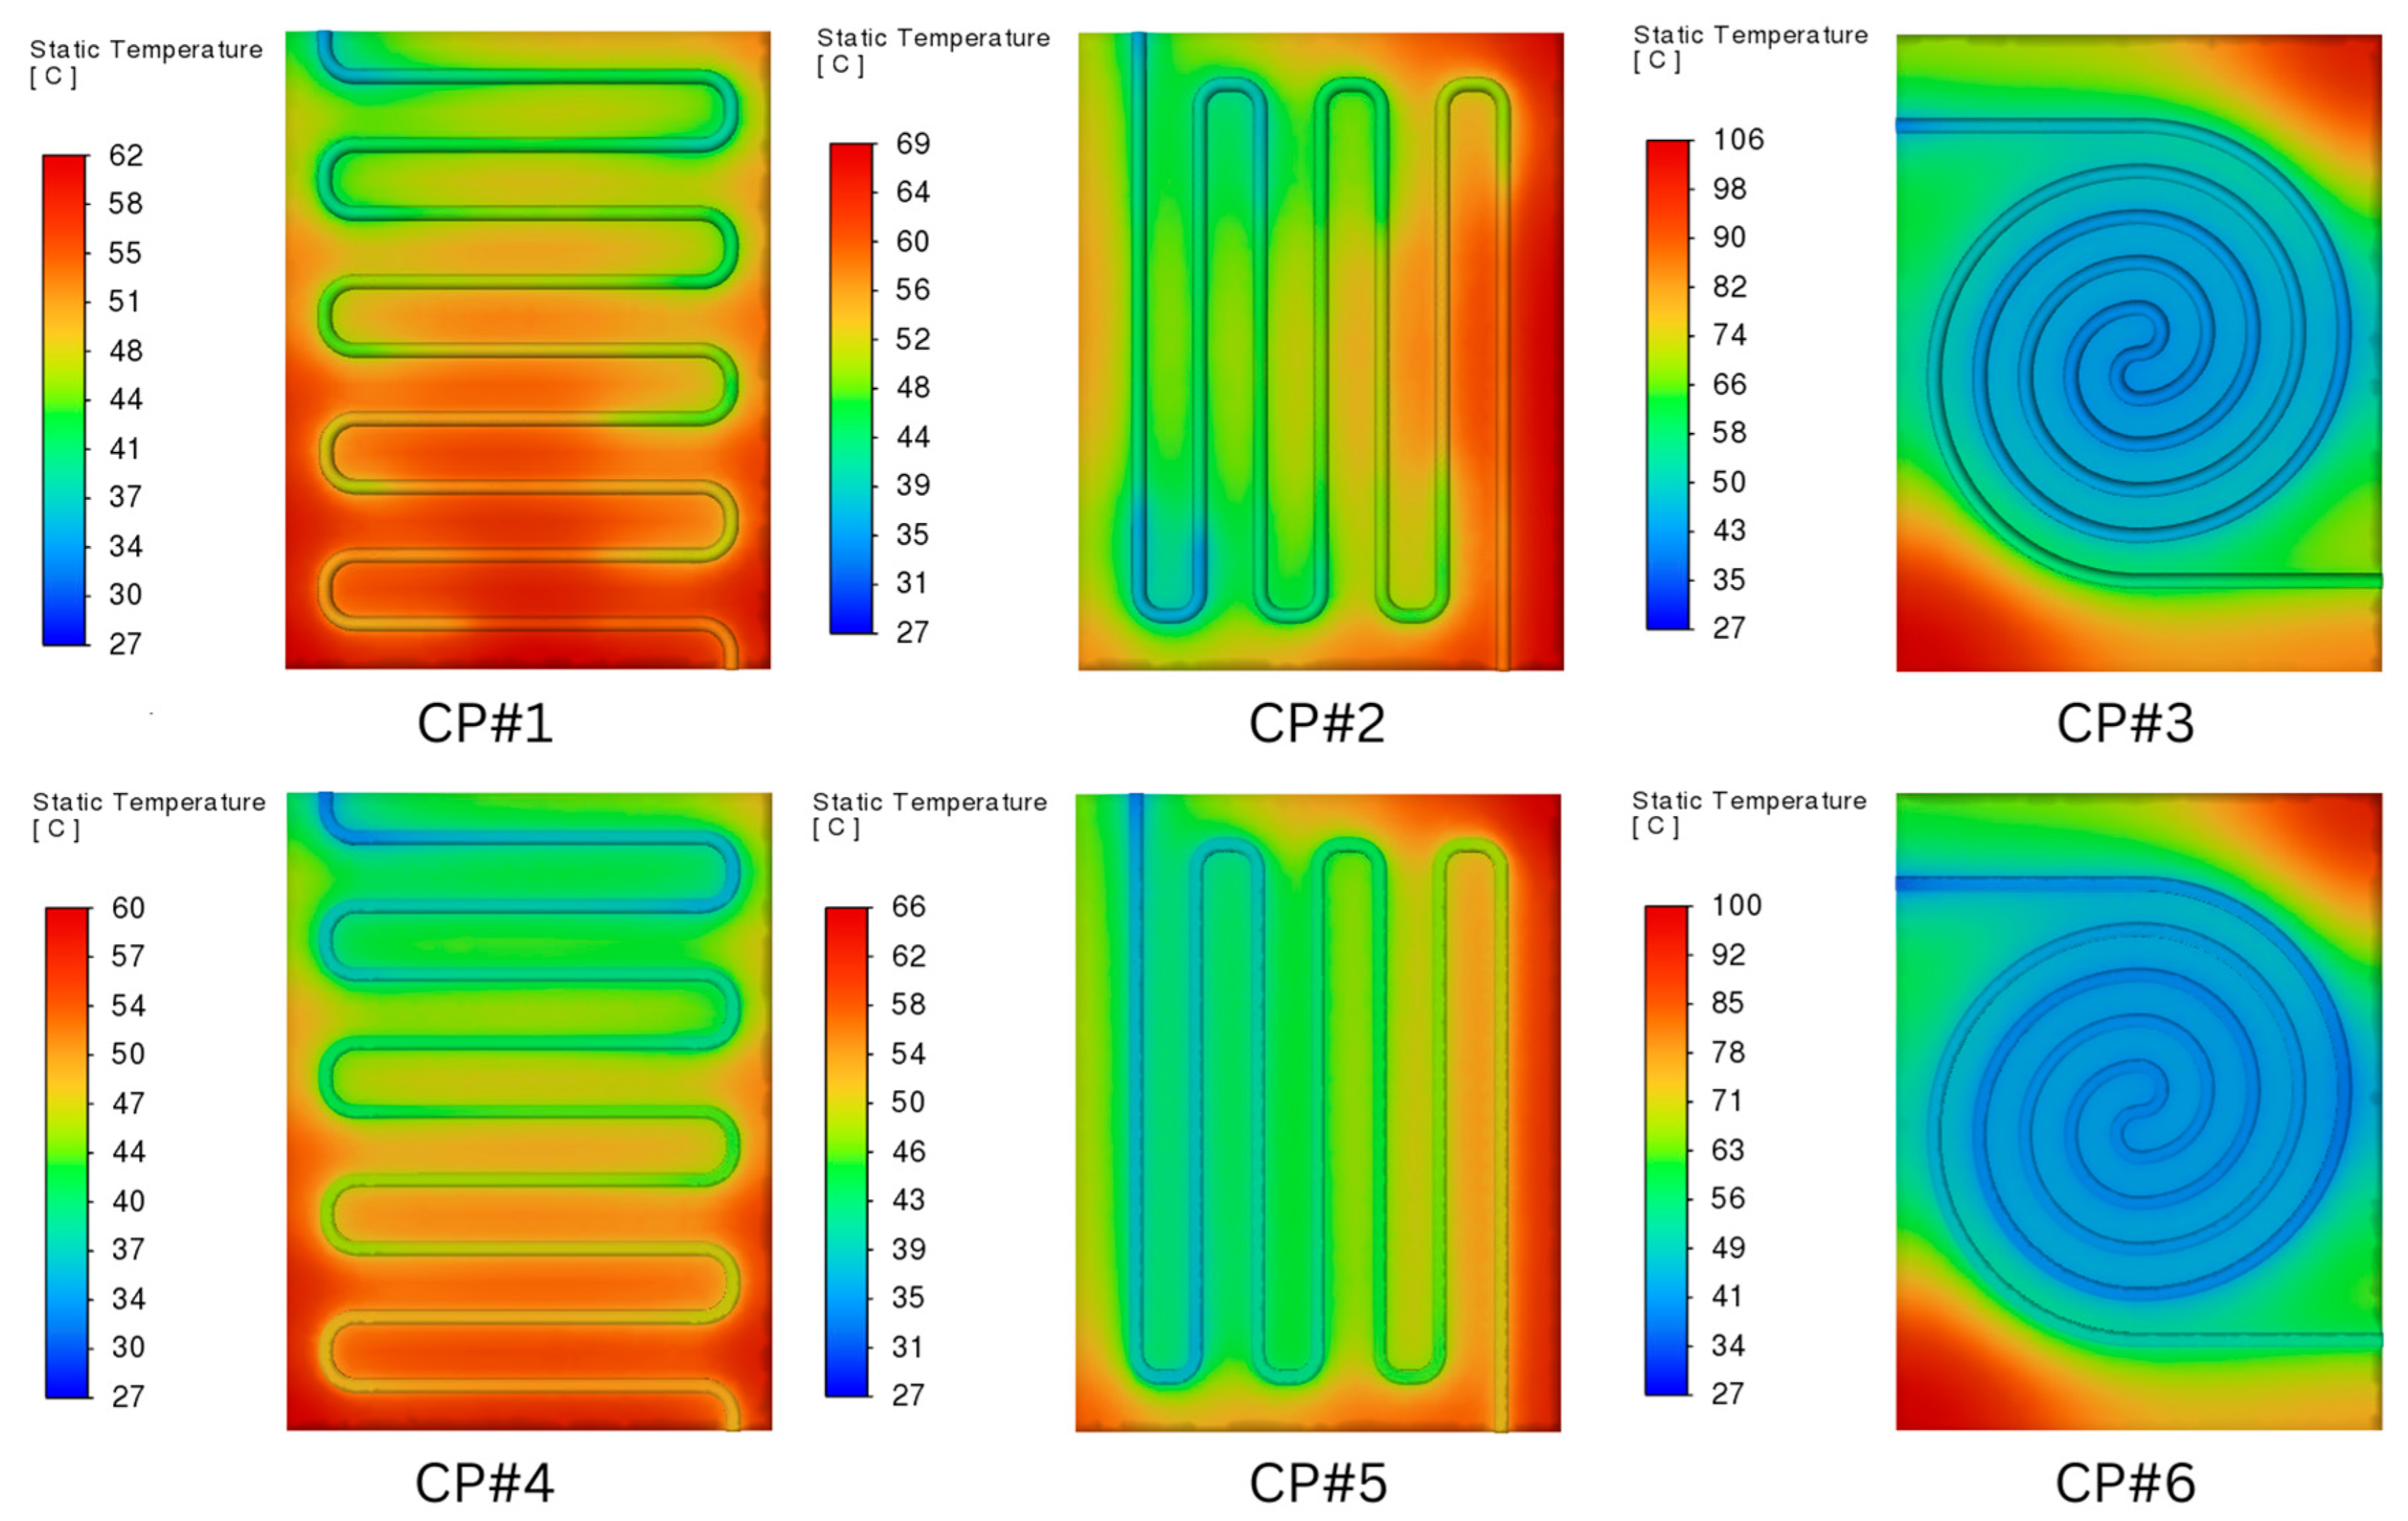
The effect of increasing heat flux on thermal performance is presented in Figure 7, which illustrates the temperature distribution for each configuration at a load of 40,000 W/m2. To present the quantitative data more clearly, a comparison of the maximum temperatures at different heat fluxes is summarized in Table 3. The table shows that doubling the heat flux results in a significant increase in maximum temperature across all configurations, ranging from 30% to 38%. It is noteworthy that the spiral duct designs (CP#3 and CP#6) not only achieved the highest absolute temperatures but also demonstrated the largest percentage increase, indicating greater sensitivity to increased thermal load compared to the serpentine design.
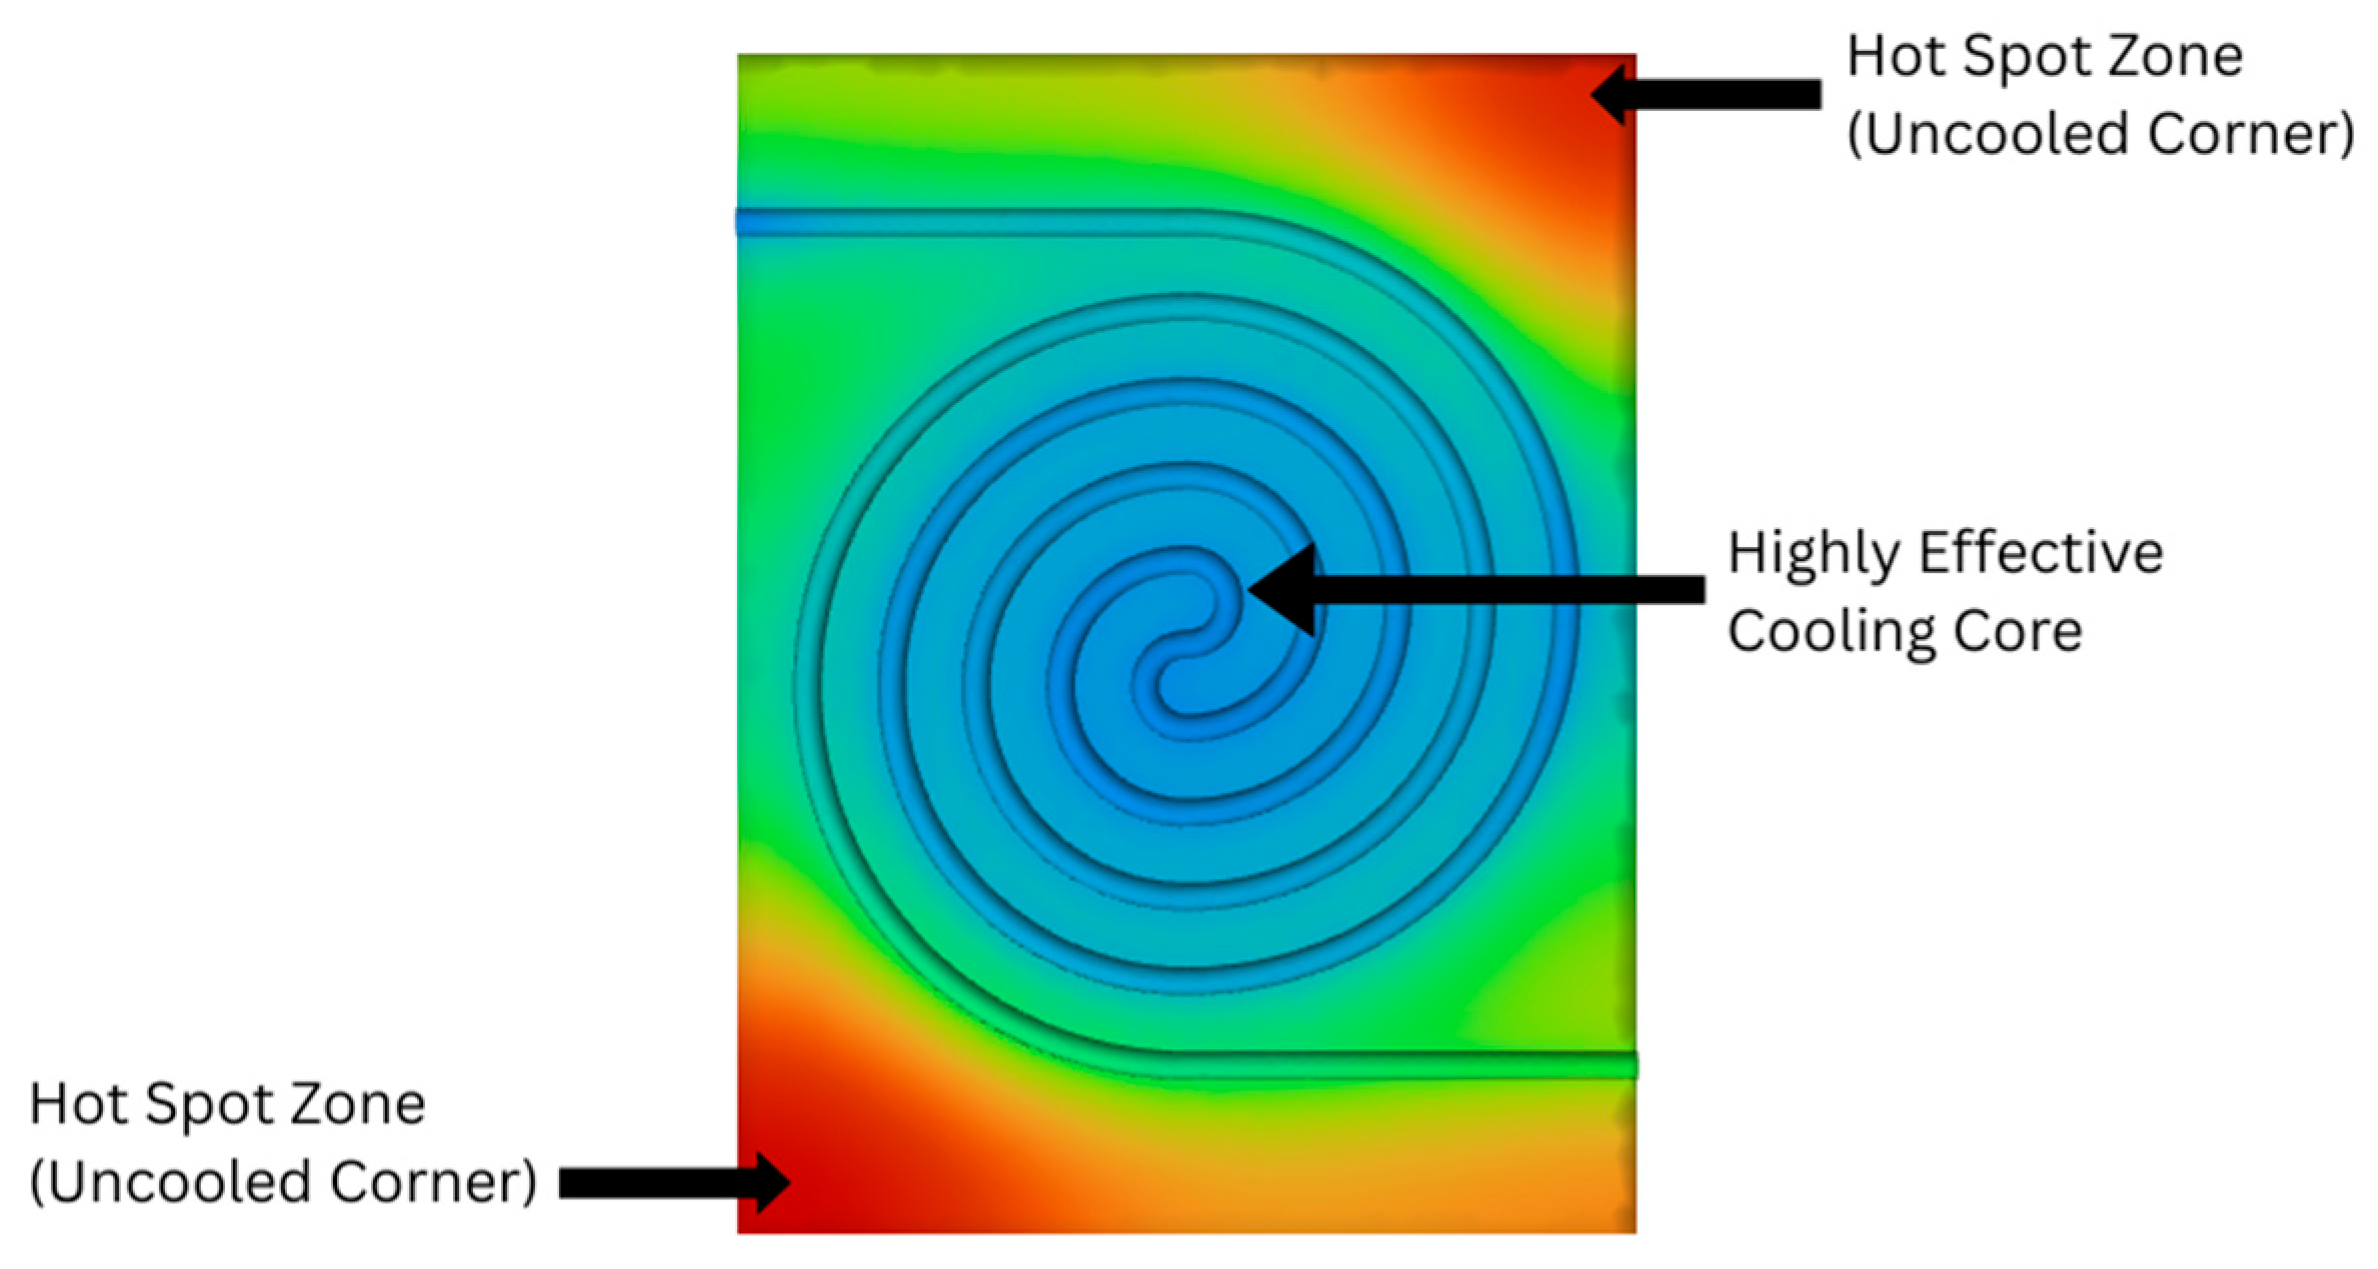
A two-dimensional temperature distribution analysis was performed to investigate the cause of elevated maximum temperatures in spiral channel configurations (CP#3 and CP#6). Figure 8 presents the temperature contour for CP#3 at a heat flux of 40,000 W/m2, which highlights a distinct contrast between the efficiently cooled core and the plate corners. The core, where spiral channels direct coolant flow, exhibits low and uniform temperatures, demonstrating the high efficiency of the cooling concept in this region. In contrast, the highest temperatures are observed at the four corners, as the spiral design leaves significant peripheral areas without direct cooling. These uncooled corners accumulate heat, resulting in increased maximum plate temperatures. These findings suggest that the elevated maximum temperature in the spiral design is due to geometric constraints rather than a fundamental limitation of the cooling mechanism. Consequently, evaluation of spiral designs should consider both the maximum temperature and the effectiveness in cooling the critical core area.

3.2. Thermal Resistance

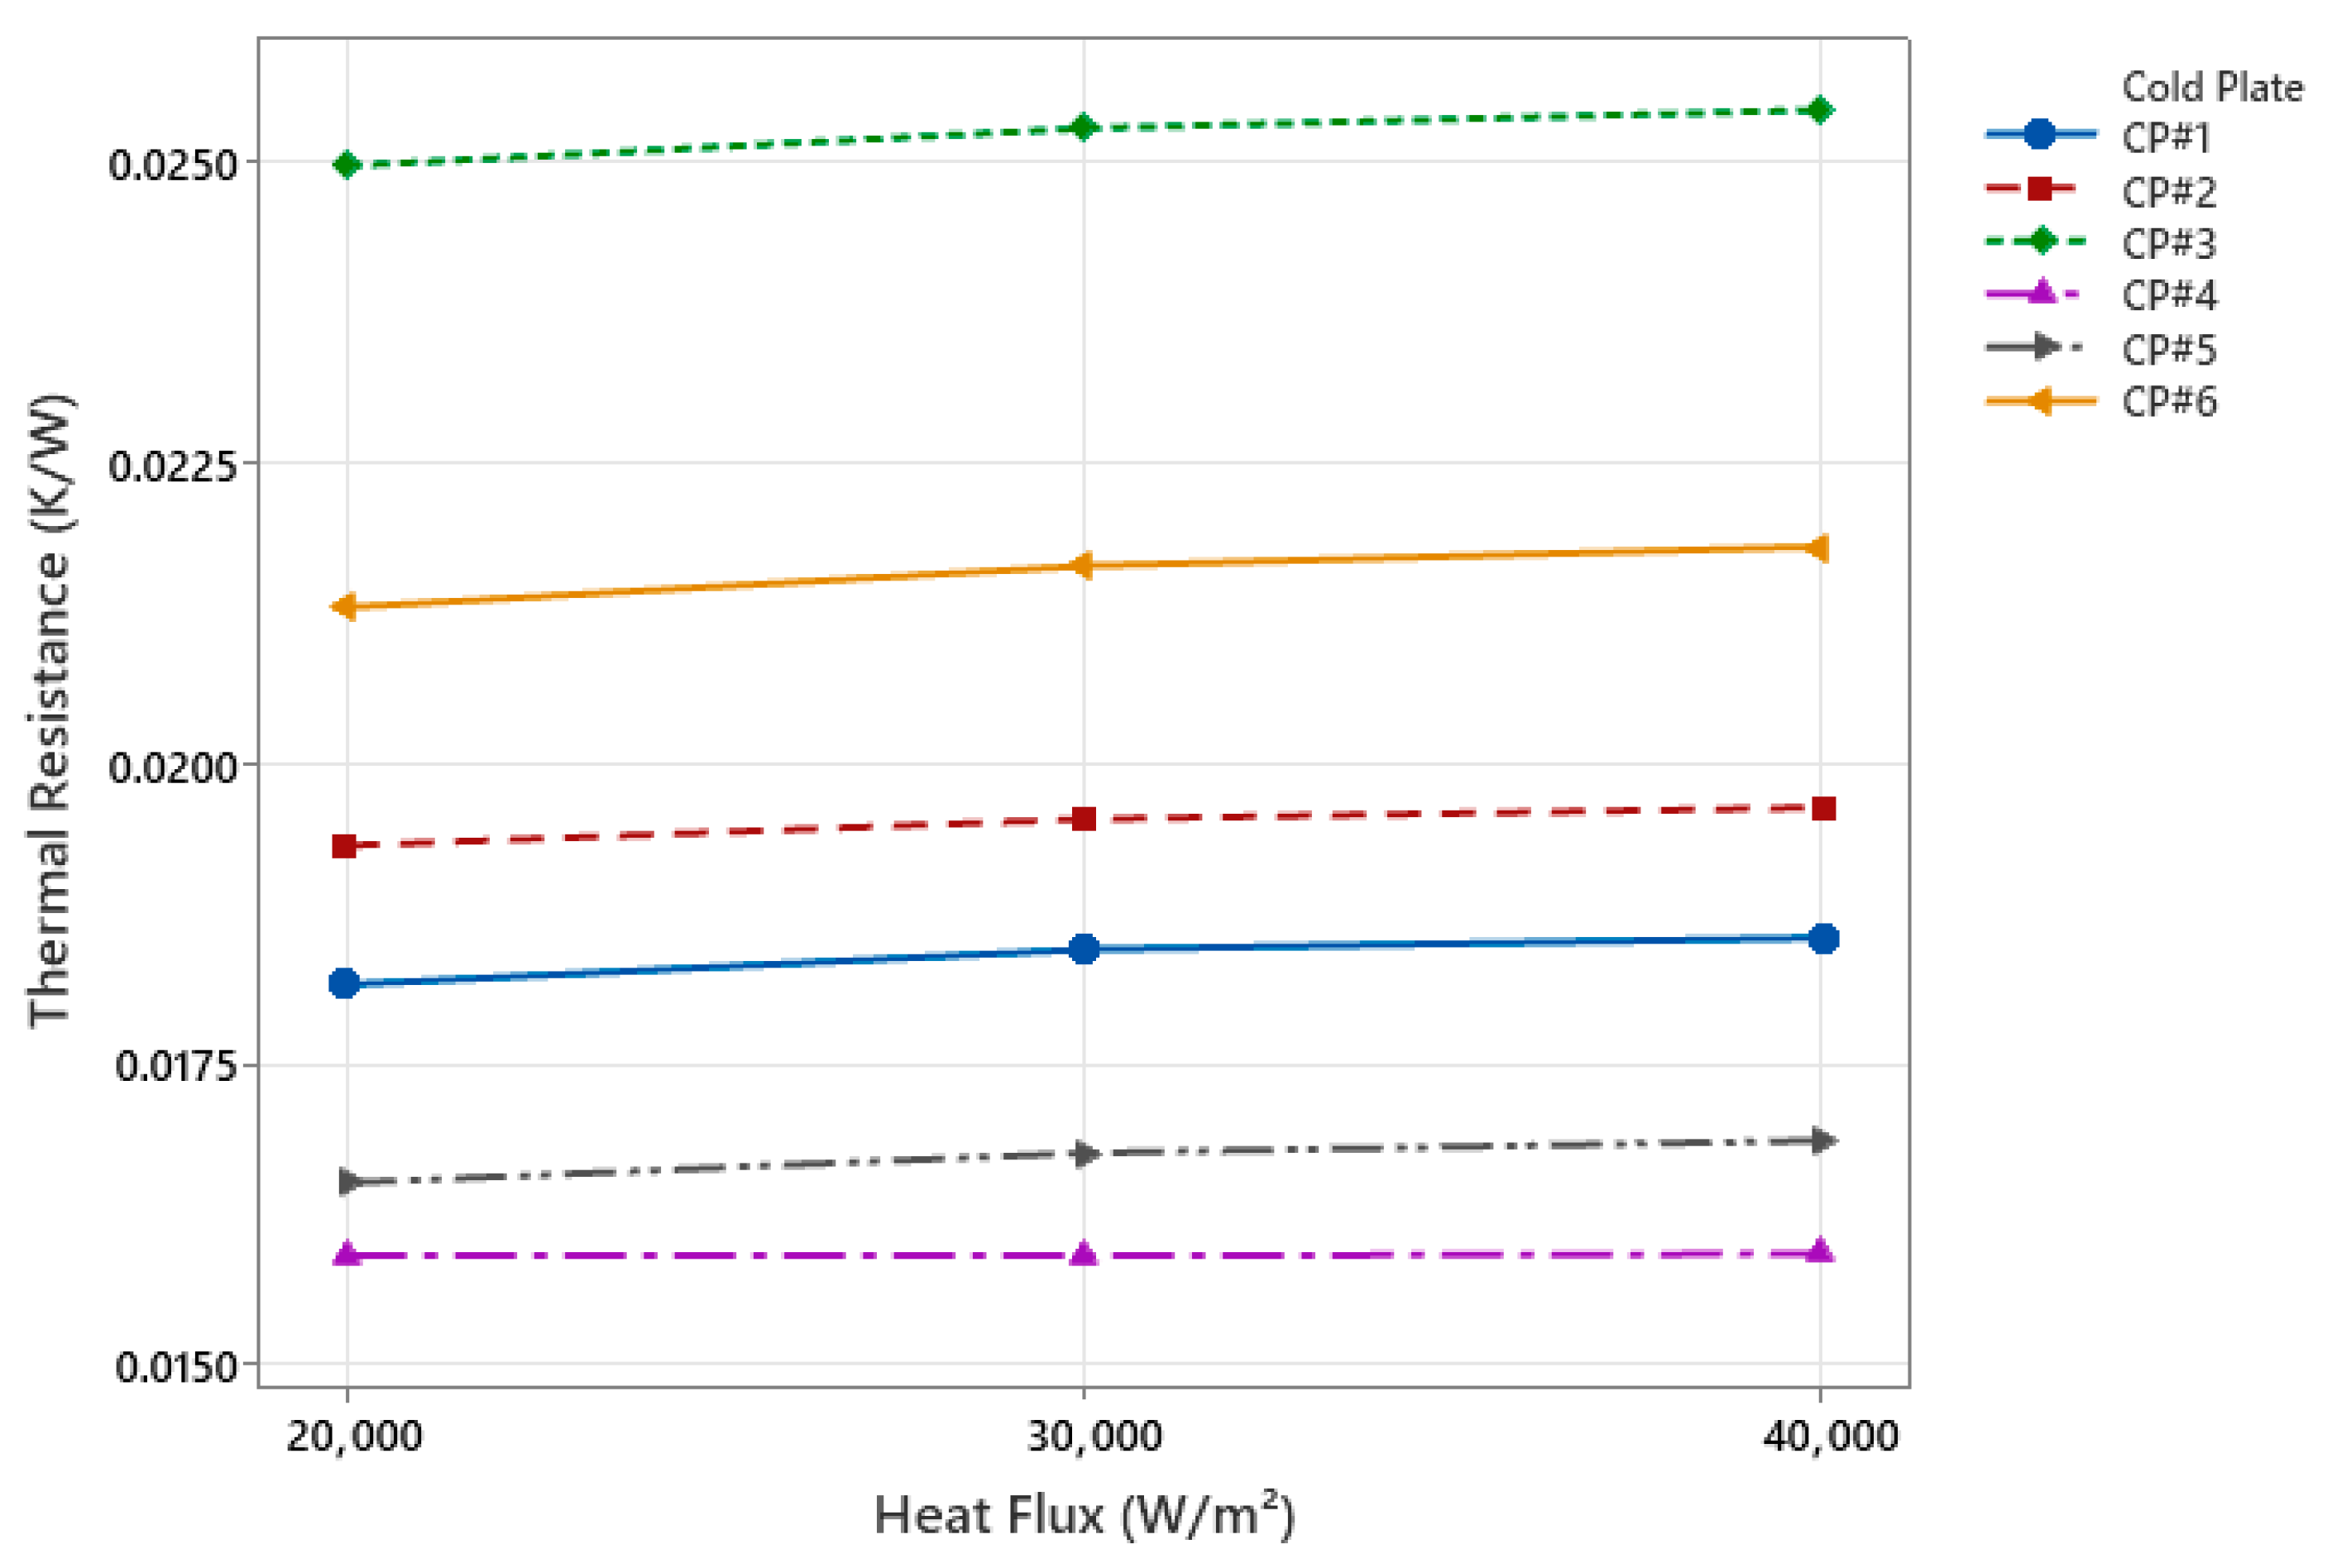
Figure 9 illustrates the variation in thermal resistance of six different cold plate designs as the heat flux increases. Thermal resistance is the ratio of the temperature difference across a surface to the rate of heat transfer. It shows how well heat is moving from the source to the cooling fluid. In Figure 9, lower thermal resistance values indicate that heat is transferred more efficiently, while higher values indicate that it is transferred less efficiently, requiring a larger temperature difference to remove the same amount of heat [57,58]. The results show that all designs exhibit a gradual increase in thermal resistance as the heat flux increases from 20,000 W/m2 to 40,000 W/m2. Across the entire heat flux range, CP#4 has the lowest thermal resistance value of all the designs, at about 0.0155 K/W. This means that the heat transfer is the most efficient. On the other hand, CP#3 has the highest thermal resistance value (approximately 0.0255 K/W), indicating that this design is more effective at retaining heat than the others.

3.3. Average Surface Temperature

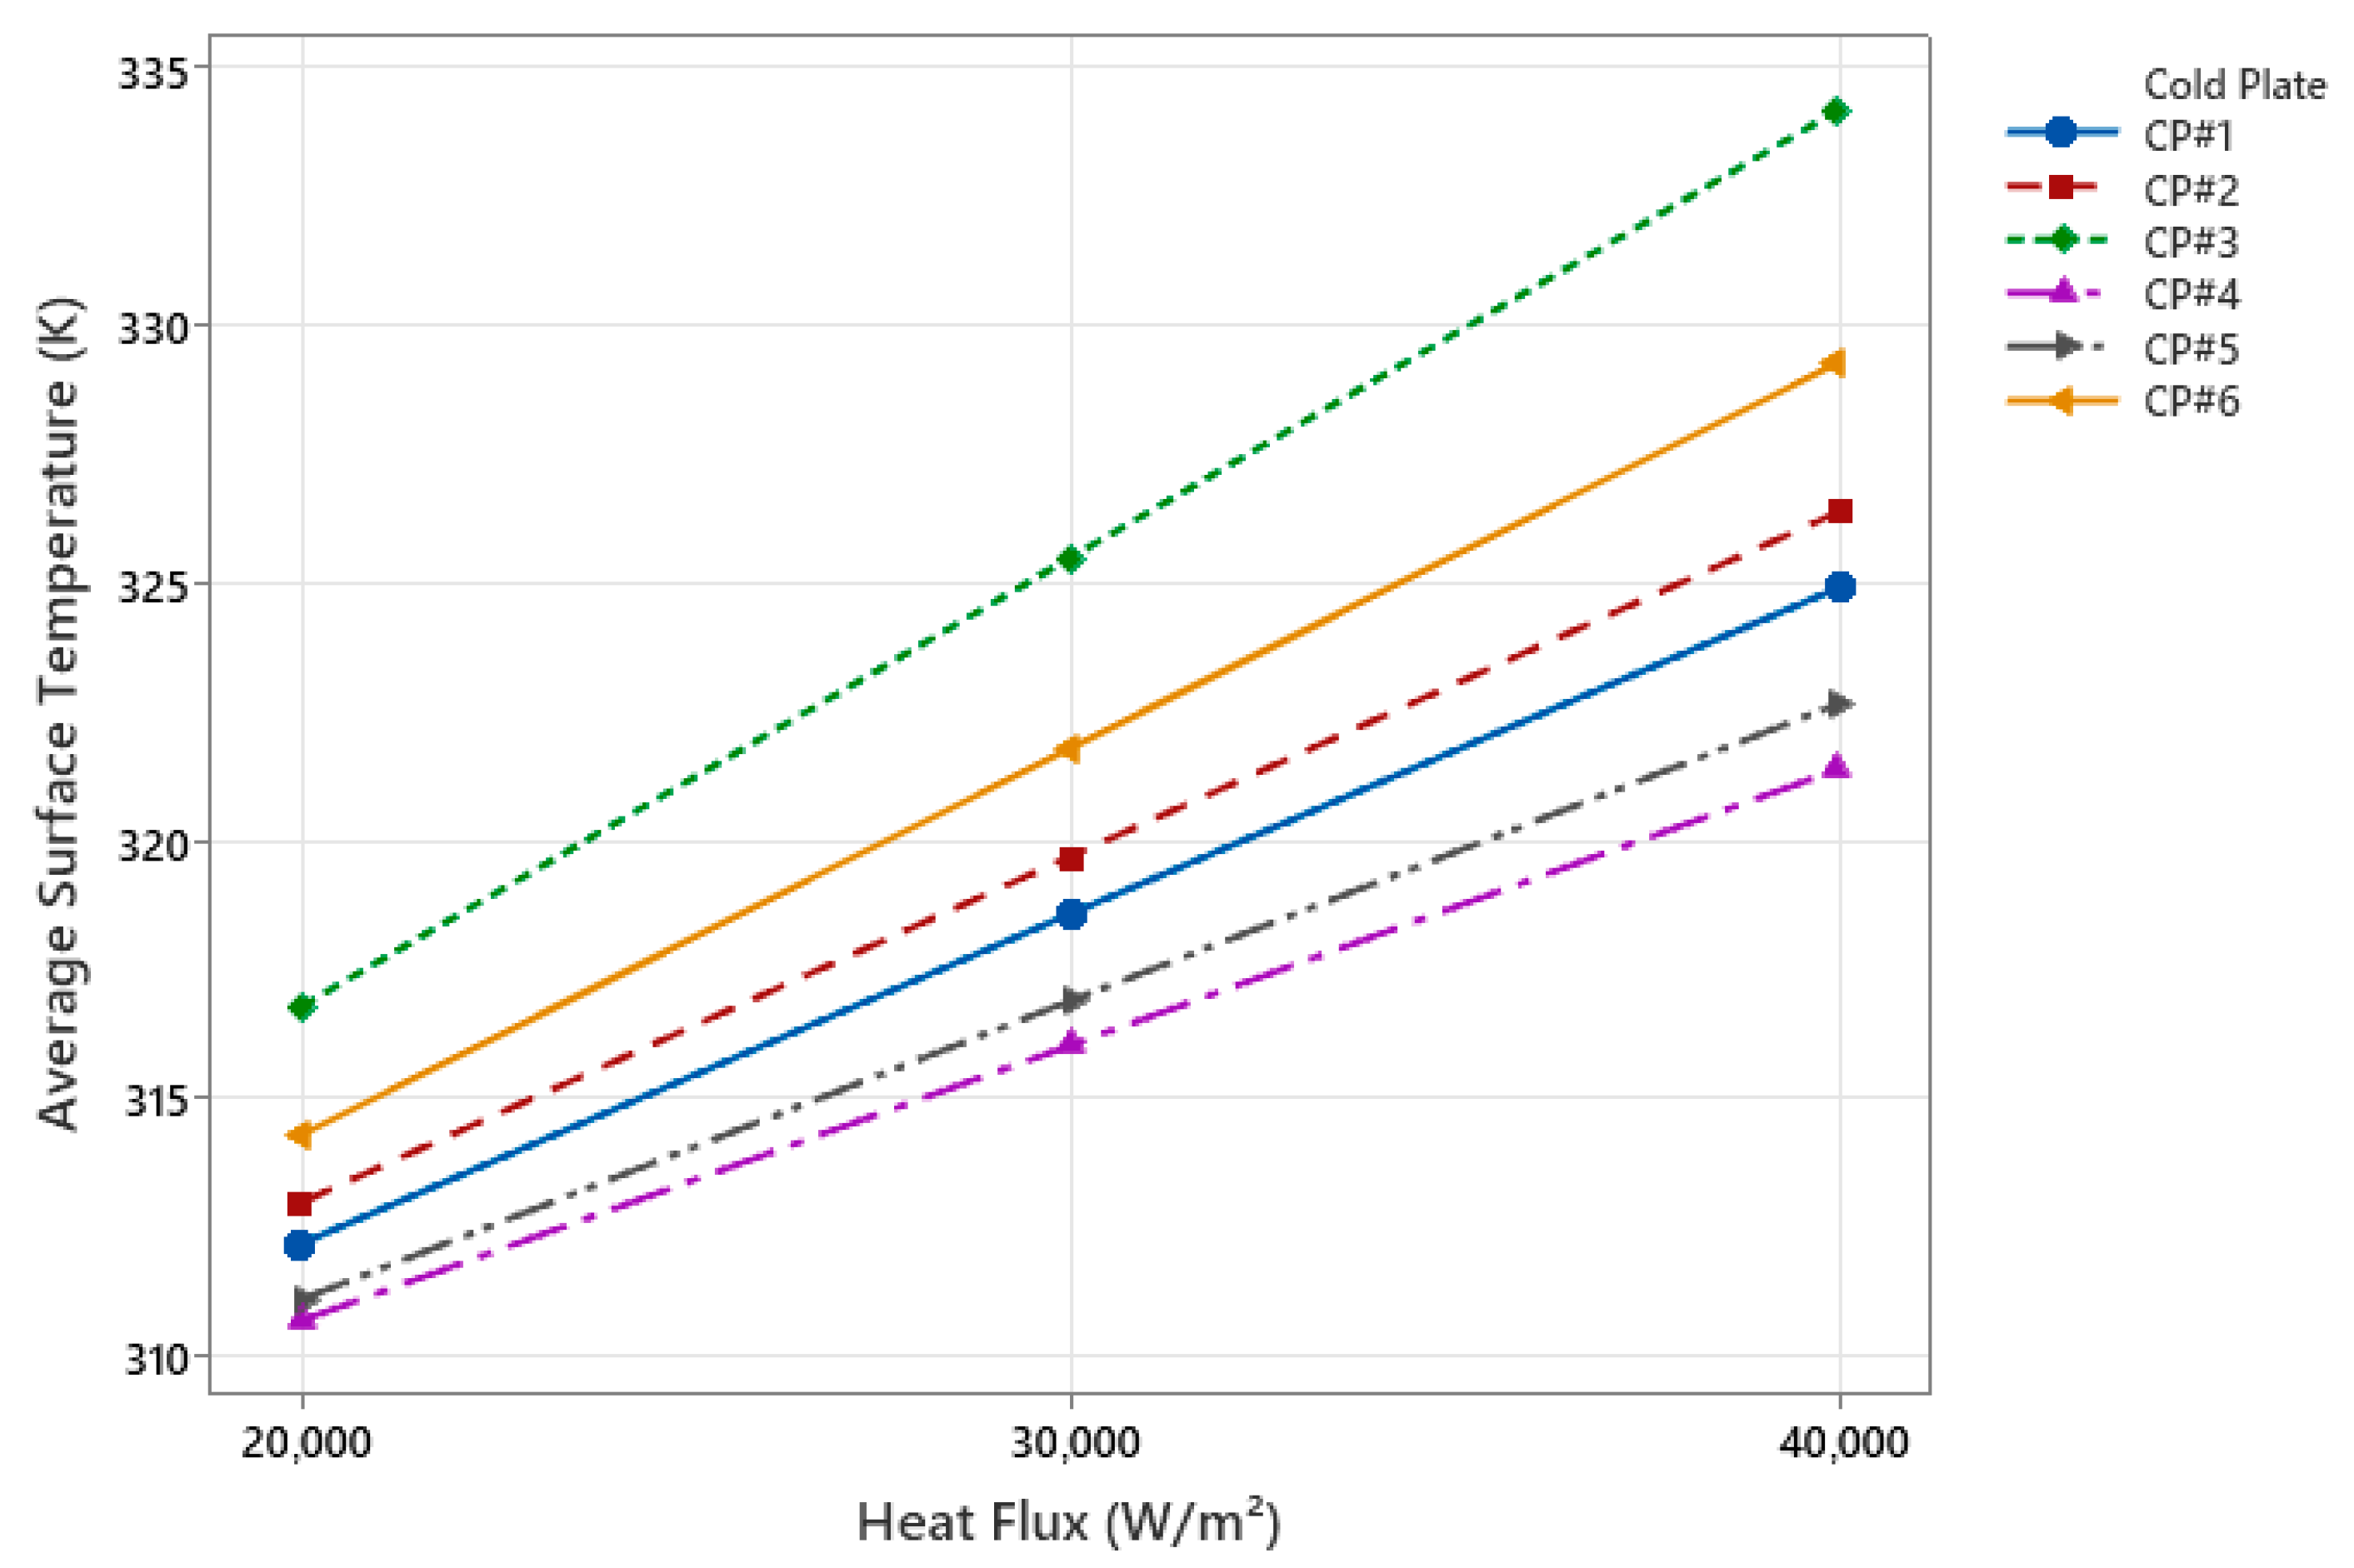
Figure 10 illustrates the variation in average surface temperature for six cold plate designs as the heat flux increases to 20,000 W/m2, 30,000 W/m2, and 40,000 W/m2. The average surface temperature refers to the average temperature on the plate surface that is directly in contact with the battery. This parameter is critical for evaluating cooling effectiveness because it indicates how well the cold plate keeps the battery within safe temperature limits. The results show that the average surface temperature increases in all designs as the heat flux rises. This is consistent with existing knowledge, which indicates that as heat load increases, so does the temperature gradient, as the system transfers heat less efficiently [58]. When the cold plate is subjected to a heat flux of 20,000 W/m2, all designs exhibit an average temperature range of 311 K to 317 K, with CP#4 displaying the lowest average temperature value and CP#3 showing the highest average temperature value. When given a heat flux of 40000 CP#4 remains consistent with the lowest average temperature value, and CP#3 remains consistent with the highest average temperature value. The difference in the average temperature of CP#4 and CP#3 when given a heat flux of 40,000 W/m2 is 3.8%.

3.4. Temperature Uniformity

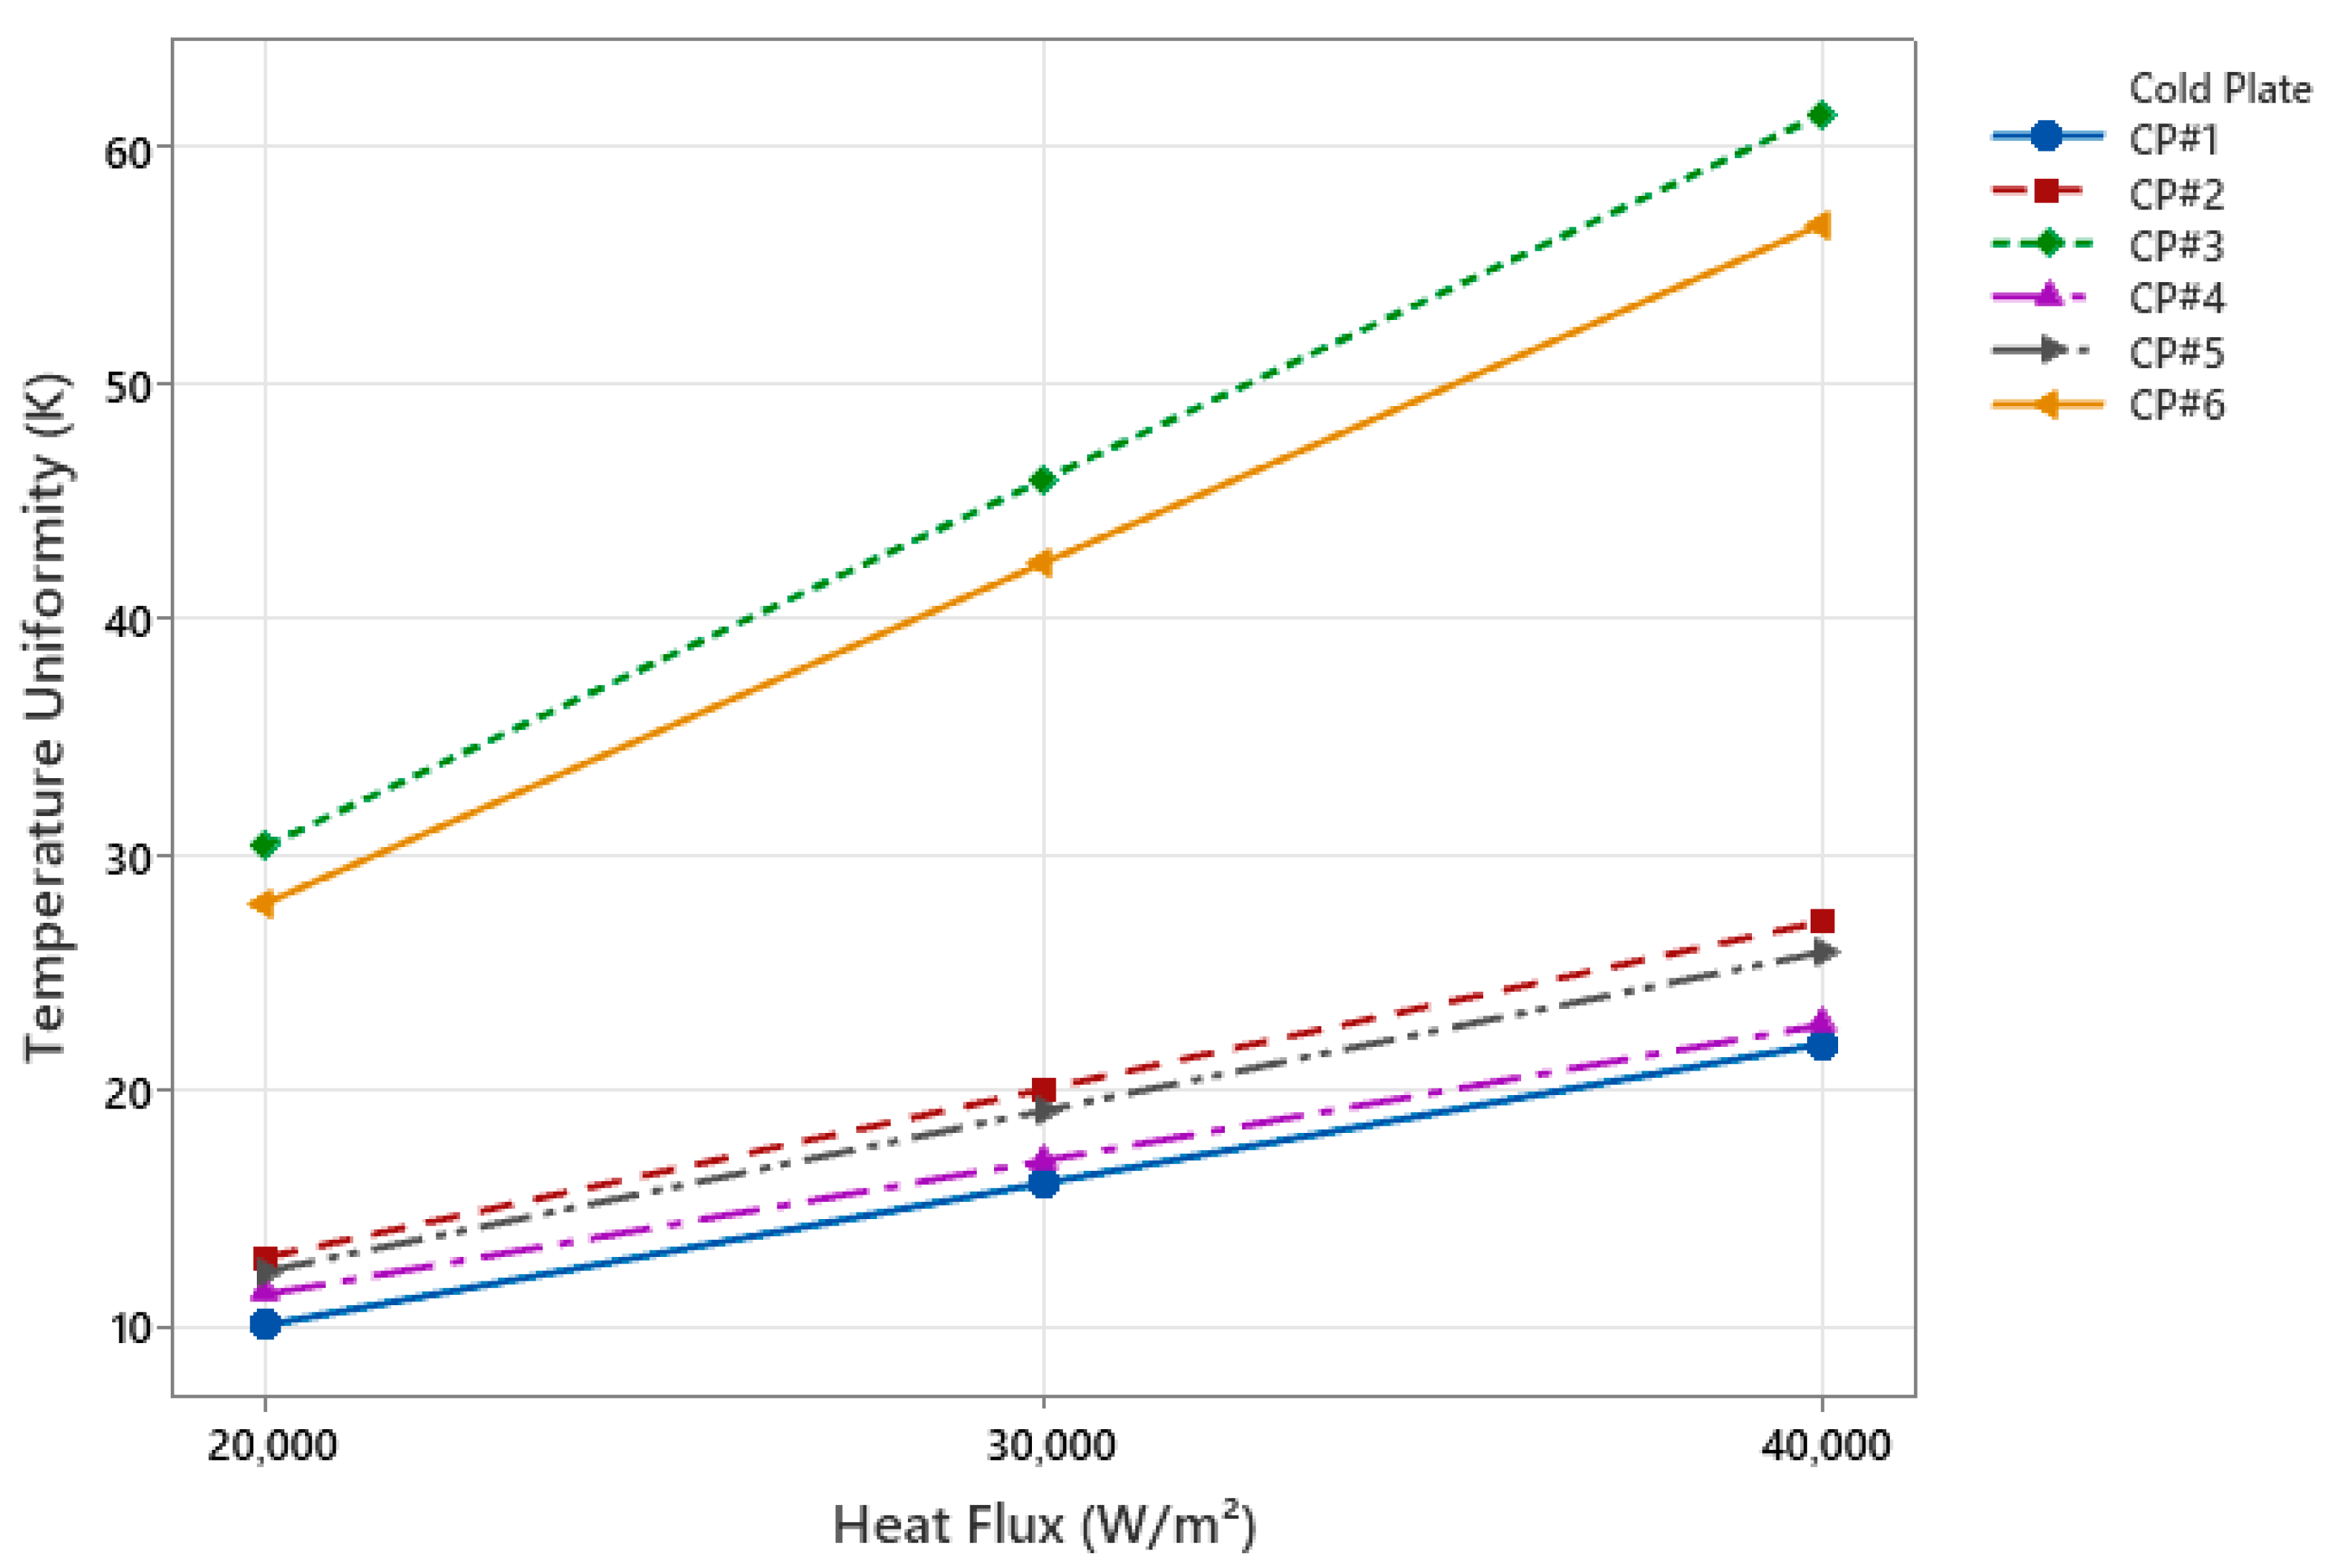
Temperature uniformity versus heat flux for six cold plate designs is shown in Figure 11. Temperature uniformity is defined as the temperature difference between the hottest and coldest regions on the cold plate surface in direct contact with the heat source. It provides an indication of how evenly heat is removed across the cooling interface. A smaller temperature uniformity value reflects a more uniform temperature distribution, which is highly desirable in applications such as electric vehicle (EV) batteries. Non-uniform temperatures between cells are known to accelerate degradation of the state of health (SOH), cause imbalances in state of charge (SOC), and, in severe cases, increase the risk of thermal runaway. Therefore, temperature uniformity is considered a more critical metric than average temperature in evaluating the performance of cold plates [33].
Figure 11 shows that all cold plate designs have nearly the same linear increase, indicating that effective thermal resistance remains relatively stable across the entire load range, as shown in Figure 9. The primary differences in performance are due to variations in flow distribution and channel geometry. Table 4 compares temperature uniformity values between configurations CP#1 and CP#4 at various heat flux levels, revealing that as heat flux increases, the difference in temperature uniformity performance between the two configurations decreases. Overall, the elliptical channel design with rectangular tubes (CP#5) demonstrated the best temperature uniformity values among all configurations tested in this study.

3.5. Temperature Uniformity Index

Figure 12 illustrates the temperature uniformity index (TUI) for six cold plate designs subjected to heat fluxes of 20,000 W/m2, 30,000 W/m2, and 40,000 W/m2. The TUI checks how evenly the temperature is distributed throughout the system. Values close to 1 indicate that the temperature is very even, while values close to 0 indicate that the temperature is very uneven [59]. Below is the formula for figuring out TUI:
T U I = T a v g T m i n T m a x T m i n  
Figure 12 shows that Cold Plate 1 (CP#1) achieves the highest Temperature Uniformity Index (TUI), whereas Cold Plate 6 (CP#6) records the lowest TUI. The Temperature Improvement Unit (TUI) for Cold Plate 4 (CP#4) is lower than that of CP#1, and the TIU for Cold Plate 5 (CP#5) is lower than that of CP#2. These results demonstrate that the circular tube channel configuration provides a more uniform temperature distribution than the square tube channel configuration. At a heat flux of 40,000 W/m2, the serpentine channel with eight U-turn circular tubes achieves a TUI value 13% higher than a cold plate with the same channel shape and a square tube. Likewise, the circular tube elliptical channel at the same heat flux achieves a TUI that is 16% higher than the square tube elliptical channel. The TUI of a square-section channel is lower than that of a circular-section channel because the sharp corners of the square cross-section induce stronger secondary flows, which enhance fluid mixing and heat transfer (reducing thermal resistance). However, these flows also create low-velocity zones at the corners, which can cause local heating and worsen temperature uniformity [60].

3.6. Pressure Contour

Figure 13 presents the pressure contours for six cold plate channel designs. Cold plates CP#1, CP#2, and CP#3 incorporate circular tubes and exhibit lower pressure drops than CP#4, CP#5, and CP#6, which utilize square tubes. CP#6 exhibits the highest pressure drop among all designs. Square channels increase flow resistance because their larger wetted perimeter, for a given cross-sectional area, reduces the hydraulic diameter and increases wall friction. The square geometry also promotes the formation of corner recirculation zones and causes earlier flow separation at bends. These effects result in a higher local loss coefficient compared to circular tubes [60]. These results highlight the trade-off between pressure loss and heat transfer enhancement. Square tubes, with a larger wetted perimeter, increase heat transfer but require more pump power. Circular tubes have less hydraulic resistance but lower heat transfer than square tubes.

3.7. Pressure Drop

Figure 14 illustrates the pressure drop experienced by six different channel shapes on the cold plate. The serpentine channel with more turns (eight U-turns) had a slightly higher pressure drop than the one with fewer turns (six U-turns): the circular tube with eight U-turns (CP#1) saw a 7.66% higher drop than its six U-turn version (CP#2), and the square tube with eight U-turns (CP#4) had a 4.89% higher drop than the six U-turn version (CP#5). Additionally, changing the channel type from a circular to a square tube resulted in a significantly greater pressure drop—19.93% higher for the eight U-turn case (CP#4 vs. CP#1) and 22.26% higher for the six U-turn case (CP#5 vs. CP#2).
Elliptical channels produced higher pressure drops than serpentine channels. The elliptical circular tube channel (CP#3) had a pressure drop 0.48% higher than the eight U-turn serpentine circular tube channel (CP#1) and 8.1% higher than the six U-turn serpentine circular tube channel (CP#2). The elliptical square tube channel (CP#6) had a pressure drop 3.3% higher than the eight U-turn serpentine square tube channel (CP#4) and 8% higher than the six U-turn serpentine square tube channel (CP#5). The elliptical square tube channel (CP#6) produced a pressure drop that was 22.2% higher than the elliptical circular tube channel (CP#3).

3.8. Velocity Contour

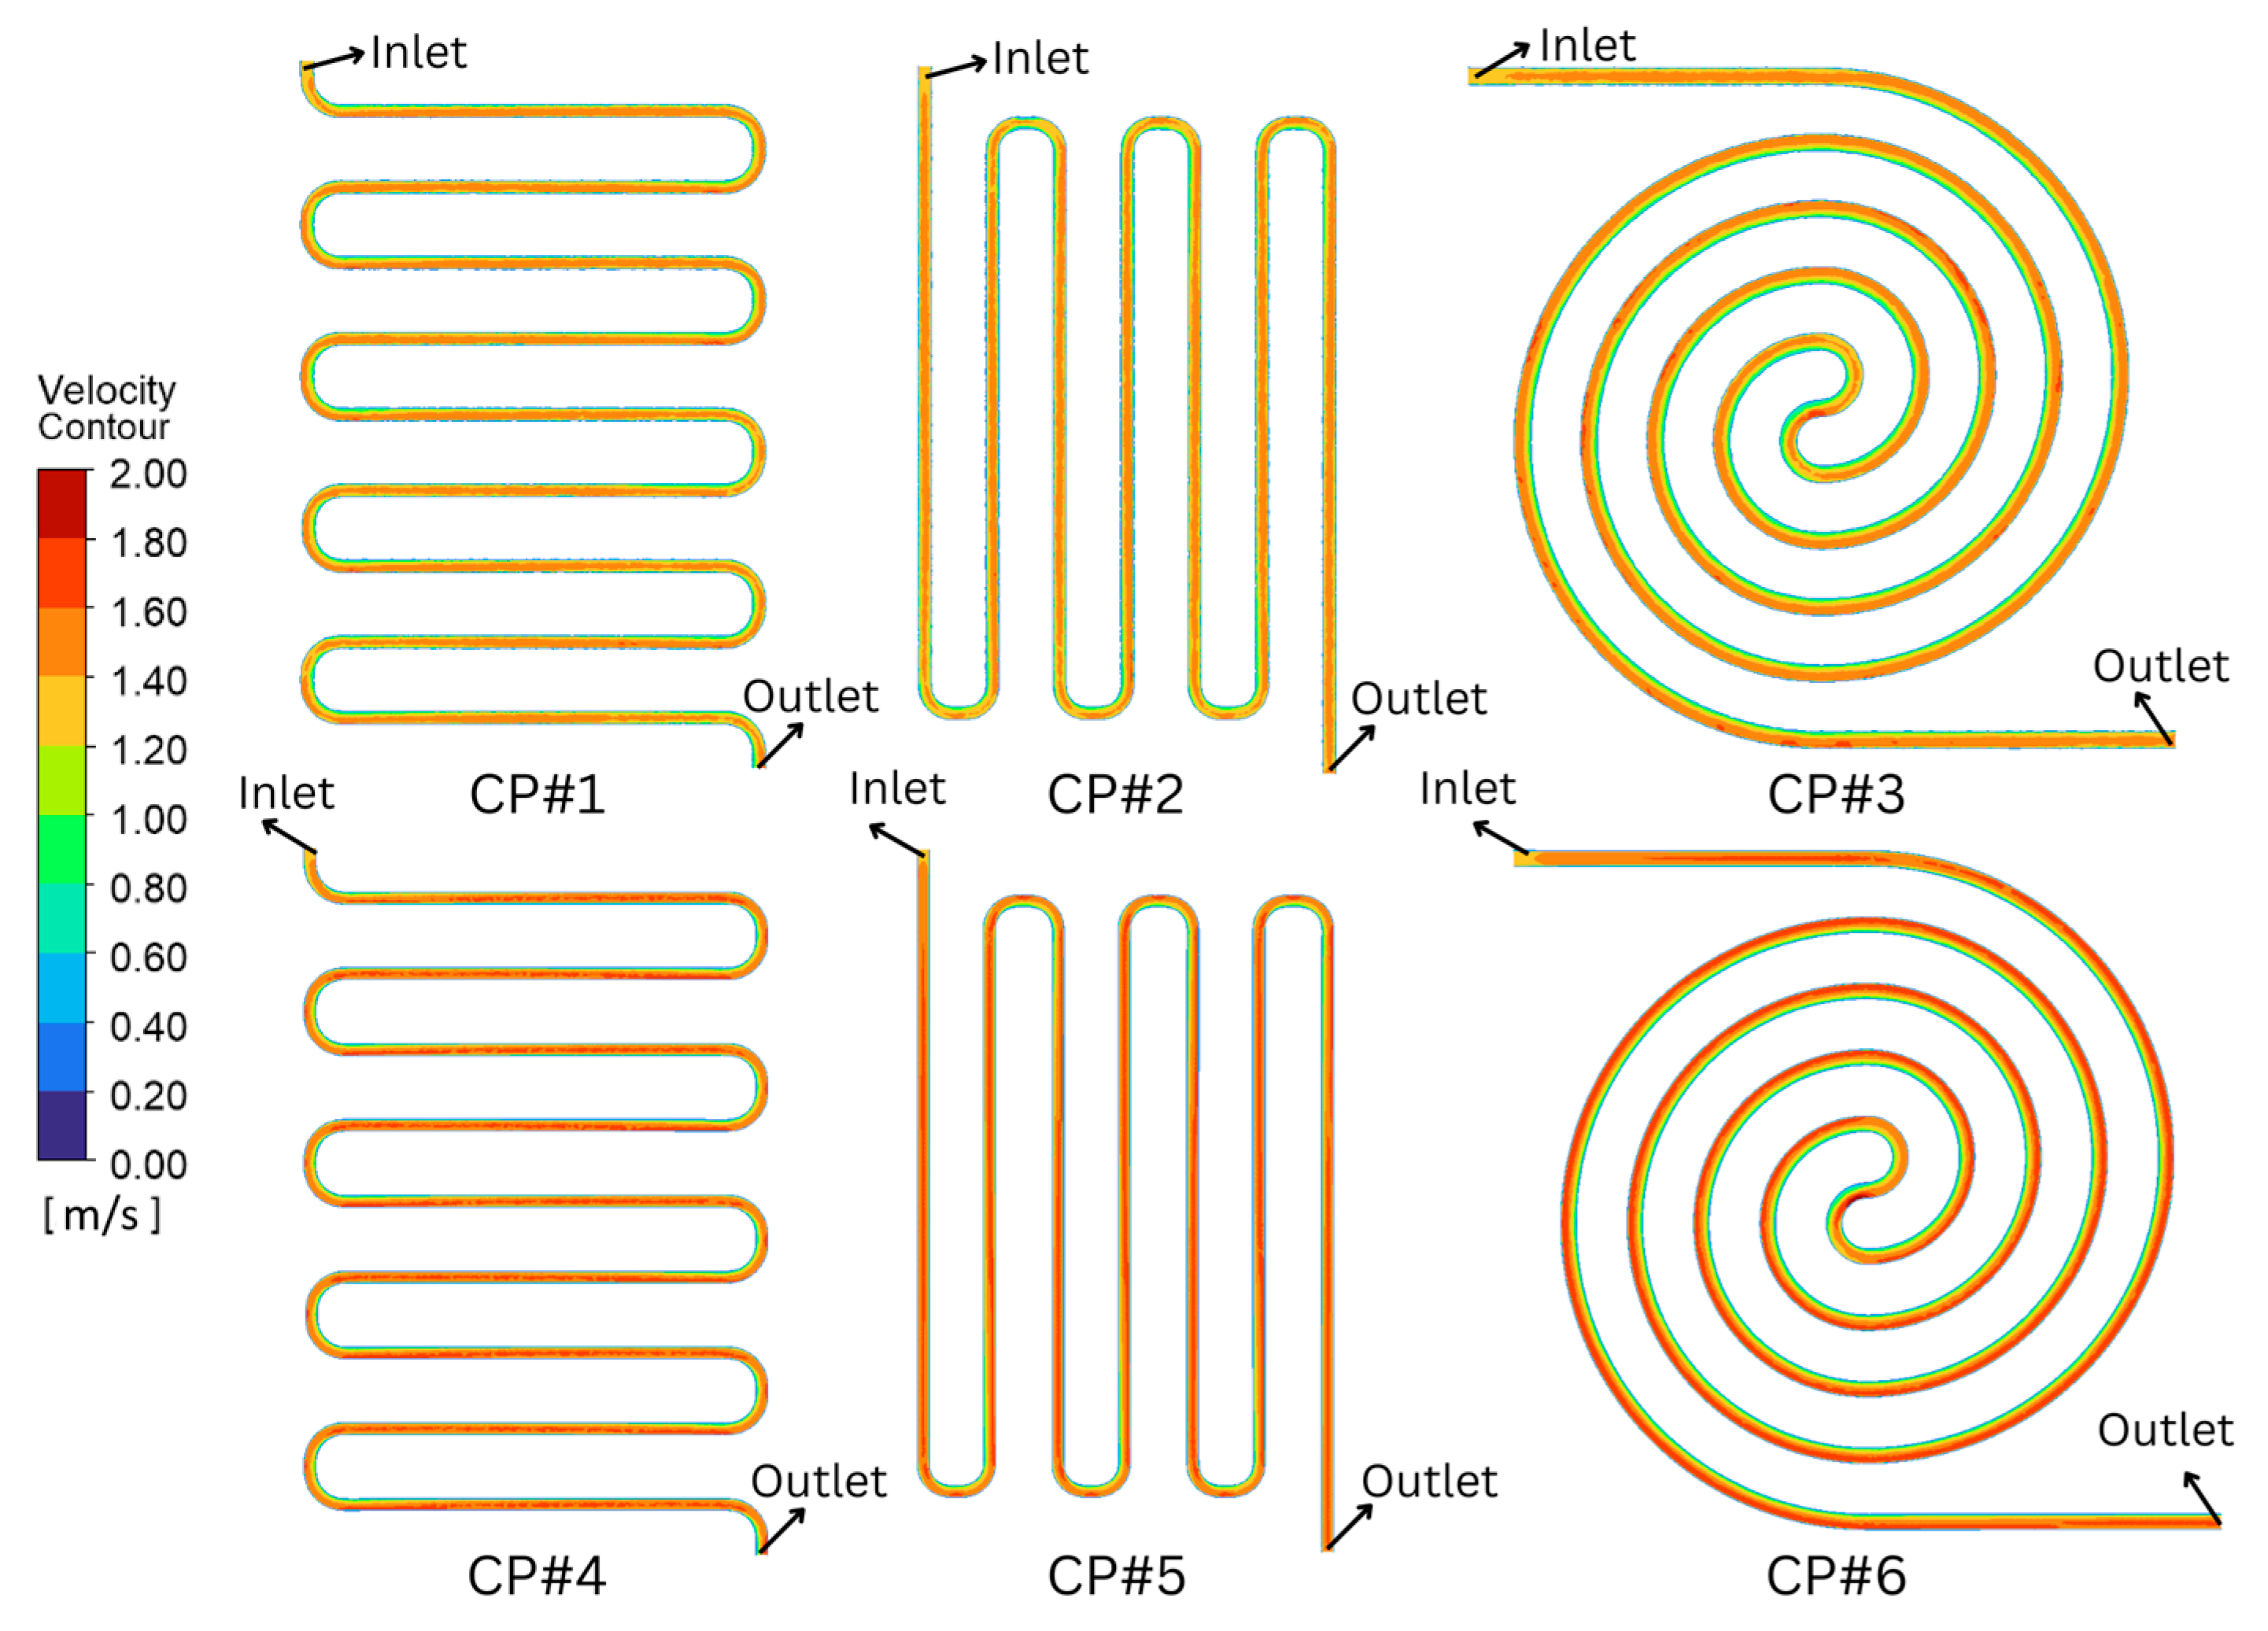
Figure 15 shows the variation in coolant velocity for both circular and square tube shapes. The circular tube designs (CP#1–CP#3) exhibit a more even flow along the channel walls, with fewer stagnation zones that help maintain steady flow and lower local thermal gradients. The square tube designs (CP#4–CP#6), on the other hand, show more variation in velocity, with areas of stagnation appearing at the corners of the channel. Even with these flow problems, the square tubes exhibit better thermal resistance performance as shown in Figure 9 because their larger surface area and longer coolant residence time enable them to absorb more heat, thereby lowering the overall average temperature. However, the Temperature Uniformity Index (TUI) indicates that the circular tubes exhibit better temperature uniformity across the cooling surface, as their smoother flow distribution reduces localized hotspots.
According to pressure drop analysis, square tube channels have more hydraulic resistance than circular tubes. The sharp corners of square tubes create a more turbulent flow of coolant, resulting in energy losses. Square tubes have lower thermal resistance and better cooling capacity, but they need more pumping power and do not spread the temperature evenly. On the other hand, circular tube designs cool more evenly and lose less pressure, but they do lose some of their ability to remove heat. For electric vehicle battery thermal management systems, the optimal cooling channel shape should be selected based on the most critical factors: thermal performance, temperature uniformity, and hydraulic efficiency.
Figure 16 provides an in-depth look at velocity contours at a U-turn of the CP#1 configuration, clarifying the physical mechanisms behind thermal and hydraulic performance in serpentine channels. As the fluid enters the bend, centrifugal force pushes higher-momentum flow toward the outer wall, creating a high-velocity zone. This steep velocity gradient thins the thermal boundary layer, which in turn increases the local heat transfer coefficient. Consequently, this phenomenon explains why adding more bends improves cooling effectiveness. At the inner wall of the bend, the flow slows sharply, forming a low-velocity zone, also known as a residence area. This deceleration zone, along with possible secondary flow separation, primarily causes form drag losses at each bend. The visible boundary layer along the wall illustrates how viscosity reduces the fluid velocity to zero, resulting in frictional losses along the channel. Together, these effects—increased heat transfer at the outer wall and pressure loss at the inner wall—explain the fundamental trade-off of serpentine design: more bends improve cooling, but also significantly raise total system pressure drop.

3.9. The Relationship Between Thermal Resistance and Pressure Drop

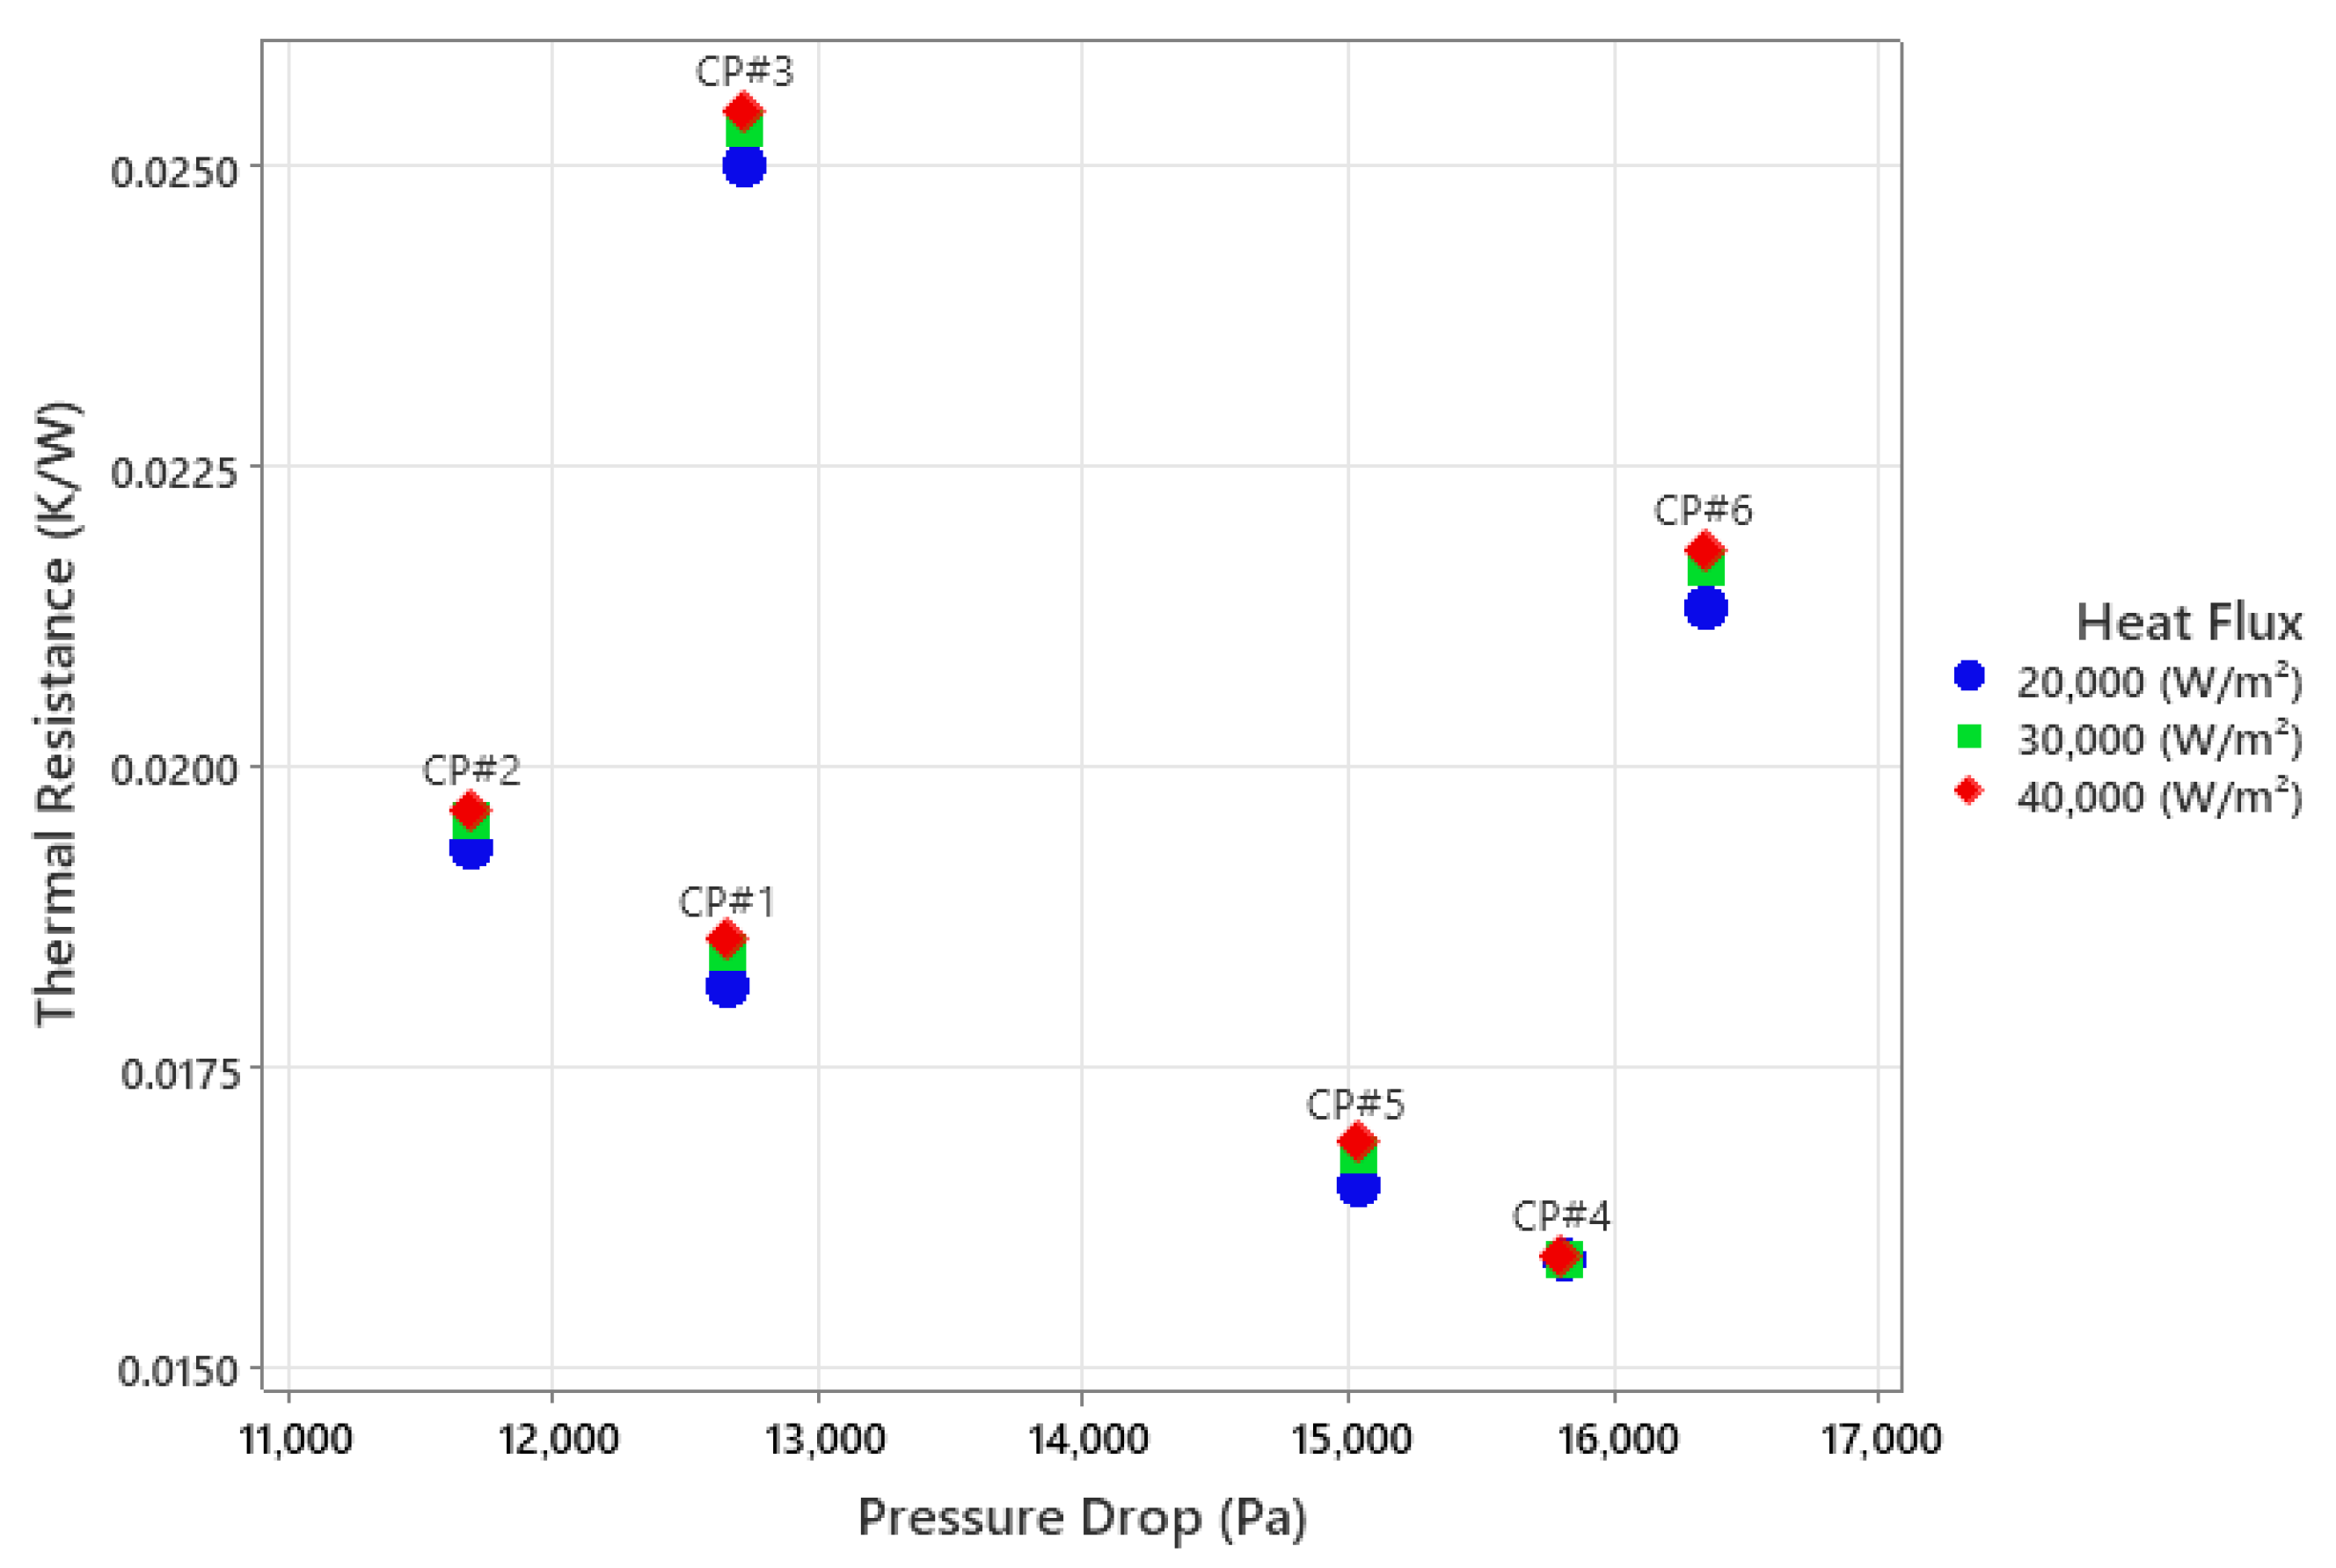
Figure 17 illustrates how thermal resistance varies with pressure drop for six cold plate designs (CP#1–CP#6) at three distinct heat fluxes (20,000, 30,000, and 40,000 W/m2). Measurement data indicate that thermal resistance remains largely unchanged with variations in heat flux for any design, with relative changes of less than 1.2%. This suggests that channel architecture and fluid dynamics primarily govern heat transfer in the studied range. Modifying the heat flux has a minimal effect on thermal efficiency. Pressure drop stability also remains within 0.2%, reflecting consistent flow behavior for each test condition. CP#4 delivers the best thermal performance, averaging only 0.01592 K/W thermal resistance, but has a high pressure drop (±15,867 Pa). Denser or more complex flow paths lower thermal resistance but cause higher pressure losses. At a medium pressure drop (±12,820 Pa), CP#3 shows the highest mean thermal resistance of 0.02513 K/W, indicating less effective heat transfer despite reduced pressure drop. CP#2 achieves the best balance, with a mean thermal resistance of 0.01940 K/W and the lowest pressure drop (±11,813 Pa). Its high performance ratio (1/(Rth·ΔP)) shows strong hydraulic efficiency without compromising cooling. These results indicate that selecting a cold plate requires striking a balance between low thermal resistance and acceptable system pressure loss. CP#4 gives the most cooling but needs higher pump power. If pump power is limited, CP#1 and CP#2 may be better choices.

3.10. The Relationship Between TUI and Pressure Drop

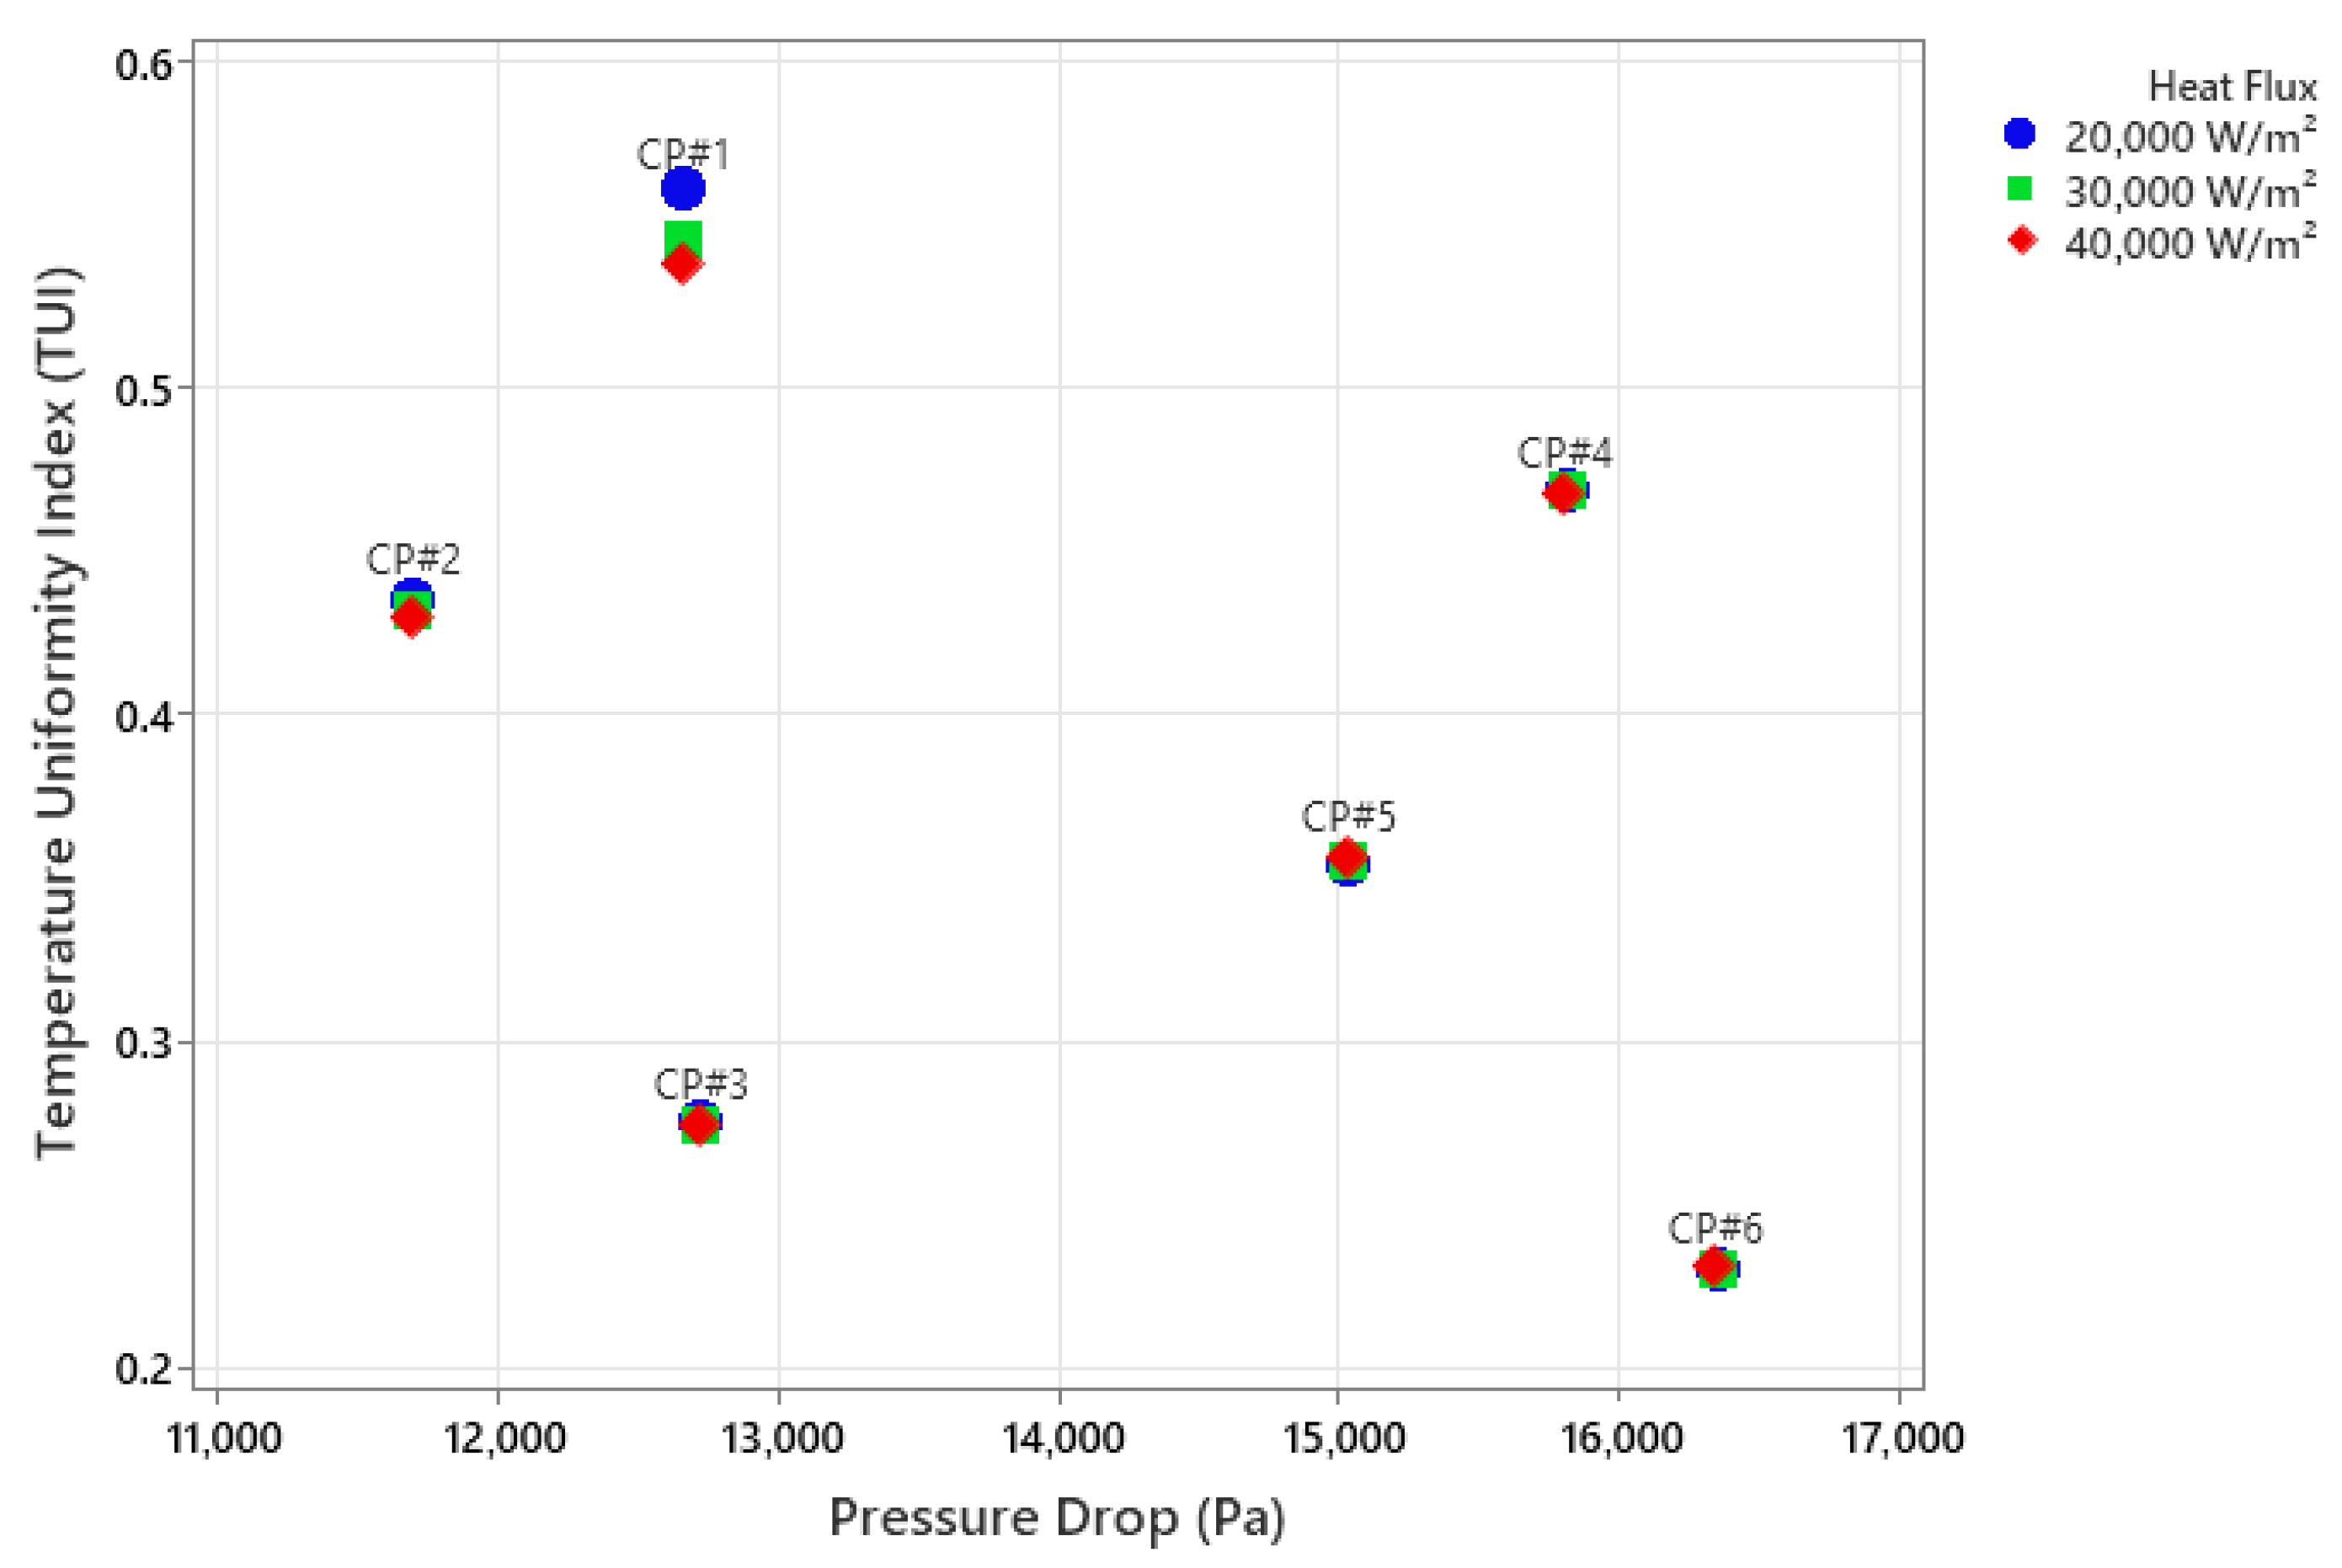
Figure 18 illustrates the relationship between the temperature uniformity index (TUI) and pressure drop for six cold plate designs at three heat flux levels: 20,000 W/m2, 30,000 W/m2, and 40,000 W/m2. The change in TUI values between heat fluxes is relatively small, indicating that the uniformity of temperature distribution on the cold plate is more influenced by the geometric configuration of the channel than the magnitude of the heat load. CP#1 shows the highest TUI with an average value of 0.55, with a pressure drop value of 12.6 kPa. This indicates that CP#1 has the most uniform temperature distribution among all designs. CP#4 ranks second with an average TUI of 0.47, while the pressure drop is relatively high at 15.9 kPa. CP#2 also exhibits quite good uniformity, with an average TUI value of 0.43 and a lowest pressure drop value of 11.6 kPa, making it worth considering if pump power is the primary consideration. Based on the data, the best candidates are CP#1 (highest uniformity with moderate ΔP), CP#2 (a compromise between uniformity and lowest ΔP), and CP#4 (high uniformity despite a relatively large ΔP). In contrast, CP#3, CP#5, and CP#6 are not recommended because they offer low uniformity with a ΔP that is not superior to that of other designs.

3.11. The Relationship Between TUI and Thermal Resistance

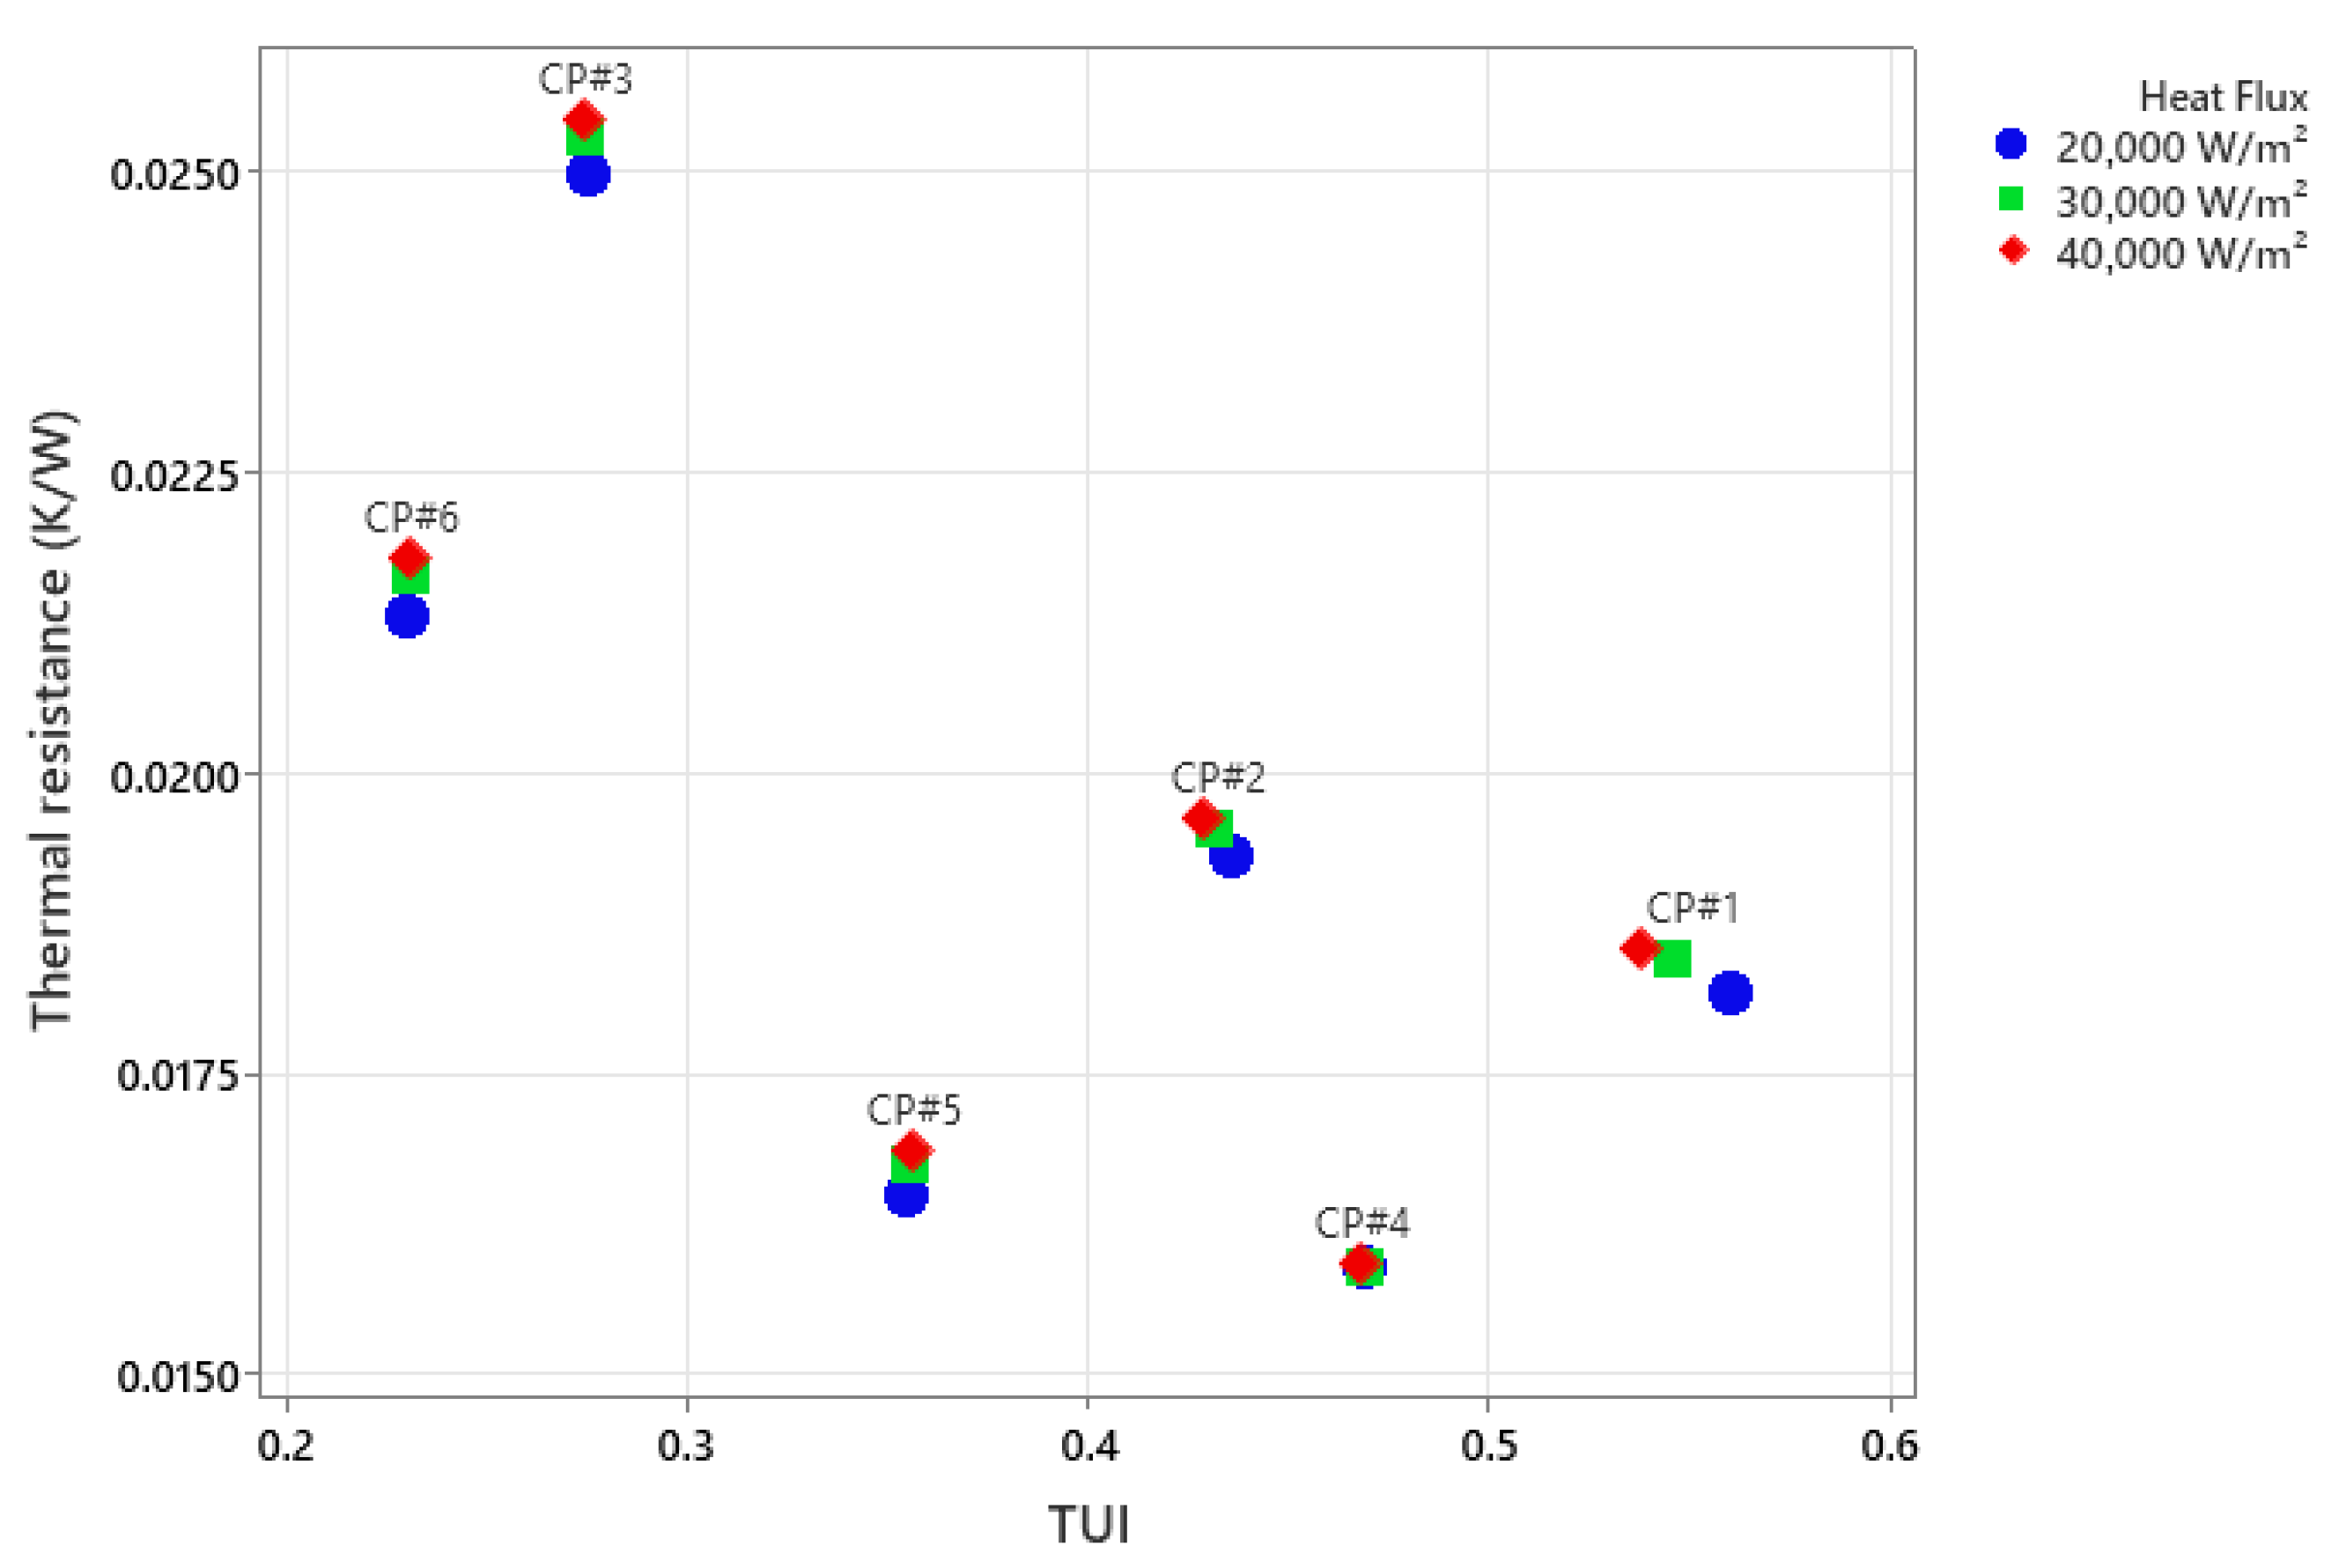
Figure 19 illustrates the relationship between TUI and thermal resistance for six cold plate channel designs at varying heat fluxes of 20,000, 30,000, and 40,000. Figure 19 shows that CP#4 exhibits the most superior performance, having the lowest thermal resistance among all designs, ranging from 0.016 to 0.0164 K/W, while maintaining a high TUI value of 0.45 to 0.47. Its position in the Lower right quadrant of the graph places it as a Prime candidate for the optimal design in this study that effectively balances both performance metrics of thermal resistance and TUI. CP#1 achieves the highest TUI among all designs, ranging from 0.53 to 0.55, but its thermal resistance value is relatively high (average 0.018 K/W) compared to CP#4 and CP#5. This suggests that the CP#1 design may be heavily focused on temperature uniformity, possibly at the expense of total heat transfer efficiency. CP#2 and CP#5 occupy intermediate performance positions. CP#2 has a higher TUI than CP#5, but also a higher thermal resistance. Meanwhile, CP#5 exhibits very low thermal resistance, almost as high as CP#4, but with a much lower TUI. CP#3 and CP#6 perform the worst overall. Both have high thermal resistance and very low TUI, placing them in the upper left quadrant of the graph. This design would not be effective in maintaining a low and uniform battery temperature.

3.12. Implications for BTMS Design Guidelines

This computational analysis reveals a trade-off between thermal performance, temperature uniformity, and hydraulic efficiency. No single design excels in all aspects, so the results are distilled into concise design guidelines to help engineers make application-specific choices. The key findings are provided in Table 5, the design guidance table, and Figure 20, the decision flow diagram. For maximum cooling, the decision flow diagram specifically suggests serpentine ducts with 8 U-turns and a square cross-section, while noting the high pressure drop as a drawback.

4. Conclusions

Computational fluid dynamics (CFD) was employed to evaluate six cold plate designs (CP#1–CP#6) for the thermal management of electric vehicle batteries under heat fluxes ranging from 20 to 40 kW/m2. CP#1 consists of a serpentine channel with eight U-turn circular tubes, while CP#2 contains six U-turn circular tubes. CP#3 integrates circular tubes within an elliptical channel. CP#4 utilizes a serpentine channel with eight U-turn square tubes, CP#5 features six U-turn square tubes, and CP#6 combines an elliptical channel with square tubes. All designs maintain a consistent cross-sectional area (12.566 mm2), channel length, and coolant volume (16.8 mL or 16,805 mm3). The inlet velocity and temperature are fixed at 1.3 m/s and 300 K, respectively. Performance was assessed using thermal resistance, temperature uniformity index (TUI), and pressure drop. CP#4 demonstrated the lowest thermal resistance (approximately 0.0159 K/W), indicating the highest heat dissipation efficiency. CP#1 achieved the highest temperature uniformity, with a TUI exceeding 0.53, which is essential for minimizing thermal gradients and preventing battery hotspots. CP#2 exhibited the lowest pressure drop (about 11.7 kPa), reflecting reduced pump power requirements. No single design outperformed others across all metrics. CP#4 and CP#5 achieved very low thermal resistance but resulted in higher pressure drops (15 to 16 kPa). CP#1 provided superior temperature uniformity with only a slight increase in thermal resistance. In contrast, CP#2 offered optimal hydraulic efficiency but suboptimal temperature uniformity. CP#4 is recommended for minimizing thermal resistance, while CP#1 is optimal for maximizing temperature uniformity. These improvements contribute to enhanced battery longevity and safety.

Author Contributions

Conceptualization, H.L.G. and M.H.A.; methodology, M.H.A.; software, M.T.S. and M.H.A.; validation, M.H.A., N.H.B. and H.L.G.; formal analysis, N.N.; investigation, M.H.A.; resources, N.H.B.; data curation, Y.Y.; writing—original draft preparation, M.H.A.; writing—review and editing, M.T.S.; visualization, Y.Y.; supervision, M.H.A.; project administration, N.N.; funding acquisition, N.H.B. All authors have read and agreed to the published version of the manuscript.

Funding

This research was funded by Direktorat Penelitian dan Pengabdian kepada Masyarakat, Direktorat Jenderal Riset dan Pengembangan Kementerian Pendidikan Tinggi, Sains, dan Teknologi: 028/C3/DT.05.00/PL/2025, dated 28 May 2025.

Data Availability Statement

The datasets generated and analyzed for this study can be found in the Zenodo repository at https://doi.org/10.5281/zenodo.17076799 [61].

Conflicts of Interest

The authors declare no conflicts of interest.

References

  1. Liu, H.; Yu, S.; Wang, T.; Li, J.; Wang, Y. A systematic review on sustainability assessment of internal combustion engines. J. Clean. Prod. 2024, 451, 141996. [Google Scholar] [CrossRef]
  2. Zimm, C. Improving the understanding of electric vehicle technology and policy diffusion across countries. Transp. Policy 2021, 105, 54–66. [Google Scholar] [CrossRef]
  3. Jiang, F.; Yuan, X.; Hu, L.; Xie, G.; Zhang, Z.; Li, X.; Hu, J.; Wang, C.; Wang, H. A comprehensive review of energy storage technology development and application for pure electric vehicles. J. Energy Storage 2024, 86, 111159. [Google Scholar] [CrossRef]
  4. Lipu, M.S.; Mamun, A.A.; Ansari, S.; Miah, M.S.; Hasan, K.; Meraj, S.T.; Abdolrasol, M.G.M.; Rahman, T.; Maruf, M.H.; Sarker, M.R.; et al. Battery Management, Key Technologies, Methods, Issues, and Future Trends of Electric Vehicles: A Pathway toward Achieving Sustainable Development Goals. Batteries 2022, 8, 119. [Google Scholar] [CrossRef]
  5. Koroma, M.S.; Costa, D.; Philippot, M.; Cardellini, G.; Hosen, M.S.; Coosemans, T.; Messagie, M. Life cycle assessment of battery electric vehicles: Implications of future electricity mix and different battery end-of-life management. Sci. Total Environ. 2022, 831, 154859. [Google Scholar] [CrossRef] [PubMed]
  6. Zhou, Z.; Lv, Y.; Qu, J.; Sun, Q.; Grachev, D. Performance evaluation of hybrid oscillating heat pipe with carbon nanotube nanofluids for electric vehicle battery cooling. Appl. Therm. Eng. 2021, 196, 117300. [Google Scholar] [CrossRef]
  7. Afzal, A.; Mohammed Samee, A.D.; Abdul Razak, R.K.; Ramis, M.K. Thermal management of modern electric vehicle battery systems (MEVBS). J. Therm. Anal. Calorim. 2021, 144, 1271–1285. [Google Scholar] [CrossRef]
  8. Senol, M.; Bayram, I.S.; Naderi, Y.; Galloway, S. Electric Vehicles Under Low Temperatures: A Review on Battery Performance, Charging Needs, and Power Grid Impacts. IEEE Access 2023, 11, 39879–39912. [Google Scholar] [CrossRef]
  9. Kang, J.; Rizzoni, G. Study of relationship between temperature and thermal energy, operating conditions as well as environmental factors in large-scale lithium-ion batteries. Int. J. Energy Res. 2014, 38, 1994–2002. [Google Scholar] [CrossRef]
  10. Feng, X.; Xu, C.; He, X.; Wang, L.; Zhang, G.; Ouyang, M. Mechanisms for the evolution of cell variations within a LiNixCoyMnzO2/graphite lithium-ion battery pack caused by temperature non-uniformity. J. Clean. Prod. 2018, 205, 447–462. [Google Scholar] [CrossRef]
  11. Khan, M.R.; Swierczynski, M.J.; Kær, S.K. Towards an Ultimate Battery Thermal Management System: A Review. Batteries 2017, 3, 9. [Google Scholar] [CrossRef]
  12. Pesaran, A.A. Battery thermal models for hybrid vehicle simulations. J. Power Sources 2002, 110, 377–382. [Google Scholar] [CrossRef]
  13. Chen, S.; Wei, X.; Zhang, G.; Wang, X.; Zhu, J.; Feng, X.; Dai, H.; Ouyang, M. All-temperature area battery application mechanism, performance, and strategies. Innovation 2023, 4, 100465. [Google Scholar] [CrossRef]
  14. Buidin, T.I.; Mariasiu, F. Battery Thermal Management Systems: Current Status and Design Approach of Cooling Technologies. Energies 2021, 14, 4879. [Google Scholar] [CrossRef]
  15. Olabi, A.G.; Maghrabie, H.M.; Adhari, O.H.K.; Sayed, E.T.; Yousef, B.A.A.; Salameh, T.; Kamil, M.; Abdelkareem, M.A. Battery thermal management systems: Recent progress and challenges. Int. J. Thermofluids 2022, 15, 100171. [Google Scholar] [CrossRef]
  16. Akbarzadeh, M.; Kalogiannis, T.; Jaguemont, J.; Jin, L.; Behi, H.; Karimi, D.; Beheshti, H.; Van Mierlo, J.; Berecibar, M. A comparative study between air cooling and liquid cooling thermal management systems for a high-energy lithium-ion battery module. Appl. Therm. Eng. 2021, 198, 117503. [Google Scholar] [CrossRef]
  17. Deng, Y.; Feng, C.; E, J.; Zhu, H.; Chen, J.; Wen, M.; Yin, H. Effects of different coolants and cooling strategies on the cooling performance of the power lithium ion battery system: A review. Appl. Therm. Eng. 2018, 142, 10–29. [Google Scholar] [CrossRef]
  18. Arora, S. Selection of thermal management system for modular battery packs of electric vehicles: A review of existing and emerging technologies. J. Power Sources 2018, 400, 621–640. [Google Scholar] [CrossRef]
  19. Behi, H.; Behi, M.; Karimi, D.; Jaguemont, J.; Ghanbarpour, M.; Behnia, M.; Berecibar, M.; Van Mierlo, J. Heat pipe air-cooled thermal management system for lithium-ion batteries: High power applications. Appl. Therm. Eng. 2021, 183, 116240. [Google Scholar] [CrossRef]
  20. Behi, H.; Karimi, D.; Behi, M.; Ghanbarpour, M.; Jaguemont, J.; Sokkeh, M.A.; Gandoman, F.H.; Berecibar, M.; Van Mierlo, J. A new concept of thermal management system in Li-ion battery using air cooling and heat pipe for electric vehicles. Appl. Therm. Eng. 2020, 174, 115280. [Google Scholar] [CrossRef]
  21. Shahjalal, M.; Shams, T.; Islam, M.E.; Alam, W.; Modak, M.; Hossain, S.B.; Ramadesigan, V.; Ahmed, M.R.; Ahmed, H.; Iqbal, A. A review of thermal management for Li-ion batteries: Prospects, challenges, and issues. J. Energy Storage 2021, 39, 102518. [Google Scholar] [CrossRef]
  22. Lu, M.; Zhang, X.; Ji, J.; Xu, X.; Zhang, Y. Research progress on power battery cooling technology for electric vehicles. J. Energy Storage 2020, 27, 101155. [Google Scholar] [CrossRef]
  23. Al-Zareer, M.; Dincer, I.; Rosen, M.A. Novel thermal management system using boiling cooling for high-powered lithium-ion battery packs for hybrid electric vehicles. J. Power Sources 2017, 363, 291–303. [Google Scholar] [CrossRef]
  24. Jaguemont, J.; Van Mierlo, J. A comprehensive review of future thermal management systems for battery-electrified vehicles. J. Energy Storage 2020, 31, 101551. [Google Scholar] [CrossRef]
  25. Kumar Thakur, A.; Sathyamurthy, R.; Velraj, R.; Saidur, R.; Pandey, A.K.; Ma, Z.; Singh, P.; Hazra, S.K.; Wafa Sharshir, S.; Prabakaran, R.; et al. A state-of-the art review on advancing battery thermal management systems for fast-charging. Appl. Therm. Eng. 2023, 226, 120303. [Google Scholar] [CrossRef]
  26. Zhao, G.; Wang, X.; Negnevitsky, M.; Li, C. An up-to-date review on the design improvement and optimization of the liquid-cooling battery thermal management system for electric vehicles. Appl. Therm. Eng. 2023, 219, 119626. [Google Scholar] [CrossRef]
  27. Li, W.; Garg, A.; Xiao, M.; Gao, L. Optimization for Liquid Cooling Cylindrical Battery Thermal Management System Based on Gaussian Process Model. J. Therm. Sci. Eng. Appl. 2020, 13, 021015. [Google Scholar] [CrossRef]
  28. Xu, Y.; Li, X.; Liu, X.; Wang, Y.; Wu, X.; Zhou, D. Experiment investigation on a novel composite silica gel plate coupled with liquid-cooling system for square battery thermal management. Appl. Therm. Eng. 2021, 184, 116217. [Google Scholar] [CrossRef]
  29. Jarrett, A.; Kim, I.Y. Influence of operating conditions on the optimum design of electric vehicle battery cooling plates. J. Power Sources 2014, 245, 644–655. [Google Scholar] [CrossRef]
  30. Monika, K.; Chakraborty, C.; Roy, S.; Dinda, S.; Singh, S.A.; Datta, S.P. An improved mini-channel based liquid cooling strategy of prismatic LiFePO4 batteries for electric or hybrid vehicles. J. Energy Storage 2021, 35, 102301. [Google Scholar] [CrossRef]
  31. Mousavi, S.; Siavashi, M.; Zadehkabir, A. A new design for hybrid cooling of Li-ion battery pack utilizing PCM and mini channel cold plates. Appl. Therm. Eng. 2021, 197, 117398. [Google Scholar] [CrossRef]
  32. Sheng, L.; Su, L.; Zhang, H.; Li, K.; Fang, Y.; Ye, W.; Fang, Y. Numerical investigation on a lithium ion battery thermal management utilizing a serpentine-channel liquid cooling plate exchanger. Int. J. Heat Mass Transf. 2019, 141, 658–668. [Google Scholar] [CrossRef]
  33. Patil, M.S.; Seo, J.-H.; Panchal, S.; Jee, S.-W.; Lee, M.-Y. Investigation on thermal performance of water-cooled Li-ion pouch cell and pack at high discharge rate with U-turn type microchannel cold plate. Int. J. Heat Mass Transf. 2020, 155, 119728. [Google Scholar] [CrossRef]
  34. Li, X.; Zhao, J.; Duan, J.; Panchal, S.; Yuan, J.; Fraser, R.; Fowler, M.; Chen, M. Simulation of cooling plate effect on a battery module with different channel arrangement. J. Energy Storage 2022, 49, 104113. [Google Scholar] [CrossRef]
  35. Wang, N.; Li, C.; Li, W.; Chen, X.; Li, Y.; Qi, D. Heat dissipation optimization for a serpentine liquid cooling battery thermal management system: An application of surrogate assisted approach. J. Energy Storage 2021, 40, 102771. [Google Scholar] [CrossRef]
  36. Mousavi, S.; Zadehkabir, A.; Siavashi, M.; Yang, X. An improved hybrid thermal management system for prismatic Li-ion batteries integrated with mini-channel and phase change materials. Appl. Energy 2023, 334, 120643. [Google Scholar] [CrossRef]
  37. Wang, Y.; Gao, T.; Zhou, L.; Gong, J.; Li, J. A parametric study of a hybrid battery thermal management system that couples PCM with wavy microchannel cold plate. Appl. Therm. Eng. 2023, 219, 119625. [Google Scholar] [CrossRef]
  38. Khan, S.A.; Eze, C.; Dong, K.; Shahid, A.R.; Patil, M.S.; Ahmad, S.; Hussain, I.; Zhao, J. Design of a new optimized U-shaped lightweight liquid-cooled battery thermal management system for electric vehicles: A machine learning approach. Int. Commun. Heat Mass Transf. 2022, 136, 106209. [Google Scholar] [CrossRef]
  39. Tang, Z.; Liu, Z.; Li, J.; Cheng, J. A lightweight liquid cooling thermal management structure for prismatic batteries. J. Energy Storage 2021, 42, 103078. [Google Scholar] [CrossRef]
  40. Zhao, D.; An, C.; Jia, Z.; Lei, Z. Structure optimization of liquid-cooled plate for electric vehicle lithium-ion power batteries. Int. J. Therm. Sci. 2024, 195, 108614. [Google Scholar] [CrossRef]
  41. Wu, C.; Ni, J.; Shi, X.; Huang, R. A new design of cooling plate for liquid-cooled battery thermal management system with variable heat transfer path. Appl. Therm. Eng. 2024, 239, 122107. [Google Scholar] [CrossRef]
  42. Rabiei, M.; Gharehghani, A.; Andwari, A.M. Enhancement of battery thermal management system using a novel structure of hybrid liquid cold plate. Appl. Therm. Eng. 2023, 232, 121051. [Google Scholar] [CrossRef]
  43. Karthik, A.; Pankaj, K.; Akhil, G.; Liang, G.; Siqi, C.; Peng, X. A Novel MOGA approach for power saving strategy and optimization of maximum temperature and maximum pressure for liquid cooling type battery thermal management system. Int. J. Green Energy 2021, 18, 80–89. [Google Scholar] [CrossRef]
  44. Zhu, J.; Wang, J.; Cheng, D.; Mao, J.; Zhang, K. Numerical investigation and parameter optimization on a rib-grooved liquid-cooled plate for lithium battery thermal management system. J. Energy Storage 2024, 85, 111085. [Google Scholar] [CrossRef]
  45. Wang, T.; Zhang, X.; Zeng, Q.; Gao, K.; Jiang, S. Bidirectional heat transfer characteristics of cavity cold plate battery thermal management system: An experimental study. Appl. Therm. Eng. 2023, 225, 120242. [Google Scholar] [CrossRef]
  46. Shen, J.; Chen, X.; Xu, X.; Kong, J.; Song, Z.; Wang, X.; Zhou, F. Thermal performance of a hybrid cooling plate integrated with microchannels and PCM. Appl. Therm. Eng. 2024, 236, 121917. [Google Scholar] [CrossRef]
  47. Li, P.; Zhao, J.; Zhou, S.; Duan, J.; Li, X.; Zhang, H.; Yuan, J. Design and Optimization of a Liquid Cooling Thermal Management System with Flow Distributors and Spiral Channel Cooling Plates for Lithium-Ion Batteries. Energies 2023, 16, 2196. [Google Scholar] [CrossRef]
  48. Khoshvaght-Aliabadi, M.; Ghodrati, P.; Kang, Y.T. Performance analysis of supercritical carbon dioxide as a coolant in cold plate systems. Energy 2025, 314, 134301. [Google Scholar] [CrossRef]
  49. Ansys, I. Ansys Fluent, 2025 R1; Ansys, Inc.: Canonsburg, PA, USA, 2025. [Google Scholar]
  50. Ma, G.; Tian, L.; Song, Y.; Zhao, N. Effects of Turbulence Modeling on the Simulation of Wind Flow over Typical Complex Terrains. Appl. Sci. 2024, 14, 11438. [Google Scholar] [CrossRef]
  51. Shaheed, R.; Mohammadian, A.; Shaheed, A.M. Numerical Simulation of Turbulent Flow in River Bends and Confluences Using the k-ω SST Turbulence Model and Comparison with Standard and Realizable k-ε Models. Hydrology 2025, 12, 145. [Google Scholar] [CrossRef]
  52. Hailu, G.; Henke, M.; Petersen, T. Stationary Battery Thermal Management: Analysis of Active Cooling Designs. Batteries 2022, 8, 23. [Google Scholar] [CrossRef]
  53. Gu, W.B.; Wang, C.Y. Thermal-Electrochemical Modeling of Battery Systems. J. Electrochem. Soc. 2000, 147, 2910. [Google Scholar] [CrossRef]
  54. Li, H.; Li, L.; Li, Q.; Tang, Z.; Zhang, Z.; Chen, R. Coupling characteristics and simplification analysis method of laminated cooling configuration between external and internal cooling. Int. J. Therm. Sci. 2023, 187, 108159. [Google Scholar] [CrossRef]
  55. Fan, L.; Li, J.; Chen, Y.; Zhou, D.; Jiang, Z.; Sun, J. Study on the cooling performance of a new secondary flow serpentine liquid cooling plate used for lithium battery thermal management. Int. J. Heat Mass Transf. 2024, 218, 124711. [Google Scholar] [CrossRef]
  56. Yu, Z.-Q.; Li, M.-T.; Cao, B.-Y. A comprehensive review on microchannel heat sinks for electronics cooling. Int. J. Extrem. Manuf. 2024, 6, 022005. [Google Scholar] [CrossRef]
  57. Yang, H.; Wang, Z.; Li, M.; Ren, F.; Ma, B. Numerical Study on Cross-Linked Cold Plate Design for Thermal Management of High-Power Lithium-Ion Battery. Batteries 2023, 9, 220. [Google Scholar] [CrossRef]
  58. Mubashir, M.; Xu, J.; Guo, Z.; Wang, X.; Wang, H.; Qiao, F.; Li, E.; Mei, X. Numerical investigation of a novel cold plate design with uniform circular hollow fins for battery thermal management systems. Appl. Therm. Eng. 2024, 237, 121791. [Google Scholar] [CrossRef]
  59. Zhang, X.; Zhu, Y.; Hou, L.; Hu, J.; Shang, Y. In-situ analysis and estimation of temperature distribution for large-format lithium-ion batteries based on distributed optical fiber sensors. eTransportation 2025, 100425, in press. [Google Scholar] [CrossRef]
  60. Wang, H.; Gan, Y.; Luo, Q.; Li, Y.; Feng, J. A study on the effect of channel structures on flow and heat transfer performance of cold plate with double-layer serpentine microchannel. Appl. Therm. Eng. 2025, 259, 124944. [Google Scholar] [CrossRef]
  61. Albana, M.H.; Batubara, N.H.; Novebriantika, N.; Silalahi, M.T.; Yogantara, Y.; Guntur, H.L. Dataset supporting the article: Investigation of Flow Channel Configurations in Liquid-Cooled Plates for Electric Vehicle Battery Thermal Management. Zenodo 2025. [Google Scholar] [CrossRef]
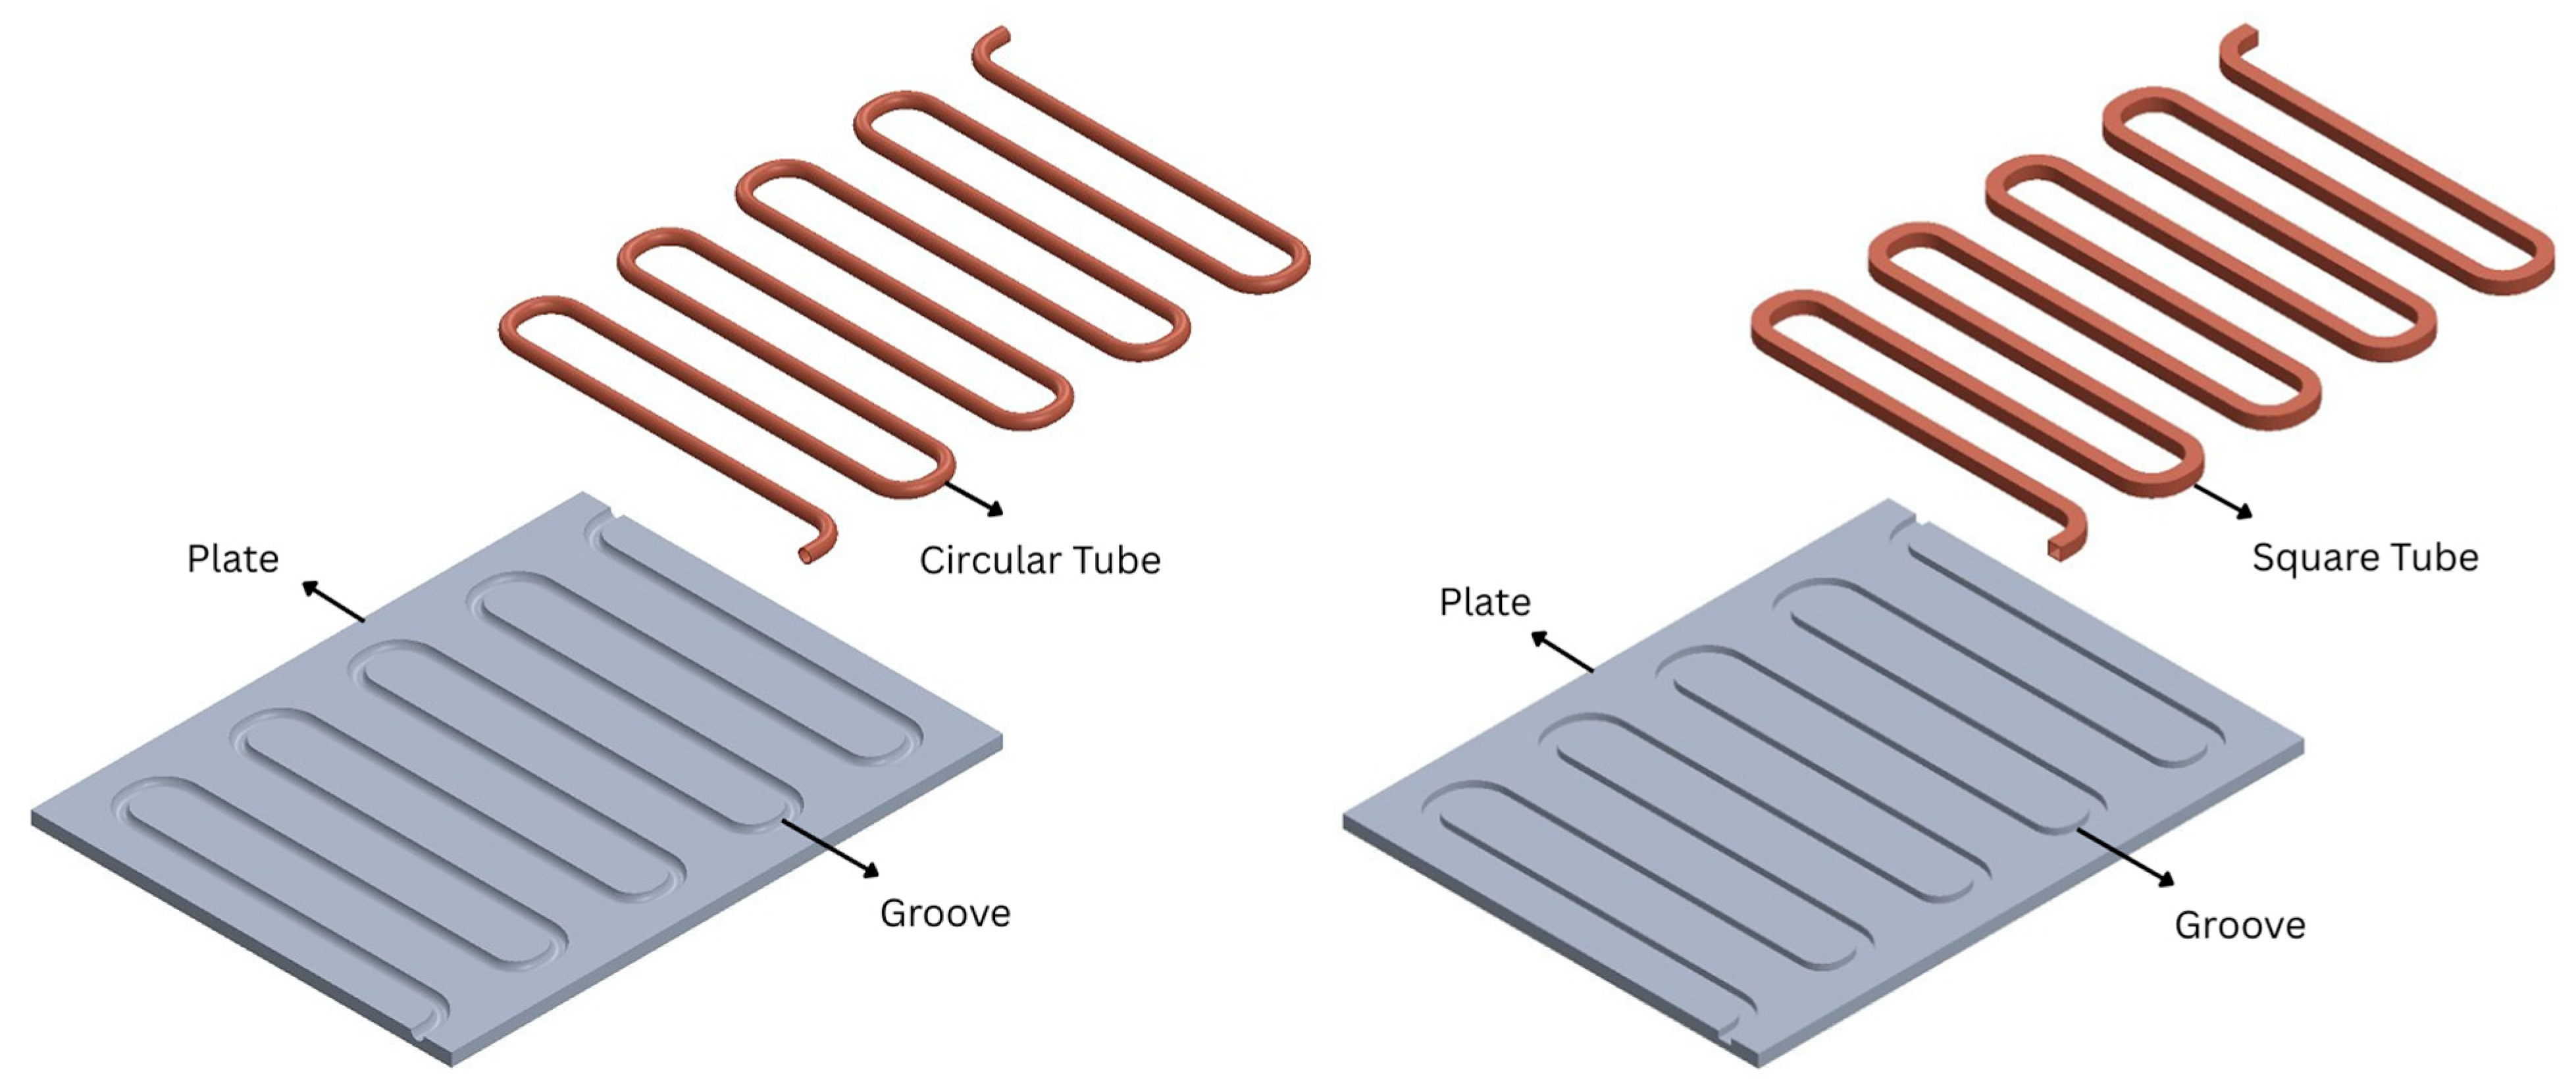
Figure 1. Cold plate components.
Wevj 16 00536 g001
Figure 2. The shape of the cooling fluid channel on the cold plate.
Wevj 16 00536 g002
Figure 3. Grid independency study for maximum temperature.
Wevj 16 00536 g003
Figure 4. Comparison of the maximum cold plate temperature between the current simulation results (using CO2) and data from the reference study by Khoshvaght-Aliabadi et al. [48].
Wevj 16 00536 g004
Figure 5. Temperature distribution on a cold plate when given a heat flux of 20,000 W/m2.
Wevj 16 00536 g005
Figure 6. Temperature distribution on a cold plate when given a heat flux of 30,000 W/m2.
Wevj 16 00536 g006
Figure 7. Temperature distribution on a cold plate when given a heat flux of 40,000 W/m2.
Wevj 16 00536 g007
Figure 8. Contour plot of temperature distribution on the top surface of the cold plate for the spiral channel configuration.
Wevj 16 00536 g008
Figure 9. Variation in thermal resistance with heat flux for six cold plate designs.
Wevj 16 00536 g009
Figure 10. Variation in average surface temperature with heat flux for six cold plate designs.
Wevj 16 00536 g010
Figure 11. Variation in temperature uniformity with heat flux for six cold plate designs.
Wevj 16 00536 g011
Figure 12. Temperature uniformity index of six cold plate designs.
Wevj 16 00536 g012
Figure 13. Pressure countours for six cold plate channel designs.
Wevj 16 00536 g013
Figure 14. Pressure drop in various types of cold plate channels.
Wevj 16 00536 g014
Figure 15. Velocity contour distribution in six cooling plate channel designs.
Wevj 16 00536 g015
Figure 16. Annotation of fluid flow phenomena on velocity contours for serpentine configuration (CP#4).
Wevj 16 00536 g016
Figure 17. Relationship between thermal resistance and pressure drop for six cold plate designs (CP#1–CP#6) under various heat flux conditions.
Wevj 16 00536 g017
Figure 18. Relationship between TUI and pressure drop for six cold plate designs (CP#1–CP#6) under various heat flux conditions.
Wevj 16 00536 g018
Figure 19. Relationship between TUI and thermal resistance.
Wevj 16 00536 g019
Figure 20. Cold plate design selection flow illustrating the trade-off between geometry recommendations and resulting performance.
Wevj 16 00536 g020
Table 1. Mesh sizes and results of the grid independency study.
Mesh No.ElementsMaximum Temperature (°C) Pressure Drop (Pa)
1.705,89170.4813,125.42
2.862,63970.8513,125.15
3.927,87571.2712,658.75
4.1,015,78771.1712,801.71
Table 2. Thermal properties of cold plate components [49].
ComponentMaterial   Density   ( k g / m 3 )   Specific   Heat   ( J / k g · K )   Thermal   Conductivity   ( W / m · K )
PlateAluminum2179871202.4
TubeCopper8978381387.6
CoolantWater998.241820.6
Table 3. Comparison of Maximum Temperatures at Heat Fluxes of 20,000 W/m2 and 40,000 W/m2.
Cold Plate ConfigurationMaximum Temperature (°C) at 20,000 W/m2Maximum Temperature (°C) at 40,000 W/m2Ascension (%)
CP#1436230.65
CP#2476931.88
CP#36610637.74
CP#4426030
CP#5466630.3
CP#66310037
Table 4. Comparison of temperature uniformity values between CP#1 and CP#4.
Heat Flux (W/m2)CP#1 Temperature Uniformity Values
20,00010.9% lower than CP#4
30,0005.2% lower than CP#4
40,0003.2% lower than CP#4
Table 5. Design selection guide for cold plates based on key performance metrics.
Design PrioritiesRecommended GeometryRecommended Cross-SectionAdvantageDrawback
Maximum CoolingSerpentine (8 U-turns)SquareLowest Thermal ResistanceHigh Pressure Drop
Temperature UniformitySerpentine (8 U-turns)CircularHighest TUIModerate Cooling Performance and Pressure Drop
Hydraulic EfficiencySerpentine (6 U-turns)CircularLowest Pressure DropLess Effective Cooling Performance
Disclaimer/Publisher’s Note: The statements, opinions and data contained in all publications are solely those of the individual author(s) and contributor(s) and not of MDPI and/or the editor(s). MDPI and/or the editor(s) disclaim responsibility for any injury to people or property resulting from any ideas, methods, instructions or products referred to in the content.