Article

Optimal Design of Dual Pantograph Parameters for Electrified Roads

1
Research Institute of Highway Ministry of Transport, Beijing 100088, China
2
Beijing CRRC CED Railway Electric Tech Company Limited, Beijing 100176, China
*
Author to whom correspondence should be addressed.
World Electr. Veh. J. 2025, 16(9), 535; https://doi.org/10.3390/wevj16090535
Submission received: 11 July 2025 / Revised: 12 September 2025 / Accepted: 13 September 2025 / Published: 19 September 2025
(This article belongs to the Section Energy Supply and Sustainability)

Abstract

Electrified roads represent an emerging transportation solution in the context of global energy transition. These systems enable vehicles equipped with roof-mounted pantographs to draw power from overhead contact lines while in motion, allowing continuous energy replenishment. The effectiveness of this energy transfer—namely, the quality of pantograph–catenary interaction—is significantly influenced by the pantograph’s equivalent mechanical parameters. This study develops a three-dimensional overhead catenary model and a five-mass pantograph model tailored to electrified roads. Under conditions of road surface irregularities, it investigates how variations in equivalent pantograph parameters affect key contact performance indicators. Simulation results are used to identify a new set of equivalent pantograph parameters that significantly improve the overall quality of pantograph–catenary interaction compared to the baseline configuration. Sensitivity analysis further reveals that, under road-induced excitation, pan-head stiffness is the most critical factor affecting contact performance, while pan-head damping, upper frame stiffness, and upper frame damping show minimal influence. By constructing a coupled dynamic model and conducting parameter optimization, this study elucidates the role of key pantograph parameters for electrified roads in determining contact performance. The findings provide a theoretical foundation for future equipment development and technological advancement.

1. Introduction

Overhead-powered electrified roads enable electric vehicles to receive continuous electric power from overhead contact lines via onboard pantographs, supporting uninterrupted propulsion during motion. Outside the electrified sections, these vehicles switch to onboard energy storage systems such as batteries or capacitors to cover short non-electrified distances [1,2]. This emerging transportation solution integrates power supply infrastructure and vehicle electrification, offering clear advantages in energy efficiency, operational cost, and emissions reduction [3]. The power supply principle of electrified roads is illustrated in Figure 1, and selected operational electrical parameters are listed in Table 1.
Similarly to railway systems, the performance and safety of electrified roads depend heavily on stable and reliable contact between the pantograph and the overhead catenary system [4]. Among the factors influencing contact quality, the equivalent mechanical parameters of the pantograph—such as mass, stiffness, and damping—play a critical role in maintaining effective current collection and minimizing contact force fluctuations. The simplified parameters of the railway pantograph are illustrated in Figure 2.
Most scholars consider the pan-head mass (m1) to be the most critical factor affecting pantograph–catenary interaction. For instance, Jin-Hee Lee et al. [5] used the response surface analysis method and the differential evolutionary algorithm to optimize the pantograph model and found that m1 had the most significant impact on the standard deviation of the contact force among all examined parameters. J. Pombo et al. [6] applied finite element and multibody dynamics methods to construct a coupled pantograph–catenary model. Their findings indicated that increasing the m1 led to a rise in both the maximum contact force and its standard deviation, whereas increasing the pan-head stiffness (k1) and the lower frame damping (c3) helped reduce the standard deviation. Jorge Ambrósio et al. [7] used a high-speed pantograph model combined with a genetic algorithm and found that increasing the m1 raised the maximum contact force and its standard deviation, while a higher k1 could reduce the standard deviation. Jiang et al. [8] derived the matching relationship between pantograph parameters and droppers’ natural frequencies and established a kinematic model of the pantograph–catenary system. They concluded that adjusting the m1 and k1 can significantly reduce pressure fluctuations between droppers and lower the standard deviation of contact pressure. Qi Wenyuan et al. [9] developed a dynamic model of a pantograph and a rigid catenary system and found that m1 had the greatest influence on pantograph performance, followed by the upper frame mass (m2) and stiffness (k2), with the lower frame stiffness (k3) having the least impact. Wu Mengzhen et al. [10] constructed a two-dimensional elastic chain suspension catenary and a three-mass pantograph model. They showed that changes in k3 significantly affect the mean contact force; they further showed that reducing the m1 or lower frame mass (m3), decreasing the k1 or k2, and increasing damping (c2) could improve current collection quality. Among these, the m1 exhibited the highest sensitivity. Wang et al. [11] found that the optimal pantograph parameters varied with speed, with mass and stiffness having the most substantial impact, while damping ratio showed minimal influence. Wu et al. [12] concluded that the m1 has a far greater influence on pantograph–catenary interaction quality than the other eight parameters. A reduction in m3 leads to a negative change in the contact force standard deviation (Δσ), thereby improving stability. Reducing m1 is also effective in minimizing contact force fluctuations. Ke Chen et al. [13] using finite element modeling combined with Sobol global sensitivity analysis and neural network optimization, highlighted m1 and m2 as key sensitive parameters, suggesting that reducing these masses can improve contact force characteristics.
However, some scholars hold differing views. Jin-Woo Kim et al. [14] used an orthogonal experimental design and identified c3, m3, and k2 as the dominant factors affecting pantograph–catenary coupling. Ning Zhou et al. [15] developed a finite element model to study the influence of design parameters on contact force. Their results indicated that proper optimization of k1 and pan-head damping (c1) can enhance contact performance and increase allowable operating speeds. Wang Ying et al. [16] developed a multi-body pantograph–catenary coupled dynamic model using Laplace transform and numerical methods. Through single- and multi-variable optimization, they identified k1 and frame mass as the most sensitive parameters affecting contact force fluctuations. Liu Yang et al. [17] employed a genetic algorithm targeting the reduction in the standard deviation of contact force to optimize sensitive parameters, including k1, k2, and c3. Their results demonstrated a significant improvement in the dynamic performance of the pantograph–catenary system after optimization. Chen Yang et al. [18], based on a flexible pan-head finite element model, it is recommended to reduce k2, increase k1, and appropriately adjust m1 and m2 while keeping damping constant to optimize contact force performance.
It is evident that previous studies on pantograph parameter optimization have not reached a consensus, and most research efforts have focused on railway systems. These studies largely neglect the effects of road surface irregularities on pantograph–catenary interaction and do not address the unique characteristics of electrified roads. However, the inherent differences between electrified roads and railway systems impose new requirements on the operating environment of the pantograph–catenary system for electrified roads. Table 2 presents a comparative analysis of pantograph–catenary characteristics between the two systems.
As shown in Table 2, railway systems typically exhibit high track smoothness and minimal vehicle deformation. Their single pantograph–single wire configuration, combined with a stable operating environment, ensures reliable pantograph–catenary contact quality. In contrast, electrified road systems feature lower road surface smoothness, greater vehicle deformation, and a dual pantograph–dual wire structure, making them more susceptible to disturbances from road surface irregularities. Consequently, optimizing pantograph parameters becomes particularly critical for improving contact performance in electrified road applications.
To address this gap, this paper develops a five-mass pantograph model and a three-dimensional dual-contact-wire catenary model that reflect the distinct features of electrified roads. The study investigates how variations in the equivalent parameters of the pantograph affect the quality of pantograph–catenary interaction under uneven road conditions.

2. Methods

2.1. Catenary Model

The overhead catenary system continuously supplies electric power to transport vehicles and consists of components such as contact wires, messenger wires, and droppers. Its structure is complex and exhibits strong nonlinear characteristics. Finite element modeling is widely used due to its ability to capture the dynamic behavior of such systems.
In the model, Beam188 elements are used to represent the contact wire and messenger wire, while Link8 elements—which bear only tensile forces—are used to simulate the droppers. Accessories such as clamps are modeled using Mass21 point mass elements. Since the catenary system does not include lateral displacement constraints in this case, steady arms are not included in the model.
Based on the topological structure of a simple chain-type catenary, the global finite element model is constructed by assembling the mass and stiffness matrices of each component. The dynamic equation of the catenary system is expressed as:
M c U ¨ c + C c U ˙ c + K c U c = F c
In Equation (1), Mc, Cc, and Kc represent the mass, damping, and stiffness matrices of the catenary, assembled from the elemental mass and stiffness matrices of the messenger wire, contact wire, droppers, and clamps in the finite element model. FC is the external load vector of the nodes on the catenary. U ¨ c , U ˙ c , and U c denote the acceleration, velocity, and displacement vectors.
The initial shape of the catenary is determined using the negative sag method [19] to ensure the system remains in a balanced state. A schematic diagram of the established finite element catenary model is shown in Figure 3.

2.2. Pantograph Model

The pantograph is an onboard electrical device used by vehicles to collect power from the overhead contact line. It consists of contact strips, an upper frame, a lower frame, a base, and a driving mechanism.
Based on the principles of energy transfer and efficiency, the pantograph can be modeled as a dynamic system composed of lumped masses, springs, and dampers. A five-mass model is adopted to represent the dynamics of the left and right pan-heads, the upper frame, and the vehicle body, effectively capturing the system’s behavior under external excitation. The five-mass model is shown in Figure 4.
To incorporate the vehicle’s motion degrees of freedom into the pantograph model and accurately describe the dynamic response to road-induced excitations, an additional beam element is introduced beneath the lower frame mass. This element simulates the vertical displacement z of the pantograph base and the vehicle’s roll angle α, as caused by road irregularities.
Among the resulting motion components, vertical displacement z and roll angle α were selected as the dominant excitations for two reasons:
  • z governs the global vertical separation between the pantograph and the catenary, directly affecting the contact force magnitude.
  • α captures left–right asymmetry in dual-head, dual-wire systems, since road-induced roll motions tilt the pantograph base and cause differential displacements at the two contact points.
Other degrees of freedom, such as lateral motions, showed a smaller influence on the contact force dynamic. This selection ensures both physical relevance and model efficiency. The model is illustrated in Figure 5.
The motion equation for the five-mass pantograph model is given by:
M p U ¨ p + C p U ˙ p + K p U p = F p
In Equation (2), Mp, Cp and Kp denote the mass, damping, and stiffness matrices of the pantograph, respectively, while U ¨ p, U ˙ p and Up represent its acceleration, velocity, and displacement matrices.

2.3. Pantograph–Catenary Interaction Solution

The pantograph–catenary contact interaction is commonly solved using the penalty function method [20], in which a spring element is introduced between the pantograph and the catenary to simulate the switching behavior of the contact state. When the spring is compressed, the system is considered to be in contact; otherwise, it is considered to be separated. The penalty function is defined as:
F f = k c ( z 1 z c ) z 1 > z c 0 z 1 z c
where
  • Ff is the pantograph–catenary contact force,
  • kc is the stiffness of the penalty spring element, and kc = 50,000 Nm−1,
  • z1 is the vertical displacement of the pantograph head,
  • zc is the vertical displacement of the contact node on the catenary.
The equation of motion for the interacted pantograph–catenary system can be written as:
M p 0 0 M c U ¨ p U ¨ c + C p 0 0 C c U ˙ p U ˙ c + K p 0 0 K c U p U c = F p F c
M U ¨ + C U ˙ + K U = F
In this equation:
  • M, C, and K are the generalized mass, damping, and stiffness matrices of the system,
  • U ¨ , U ˙ and U are the displacement, velocity, and acceleration matrices,
  • F is the generalized external force vector applied to the system.
Due to the strong nonlinearity of the pantograph–catenary interaction, analytical solutions are generally unattainable. Therefore, the Newmark-β method is employed for numerical integration [21]. This method discretizes time into small steps and recalculates the system stiffness matrix K and the contact force Fc at each time increment. The procedure is as follows:
U t + Δ t = U t + U ˙ t Δ t + [ ( 0.5 β ) U ¨ t + β U ¨ t + Δ t ] Δ t 2
U ˙ t + Δ t = U ˙ t + [ ( 1 α ) U ¨ t + α U ¨ t + Δ t ] Δ t
where
  • Ut and Ut+Δt are the displacement matrices at time t and t + Δt,
  • α and β are weighting parameters controlling numerical damping and stability.
When α = 0.5 and β = 0.25, the method corresponds to the average acceleration method, which is unconditionally stable. By iterating these steps over time, the dynamic contact forces between the pantograph and the catenary can be effectively simulated.

3. Experiments and Simulation Results

3.1. Model Validation of the Pantograph–Catenary System

Electrified roads are still in the early stages of development. Establishing validation standards or test sections that reflect the excitation characteristics of road surfaces requires extensive preparation and verification. Consequently, at the current stage, the model validation of the pantograph–catenary system faces certain challenges. Considering that the structural design of pantographs and overhead contact lines for electrified roads heavily draws from railway systems—particularly in aspects such as contact strip materials, mechanical configuration, stiffness settings, tension levels, and wiring layouts—existing railway modeling and validation standards can serve as valuable references for current research. In accordance with the EN 50318 standard [22], the validity of the developed pantograph–catenary model is verified. The specific parameters used for the pantograph and catenary models are listed in Table 3 and Table 4.
Simulation results at speeds of 250 km/h and 300 km/h are compared with the tolerance ranges specified in the standard. The results confirm that the simulation model meets the standard criteria, validating the accuracy and reliability of the proposed pantograph–catenary model.

3.2. Pantograph–Catenary Contact Force Under Road Excitation

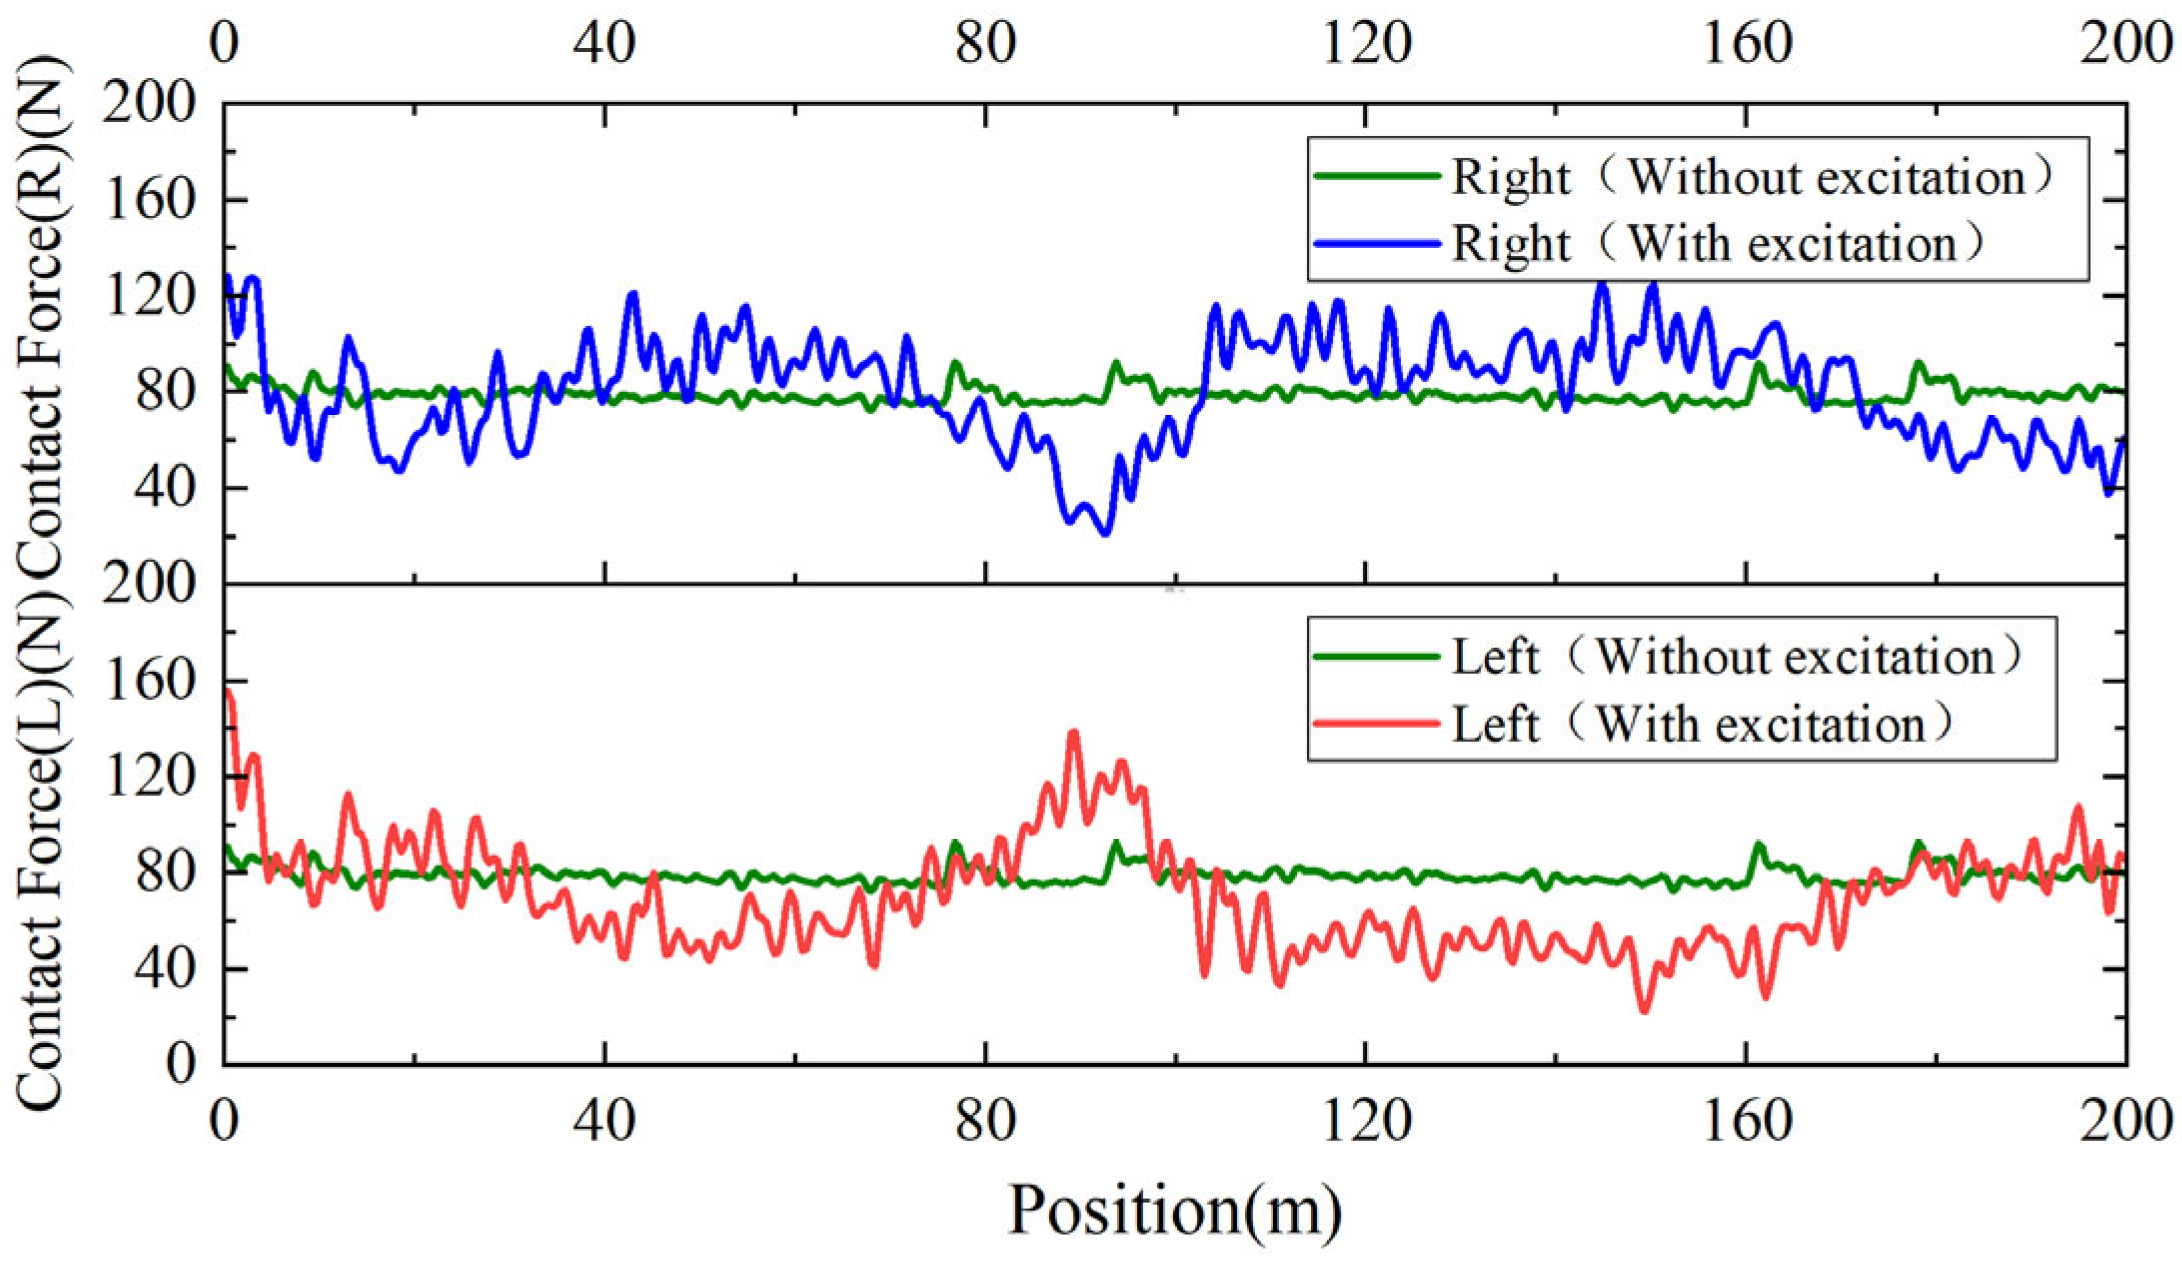
The electrified road vehicle considered in this study is a heavy-duty truck equipped with a pantograph. Vehicle dynamic responses were collected from heavy-duty coal transport trucks operating on asphalt roads near a coal mine. Based on these data, the road surface roughness was reconstructed using an inverse modeling approach. An electrified vehicle dynamics model was established in Trucksim, where the motion of the pantograph base was decomposed into translational and rotational components to obtain the excitation inputs z and α. The newly established five-mass pantograph model simulates these excitations by applying vertical displacement z and roll α to the beam element beneath the pantograph base. Under a simulation vehicle speed of 60 km/h, base excitation data collected from a section of uneven road is applied to the beam element. A comparison of the pantograph–catenary contact force before and after applying the base excitation is shown in Figure 6, while the quantitative evaluation of the contact force is summarized in Table 5.
The contact force indicators show a significantly lower average contact force on the left pantograph head compared to the right. This discrepancy is primarily attributed to the uneven road surface elevation, with the left side of the vehicle experiencing a generally lower elevation than the right. This unevenness induces a vehicle roll motion, which is transmitted through the vehicle body to the pantograph base, resulting in asymmetric contact forces between the left and right pantograph heads. Such differences caused by lateral road irregularities provide a meaningful basis for evaluating the effectiveness of parameter optimization in the pantograph design.
By analyzing the contact force imbalance before and after optimization, the improvements in pantograph performance under realistic excitation conditions can be intuitively demonstrated.

3.3. Pantograph Parameter Optimization

For pantographs used in electrified roads, the increasing complexity of both the structural topology and operating conditions necessitates a re-optimization of design parameters to ensure high-quality pantograph–catenary interaction under new transportation environments. Based on the established simulation model, variations in contact force under different parameter values can be rapidly and cost-effectively evaluated. This approach enables the identification of suitable pantograph configurations tailored to the operational conditions of electrified road freight vehicles.
The DSA380 pantograph, configured with a 1600 mm extension height, is adopted as the baseline for comparison. The parameter ranges for optimization are determined based on industry experience, as summarized in Table 6.
The optimization of pantograph parameters should consider three major aspects: Contact force performance, Left-right contact force balance, and Engineering feasibility.
  • From the perspective of contact force performance evaluation, the selection of pantograph parameters should aim to: Reduce the maximum contact force Fmax, to avoid hard impacts between the pantograph and catenary, which may cause fatigue damage to the contact wire and abnormal wear of the pantograph strip; Lower the pan-up contact force Fr, in order to minimize transient disturbances to the catenary system during pantograph lifting; Decrease the standard deviation Δδ, to suppress fluctuations in the contact force; Increase the minimum contact force Fmin, to reduce the risk of loss of contact (dewirements) and ensure continuous current collection.
  • From the perspective of balancing left–right contact force, as shown in Table 7, the left pantograph head exhibits a higher pan-up contact force Fr and maximum contact force Fmax, but a lower average contact force Fm than the right pantograph. Therefore, to reduce the left pantograph’s Fr and Fmax, and simultaneously increase its average contact force Fm, it is acceptable to slightly increase the right pantograph’s Fr and Fmax to balance the bilateral contact performance.
  • From the perspective of engineering feasibility, parameter selection should also consider practical manufacturability and maintainability, aiming to reduce production and maintenance costs.
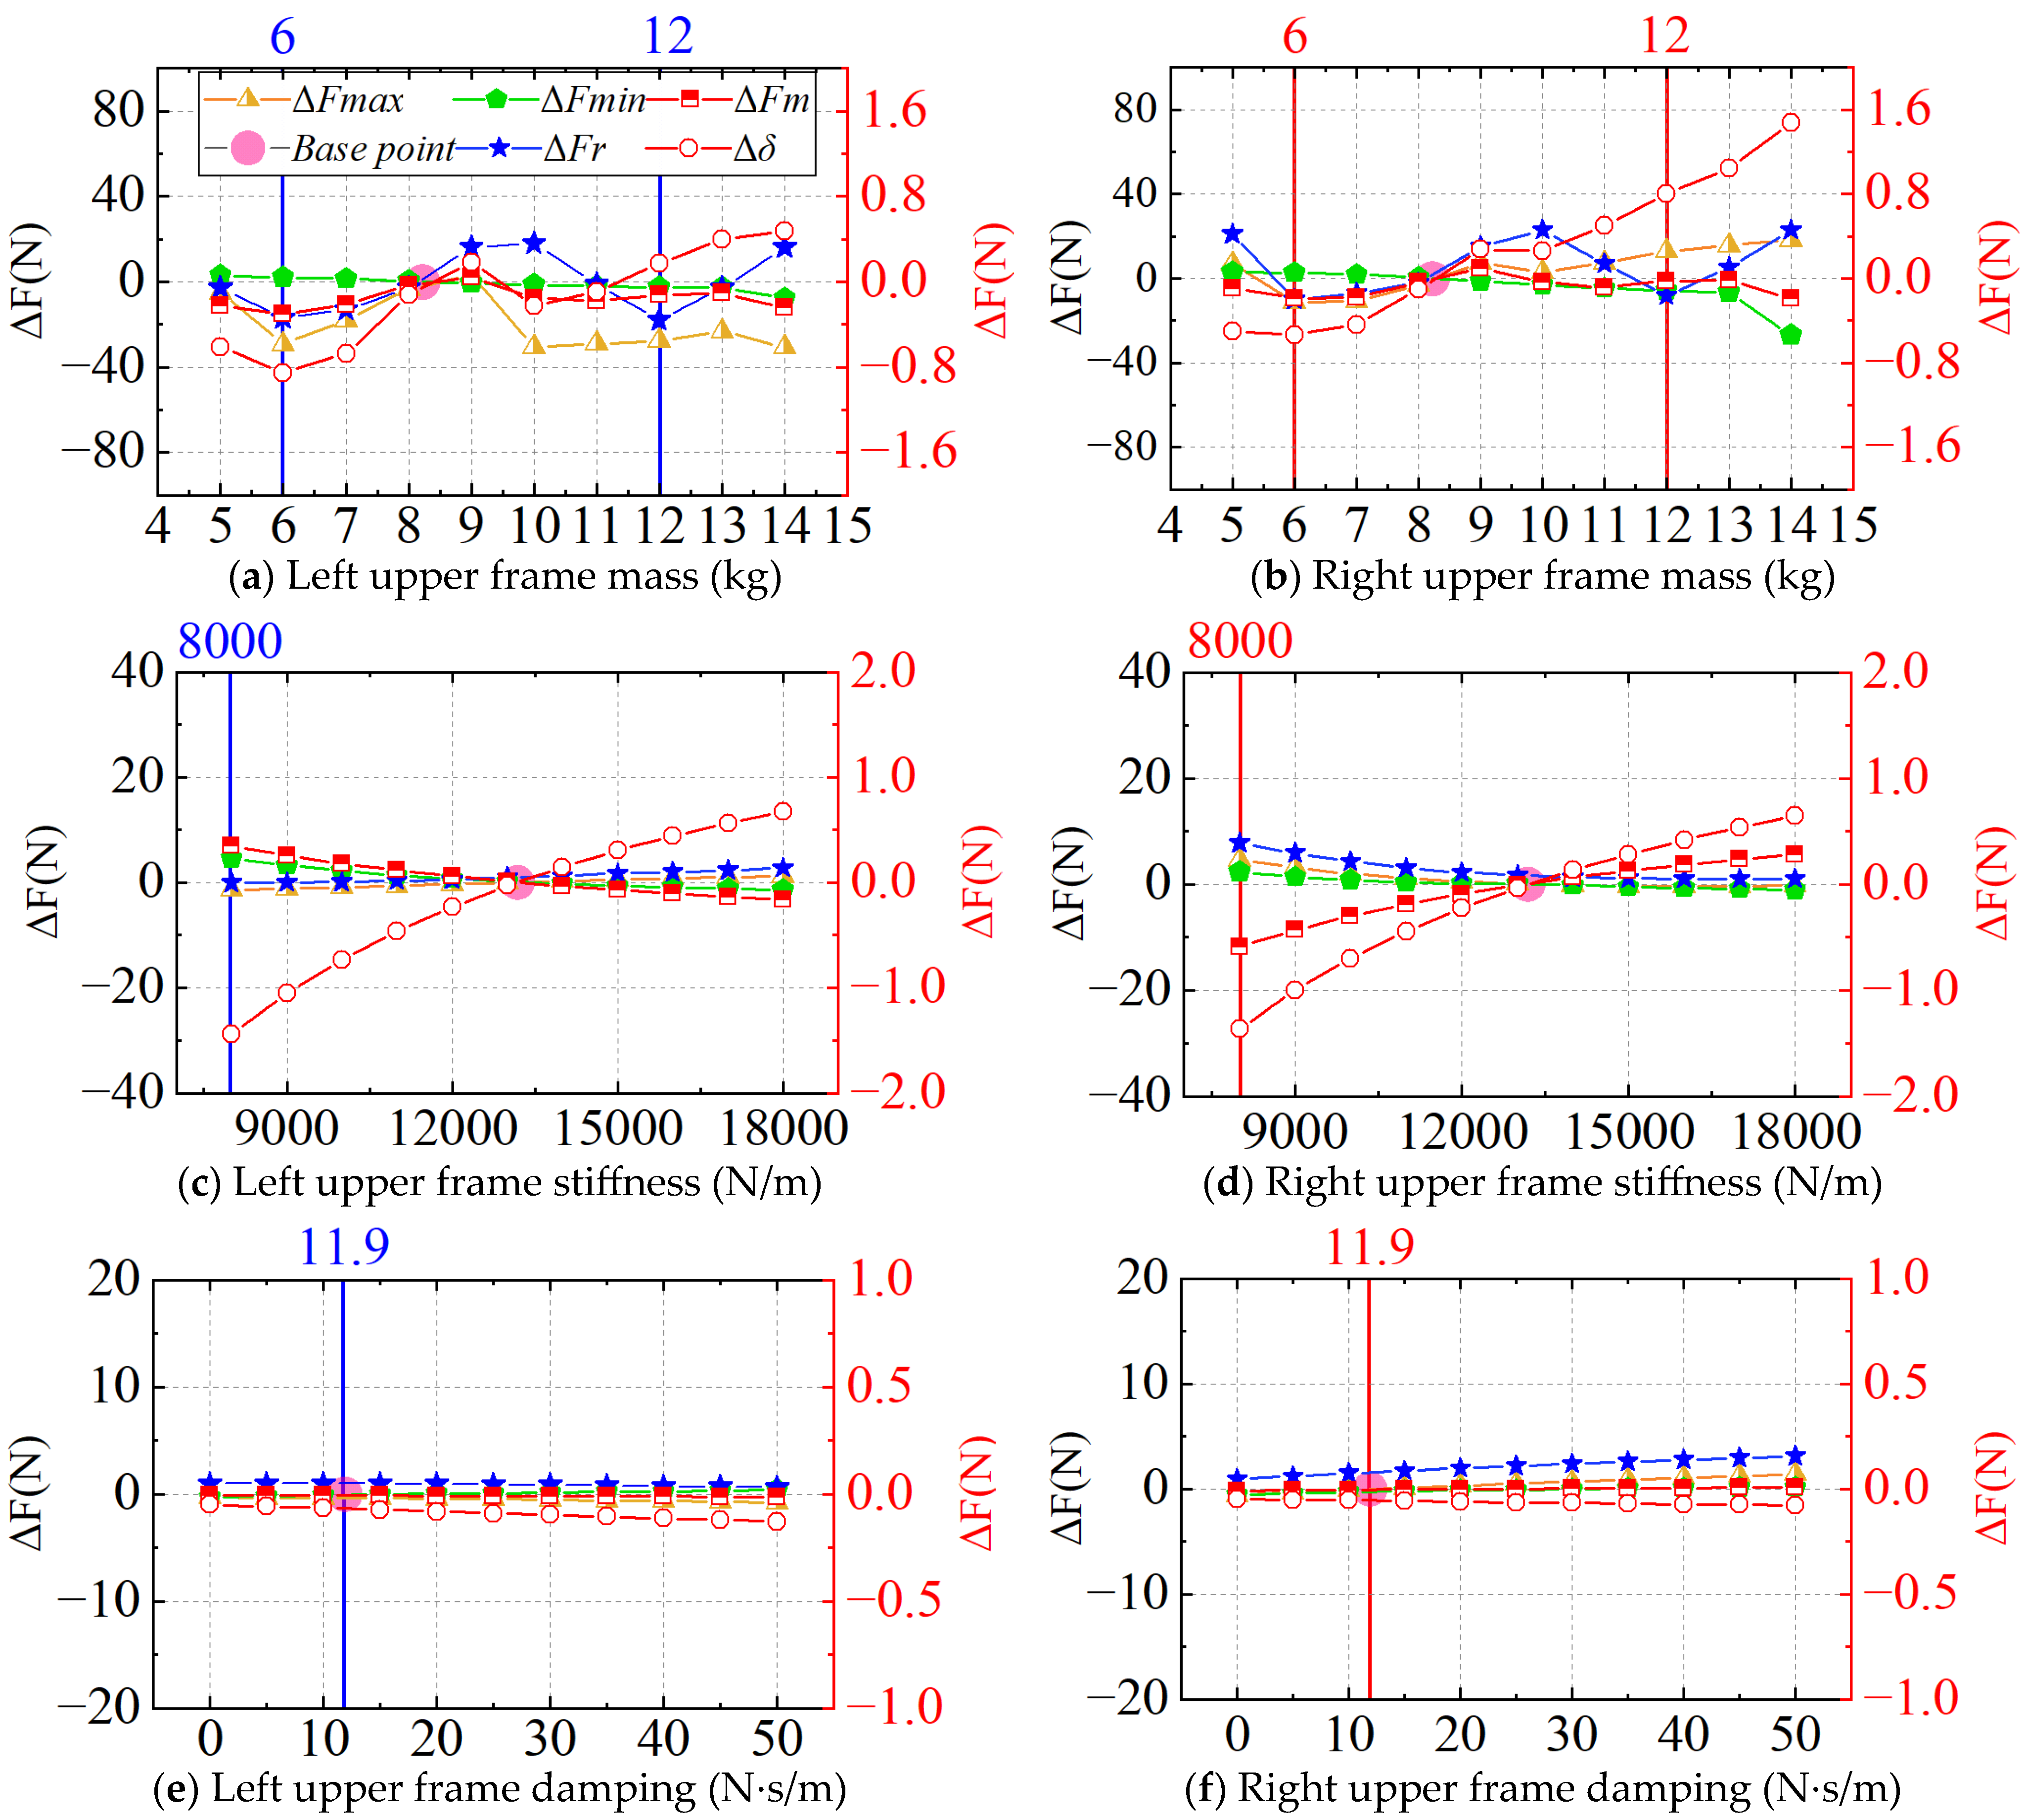
After multiple rounds of simulation experiments and significance testing for each parameter variation, the sensitivity curves of the pantograph head, upper frame, and lower frame parameters are presented in Figure 7, Figure 8 and Figure 9, respectively.
As shown in Figure 7, both the pan-up contact force Fr and the maximum contact force Fmax exhibit significant sensitivity to changes in the pantograph head mass m1. Considering optimization objectives 1 and 3, values of 4.5 kg and 6.5 kg represent non-dominated solutions for the left pantograph, while 7 kg appears to be the optimal solution for the right pantograph. When additionally considering optimization objective 2 (balancing bilateral contact force), the optimized value of the pantograph head mass m1 is determined to be 6.5 kg.
The pan-up contact force Fr, maximum contact force Fmax, and standard deviation Δδ are all highly sensitive to variations in pantograph head stiffness. Reducing pantograph head stiffness can effectively improve contact performance, which is consistent with findings in the railway field. Based on the optimization objectives, the equivalent stiffness k1 of the pantograph head is selected as 3000 N/m. However, previous studies have shown that a decrease in k1 leads to increased wear of carbon strips and higher electrical losses [23]. Under stochastic vibration conditions, the friction coefficient of carbon strips decreases significantly as the relative pantograph–catenary speed approaches 80 km/h [24]. Therefore, under favorable road conditions, increasing the operating speed to around 80 km/h and moderately enhancing pantograph head stiffness can effectively reduce carbon strip wear.
In contrast, a decrease in pantograph head damping increases the pan-up contact force Fr. Therefore, the equivalent damping coefficient c1 of the pantograph head is retained at its original value of 85.31 N·s/m to maintain system stability.
As shown in Figure 8, the influence of upper frame mass m2 on contact force is relatively complex. Considering optimization objectives 1 and 3, both 6 kg and 12 kg can be regarded as non-dominated solutions for the equivalent upper frame mass. Taking into account optimization objective 2 (balancing bilateral contact force), the optimized value of m2 is selected as 6 kg.
To increase the average contact force on the left pantograph and reduce the standard deviation Δδ, the equivalent stiffness k2 of the upper frame is set to 8000 N/m based on optimization objective 2.
The variation in the damping coefficient c2 has a negligible impact on the contact force performance. Therefore, the equivalent damping is maintained at its original value of 11.9 N·s/m.
As shown in Figure 9, the variation in the lower frame equivalent mass m3 significantly affects both the maximum contact force Fmax and the rising contact force Fr. When considering only optimization objective 1, the optimal value of m3 is 3 kg. However, under optimization objective 3, 5.9 kg and 14 kg are identified as non-dominated solutions for the left pantograph, while 5.9 kg and 13 kg serve the same role for the right pantograph. Taking optimization objective 2 into account (balancing bilateral contact force), the selected optimized value of m3 is 14 kg.
The equivalent lower frame stiffness k3 shows a negative correlation with the average contact force Fm. Given that the average contact force is relatively low, reducing k3 is beneficial for improving Fm. Therefore, k3 is set to 0.1 N/m.
The equivalent damping coefficient c3 of the lower frame has a notable influence on both the raising contact force Fr and the maximum contact force Fmax on the left pantograph. Accordingly, the optimized value of c3 is chosen as 210 N·s/m.

3.4. Analysis of Optimization Effect

After updating the parameters m1, m2, m3, k1, k2, k3, and c3 to their optimized values, the final parameter settings of the pantograph system are summarized in Table 8. A comparison of parameter values before and after optimization is illustrated in Figure 10, while the changes in contact force evaluation metrics are presented in Table 9.
As shown in Table 9, the optimized pantograph parameters exhibit favorable results. The lift-off contact force (Fr), maximum contact force (Fmax), and standard deviation (δ) for both the left and right pantographs are significantly reduced, while the average contact force (Fm) and minimum contact force (Fmin) are substantially increased. These improvements enhance the interaction performance of the pantograph–catenary system under uneven road conditions and improve the overall current collection quality.
When the static contact force is increased to 110 N, the comparison of pantograph–catenary contact forces before and after optimization is shown in Figure 11, and the corresponding performance indicators are summarized in Table 10.
According to the simulation results, under a static contact force of 110 N, the optimized pantograph parameters significantly improved most evaluation metrics. Although the minimum contact force of the right pantograph slightly decreased, overall pantograph–catenary interaction performance was further enhanced.
When the operating speed of the electrified vehicle decreases from 60 to 40 km/h, the optimization results are shown in Figure 12 and Table 11.
As shown, the new parameter set continues to effectively improve the contact force performance, even under varying vehicle speeds.
The lifted displacement is also an important indicator for assessing contact quality. The figure below presents the contact node displacements at a speed of 60 km/h with a pantograph uplift force of 80 N.
As shown in Figure 13, the contact nodes exhibit a downward shift at higher positions, which helps reduce contact wear, while at lower positions, the node displacement increases, thereby decreasing the probability of pantograph detachment and further improving contact quality.

3.5. Sensitivity Analysis of Pantograph Parameters

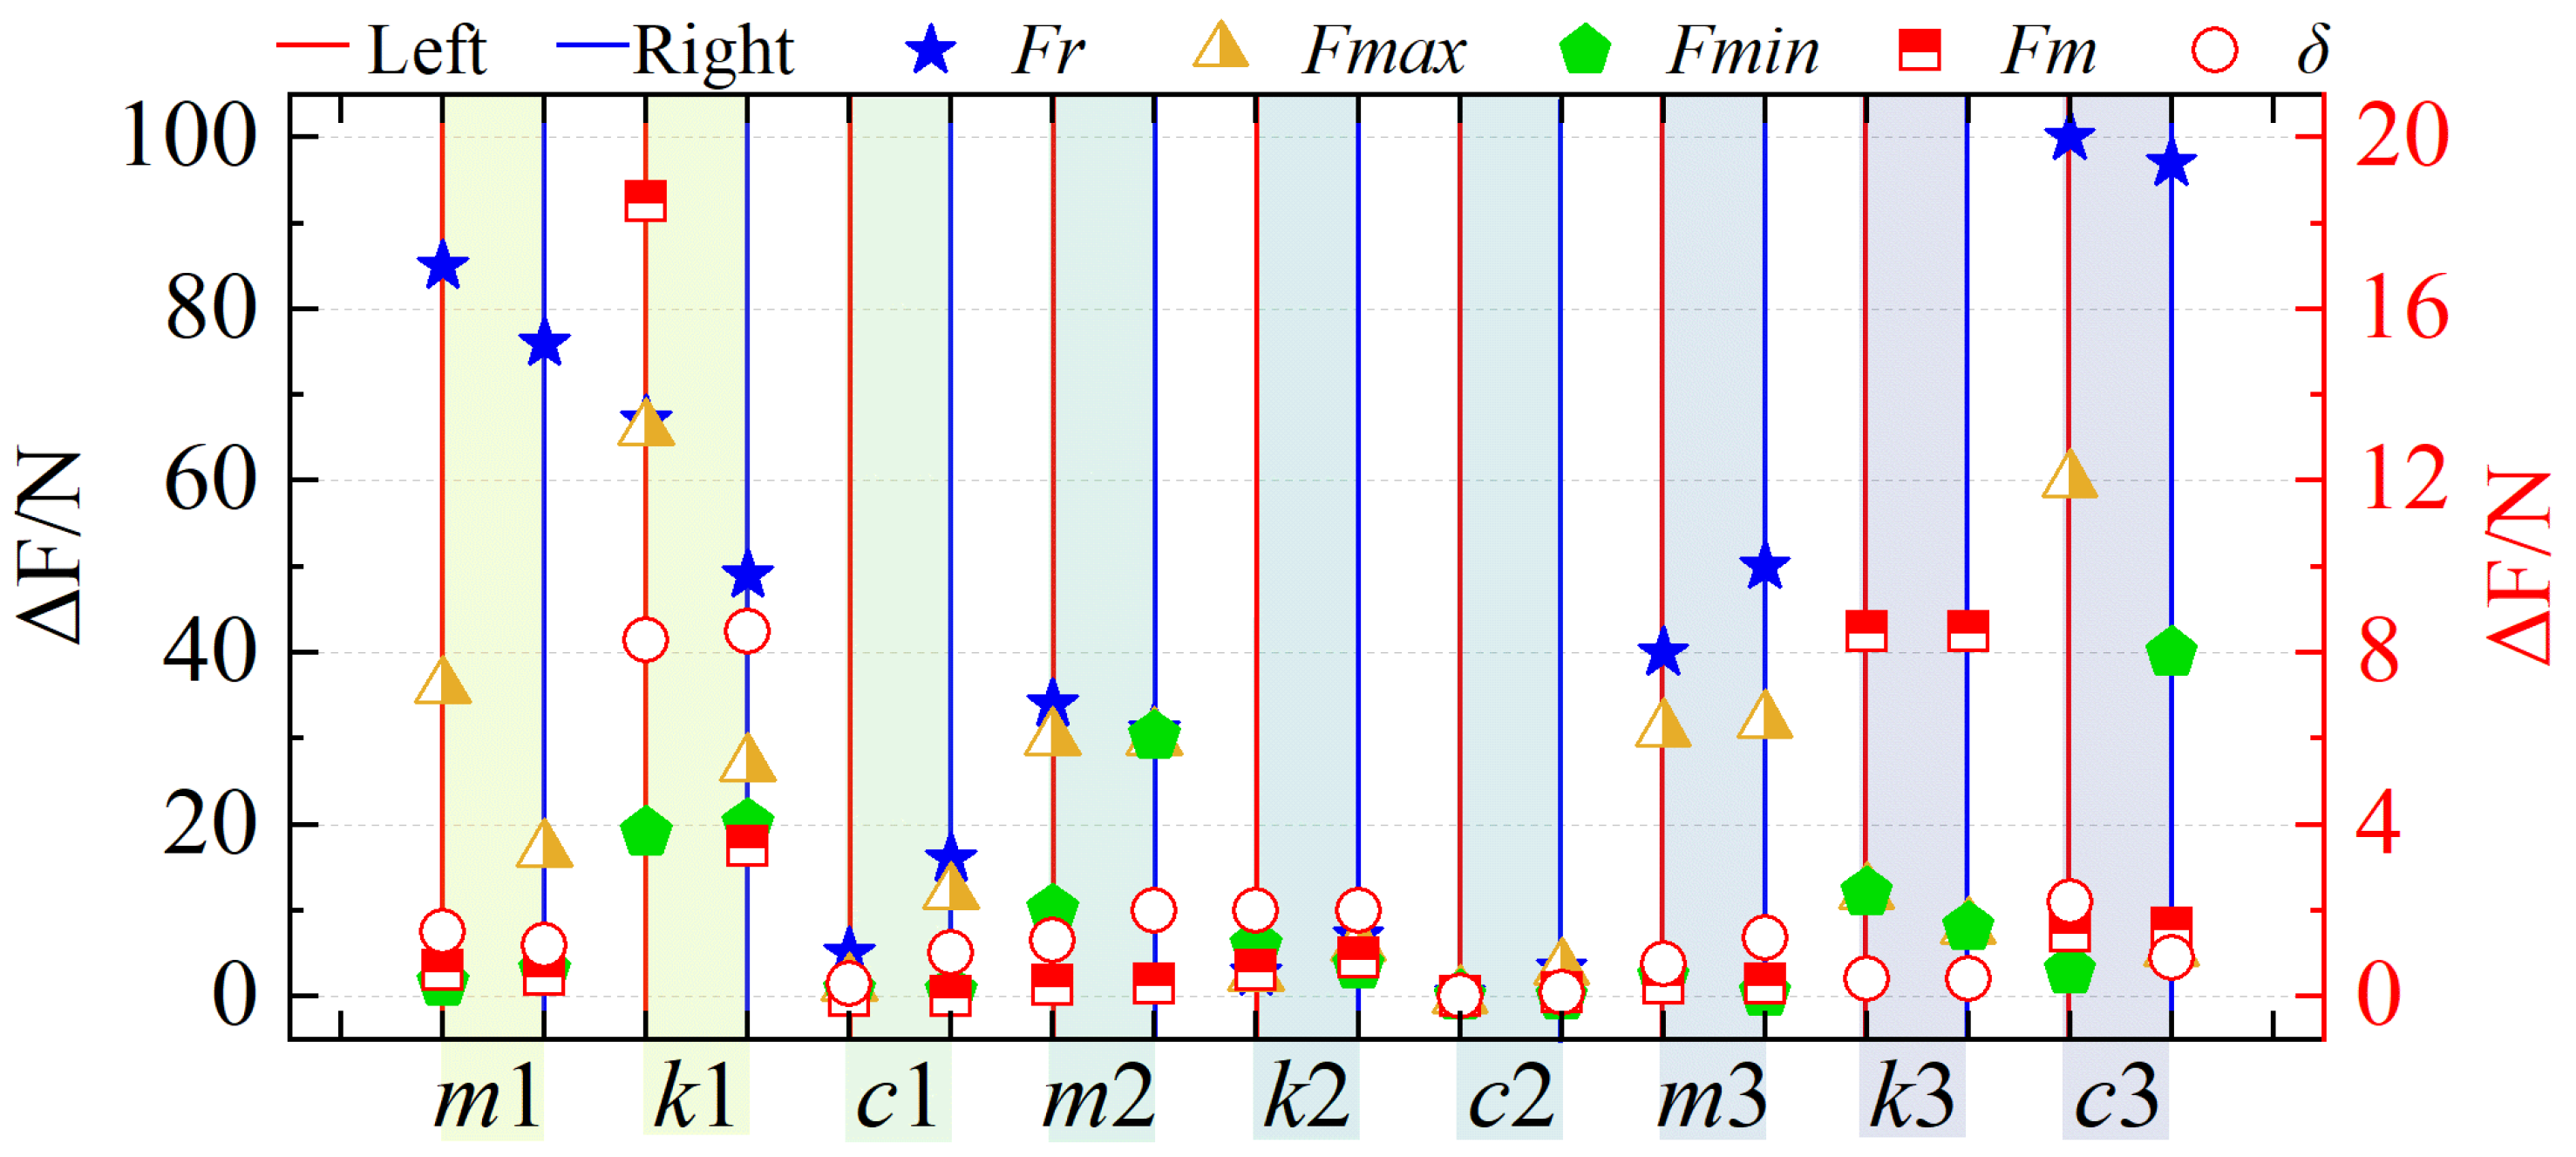
Sensitivity analysis quantifies how each pantograph parameter influences contact force fluctuations, helping to identify and eliminate parameters with negligible impact on system performance. Based on the variations shown in Figure 9, the ranges of each parameter within its respective value interval were compiled, and their relationships with the contact force evaluation metrics are illustrated in Figure 14.
As shown in Figure 14, the pantograph head stiffness (k1) exhibits the highest sensitivity within its value range, significantly affecting all evaluation metrics. In contrast, the pantograph head damping (c1), the upper frame stiffness (k2), and its damping coefficient (c2) show minimal changes, indicating low sensitivity. The sensitivity ranking of each pantograph parameter is summarized in Table 12.
Table 12 summarizes the parameters that have a relatively significant influence on each contact force evaluation metric. Parameters not included in the ranking are considered to have negligible effects. The following observations can be drawn from Table 12:
  • The lower frame damping (c3) has the most significant impact on the rising contact force (Fr), followed by the pantograph head mass (m1), which is clearly distinguishable from subsequent parameters. The pantograph head stiffness (k1) and the lower frame mass (m3) have comparable effects, while the influence of upper frame mass (m2), lower frame stiffness (k3), and pan-head damping (c1) is relatively minor, with k3 and c1 exhibiting similar levels. Therefore, optimizing the raising contact force should focus primarily on tuning c3 and m1.
  • The k1 and c3 exhibit the greatest influence on the maximum contact force (Fmax), while m2 and m3 have comparable but lesser impacts. Other parameters show progressively weaker effects. Since Fmax reflects the extreme conditions of pantograph–catenary interaction, k1 and c3 play a critical role in controlling it. Proper selection of these parameters is necessary to avoid excessive force that could damage components or insufficient force that could disrupt current collection.
  • The k1 and m2 are the dominant factors influencing the minimum contact force (Fmin), with significantly greater impact than k3, upper frame stiffness (k2), and c3. Maintaining Fmin within an appropriate range is essential for ensuring uninterrupted current collection. Optimizing k1 and m2 helps reduce the risk of contact loss due to insufficient force.
  • The average contact force (Fm) is most strongly affected by the k1, followed by k3, which shows a clear difference from the influence of c3. As Fm is a fundamental indicator of current collection performance, it is primarily governed by stiffness-related parameters such as k1 and k3. Adjusting these parameters can optimize Fm, balancing current quality and mechanical wear, and serving as a critical basis for parameter matching.
  • The standard deviation (δ) of contact force is most affected by k1, followed by k2. Other parameters (m2, c3, and m1) have similar but lesser effects, with the least impact observed from m3 relatively. Since δ reflects the stability of current collection, k1 plays a central role in minimizing force fluctuations. Optimizing k1 is therefore critical to improving dynamic current quality and reducing the risk of contact loss.

4. Conclusions

  • This study addresses the impact of road surface irregularities on pantograph–catenary interaction performance in electrified roads by developing a coupled dynamic model of the pantograph and catenary system. Road-induced excitation is integrated into the pantograph parameter optimization framework. Simulation results identify a new set of pantograph parameters that significantly improve contact force indicators under both 80 N and 110 N static contact forces, thereby enhancing system adaptability and robustness.
  • Sensitivity analysis under road excitation conditions revealed that pantograph head stiffness (k1) is the most critical factor affecting pantograph–catenary interaction, while head damping (c1), upper frame stiffness (k2), and upper frame damping (c2) were found to be insensitive. Among various evaluation metrics, the raising contact force (Fr) is most influenced by the lower frame damping (c3) and pantograph head mass (m1), with effects far exceeding those of other parameters. With the exception of k1 and lower frame stiffness (k3), other parameters had negligible influence on the average contact force (Fm). Moreover, only k1 showed a notable impact on the standard deviation (δ), underscoring its importance in ensuring stable current collection. This finding not only provides a theoretical basis for pantograph parameter design but also offers an important reference for engineering optimization of the power collection system in electrified roads.
Given the limited validation methods of the pantograph–catenary model in this study, future work will incorporate field measurements from a dedicated test section, providing a more comprehensive and reliable basis for model validation. At the same time, it is necessary for the electrified road community to gradually establish validation standards tailored to road-induced excitation characteristics.

Author Contributions

Conceptualization, L.Y. and W.Z.; methodology, L.Y.; software, W.Z.; validation, L.Y., H.J. and Y.M.; formal analysis, H.J. and Y.M.; investigation, L.Y. and S.H.; resources, W.Z. and H.J.; data curation, L.Y.; writing—original draft preparation, L.Y.; writing—review and editing, W.Z., H.J. and Y.M.; visualization, L.Y.; supervision, W.Z.; project administration, H.J. and Y.M.; funding acquisition, Y.M. All authors have read and agreed to the published version of the manuscript.

Funding

This research was funded by 1. Fundamental Research Funds For Central Public-Interest Scientific Institutions, Talent Development Program (Youth Innovation Project), Grant Number 2025-9039; 2. Research And Development Of Key Technologies For Safe And Efficient Power Supply Of The Test And Verification Platform For Electrified Road Transportation Systems, grant number 2024-C303” and “The APC was funded by Y.M.

Data Availability Statement

The data are unavailable due to privacy or ethical restrictions.

Conflicts of Interest

Author Sijun Huang was employed by the company Beijing CRRC CED Railway Electric Tech Company Limited. The company was not involved in the study design, collection, analysis, interpretation of data, the writing of this article or the decision to submit it for publication.

References

  1. Sundelin, H.; Gustavsson, M.G.H.; Tongur, S. The maturity of electric road systems. In Proceedings of the 2016 International Conference on Electrical Systems for Aircraft, Railway, Ship Propulsion and Road Vehicles & International Transportation Electrification Conference (ESARS-ITEC), Toulouse, France, 2–4 November 2016; IEEE: Piscataway, NJ, USA, 2016; pp. 1–5. [Google Scholar]
  2. Pei, Y.W.; Chen, F.; Ma, T.; Gu, G.H. A comparative review study on the electrified road structures: Performances, sustainability, and prospects. Structures 2024, 62, 106185. [Google Scholar] [CrossRef]
  3. Zheng, Z.D.; Liu, H.; Li, Y.D.; Xu, Z. Research on electrified road technology. China J. Highw. Transp. 2019, 32, 132–141. [Google Scholar]
  4. Correcher, A.; Ricolfe-Viala, C.; Tur, M.; Gregori, S.; Salvador-Muñoz, M.; Fuenmayor, F.J.; Gil, J.; Pedrosa, A.M. Hardware-in-the-Loop Test Bench for Simulation of Catenary–Pantograph Interaction (CPI) with Linear Camera Measurement. Sensors 2023, 23, 1773. [Google Scholar] [CrossRef]
  5. Lee, J.H.; Kim, Y.G.; Paik, J.S.; Park, T.W. Performance evaluation and design optimization using differential evolutionary algorithm of the pantograph for the high-speed train. J. Mech. Sci. Technol. 2012, 26, 3253–3260. [Google Scholar] [CrossRef]
  6. Pombo, J.; Ambrósio, J. Influence of pantograph suspension characteristics on the contact quality with the catenary for high speed trains. Comput. Struct. 2012, 110–111, 32–42. [Google Scholar] [CrossRef]
  7. Ambrósio, J.; Pombo, J.; Pereira, M. Optimization of high-speed railway pantographs for improving pantograph-catenary contact. Theor. Appl. Mech. Lett. 2013, 3, 013006. [Google Scholar] [CrossRef]
  8. Jiang, J.; Liu, Z.G.; Lu, X.B.; Duan, P.C.; Song, Y. Study on matching between pantograph parameters and dropper spacing considering amplitude-frequency characteristics of pantograph. J. Vib. Shock 2016, 35, 134–139. [Google Scholar]
  9. Qi, W.Y.; Wang, J.W.; Zhang, S.Y.; Huang, Z. Sensitivity analysis and optimal design of pantograph parameters in urban rail transit. Noise Vib. Control 2022, 42, 190–195, 250. [Google Scholar]
  10. Wu, M.Z.; Liu, Y.; Xu, X.H. Sensitivity analysis and optimization of dynamic parameters in high-speed pantograph-catenary systems. Acta Mech. Sin. 2021, 53, 75–83. [Google Scholar]
  11. Wang, H.L.; Zheng, D.Y.; Huang, P.; Yan, W.Y. Design optimisation of railway pantograph-catenary systems with multiple objectives. Veh. Syst. Dyn. 2023, 61, 2953–2975. [Google Scholar] [CrossRef]
  12. Wu, M.Z.; Xu, X.H.; Yan, Y.Z. Multi-parameter joint optimization for double-strip high-speed pantographs to improve pantograph-catenary interaction quality. Acta Mech. Sin. 2022, 38, 521344. [Google Scholar] [CrossRef]
  13. Chen, K.; Song, Y.; Lu, X.B.; Duan, F.C. Sensitivity Analysis and Optimisation of Key Parameters for Railway Rigid Overhead System and Pantograph. Sustainability 2023, 15, 6803. [Google Scholar] [CrossRef]
  14. Kim, J.W.; Yu, S.N. Design variable optimization for pantograph system of high-speed train using robust design technique. Int. J. Precis. Eng. Manuf. 2013, 14, 267–273. [Google Scholar] [CrossRef]
  15. Zhou, N.; Zhang, W. Investigation on dynamic performance and parameter optimization design of pantograph and catenary system. Finite Elem. Anal. Des. 2011, 47, 288–295. [Google Scholar] [CrossRef]
  16. Wang, Y.; Liu, Y.L.; Chen, X.Q. Parameters Matching of Multi-body Pantograph Considering Amplitude and Frequency Characteristics. Mech. Sci. Technol. Aerosp. Eng. 2023, 42, 1409–1415. [Google Scholar]
  17. Liu, Y.; Wu, M.Z.; Lu, W.; Wu, Z.G. Multiple dynamics parameters optimization analysis of high-speed pantograph. J. Hefei Univ. Technol. (Nat. Sci.) 2023, 46, 670–677. [Google Scholar]
  18. Chen, Y.; Lu, J.; Luo, Q.; Zhang, W.; Zhang, C.Z.; Mei, G.M. Study on dynamic characteristic and parameter optimization of pantograph head with flexible model taken into consideration. J. Mach. Des. 2025, 42, 36–43. [Google Scholar]
  19. Zhou, N.; Li, R.P.; Zhang, W.H. Modeling and simulation of catenary system based on the negative sag method. J. Traffic Transp. Eng. 2009, 9, 28–32. [Google Scholar]
  20. Guan, J.F.; Wu, J.Q. Establishment and validation of dynamic simulation model of pantograph-catenary system. J. Railw. Sci. Eng. 2017, 14, 2444–2451. [Google Scholar]
  21. Zhang, X.; Wang, T.S. Computational Dynamics; Tsinghua University Press: Beijing, China, 2007. [Google Scholar]
  22. EN50318:2018; Railway Applications–Current Collection Systems-Validation of Simulation of the Dynamic Interaction between Pantograph and Overhead Contact Line. European Parliament: Strasbourg, France, 2018.
  23. Zhou, N.; Zhi, X.S.; Zhang, J.; Zheng, W.; Luo, C.J.; Zhang, W.H. Friction and Wear Performance of Pantograph-Catenary System in Electrified Railways: State of the Art. J. Southwest Jiaotong Univ 2024, 59, 990–1005, 1022. [Google Scholar]
  24. Zhang, Y.Y.; Li, C.H.; Pang, X.J.; Song, C.F.; Ni, F.; Zhang, Y.Z. Evolution processes of the tribological properties in pantograph/catenary system affected by dynamic contact force during current-carrying sliding. Wear 2021, 477, 1–9. [Google Scholar] [CrossRef]
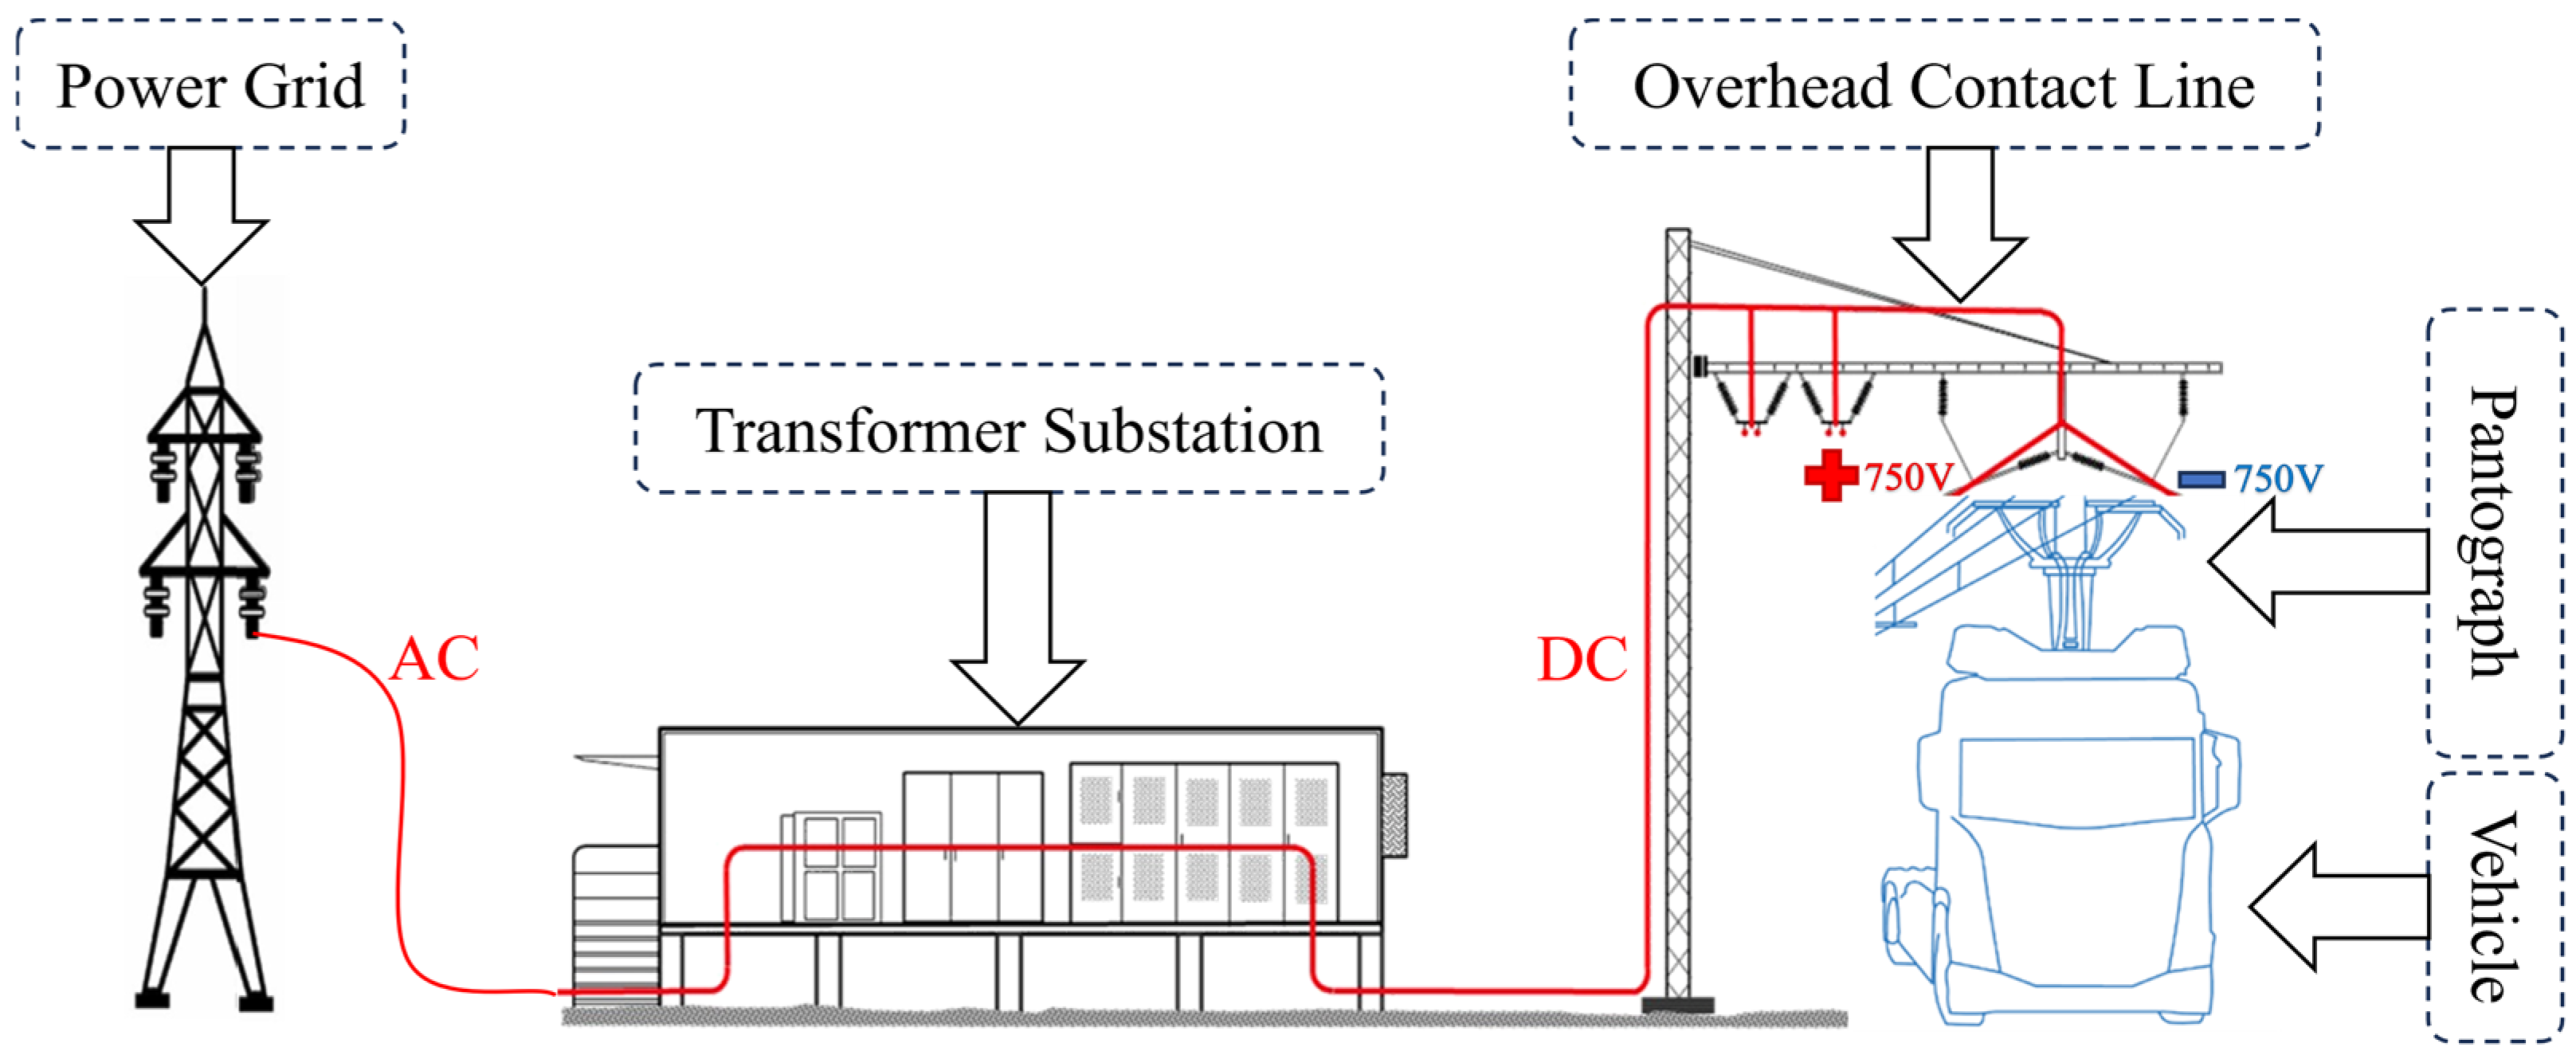
Figure 1. Electrified Roads schematic diagram.
Wevj 16 00535 g001
Figure 2. Simplified diagram of railway pantograph parameters.
Wevj 16 00535 g002
Figure 3. Finite element model schematic of the overhead catenary system for electrified roads.
Wevj 16 00535 g003
Figure 4. Five-mass model of the single-arm dual pantograph.
Wevj 16 00535 g004
Figure 5. Pantograph–catenary interaction model for electrified roads under uneven road conditions.
Wevj 16 00535 g005
Figure 6. Comparison of pantograph–catenary contact force before and after applying base excitation.
Wevj 16 00535 g006
Figure 7. Variation curves of pantograph head equivalent parameters.
Wevj 16 00535 g007
Figure 8. Variation curves of upper frame equivalent parameters.
Wevj 16 00535 g008
Figure 9. Variation curves of lower frame equivalent parameters.
Wevj 16 00535 g009
Figure 10. Comparison of pantograph parameters before and after optimization.
Wevj 16 00535 g010
Figure 11. Comparison of contact forces before and after optimization at 110 N static contact force.
Wevj 16 00535 g011
Figure 12. Comparison of contact forces before and after optimization at 40 km/h.
Wevj 16 00535 g012
Figure 13. Comparison of lifted displacements before and after optimization.
Wevj 16 00535 g013
Figure 14. Relationship Between Different Parameters and Evaluation Metric.
Wevj 16 00535 g014
Table 1. Electrical Parameters of Electrified Roads.
Operating ParametersValueOperating ParametersValue
Catenary VoltageDC1500 VOn-board Battery Capacity100 kWh
Loop Resistance0.15 Ω/kmSubstation Power4 MW
Line current1100 APantograph current240 A
Table 2. Comparison of Key Differences Between Electrified Road and Railways.
Road Surface SmoothnessVehicle Deformation LevelPantograph–Catenary Design
Railway SystemWevj 16 00535 i001Wevj 16 00535 i002Wevj 16 00535 i003
High smoothnessRelatively smallSingle pantograph–single wire
Electrified Road
System
Wevj 16 00535 i004Wevj 16 00535 i005Wevj 16 00535 i006
Inevitably unevenRelatively largeDual pantograph–dual wire
Table 3. Equivalent parameters of the pantograph.
Pantograph Head
Parameter
ValueUpper Frame
Parameter
ValueLower Frame
Parameter
Value
m1 (kg)7.94m2 (kg)8.22m3 (kg)5.9
k1 (N/m)6650k2 (N/m)13,181k3 (N/m)74
c1 (N·s/m)85.31c2 (N·s/m)11.9c3 (N·s/m)67.41
Table 4. Parameters of the catenary model.
Contact WireMessenger WireDropper
Young’s modulus (GPa)120Young’s modulus (GPa)120Young’s modulus (GPa)105
Poisson’s ratio0.3Poisson’s ratio0.3Poisson’s ratio0.3
Linear density (kg/m)1.35Linear density (kg/m)1.07Linear density (kg/m)0.089
Tension (kN)20Tension (kN)16Catenary span (m)50
Cross-sectional Area(m2)151 × 10−6Cross-sectional Area(m2)147 × 10−6Height between wires (m)1.6
Dropper spacing (m)5, 8, 8, 8, 8, 8, 5
Table 5. Contact force evaluation before and after base excitation.
Static Contact Force: 80 N
Speed: 60 km/h
Without ExcitationWith Excitation
Pantograph (N)Left Pantograph (N)Right Pantograph (N)
Contact Force during Raising (N)91.14155.74128.51
Average Contact Force (N)79.1369.8680.98
Standard Deviation (N)3.2521.9621.74
Maximum Contact Force (N)92.85155.74127.53
Minimum Contact Force (N)72.5522.6221.41
Contact Loss Rate (%)000
Table 6. Parameter ranges for pantograph modeling.
Pantograph Head
Parameter
RangeUpper Frame
Parameter
RangeLower Frame
Parameter
Range
m1 (kg)3~12m2 (kg)5~14m3 (kg)3~18
k1 (N/m)3000~16,000k2 (N/m)8000~18,000k3 (N/m)0.1~130
c1 (N·s/m)0~100c2 (N·s/m)0~50c3 (N·s/m)10~210
Table 7. Optimization logic for each parameter.
Optimization GoalConsideration ItemsOptimization Trend
1. Performance IndicatorsMaximum contact force↓ Lower is better
Minimum contact force↓ Lower is better
Contact Force during Raising ↓ Lower is better
Standard deviation of contact force↓ Lower is better
2. Balancing Left–Right ContactLeft Pantograph Head
Maximum contact force↓ Lower is better
Contact Force during Raising↓ Lower is better
Average contact force↑ Higher is better
Right Pantograph Head
Maximum contact force↑ Slight increase
acceptable
Contact Force during Raising ↑ Slight increase
acceptable
3. Engineering FeasibilityCost of production and maintenanceConsider economical viability
Table 8. Optimized pantograph parameter values.
Pantograph Head ParameterOptimized ValueUpper Frame
Parameter
Optimized ValueLower Frame
Parameter
Optimized Value
m1 (kg)6.5m2 (kg)6m3 (kg)14
k1 (N/m)3000k2 (N/m)8000k3 (N/m)0.1
c1 (N·s/m)85.31c2 (N·s/m)11.9c3 (N·s/m)210
Table 9. Comparison of contact force evaluation metrics before and after optimization.
Static Contact Force: 80 N
Speed: 60 km/h
Left Pantograph Head (N)Right Pantograph Head (N)
BeforeAfterImprovementBeforeAfterImprovement
Contact Force during Raising (N)155.74102.3434.29%128.51103.9619.11%
Average Contact Force (N)69.8675.217.61%80.9883.012.51%
Standard Deviation (N)21.9616.2026.23%21.7416.3424.84%
Maximum Contact Force (N)155.74128.1717.7%128.51119.706.85%
Minimum Contact Force (N)22.6239.5474.89%21.4130.4843.36%
Contact Loss Rate (%)000%000%
Table 10. Comparison of contact force evaluation metrics before and after optimization at 110 N static contact force.
Static Contact Force: 110 N
Speed: 60 km/h
Left Pantograph Head (N)Right Pantograph Head (N)
BeforeAfterImprovementBeforeAfterImprovement
Contact Force during Raising (N)196.22127.1035.22%166.56141.7414.90%
Average Contact Force (N)97.96105.127.31%109.05112.773.41%
Standard Deviation (N)22.9717.2724.81%22.6417.4423.0%
Maximum Contact Force (N)196.22168.7514.00%166.56152.738.31%
Minimum Contact Force (N)49.4154.099.47%51.8745.08−13.1%
Contact Loss Rate (%)000%000%
Table 11. Comparison of contact force evaluation metrics before and after optimization at 40 km/h.
Static Contact Force: 80 N
Speed: 40 km/h
Left Pantograph Head (N)Right Pantograph Head (N)
BeforeAfterImprovementBeforeAfterImprovement
Contact Force during Raising (N)133.91104.4922.04%87.9878.0911.24%
Average Contact Force (N)69.3675.599.00%80.6983.323.26%
Standard Deviation (N)21.2314.8429.91%20.5914.5629.29%
Maximum Contact Force (N)142.25117.4617.43%147.07112.6623.04%
Minimum Contact Force (N)30.4543.2642.07%25.2935.4239.98%
Contact Loss Rate (%)000%000%
Table 12. Sensitivity ranking of pantograph parameters.
Evaluation MetricsSensitivity Ranking of Parameters
Contact Force during Raisingc3 > m1k1m3 > m2 > k3c1
Maximum Contact Forcek1 > c3 > m2m3 > m1 > k3
Minimum Contact Forcek1m2 > k3 > k2c3
Average Contact Forcek1 > k3c3
Standard Deviationk1k2 > m2c3m1 > m3
Disclaimer/Publisher’s Note: The statements, opinions and data contained in all publications are solely those of the individual author(s) and contributor(s) and not of MDPI and/or the editor(s). MDPI and/or the editor(s) disclaim responsibility for any injury to people or property resulting from any ideas, methods, instructions or products referred to in the content.