1. Introduction
In recent years, the increasing frequency of extreme weather events and natural disasters has posed severe challenges to the secure and stable operation of power distribution networks (PDNs) [
1,
2,
3]. These events often lead to large-scale power outages, with devastating impacts on critical infrastructure and public services. For instance, in April 2025, a massive blackout in Spain and Portugal left approximately 50 million people without electricity, severely disrupting transportation, healthcare, and communication systems. Therefore, enhancing the resilience of PDNs and enabling rapid power restoration in the aftermath of disasters has become a vital focus of modern distribution system research.
By 2030, the global number of electric vehicles (EVs) is projected to reach 120 million [
4]. Vehicle-to-Grid (V2G) technology has demonstrated great potential in improving electricity demand management, mitigating load fluctuations, and enhancing the sustainability of smart grids [
5]. Consequently, leveraging EVs and V2G technology to enable rapid post-disaster power recovery and support critical loads has become a crucial research direction for enhancing PDN resilience.
With the increasing frequency of extreme weather events such as typhoons, earthquakes, and floods, the concept of “resilience” has been introduced into the operation of PDNs. PDN resilience refers to the ability of the system to anticipate the development of extreme events, prepare resources in advance, adjust topology and operation strategies, mitigate the impacts of disasters, and recover services rapidly [
6,
7]. In China, the physical infrastructure of the power distribution network—including power lines, transformers, and various types of switches—is owned by the power supply bureau, which is also responsible for their operation and maintenance, as well as post-disaster service restoration. Restoring power after disasters is considered both a legal obligation and an important performance metric for the power supply bureau. The electricity supply to all types of charging stations is guaranteed by the power supply bureau; however, the ownership and daily operation of these charging stations typically belong to third-party operators. Some of these third-party companies generally have agreements with the power supply bureau to coordinate and support power supply as needed during emergency or resilience-oriented operations. This enables V2G resources to contribute to disaster recovery, even without direct utility ownership.
According to [
8], the resilience process of a PDN can generally be divided into four stages: pre-event, degradation, fault isolation, and service restoration. The pre-event stage mainly includes resource allocation and network topology optimization [
9,
10]. The degradation and fault isolation stages are relatively short and are combined in this paper as a single phase. This phase refers to the period immediately after the disaster, when the power utility has not yet started fault repairs [
11,
12], and is the main focus of this study. The service restoration stage refers to the gradual repair of faults and recovery of supply by the utility company [
13]. In Ref. [
14], mainstream resilience evaluation methods primarily use load loss as the assessment metric, typically based on the assumption that load conditions remain constant within each phase. However, such static assessments overlook the dynamic evolution of resilience over time and fail to fully capture the variations in power supply performance during different stages. In resilience assessment, it is often necessary to jointly consider the reliability of infrastructure systems. For example, the recent review [
15] provides a comprehensive overview of applying graph neural networks (GNNs) to the reliability and resilience evaluation of critical infrastructure systems, highlighting their capability to capture potential cascading effects. Current mainstream resilience evaluation methods primarily use load loss as the assessment metric, typically based on the assumption that load conditions remain constant within each phase. However, such static assessments overlook the dynamic evolution of resilience over time and fail to fully capture the variations in power supply performance during different stages. Recent studies have explored multi-resource coordination to enhance PDN resilience. For instance, Ref. [
16] considers the integration of renewable energy, energy storage, and V2G within a two-stage stochastic programming framework, but it does not address the siting problem of V2G charging stations. Similarly, another work [
17] formulates a two-stage stochastic MILP model that coordinates investments in line hardening, distributed generation, mobile emergency generators, and switching devices, while explicitly accounting for uncertainties in wind fields, line damage, and load fluctuations, thereby reducing post-event recovery costs and improving resilience. Compared with these approaches, our study explicitly incorporates the siting and sizing of V2G charging stations into the resilience enhancement framework, and further quantifies resilience through the proposed Resilience Entropy metric, offering a new perspective on the spatial-temporal allocation of V2G resources.
With the growing number of EVs, their potential as mobile energy storage resources has attracted increasing attention. In particular, supported by charging infrastructure with V2G capabilities, EVs can serve as controllable backup power sources during post-disaster periods, supplying electricity to local areas or critical loads [
18]. Recent studies and real-world cases also provide evidence of EV owners’ willingness to participate in V2G during disaster conditions. For instance, researchers at the Australian National University (ANU) demonstrated in a February 2024 outage event that 16 EVs supplied a total of 107 kW of reverse power to the grid via V2G, successfully sustaining critical loads for several hours [
19]. Survey-based evidence further indicates strong user acceptance: one study reports that 78% of EV owners are willing to participate in V2G during disasters, with response rates exceeding 90% when incentives are set at or above 0.5/kWh [
20]. In addition, Ref. [
21] investigated the role of existing charging stations in post-disaster support, showing that, with large-scale user participation, V2G can achieve superior restoration performance compared to mobile energy storage systems (MESs). These findings collectively suggest that EV-based resilience services are both technically feasible and socially acceptable, thereby supporting the practical applicability of V2G-enabled charging stations in disaster recovery. However, due to technical and cost limitations, most existing charging stations are still unidirectional and have not been planned with post-disaster support in mind. As a result, the full potential of V2G reverse power supply has not been realized.
In recent years, various studies have focused on charging station siting and construction. Ref. [
22] has addressed EV charging station siting by incorporating multiple spatial, environmental, and technical criteria—such as land use, traffic flow, renewable resources, and grid accessibility—through a GIS-based multi-criteria decision-making framework. Ref. [
23] considered uncertainties in EV inflow, charging port availability, and queueing time when addressing the Charging Station Siting and Sizing Problem (CSSSP), with the objective of minimizing unsatisfied charging demand. Some research built PV–storage–charging systems and aimed to maximize EV owner profits when planning charging station locations [
24]. Others focused on the dynamic matching of photovoltaic generation and charging demand, balancing economic performance and energy efficiency in station deployment [
25]. The mismatch between supply and demand of shared EV (SEV) charging infrastructure has also been studied [
26]. Moreover, human behavioral factors are often considered in planning, such as arrival/departure times, trip purposes, parking duration, walking distance, and willingness to participate in V2G [
27,
28]. Some works addressed grid and traffic constraints to minimize total cost in station siting [
29], while others adopted bilevel optimization to improve power system flexibility by determining optimal locations and sizes of charging stations [
30]. In terms of charging efficiency, some studies aimed to reduce user waiting time during siting decisions [
31], while others built PV–storage–charging regulation networks to minimize power losses in distribution systems [
32].
However, these studies generally overlook the potential of V2G-enabled stations to support post-disaster power restoration. The lack of modeling for V2G reverse supply functions limits the role of EVs in enhancing the resilience of distribution networks.
To address the aforementioned research gap, this paper proposes a resilience enhancement optimization model for disaster scenarios. A unified framework is established to jointly optimize the siting of V2G charging stations and the reconfiguration of PDN topology via tie-lines. Moreover, a novel metric called “Resilience Entropy” is introduced to dynamically quantify the recovery process from both temporal and spatial perspectives, capturing the evolution of supply satisfaction at each node. To handle the inherent uncertainty of disaster events, the proposed framework adopts a Monte Carlo-based scenario generation method, where probabilistic line failure rates are used to simulate multiple outage scenarios.
On this basis, a multi-objective optimization model is formulated, jointly considering V2G charging stations siting, circuit breaker (CB) operations, and network reconfiguration. To enhance the adaptability of the model under uncertain disaster scenarios, a probabilistic approach is adopted to describe the spatiotemporal uncertainty of electric vehicle behavior, thereby improving the model’s applicability and effectiveness in real-world conditions. The main contributions of this paper are as follows:
- 1.
A novel resilience metric—Resilience Entropy—is proposed. This metric is constructed based on the power supply satisfaction degree S of each node over time, incorporating a time-weighted factor to dynamically reflect the characteristics of the restoration process. Compared to traditional static resilience metrics centered on load loss, Resilience Entropy enables a more comprehensive and dynamic evaluation of restoration strategies.
- 2.
A resilience-oriented optimization model is developed for power distribution network (PDN) recovery under disaster scenarios, jointly considering the siting of V2G charging stations and the reconfiguration of PDN topology. Guided by the proposed Resilience Entropy, the model explicitly describes fault propagation and isolation mechanisms, while incorporating the spatiotemporal uncertainty of EV behaviors and post-disaster operational constraints. This supports coordinated energy supply and resilience enhancement.
- 3.
The effectiveness and policy sensitivity of the proposed model are validated through numerical simulations. The case studies demonstrate the model’s ability to improve post-disaster power supply capacity and recovery efficiency. Furthermore, the influence of varying EV owner participation willingness in V2G activities on charging station siting and support capabilities is analyzed, offering practical insights for policy formulation.
2. Location and Operation Model of V2G Charging Stations
In our study, the considered disasters mainly refer to extreme weather events in Southern China that have historically caused widespread distribution network outages, such as typhoons, heavy rainfall and flooding, and secondary disasters like landslides. While conventional approaches such as network hardening (e.g., power lines reinforcement, pole replacement) and the deployment of mobile energy storage (MES) or diesel generators are widely adopted, they often involve high investment costs and limited flexibility. In contrast, V2G-enabled charging stations provide a complementary solution, leveraging existing EV resources to supply critical loads with rapid and distributed support during the restoration phase.
Modern V2G-enabled chargers allow real-time power adjustment. If the total V2G discharge from EVs temporarily exceeds the power system’s demand, the surplus can either be curtailed by reducing the discharge output or redirected to charge other EVs that require energy. Conversely, if the available power is insufficient, the control strategy prioritizes supply to critical loads. This mechanism provides operational flexibility to balance varying EV contributions against actual resilience demand.
2.1. Investment Cost and Installation Limit Constraints of V2G Stations
To enhance the energy support capability of the PDN during post-disaster restoration, this study considers the deployment of V2G-enabled charging stations at critical nodes. A binary decision variable is introduced to indicate whether a V2G station is installed at node i, where denotes the presence of a V2G facility, and otherwise.
In our study, the investment cost of constructing V2G-enabled charging stations is generally assumed to be borne by third-party charging service companies, which are responsible for infrastructure deployment and daily operation. Meanwhile, the compensation for EV owners participating in V2G services—particularly during disaster recovery—is typically provided by the power supply bureau, as it is responsible for ensuring post-disaster power restoration.
The investment cost of a V2G charging station primarily depends on its supported maximum reverse power output. Accordingly, the cost model is formulated as follows in Equation (
1):
where
represents the unit investment cost coefficient, and
denotes the maximum reverse discharge power that the V2G station at node
i can support.
Considering the high cost of V2G infrastructure, and in order to keep the investment within budgetary constraints while ensuring feasibility, the total number of newly installed V2G stations is limited by the following constraint (
2):
where
indicates the maximum allowable number of V2G station installations. This constraint ensures that the V2G facilities are deployed only at strategically selected nodes, thus balancing system resilience enhancement with economic investment control.
2.2. Operational Constraints of V2G Charging Stations
During real-time scheduling, the operating status of V2G charging stations may vary across time periods and tasks. Some stations may be in discharge mode to support grid recovery, while others may be charging EVs. Since each charging connector can only operate in either charging or discharging mode at any given time, the actual charging and discharging power at node
i must be constrained by the maximum capacity of the station, as expressed below:
where
and
denote the total charging and discharging power at node
i at time
t, respectively. Equations (
3) and (
4) define the upper bounds for the charging power
and discharging power
at node
i and time
t, both constrained by the station’s capacity
. While each charging port has mutually exclusive operating modes, the station-level power can be flexibly scheduled to dynamically respond to grid demands.
In practice, the charging/discharging capability is also constrained by the number of connected EVs and their individual power capacities. To reflect this, we define the feasible power range as follows:
The maximum charging power at node
i and time
t depends on the number of EVs in charging mode and their rated power:
where
denotes the number of EVs charging at time
t, and
is the rated charging power of vehicle
j. Since power flow constraints must be satisfied and V2G systems can monitor and dispatch each EV individually, a batch charging strategy is employed when total demand exceeds grid capacity. Hence, the inequality form is adopted.
Similarly, the maximum discharging power is subject to both the station’s technical limit and the total capability of discharging EVs:
For linear optimization purposes, this constraint is relaxed as:
where
is the number of EVs discharging at time
t,
denotes the discharging power of vehicle
j, and
is the station’s maximum discharge capacity.
This modeling approach enables a more accurate representation of EV group flexibility during disaster recovery and highlights their auxiliary role in supporting the resilience of the distribution network.
2.3. Behavioral Modeling of Electric Vehicles
During post-disaster restoration, the number of EVs at each node varies dynamically over time. To capture this behavior, we model three key aspects of EV dynamics at each node and time step: arrival, participation in V2G services, and departure behavior.
Let
denote the number of EVs arriving at node
i at time
t, which follows a truncated normal distribution (restricted to non-negative integers):
where
and
are the mean and standard deviation of EV arrivals at node
i, respectively.
Among the arriving vehicles, a fraction
is assumed to participate in V2G services. The number of new V2G participants
is given by
The remaining vehicles, which only perform charging
, are
The temporal evolution of V2G-participating vehicles is modeled as
where
represents the number of V2G vehicles at node
i and time
t, and
is the number of vehicles departing from V2G participation.
Considering the dependency of vehicle departure behavior on state of charge (SOC), we define the average SOC of V2G vehicles at node
i and time
t as
. The probability of departure is then
here,
is the base departure probability and
is a sensitivity coefficient indicating that lower SOC increases the likelihood of departure.
Accordingly, the number of departing V2G vehicles
follows a binomial distribution:
For non-V2G charging vehicles, the departure behavior is also modeled using a truncated normal distribution:
where
and
denote the expected value and standard deviation of departures for charging-only EVs at node
i.
The population of charging-only EVs
then evolves as
In summary, this modeling framework captures the dynamic EV behavior during disaster recovery by integrating stochastic arrival patterns, V2G participation rates, and SOC-dependent departure dynamics. It provides a reliable foundation for subsequent scheduling and optimization tasks.
2.4. Assumptions on Public EV Charging Post-Disaster
During post-disaster restoration, the number of EVs at each node varies dynamically over time. To capture this behavior, we model stochastic arrival patterns, V2G participation rates, and SOC-dependent departure dynamics, which provide a reliable foundation for subsequent scheduling and optimization tasks.
It is worth noting that, under normal operating conditions, public fast-charging stations are typically used for short-duration, in-transit charging, whereas residential or workplace charging points allow longer connection times that are more suitable for V2G. However, in the disaster recovery context considered in this paper, the behavioral modeling departs from conventional daily commuting assumptions. Instead, EVs already present at or mobilized to designated charging stations may intentionally remain to provide resilience services. Through utility-operator coordination platforms (e.g., the “One-Grid Service” of Hainan Province affiliated with China Southern Power Grid), charging operators can monitor real-time usage and remotely dispatch V2G-enabled chargers to supply critical loads, thereby temporarily transforming some public charging sites into resilience hubs.
In this framework, we do not assume that random in-transit EV drivers will immediately participate, but rather that available EVs are aggregated and dispatched as part of the resilience strategy. While stationary energy storage devices also represent a valuable resilience option, EVs provide a widely distributed, mobile, and flexible resource that can be leveraged immediately after disasters.
5. Case Studies
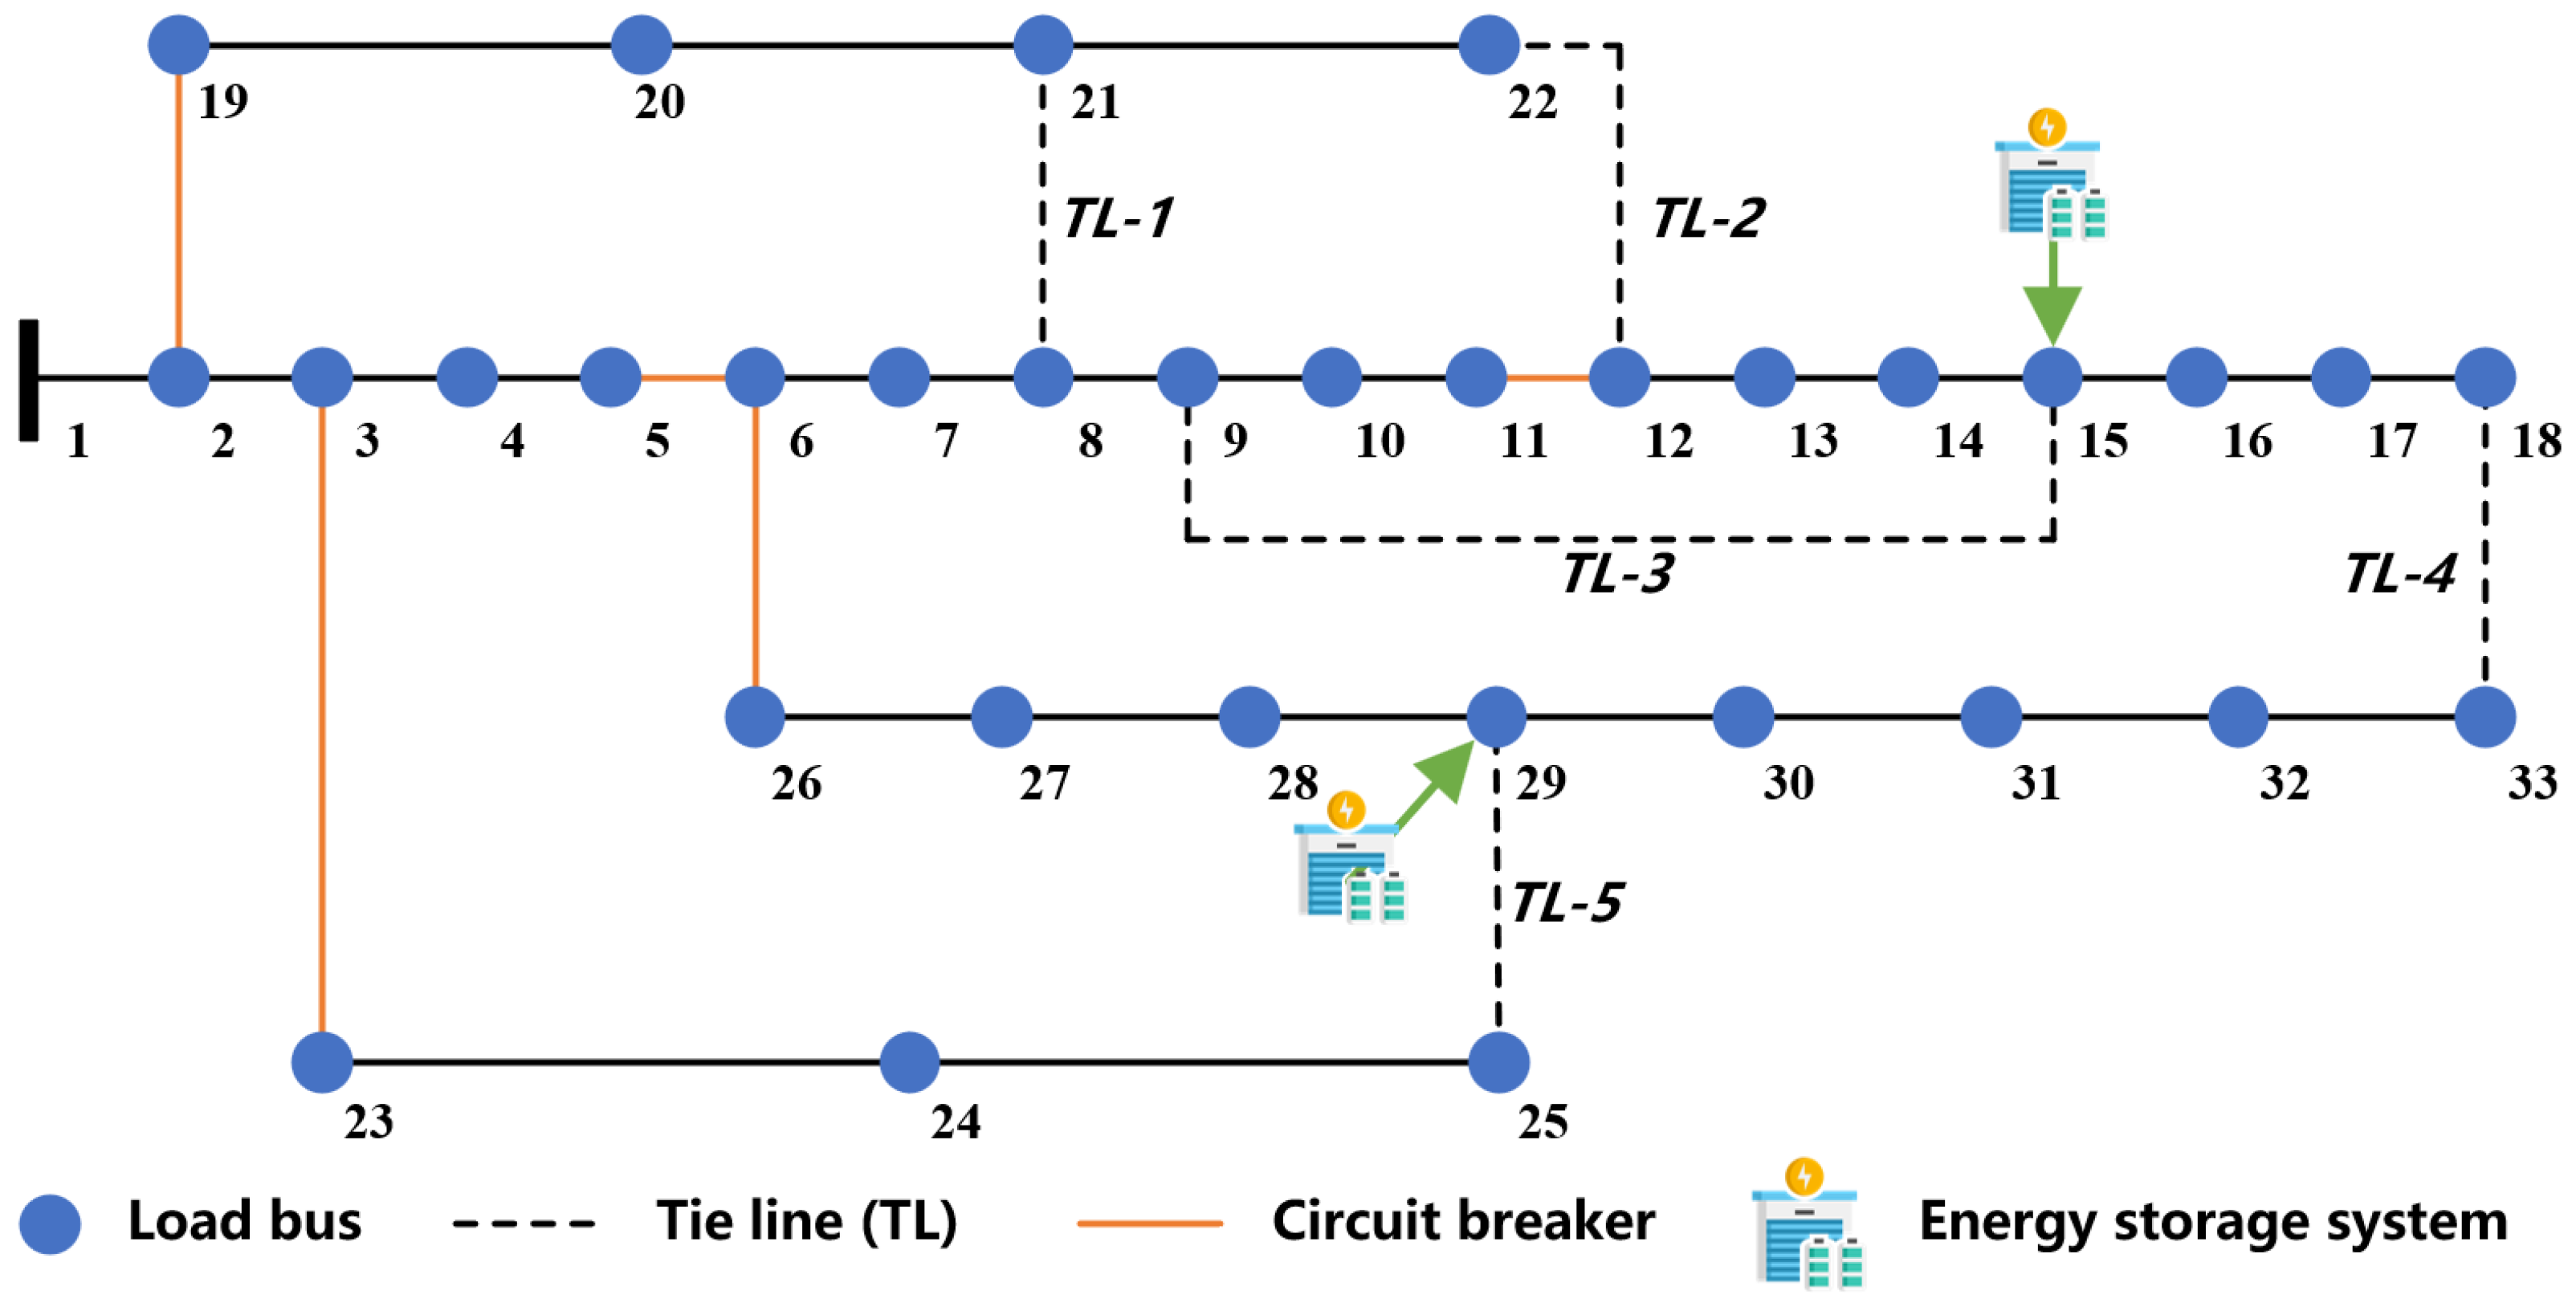
To verify the effectiveness of the proposed methodology, the classical IEEE-33 bus distribution system is adopted as a test case. The initial topology is illustrated in
Figure 2. This system comprises 37 distribution lines, with tie-lines strategically deployed to enable network reconfiguration when necessary. In addition, circuit breakers are installed at key locations within the network, allowing for rapid fault isolation upon detecting abnormal currents, thus effectively preventing fault propagation. The proposed optimization model is formulated as a mixed-integer nonlinear programming (MINLP) problem, which is implemented and solved using Gurobi 9.5.2 on a standard desktop computer with Intel i5-12500H CPU and 16 GB of RAM.
5.1. Case Study Results and Analysis
The simulation assumes a disaster recovery horizon of 3 h, with system status sampled every 15 min. The participation willingness of EV owners in V2G services
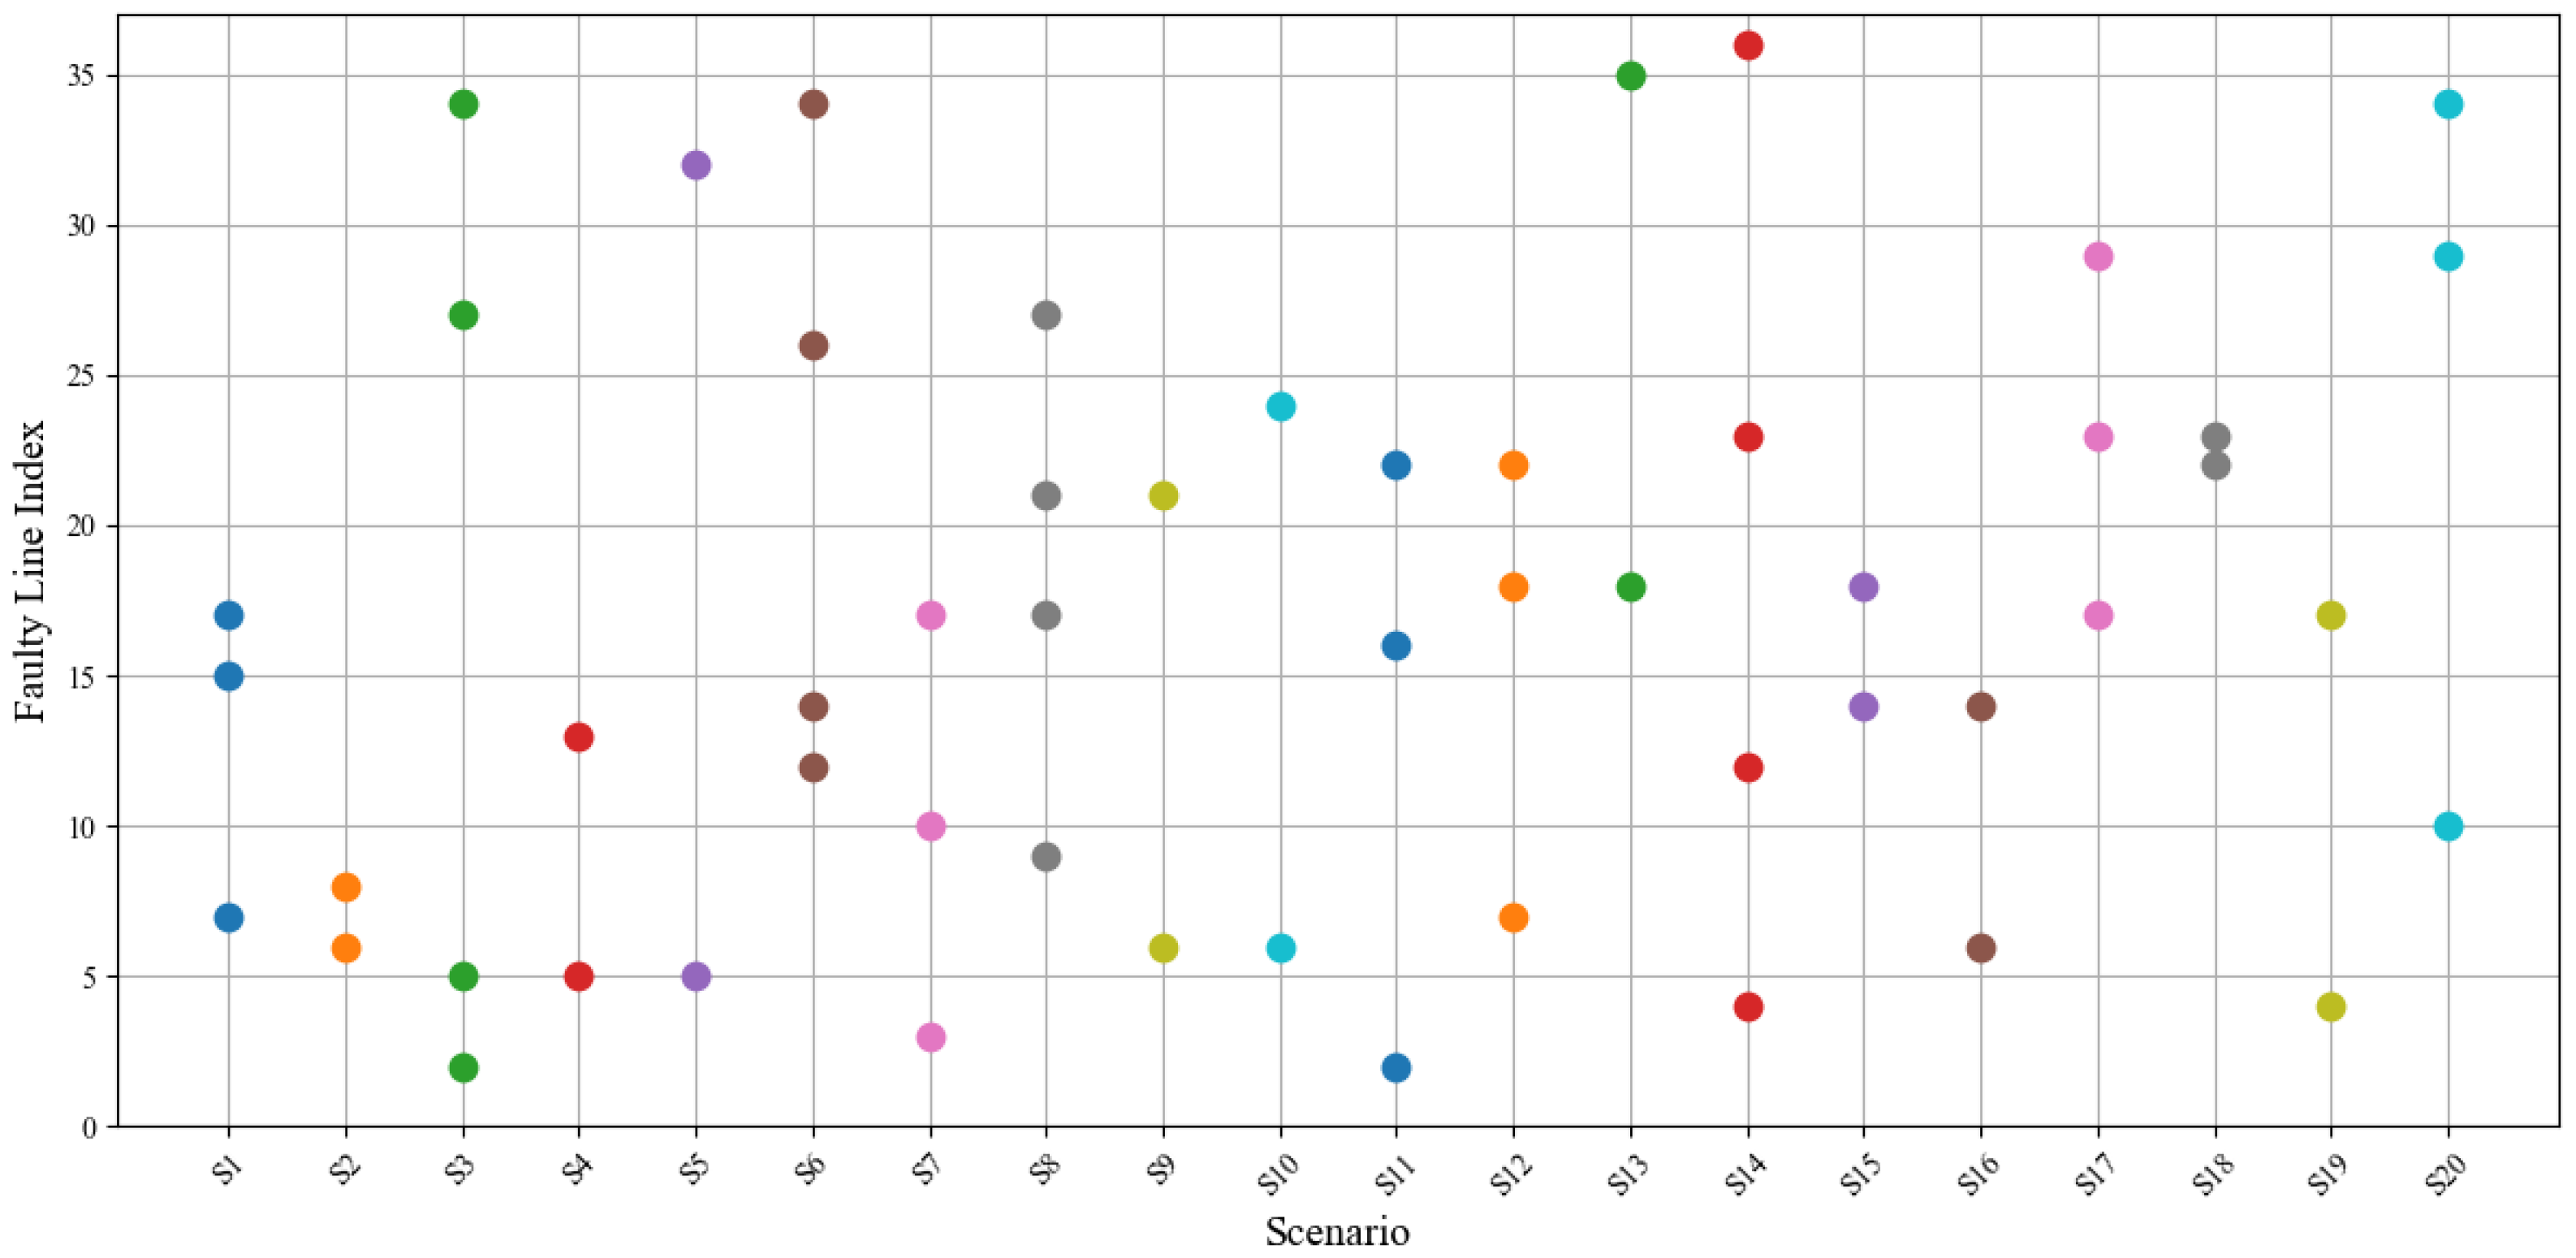
is set at 40%. Based on large-scale Monte Carlo simulations, multiple disaster scenarios are generated, and their respective faulted line distributions are shown in
Figure 3. In our study, each distribution line is assigned a failure probability ranging from 1% to 8%. Using Monte Carlo simulation, line outages are sampled independently according to these probabilities. From a large number of simulations, we selected 20 representative fault scenarios for the case study, each containing 2–4 failed lines, and assigned them equal scenario probabilities to ensure a balanced representation. When V2G stations and DGs jointly serve as power sources for temporary operating areas, the location of V2G integration leads to different power flow distributions across the system (i.e., variations in nodal voltages, line flows, and supplied power as shown in Equations (
16)–(
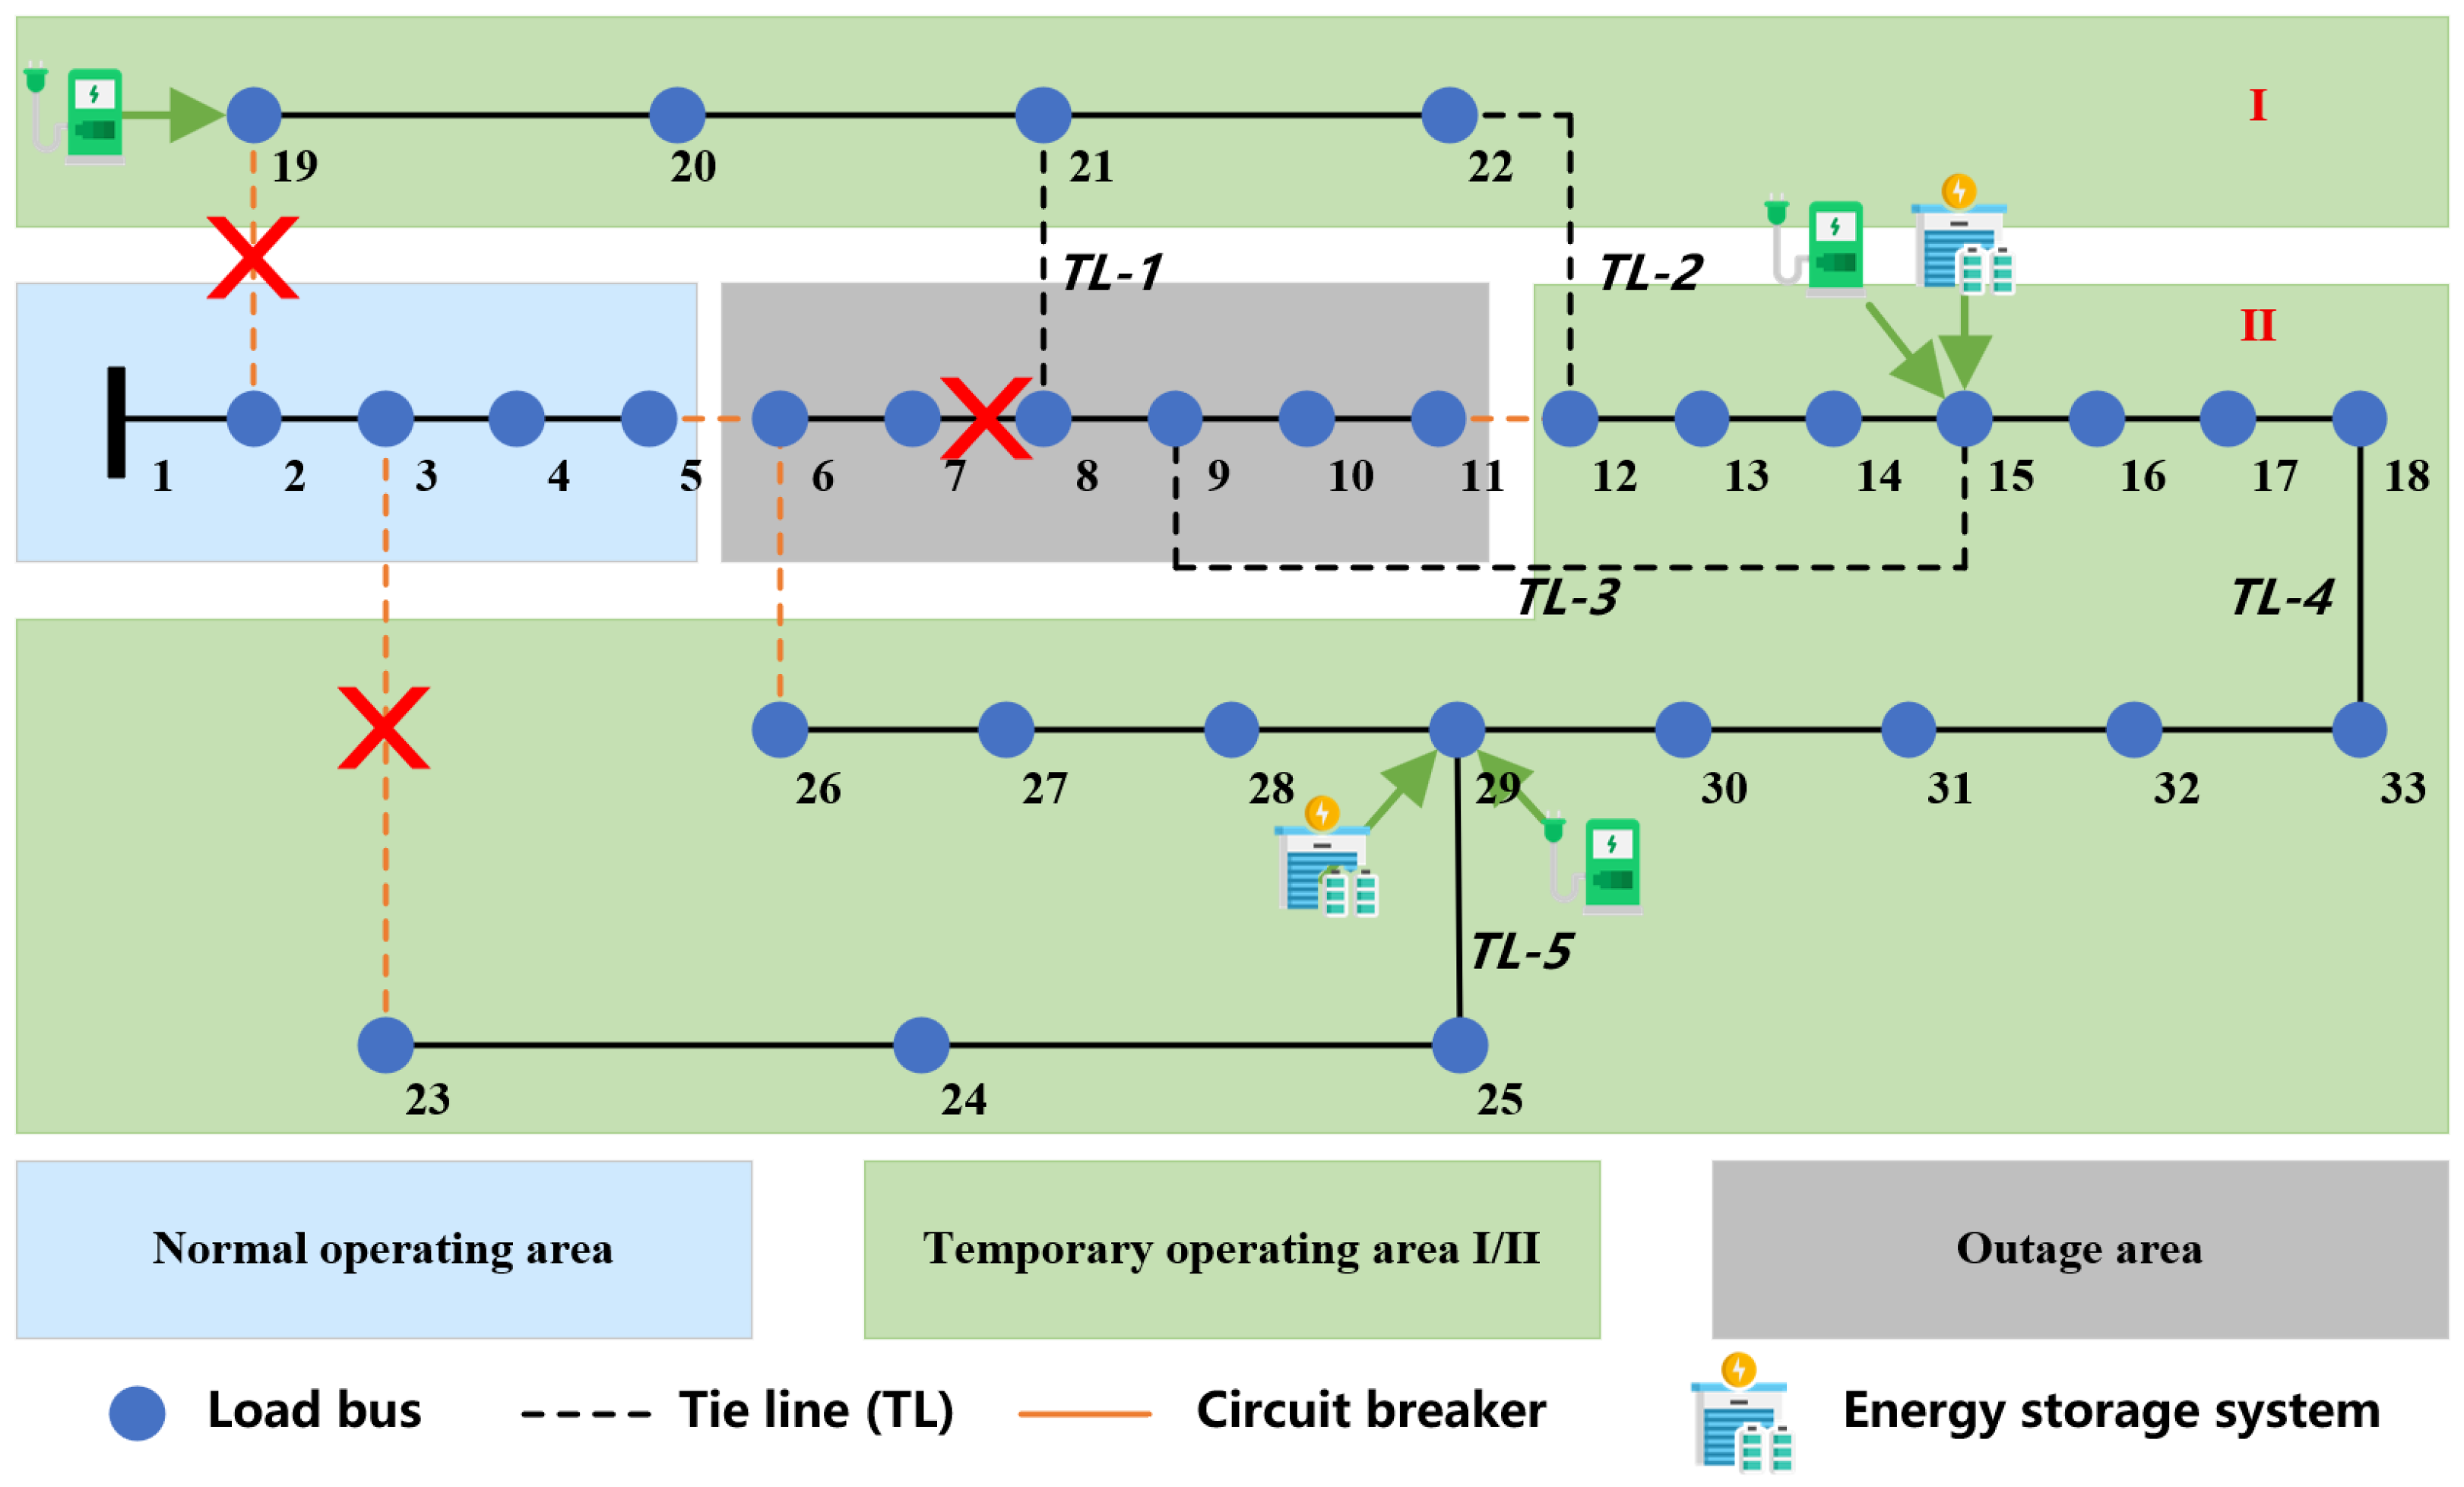
21)). Consequently, supply satisfaction varies among nodes, and the optimization model tends to select nodes that maximize overall satisfaction under the influence of the Resilience Entropy objective. According to the optimization results, three V2G charging stations are established at nodes 15, 19, and 29, respectively. The post-disaster operational states of different regions are visualized in
Figure 4.
Among these scenarios, the damaged lines in scenario 12 are primarily located along the main feeder, which poses a significant risk of large-scale power outages. Therefore, it is selected for detailed analysis due to the disruption of critical power flow paths.
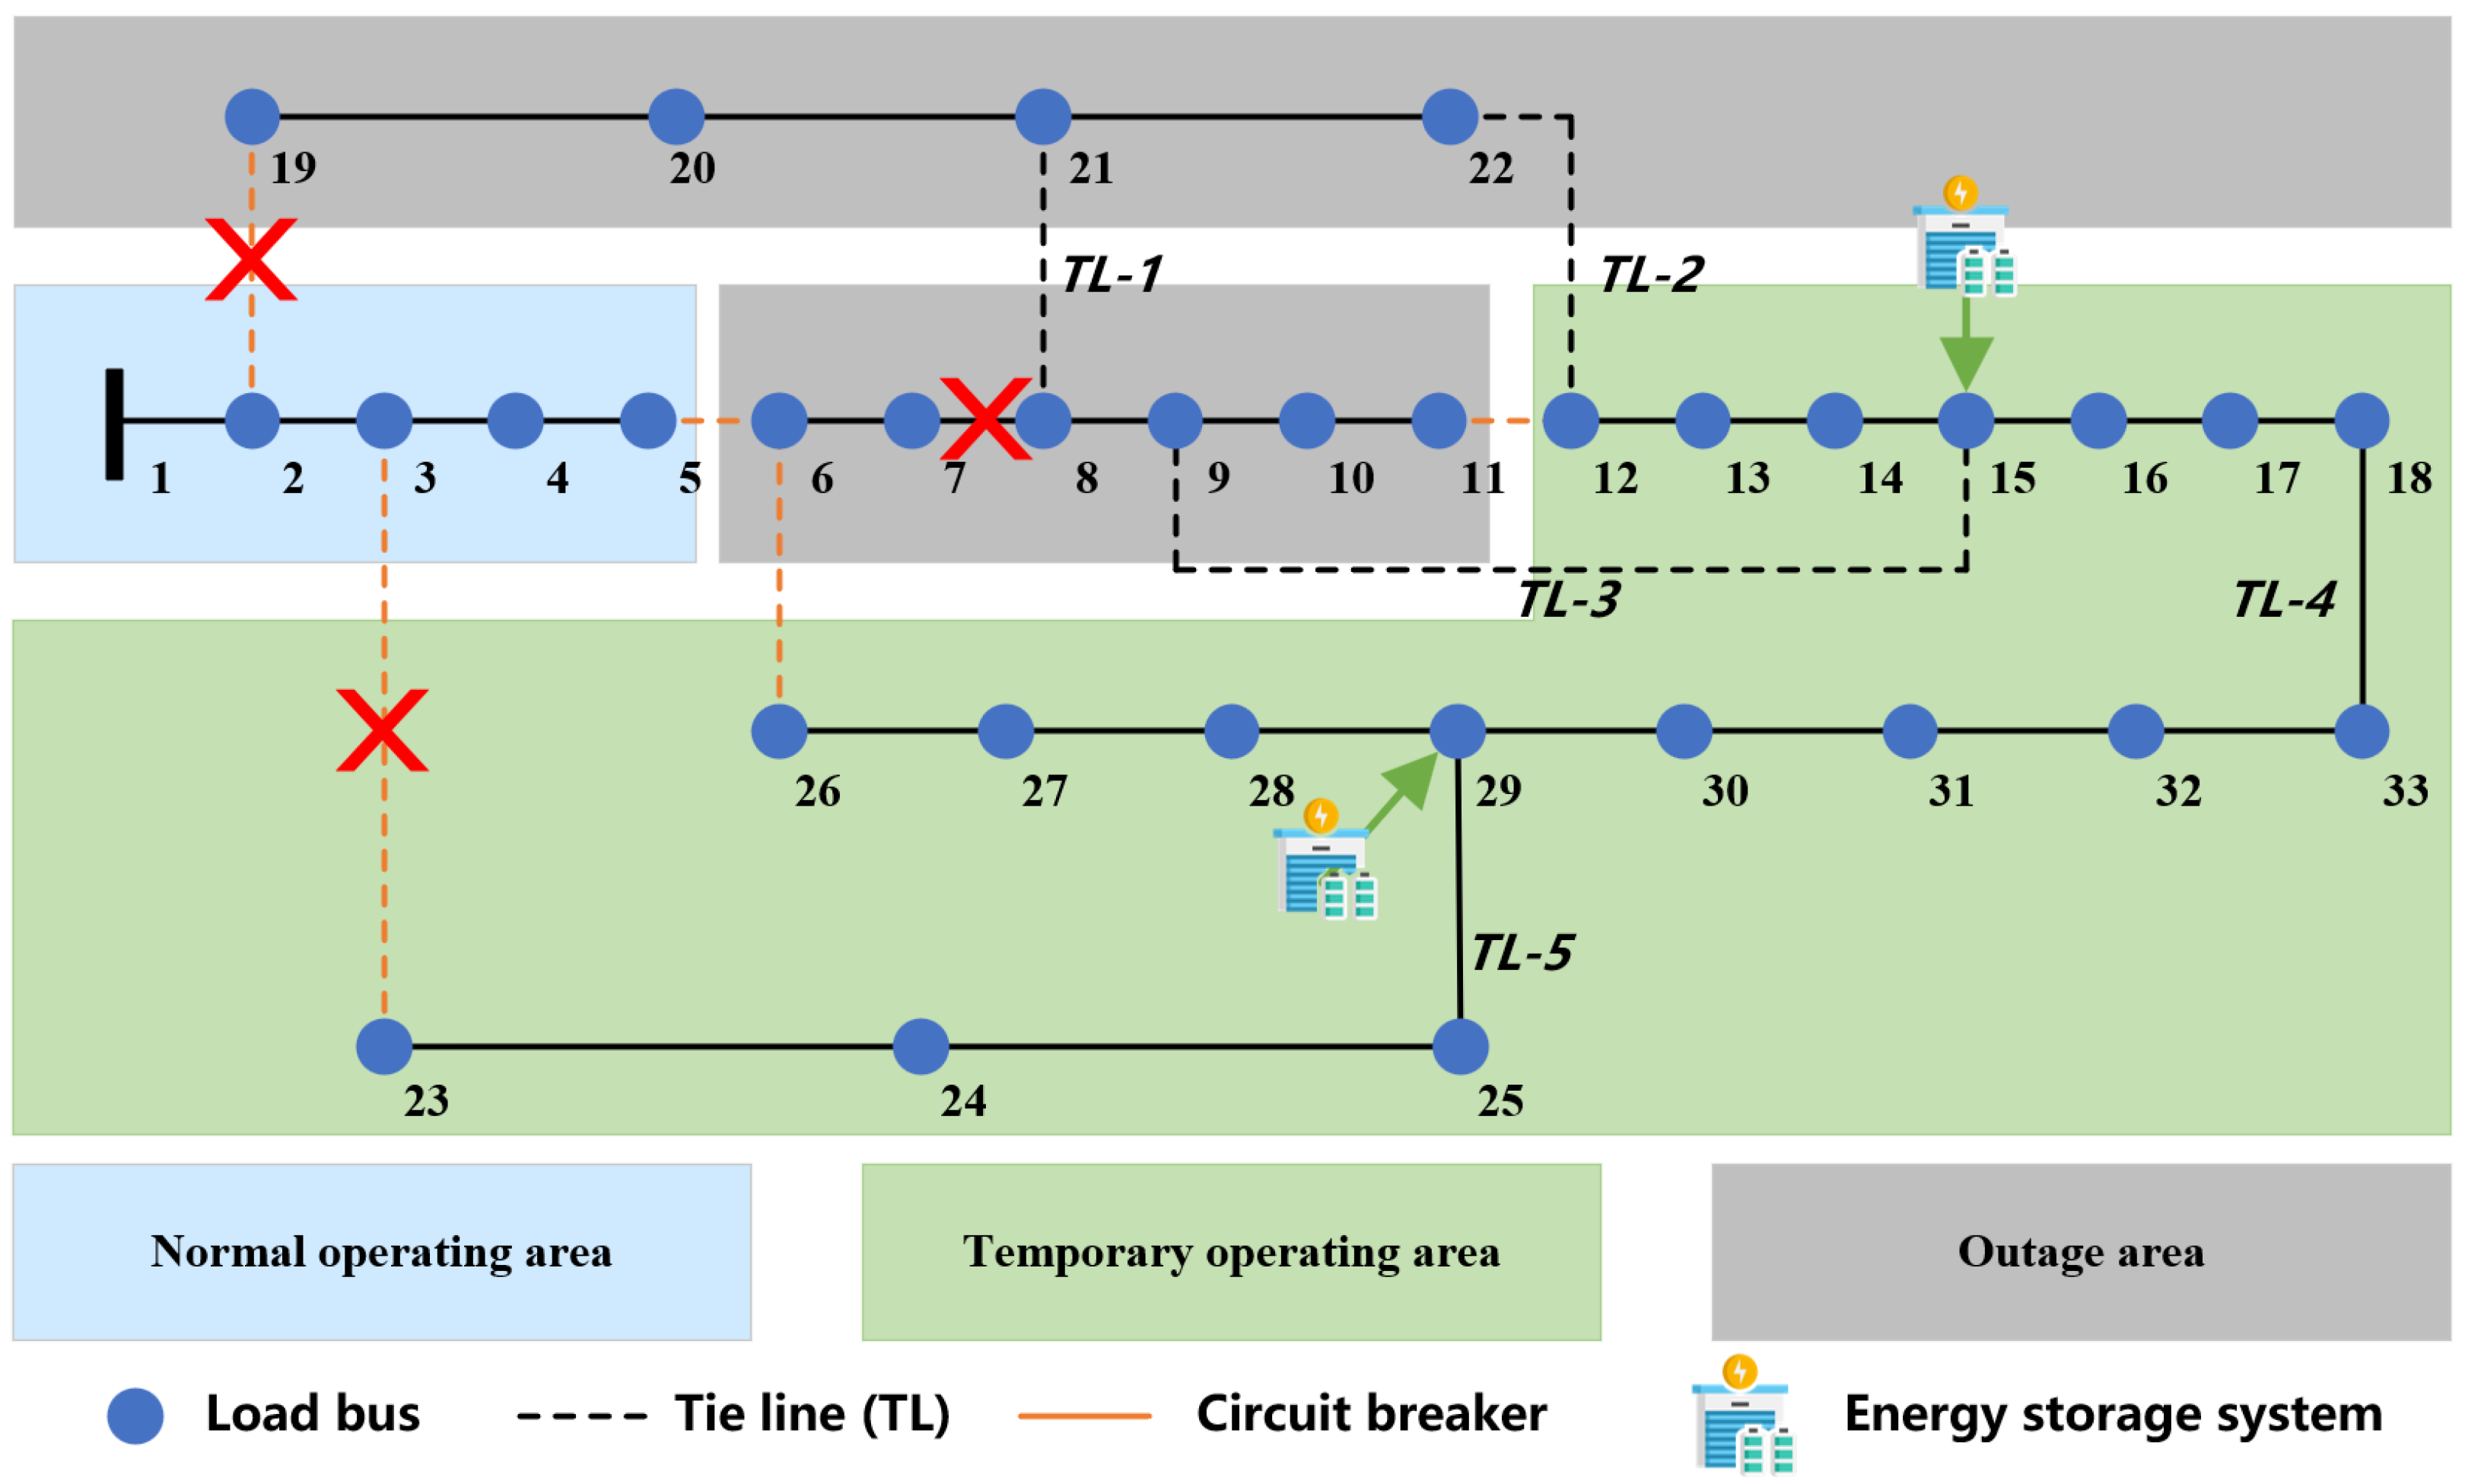
As shown in the figure, “Temporary Operating Areas” operate as islands that are formed by tie-line switching and supported by local distributed generation and V2G resources. The gray-shaded area indicates “Outage Areas”, which refers to zones without supply, i.e., neither grid connection nor local support. The faults in scenario 12 primarily affect the main feeder of the distribution network. Although the deployment of circuit breakers successfully contains the fault within a limited region (gray-shaded area), many downstream nodes become electrically isolated due to line outages. In the absence of V2G infrastructure, these nodes—such as nodes 19 to 22—would experience complete power loss, resulting in user satisfaction dropping to 0, as shown in
Figure 5.
It is noteworthy that, although tie-line 2 (TL-2) is available in the network, it is not directly utilized in this scenario. This is because temporary operating area II relies mainly on local energy storage system and V2G stations for supply, whose capacity is significantly lower than that of the main feeder. If long-distance power transfer is attempted without additional support, voltage drops will become severe and trigger cascading failures. Consequently, deploying a V2G charging station at node 19 to supply temporary operating area I is a more effective and practical strategy. And it should be emphasized that the gray-shaded region represents the outage area where faults have not been cleared. Even if backup power exists, these areas remain non-operational until the damaged line (from node 7 to 8) is structurally restored.
Table 1 presents the overall resilience entropy indicators and average supply satisfaction, comparing scenarios with and without the installation of V2G charging stations. It can be observed that the introduction of the V2G charging station significantly reduces the Resilience Entropy from 1479.3 to 775.6, representing an approximate 47.6% improvement in the system’s resilience to maintain supply continuity and cope with disruptions. Simultaneously, the average supply satisfaction increases from 0.658 to 0.805, indicating a marked enhancement in the power delivery performance experienced by users. These results clearly demonstrate the effectiveness of integrating V2G charging stations into the post-disaster distribution network. The improved Resilience Entropy implies a more reliable and adaptive system, while the increase in supply satisfaction highlights the practical benefits from the end-user perspective.
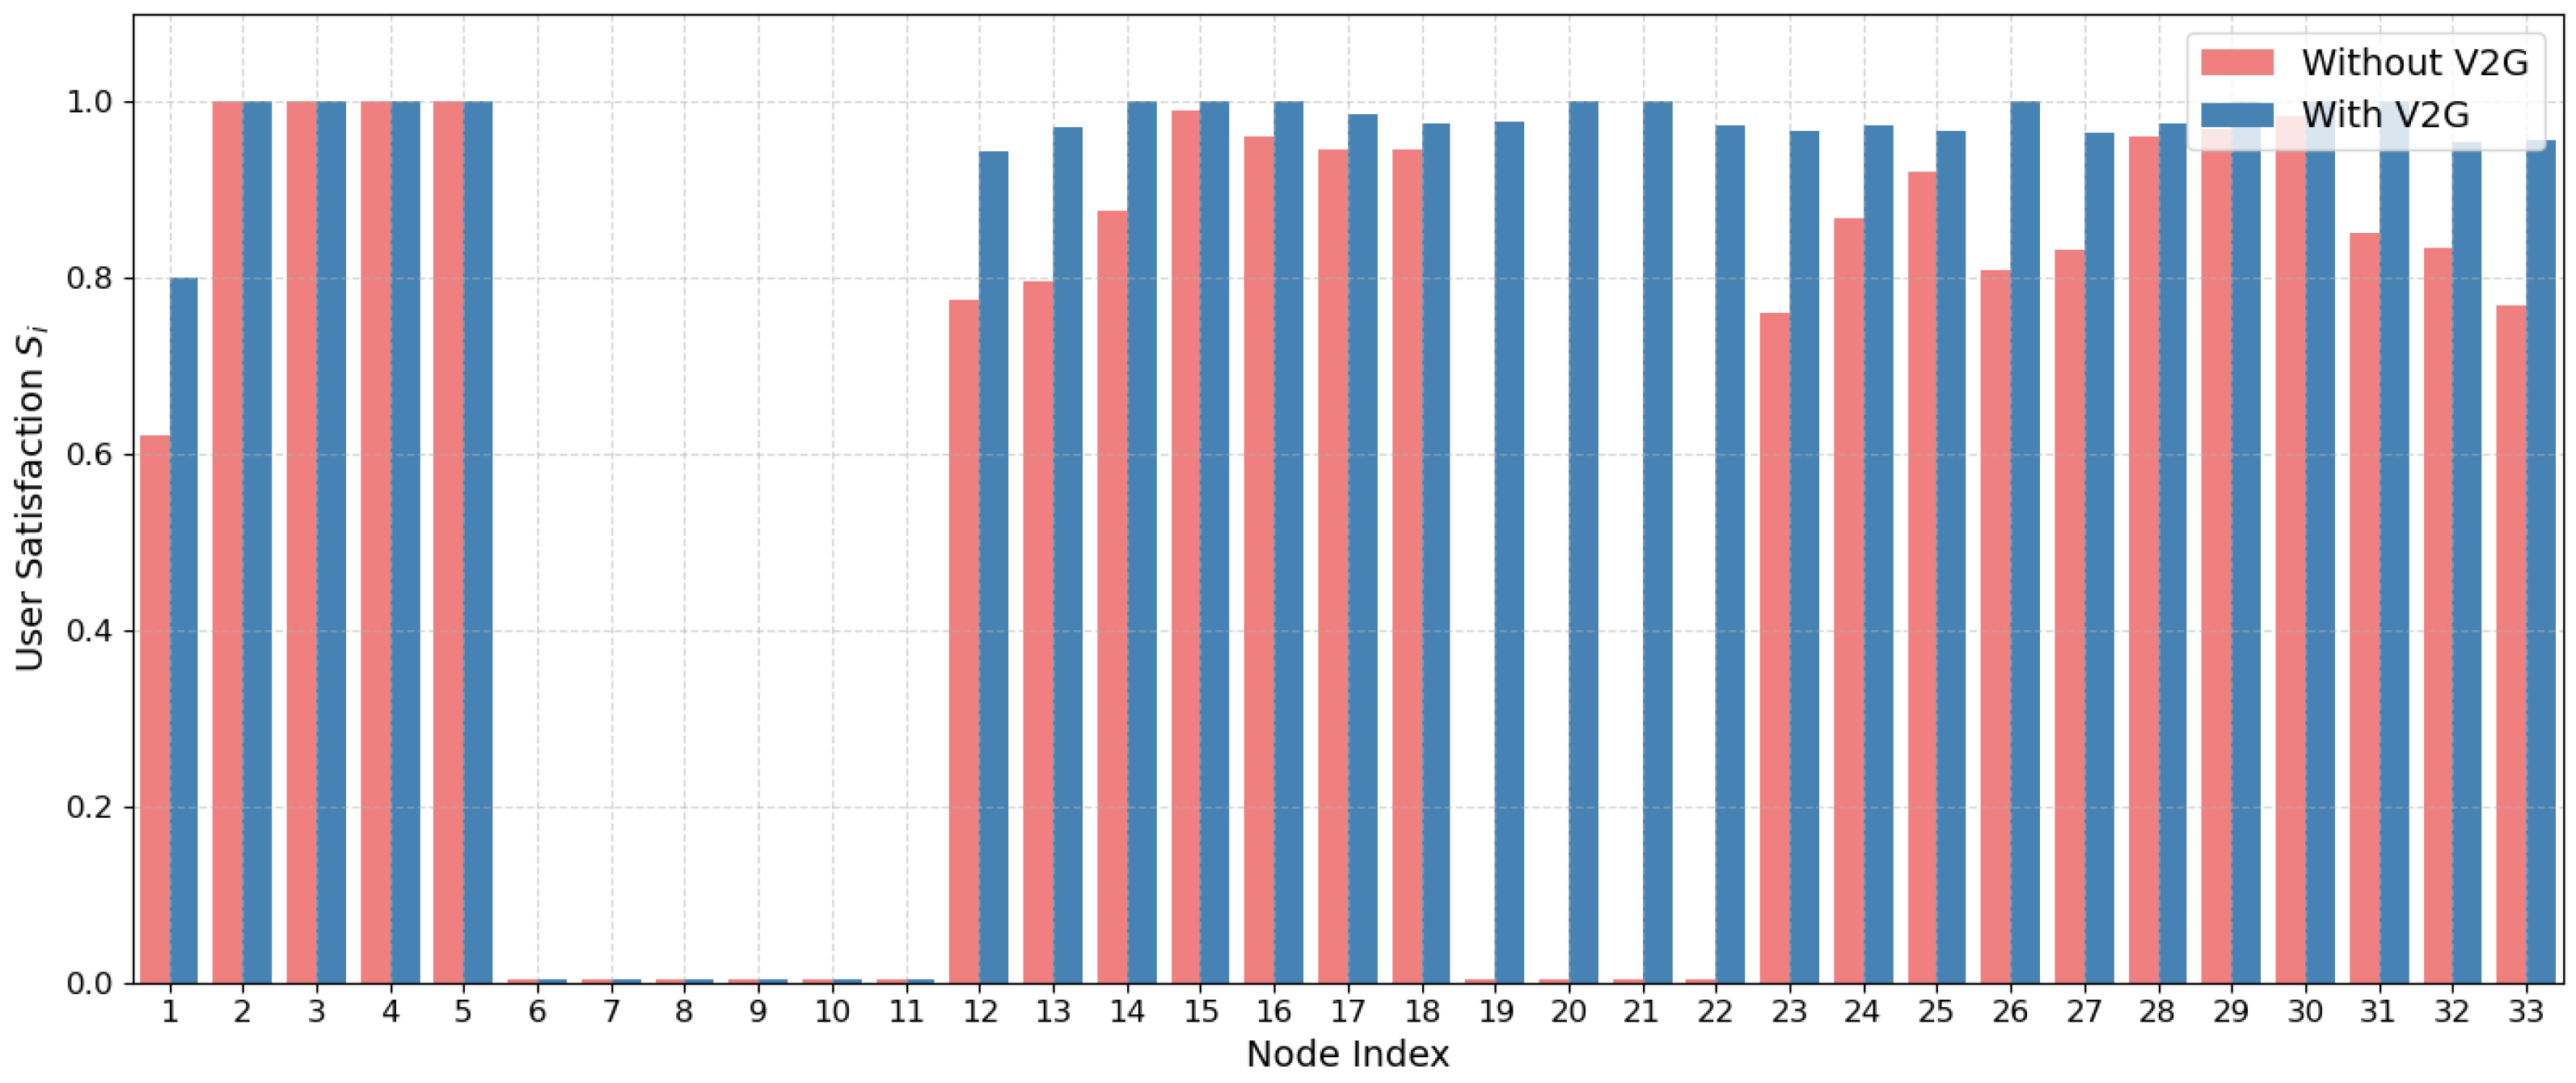
To further illustrate the temporal and spatial distribution of supply satisfaction,
Figure 6 shows a comparison of power supply satisfaction at time
, i.e., one hour after the disaster event. Notably, Node 1 is the main power supply node without any connected loads; thus, the reported value for Node 1 represents the average power supply satisfaction across all load-serving nodes.
From
Figure 6, it is observed that Nodes 2–5 are supplied directly by the main power source, maintaining a power supply satisfaction level of 1. In contrast, Nodes 6–11 fall within the fault-affected area and experience complete power loss; therefore, their satisfaction remains 0 regardless of the deployment of V2G charging stations. For Nodes 19–22, the integration of V2G charging stations improves their satisfaction levels, although full satisfaction (
) is not achieved under the current V2G participation rate. This limitation arises because these nodes rely solely on V2G as their power source, and the available power is constrained by the number of participating vehicles.
Furthermore, in temporary operating area 2, V2G stations serve as supplementary power sources, improving supply reliability and satisfaction in the affected area.
Figure 7 depicts the power supply satisfaction at time
. In the absence of V2G infrastructure, conventional energy storage systems—typically limited in capacity—experience rapid depletion over extended periods, leading to a significant decline in satisfaction within temporary operating area 2. In contrast, with V2G stations deployment, continuous arrival of new EVs enables sustained power injection. This ensures higher and more stable satisfaction levels in the temporary operating area.
In conclusion, the deployment of V2G charging stations significantly mitigates power shortages and enhances the resilience of the distribution network, all while maintaining economic feasibility. This demonstrates that V2G integration effectively enhances both system-level performance and user-level supply experience.
5.2. Sensitivity Analysis
Furthermore, a sensitivity analysis was conducted on the willingness of EV owners to participate in V2G grid support, denoted by the parameter
. As shown in
Figure 8, the Resilience Entropy decreases progressively as the value of
increases, indicating improved user satisfaction with power supply and enhanced overall resilience of the distribution network.
Notably, when reaches 70%, a high level of power supply satisfaction can be achieved by installing V2G charging stations at only nodes 15 and 29, and activating the tie-line TL-2. Although the Resilience Entropy under this configuration is slightly higher than that in the case of , the total construction cost is reduced due to the simplified infrastructure layout. This demonstrates a cost-effective and resilient configuration strategy. Therefore, enhancing EV owner participation in V2G operations not only strengthens the grid’s post-disaster recovery capability but also yields considerable economic benefits.
The IEEE-33 bus distribution system is adopted in this study as it is a widely recognized benchmark for distribution network analysis, providing a transparent and standard platform to validate new methodologies. It should be noted that the proposed framework is not restricted to this system; it can be readily extended to other distribution networks by updating the topology, line parameters, and load data, ensuring the general applicability of the approach.
Regarding the siting results, the optimization selects node 19 as a practical and robust location for deploying a V2G charging station. This is because, under post-disaster conditions, supplying active power from node 19 maximizes load recovery within the temporary operating area and improves overall supply satisfaction, as reflected in the Resilience Entropy objective. Although the V2G stations in this study are modeled to provide only active power, voltage and reactive power levels are maintained through conventional devices such as tap changers, capacitors, and voltage source converters. Therefore, the deployment at node 19 remains both practical and effective for enhancing post-disaster recovery.
In terms of practical considerations, although V2G stations only provide active power support, overall system reliability is preserved since voltage levels and reactive power are regulated by conventional devices such as tap-changing transformers and capacitor banks. The notion of “disaster” in this study refers to extreme events (e.g., typhoons, floods) that cause widespread distribution outages, under which V2G resources serve as auxiliary support for critical load recovery. Furthermore, all mathematical models are explicitly tied to nodes and lines of the IEEE-33 bus system, with system topology illustrated in
Figure 2, ensuring clarity between theoretical formulation and physical implementation.
6. Conclusions
This paper proposes a resilience-oriented restoration model for post-disaster distribution networks, integrating the optimal siting of V2G charging stations. The model accounts for the spatiotemporal uncertainties of EV behavior, power flow constraints, and radial topology requirements, ensuring both physical feasibility and operational safety.
A key innovation lies in the introduction of Resilience Entropy—a dynamic metric that captures the spatiotemporal evolution of supply satisfaction by simultaneously considering both the speed and distribution of recovery across time and space. By incorporating time-weighting factors, it effectively addresses the limitations of conventional static indicators and enables a more comprehensive evaluation of restoration strategies.
Simulation studies based on the IEEE-33 bus system verify that the model effectively adapts to complex fault scenarios. It dynamically determines V2G station deployment and tie-line strategies, achieving adaptive local restoration and improved supply satisfaction. In particular, scenario 12 demonstrates successful island restoration without full tie-line activation. Sensitivity analysis shows that higher user willingness to participate in V2G significantly enhances recovery performance. Under high participation rates (e.g., 70%), the model further optimizes configurations to reduce reconfiguration costs, highlighting its controllability and economic efficiency.
Overall, the proposed model demonstrates strong adaptability, feasibility, and optimization capability, offering valuable insights for resilience-oriented planning in disaster-affected distribution systems.

