1. Introduction
Electric scooters (e-scooters) are considered a suitable solution to assist urban transportation, especially in cities with large traffic volumes, for the following reasons: 1. lack of environmental and noise pollution; 2. features such as easy portability, foldable design (which allows them to be transported in public transport or placed in the trunk of a car), lower weight, and dimensions; 3. lower costs compared to electric bicycles and motorcycles. According to the German Insurance Association (GDV), almost one million e-scooters were on German roads in 2023 [
1]. As their adoption accelerates across the electric transport sector, optimization issues in their technical systems and efficiency improvement gain greater significance. Towards this goal, this paper analyzes the main electrical components of an e-scooter, focusing not only on the control system but also on energy and power-related aspects. In addition to key components, such as the permanent magnet brushless direct current (PMBLDC) motor and the lithium-ion battery, the DC–DC buck-boost converter and the voltage source inverter (VSI) are also thoroughly analyzed.
Since spring 1994, when Honda developed and marketed a new e-scooter (CUV ES: Clean Urban Vehicle Electric Scooter) [
2], various research questions related to e-scooters have been discussed. These include optimizing the structure of drive systems, including BLDC motors, developing control algorithms for motor drives, managing the energy stored in the battery, and estimating the state of charge (SOC). Previous studies have mainly focused either on separate analyses of system components, such as independent modeling of batteries or motors, or only on simulations without experimental data. Although these approaches have led to advances in the theoretical understanding of the performance of electrical components, they often lack the system coherence to fully represent the dynamic behavior of electric scooters in real applications. The e-scooter model introduced in [
3] consists of a VSI and a three-phase induction motor, which drives the wheels through a power transmission system. The speed is regulated using pole placement and integral sliding mode control. In this study, parameters such as motor speed and its control method, motor torque, energy consumption, system efficiency, and system dynamic response are investigated.
Advances in technologies such as energy storage systems have made electric vehicles as well as electric transportation a practical and achievable reality. One of the key points to ensure the sustainability of electric transportation is its electrical energy source [
4]. In order to extend the scooter’s range, a hybrid integration of a fuel cell with a battery powertrain of a commercial electric scooter is investigated in [
5].
An energy management system (EMS) can reduce energy consumption and increase efficiency by optimizing power distribution between energy sources and consumers. A dynamic simulation model for hybrid electric scooters is presented in [
6], which combines mathematical models and experimental data to predict the system’s behavior for evaluating the performance of the EMS during driving cycles. The control system of the model includes a proportional–integral–derivative (PID) controller to adjust the scooter’s speed, and it calculates the required torque using the driver pedal signal. The computational model introduced in [
7] is implemented in MATLAB/Simulink to estimate energy consumption and motor efficiency under real-world driving conditions based on field measurements from actual test routes. In [
8], a multi-source EMS for electric vehicles is introduced. Although e-scooters have the potential to reduce energy consumption and carbon emissions [
9], their real-world performance depends critically on propulsion system design, energy conversion efficiency, and battery management. In [
9], a dynamic simulation model based on MATLAB/Simulink is developed to evaluate the performance of a passive proton-exchange membrane fuel cell–battery hybrid powertrain for e-scooters. The system is designed without a DC–DC converter to minimize size, weight, and cost, relying on direct power coupling between the fuel cell and the battery. The model is validated against experimental data under real-world driving conditions. In [
10], the energy optimization strategies for a parallel hybrid two-wheeler equipped with a Through-the-Road architecture are analyzed. In this configuration, to improve performance and optimize energy usage, a BLDC motor is mounted on the front wheel and an internal combustion engine on the rear wheel, allowing either combined or independent operation. Three energy-switching strategies—SOC-based, fuzzy-logic control (FLC), and neural network (NN) control—are designed, simulated, and compared in MATLAB/Simulink with the World Harmonized Motorcycle Test Cycle. The results show that NN control outperforms the other two in reducing energy consumption and achieving more optimal energy management under variable urban conditions.
In an electric scooter, the power from the battery must be converted appropriately before it drives the BLDC motor. First, the battery voltage is adjusted—either stepped up or down—to a level suitable for the motor using a buck-boost converter. This adjusted DC voltage is then smoothed using a DC-link capacitor to reduce voltage ripples. Finally, switching and connection of the stabilized DC voltage to the phases of the BLDC motor is performed by a three-phase inverter. In [
11], an innovative DC–DC converter for battery chargers of light electric vehicles (such as e-scooters, electric bicycles, tricycles, golf carts, and light quadricycles) is introduced and implemented. The proposed structure uses pulse-frequency control and a resonant tank on the high-voltage side with variable-turn windings at the output, enabling a wide output-voltage range (50–160 V). The input can be supplied from a DC bus at different levels (e.g., 380, 760, or 1500 V), extending applicability from home charging to light- and medium-duty transportation. To reduce voltage stress on active devices, a cascaded design is used so that lower-voltage semiconductor switches can be employed. Output voltage is regulated by changing the switching frequency to increase efficiency, reduce losses, and achieve soft switching. The authors of [
12] present the design and implementation of a synchronous bidirectional DC–DC converter based on silicon carbide (SiC) MOSFETs for permanent-magnet DC motors in light electric vehicles. In boost mode, power flows from the battery to the motor, stepping roughly 23.5 V up to about 60–90 V, and in buck (regenerative) mode, braking energy is fed back to the battery. Unlike conventional BLDC motors with inverter systems that require six switches, the approach shown operates with only two SiC MOSFETs, yielding a simpler structure, lower losses, and reduced size. Reference [
13] presents a synchronous boost converter to step up a 12 V battery voltage to 24 V for e-scooter applications. While the design is simulated and compared with a conventional boost converter, no experimental implementation or measurement data are provided. Similarly, Ref. [
14] proposes a three-phase 10 kW bidirectional charger for electric vehicles, consisting of an IGBT-based inverter bridge and a MOSFET-based bidirectional buck-boost converter, aimed at regulating the DC bus voltage at 800 V. While the system is simulated and analyzed, the study focuses exclusively on simulation results and does not include any experimental validation or measured data.
To model a BLDC motor accurately, it is essential to first determine key motor parameters such as the back electromotive force (back-EMF) coefficient, torque constant, and flux linkage. These parameters are calculated in [
15]. The modeling of a BLDC motor and the determination of its parameters—such as driving power, torque (using dynamic equations), and winding inductance and resistance—are presented in [
16]. In [
17], an integrated model of a BLDC motor and a VSI with speed control is simulated in MATLAB/Simulink. While the simulation offers insight into system dynamics, the study lacks experimental measurement. A comprehensive analysis of the integrated system behavior and an in-depth interpretation of the results are not provided. Given the importance of BLDC motors in e-scooters, optimal motor design includes electromagnetic parameter selection and stator/rotor geometry as well as vehicle-dynamics-based loading. For example, in [
18], two BLDC machines (3.3 kW) for e-scooters are detailed: a belt-driven motor with 8 poles and 12 slots and an outer-rotor motor with 20 poles and 24 slots. Finite-element analysis (FEA) shows that the belt-driven motor suits high-speed applications with approximately 94% efficiency, while the outer-rotor motor, with an average torque of 67.41 Nm, is ideal where high torque is required. These studies also indicate that stator/rotor design, magnet thickness, number of turns, and air-gap sizing strongly influence cogging reduction, torque increase, and flux distribution. Reference [
19] presents a confirmatory study on a 1 kW BLDC motor used in an e-scooter, aiming to validate the original equipment manufacturer’s (OEM) specifications through three complementary approaches. First, analytical powertrain calculations based on vehicle dynamics (rolling resistance, aerodynamic drag, slope, and acceleration forces) confirm that the rated and peak power values closely match the OEM data. Second, testing under the Indian Driving Cycle demonstrates that the rated and peak power as well as the estimated range (95 km) are consistent with the manufacturer’s data. Finally, FEA using the actual rotor and stator dimensions verify the nominal and peak torque values, while highlighting the need for torque ripple improvement.
Control systems are crucial for achieving efficient and precise motor operation in applications like e-scooters, electric fans, robotics, and industrial machinery. Depending on performance requirements, various control algorithms—both sensor-based and sensor-less—are used. These include scalar methods, vector control techniques such as field-oriented control (FOC) and direct torque control (DTC), and advanced intelligent approaches like particle swarm optimization (PSO) and model predictive control (MPC) [
20]. FOC, also known as vector control, achieves high dynamic performance by regulating torque and flux independently and typically employs modulation strategies such as sinusoidal pulse width modulation (SPWM) and space vector pulse width modulation (SVPWM) [
21,
22]. The BLDC motor based on the hysteresis current control system has been modeled and simulated in [
23,
24,
25]. Another control method for BLDC motors uses a single-stage direct matrix converter with hysteresis current control, as investigated in [
26]. This approach employs space vector modulation (SVM) on the grid side and an indirect modulation technique for the matrix converter on the load side. A control method for a BLDC motor aimed at torque ripple reduction is developed in [
27]. It manages phase switching based on a switching table that uses main vectors (MV) and subsidiary vectors (SV), determined by torque variation rates corresponding to different terminal voltages.
In [
28], a BLDC motor control system is developed using a microcontroller that regulates motor speed through PWM, based on input from the throttle and Hall sensors. Various control methods are employed to detect rotor position and regulate motor speed. A BLDC motor drive based on Hall sensors using a field-programmable gate array (FPGA) is presented in [
29]. The stability analysis of a PMBLDC motor based on Hall sensors is investigated in [
30]. A BLDC motor control technique is explored in [
31], which includes using back-EMF measurements to estimate motor speed in a four-switch inverter setup. In [
32,
33], zero-crossing-based back-EMF sensing techniques are used for detecting rotor position, while an unknown input observer method is applied to estimate back-EMF in real time, supporting commutation control.
In [
34], a bidirectional interior permanent-magnet BLDC (IPM-BLDC) motor drive for e-scooters is proposed to reduce copper losses, smooth the DC-link current, uniformize output torque, and optimize regenerative braking, thereby enhancing energy efficiency and extending vehicle range. During motoring, a maximum torque per ampere-inspired strategy pre-phases current relative to the back-EMF to exploit both electromagnetic and reluctance torque, improving efficiency across different vehicle speeds and loadings. At high speed, field weakening maintains performance stability. For regenerative braking, a new switching pattern based on the one-switch-active method produces a nearly symmetric line-current waveform with an approximate 180° phase shift relative to the back-EMF, enabling smooth transitions between the driving and braking modes. The system is tested with a 48 V, 580 W, four-pole IPM-BLDC motor and implemented using three Hall effect sensors and a low-cost digital signal processor, without dedicated current or voltage sensors.
In [
35], a hardware-in-the-loop model of a BLDC motor for e-scooters is presented, enabling system evaluation under variable operating conditions such as the user weight, road slope, and wind speed, without requiring physical testing. The motor speed and torque are controlled via cascaded PID controllers, with parameters optimized using a genetic algorithm, thereby reducing development cost and design time.
The review paper [
36] presents a comprehensive framework for electric micromobility (EMM) systems, analyzing key components such as motors, batteries, power converters, and control strategies. The authors compare various motor types, including permanent magnet synchronous motors, BLDC motors, switched reluctance motors, and induction motors, highlighting their respective advantages and limitations in light-vehicle applications. Battery technologies are evaluated based on energy density, efficiency, and environmental impact to identify optimal candidates for EMM platforms. In the power conversion section, the adoption of wide-bandgap semiconductors—such as SiC and gallium nitride—in conjunction with buck, boost, and bidirectional converter topologies is identified as a critical enabler of higher efficiency and reduced losses. A survey of control techniques—from conventional PID to advanced methods like FLC, sliding mode control, and model predictive control—demonstrates that system-level efficiency hinges on the integration of intelligent control algorithms with high-performance hardware.
Previous studies have typically focused on individual components, such as the battery and buck-boost converter, or motor control, and have examined them from a single perspective (e.g., control system or power/energy subsystem). Many of these approaches rely solely on simulation and lack a comprehensive, system-level analysis within a real-world context. In contrast, this paper presents a fully integrated simulation of an electric scooter in the MATLAB/Simulink environment, encompassing all key electrical subsystems: the battery, DC–DC converter, VSI, PMBLDC motor, and associated control systems. The model is designed as a unified, interactive framework that enables a detailed investigation of critical parameters and captures the dynamic interactions between components under varying operating conditions. This system-oriented approach allows for a holistic evaluation of overall performance, addressing a key limitation of prior studies. Furthermore, to complement the simulation, experimental measurements are conducted on a commercial e-scooter across multiple operating modes. Both simulation results and laboratory data are analyzed to provide a comprehensive understanding of system behavior, with the experimental data enriching the simulation findings and enabling a more complete analysis. By integrating modeling, simulation, and real-world measurements, this study offers a practical and robust framework for the design, optimization, and performance assessment of electric transportation systems.
The structure of the paper is as follows:
Section 2 describes the system modeling and simulation, including the scooter’s powertrain and control algorithm.
Section 3 presents the simulation results and provides an in-depth analysis of the system’s dynamic behavior.
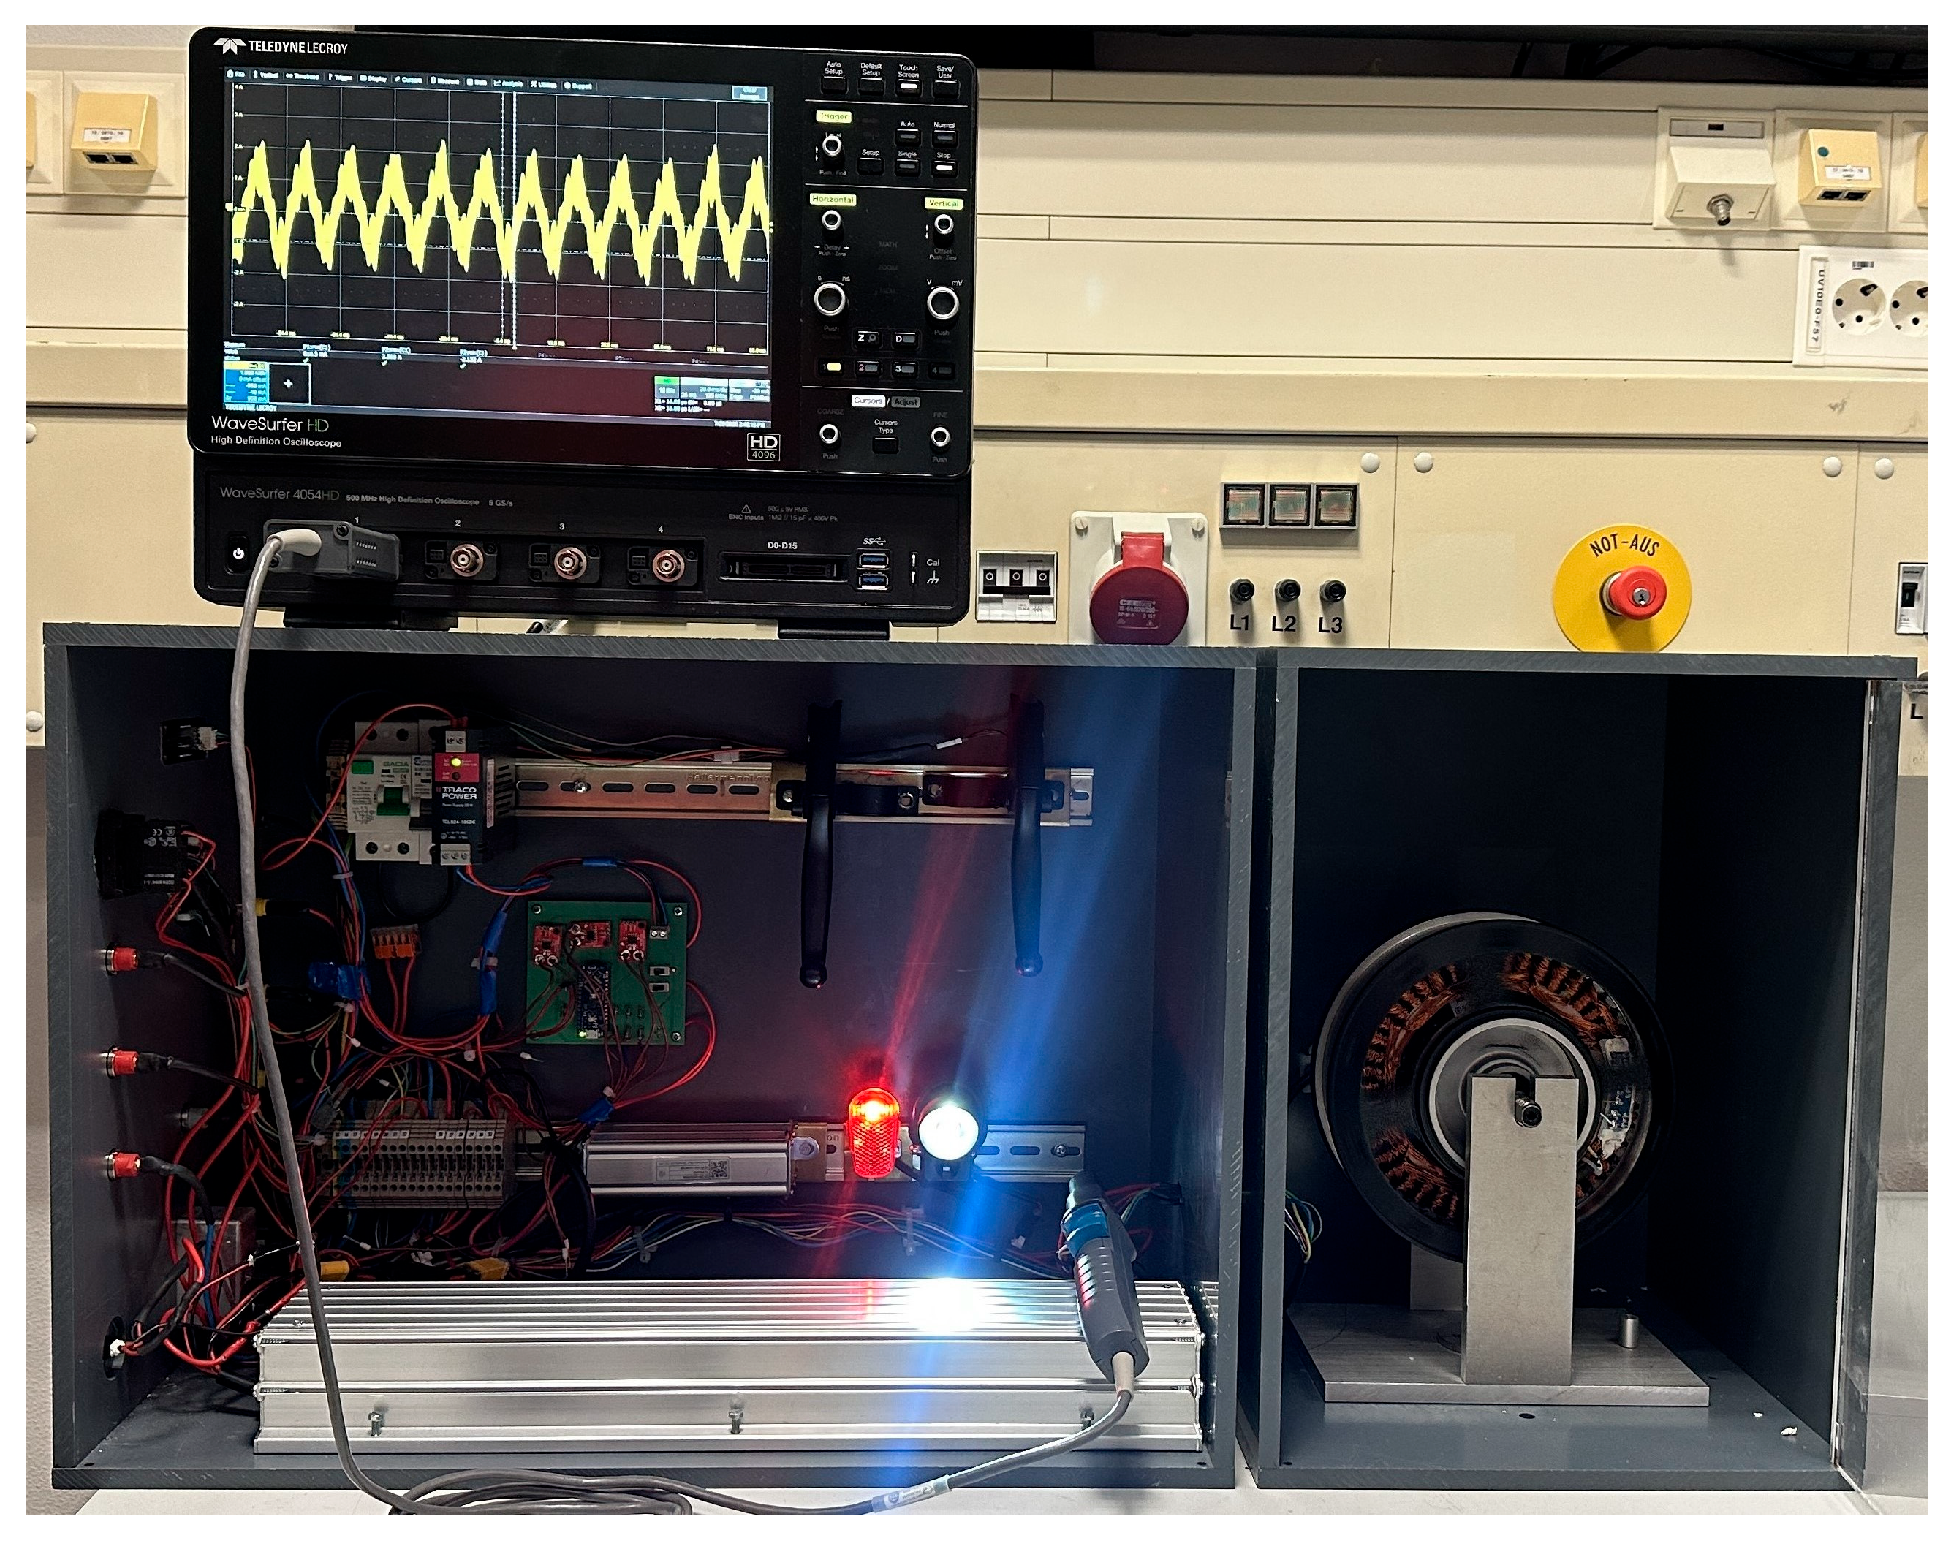
Section 4 presents the experimental measurements conducted on a commercial e-scooter.
Section 5 discusses the results, and
Section 6 provides the conclusions.
2. System Modeling and Methodology
The general model of the system under consideration is shown in
Figure 1. This model includes a lithium-ion battery with a nominal voltage of 36 V and a capacity of 12.8 Ah, corresponding to an energy rating of 460.8 Wh, which provides the energy required to power the motor and the VSI. The battery voltage and current during the charging and discharging modes are controlled by a DC–DC buck-boost converter. The DC voltage is switched by a three-phase, six-step inverter into different modes for the phases of the BLDC motor. The VSI consists of six MOSFETs (
to
) that act as switching elements. These MOSFETs are controlled based on PWM signals (
). The
signals are used by the control system to drive the switches
−
. Each motor phase is modeled by a resistance
related to the stator winding, a self-inductance
, and a mutual inductance
. The back-EMF generated in each phase is represented by
, and
.
Hall effect sensors embedded in the stator detect the rotor position and transmit the data to the control system.
The phase voltage relationships of the BLDC motor are described by Equations (1)–(3).
where
, and
are the phase currents,
, and
are the terminal voltages,
is the phase resistance,
is self-inductance,
is the mutual inductance, and
, and
are the back-EMF voltages.
The total electrical power supplied to the motor
is represented in (4).
Substituting Equations (1)–(3) into (4), expression (5) is derived.
The first term in (5) represents the copper losses (
), the second term corresponds to the rate of change of the magnetic energy stored in the inductances (
), and the third term is the electromagnetic power (
), which is converted into mechanical power across the air gap. The electromagnetic torque
is calculated according to (6).
where
is the electromagnetic power and
is the angular velocity.
The relationship between electromagnetic torque and current is obtained from (7).
where
is the torque constant and
is the phase current flowing through the stator windings. This shows that the torque is directly proportional to the current in the conducting windings. The relationship between back-EMF and angular velocity is obtained from (8).
where
is the back-EMF constant. The relationships presented in (9) and (10) are based on the formulations in [
15]:
where
is the torque constant (
),
is flux linkage (in Weber) by magnets,
is the number of pole pairs,
is the maximum motor speed (in
),
is the motor phase–phase peak voltage (in
), and
is the back-EMF coefficient (in
).
In a BLDC motor, at any given moment, two phases are conducting at any given time, while the third phase is left floating (non-conducting). Current flows into one conducting phase and out of the other conducting phase. Therefore, at any instant, one phase has positive current, another has negative current (with an equal magnitude), and the third phase has zero current. The switching control strategy of the VSI switches (
) is based on the rotor position.
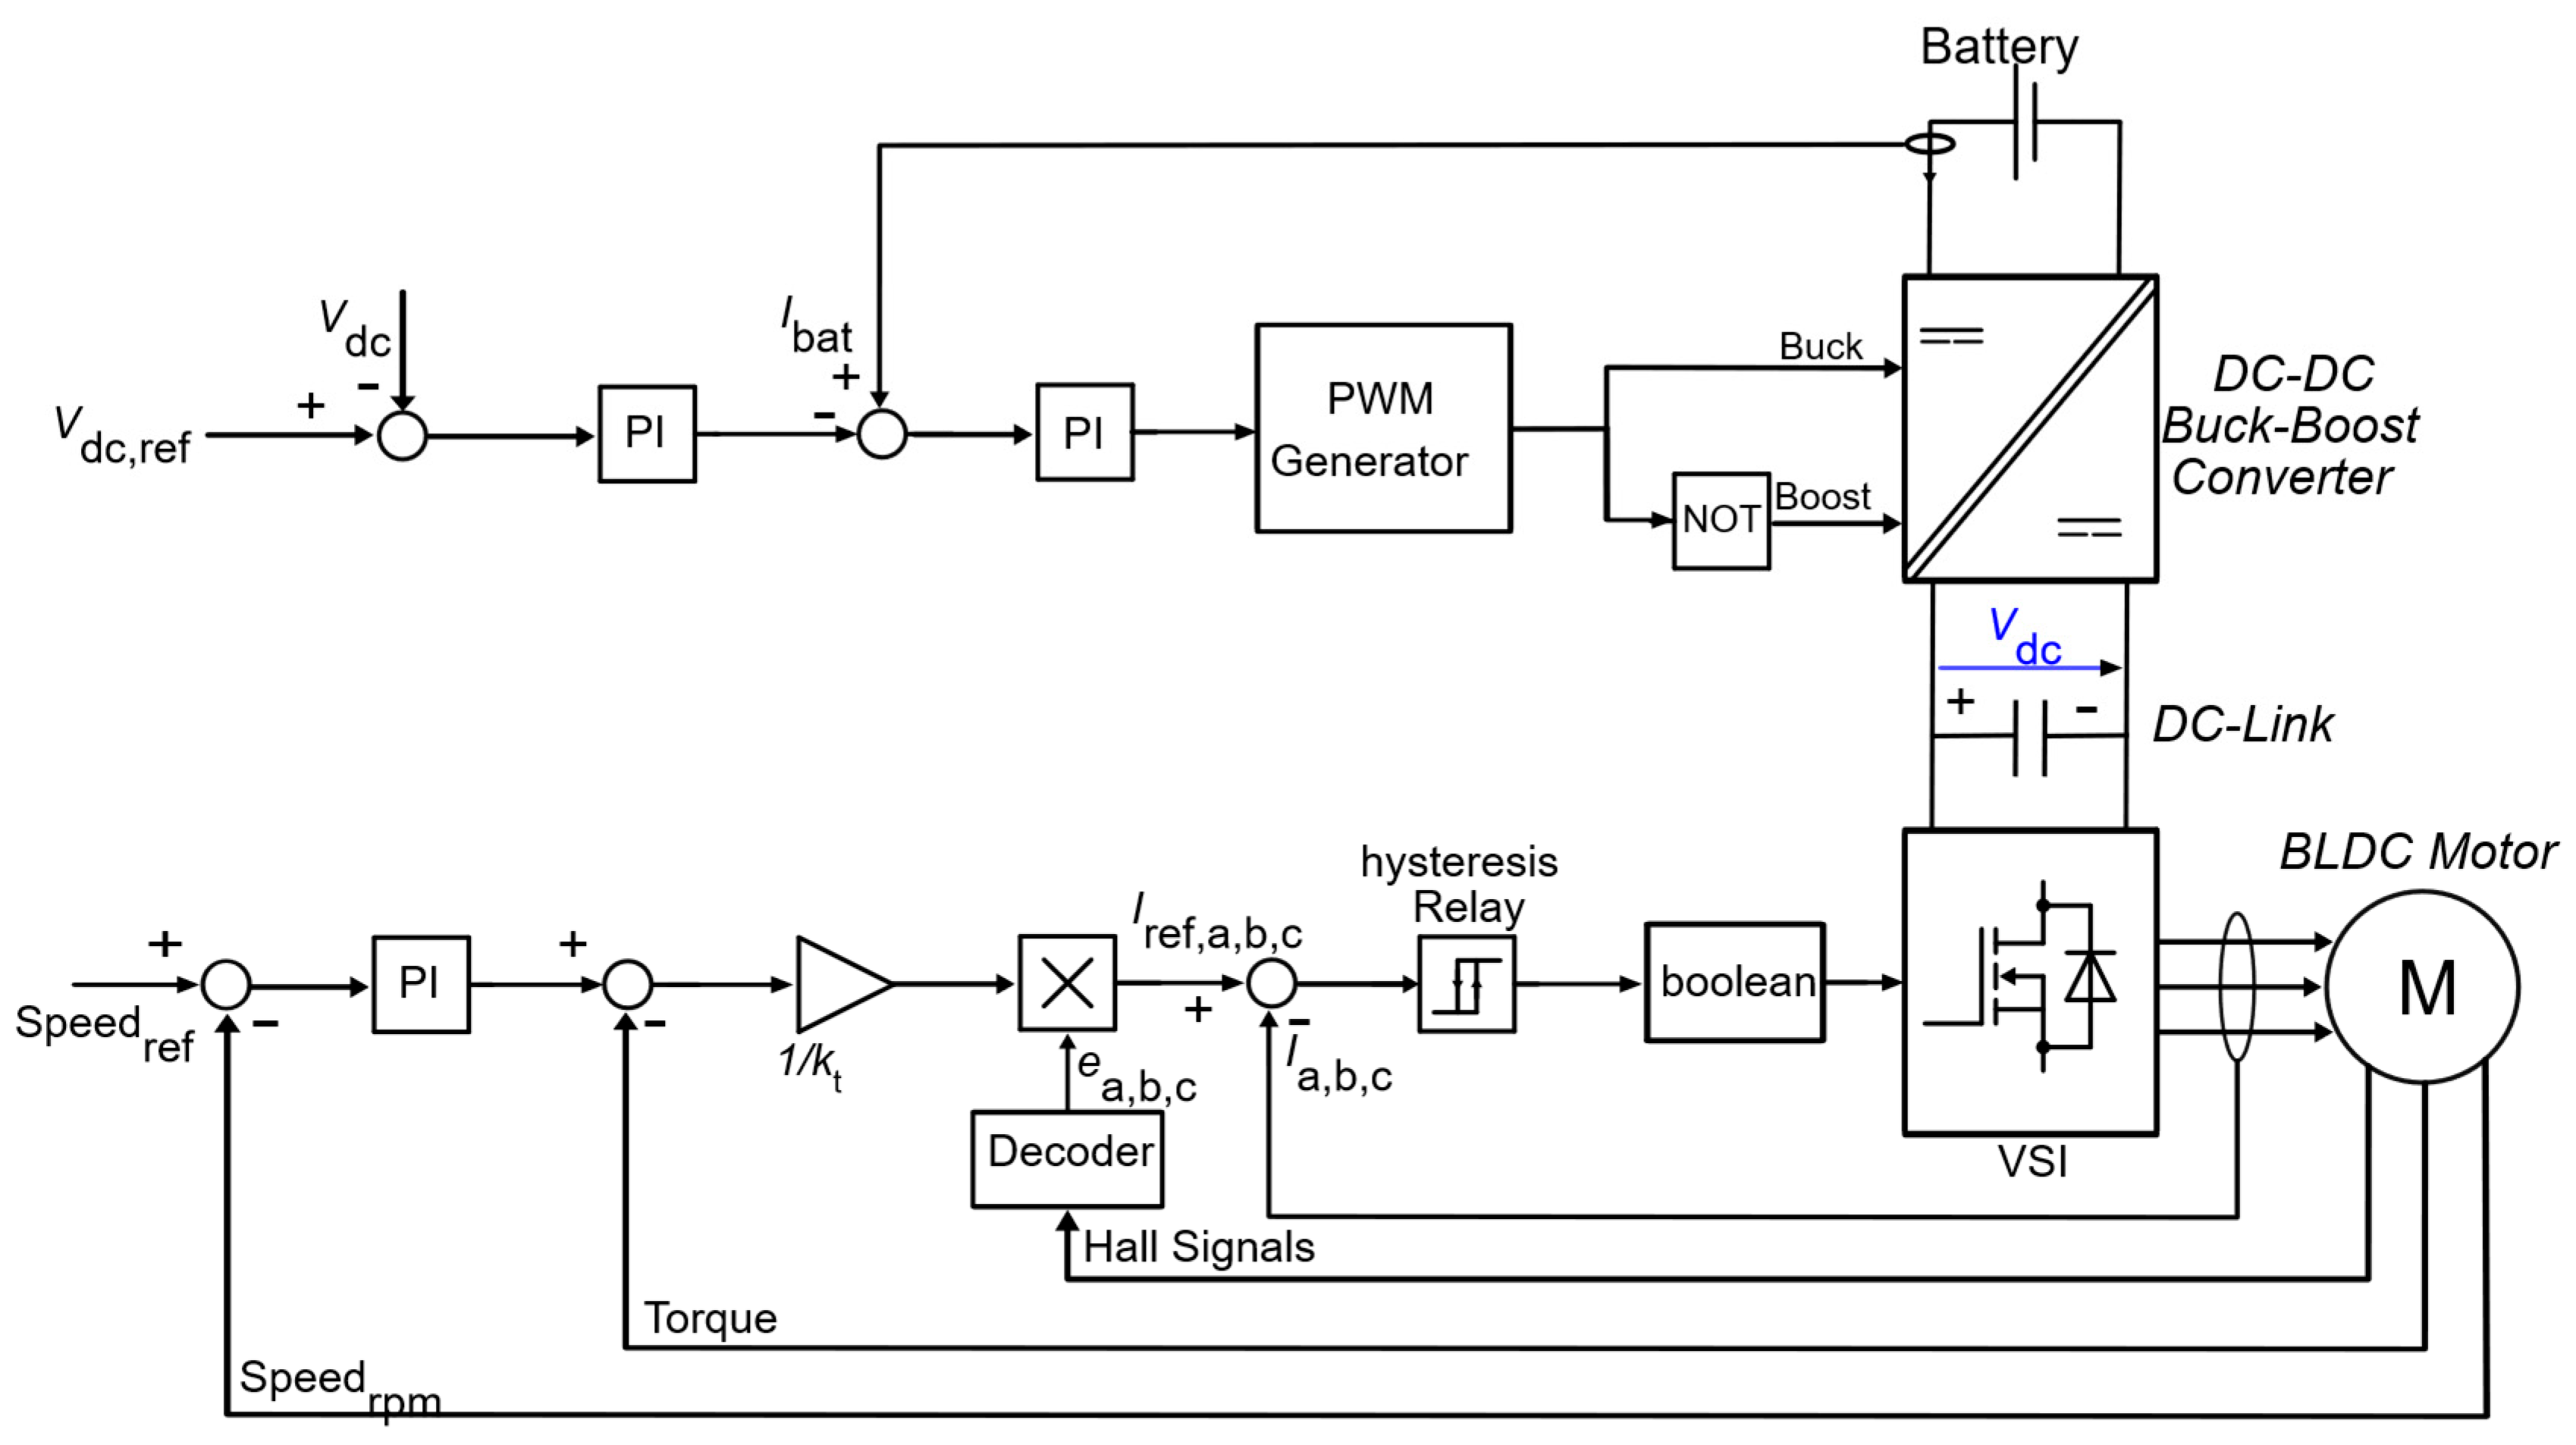
Figure 2 illustrates the supervisory control flow for the battery and BLDC motor controllers. These controllers use feedback signals—including battery current, measured DC-link voltage, phase currents, Hall sensor signals, instantaneous torque, and rotor speed, along with reference inputs such as the desired speed and DC-link voltage—to regulate battery current, maintain stable DC-link voltage, and control motor performance. Based on this information, the controllers generate the appropriate switching pulses for the DC–DC converter and the VSI.
According to
Table 1 and
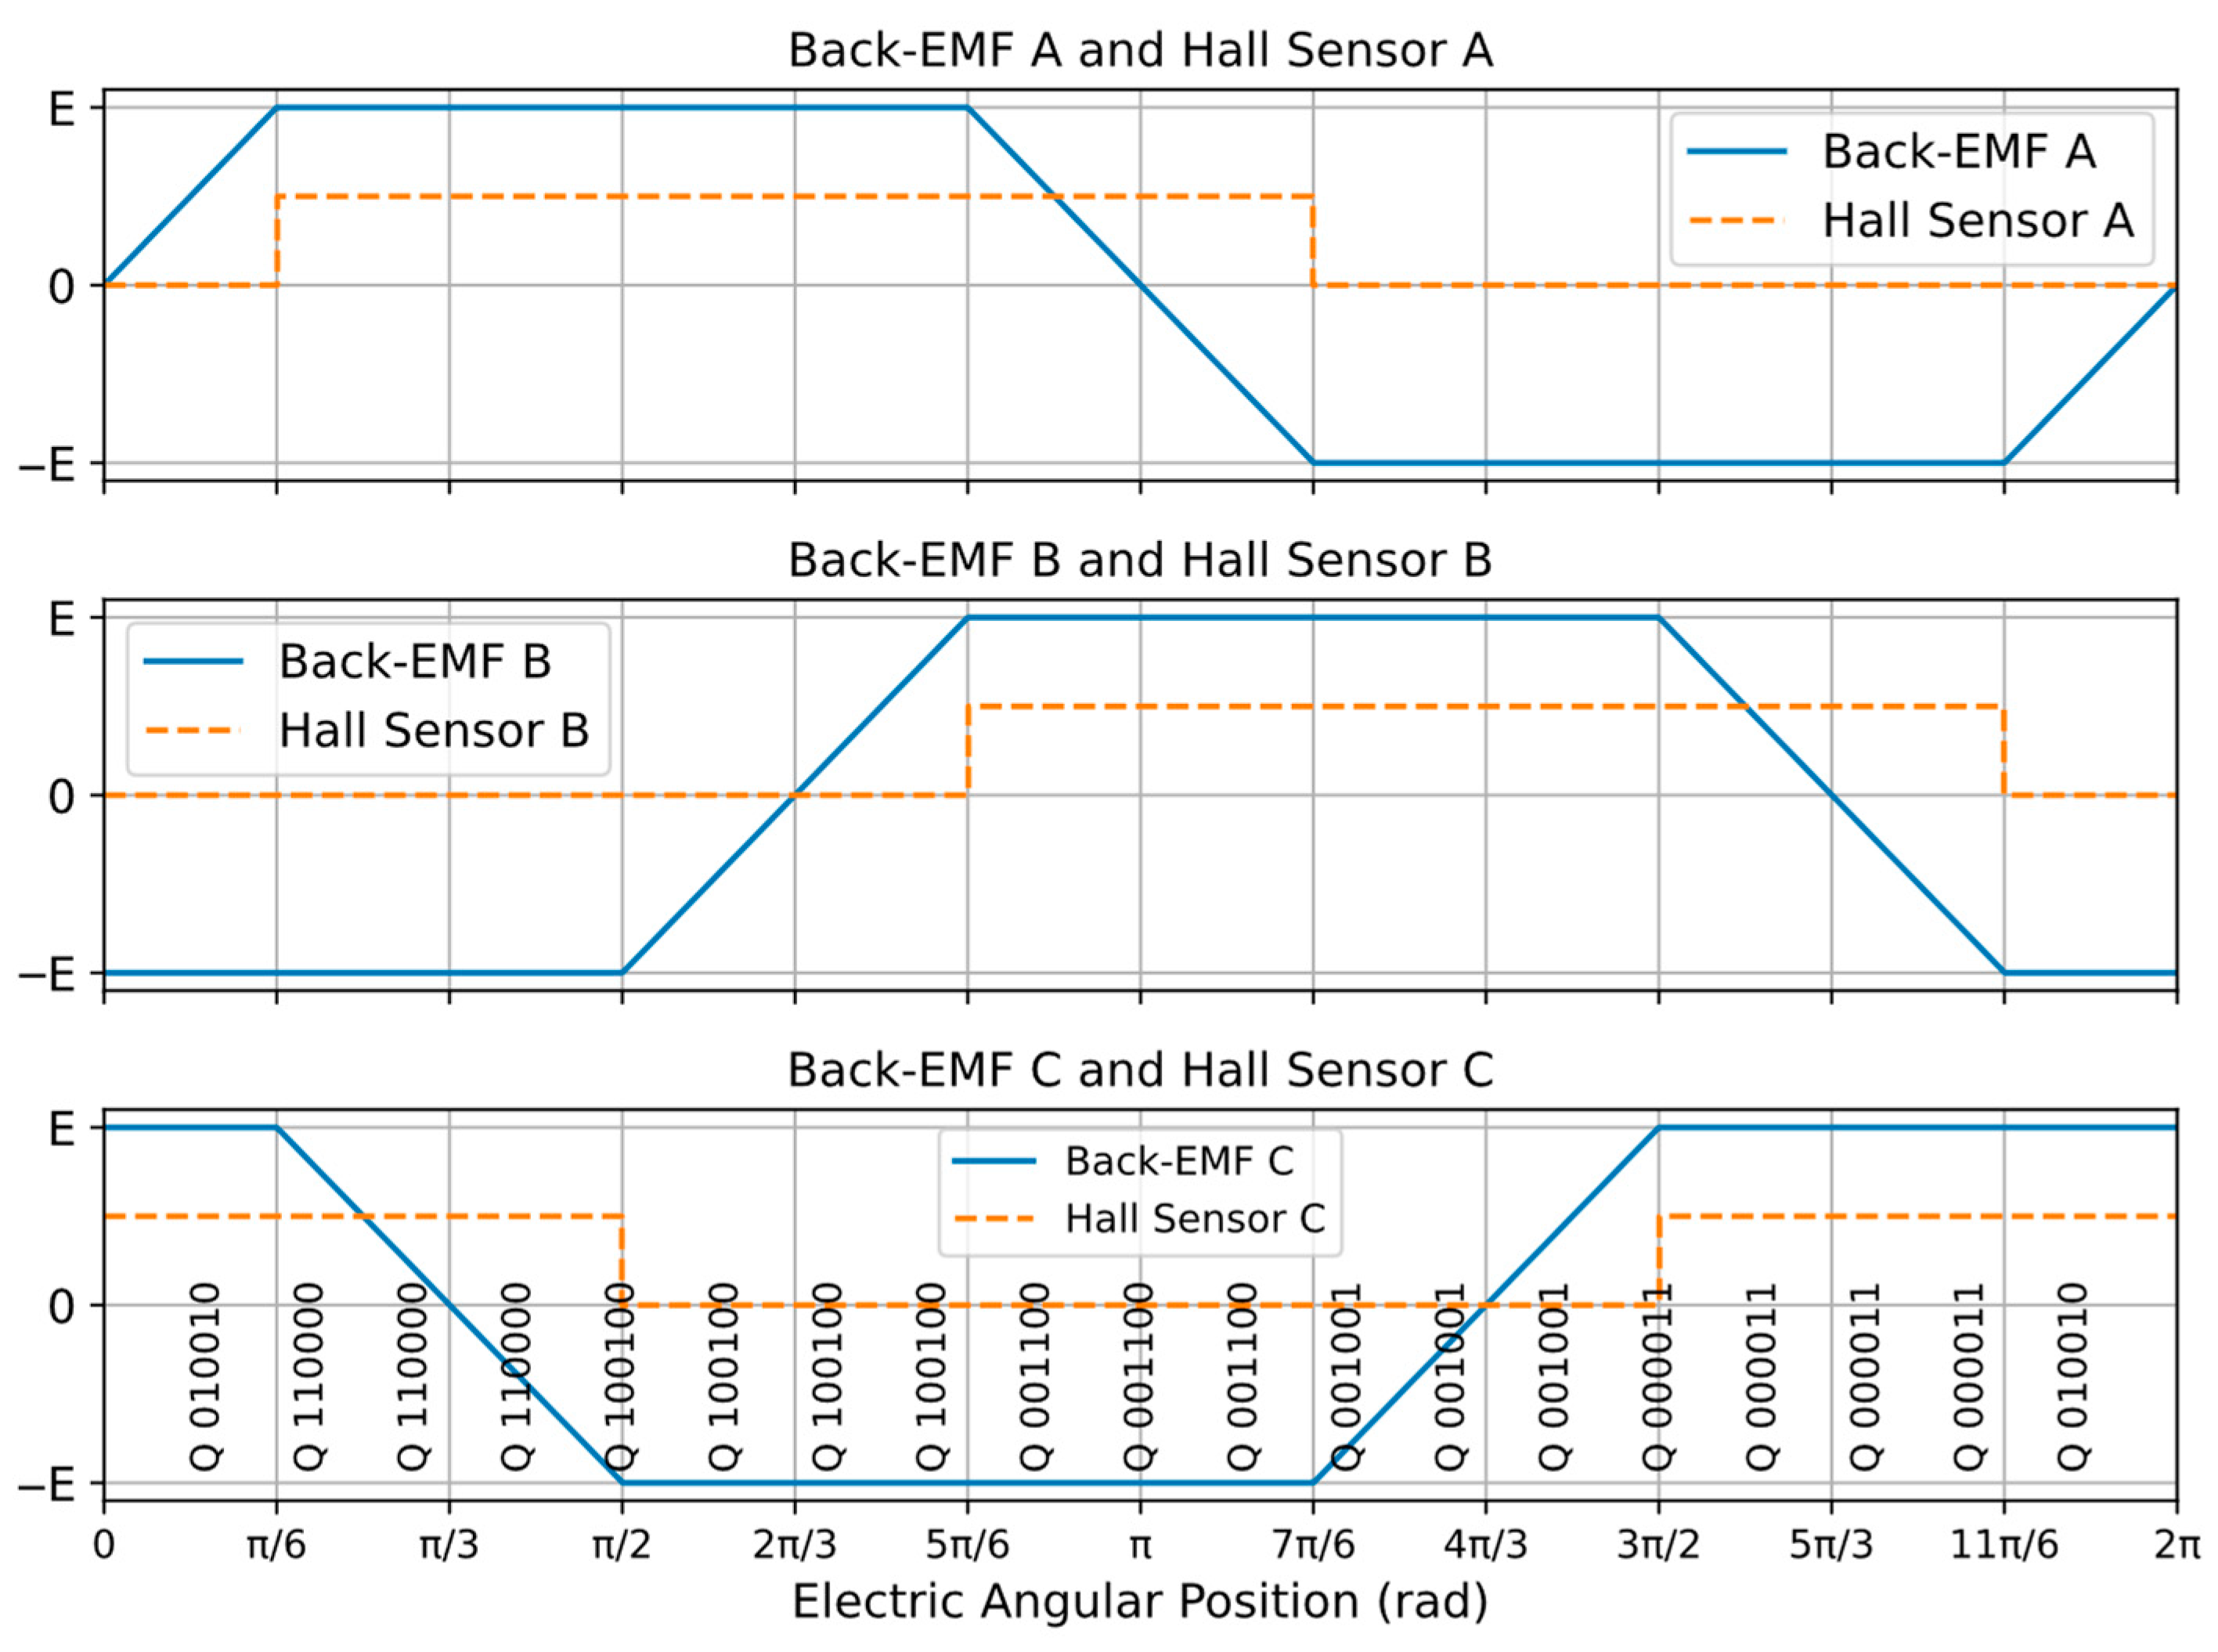
Figure 3, based on rotor position information determined by the Hall sensor signals, the BLDC motor control system energizes the appropriate motor phases by switching the corresponding VSI’s switches. For example, according to
Table 1, when the Hall sensor signals are
= 0,
= 0, and
= 1, the BLDC motor control system must generate the reference signals
= 0,
= −1, and
= +1. Accordingly, the VSI activates switches
and
, causing current to flow from the DC source through phase C and return via phase B. This corresponds to the switching state
in
Figure 3, where the voltage of phase
is
and that of phase
is
.
The reference signals
,
, and
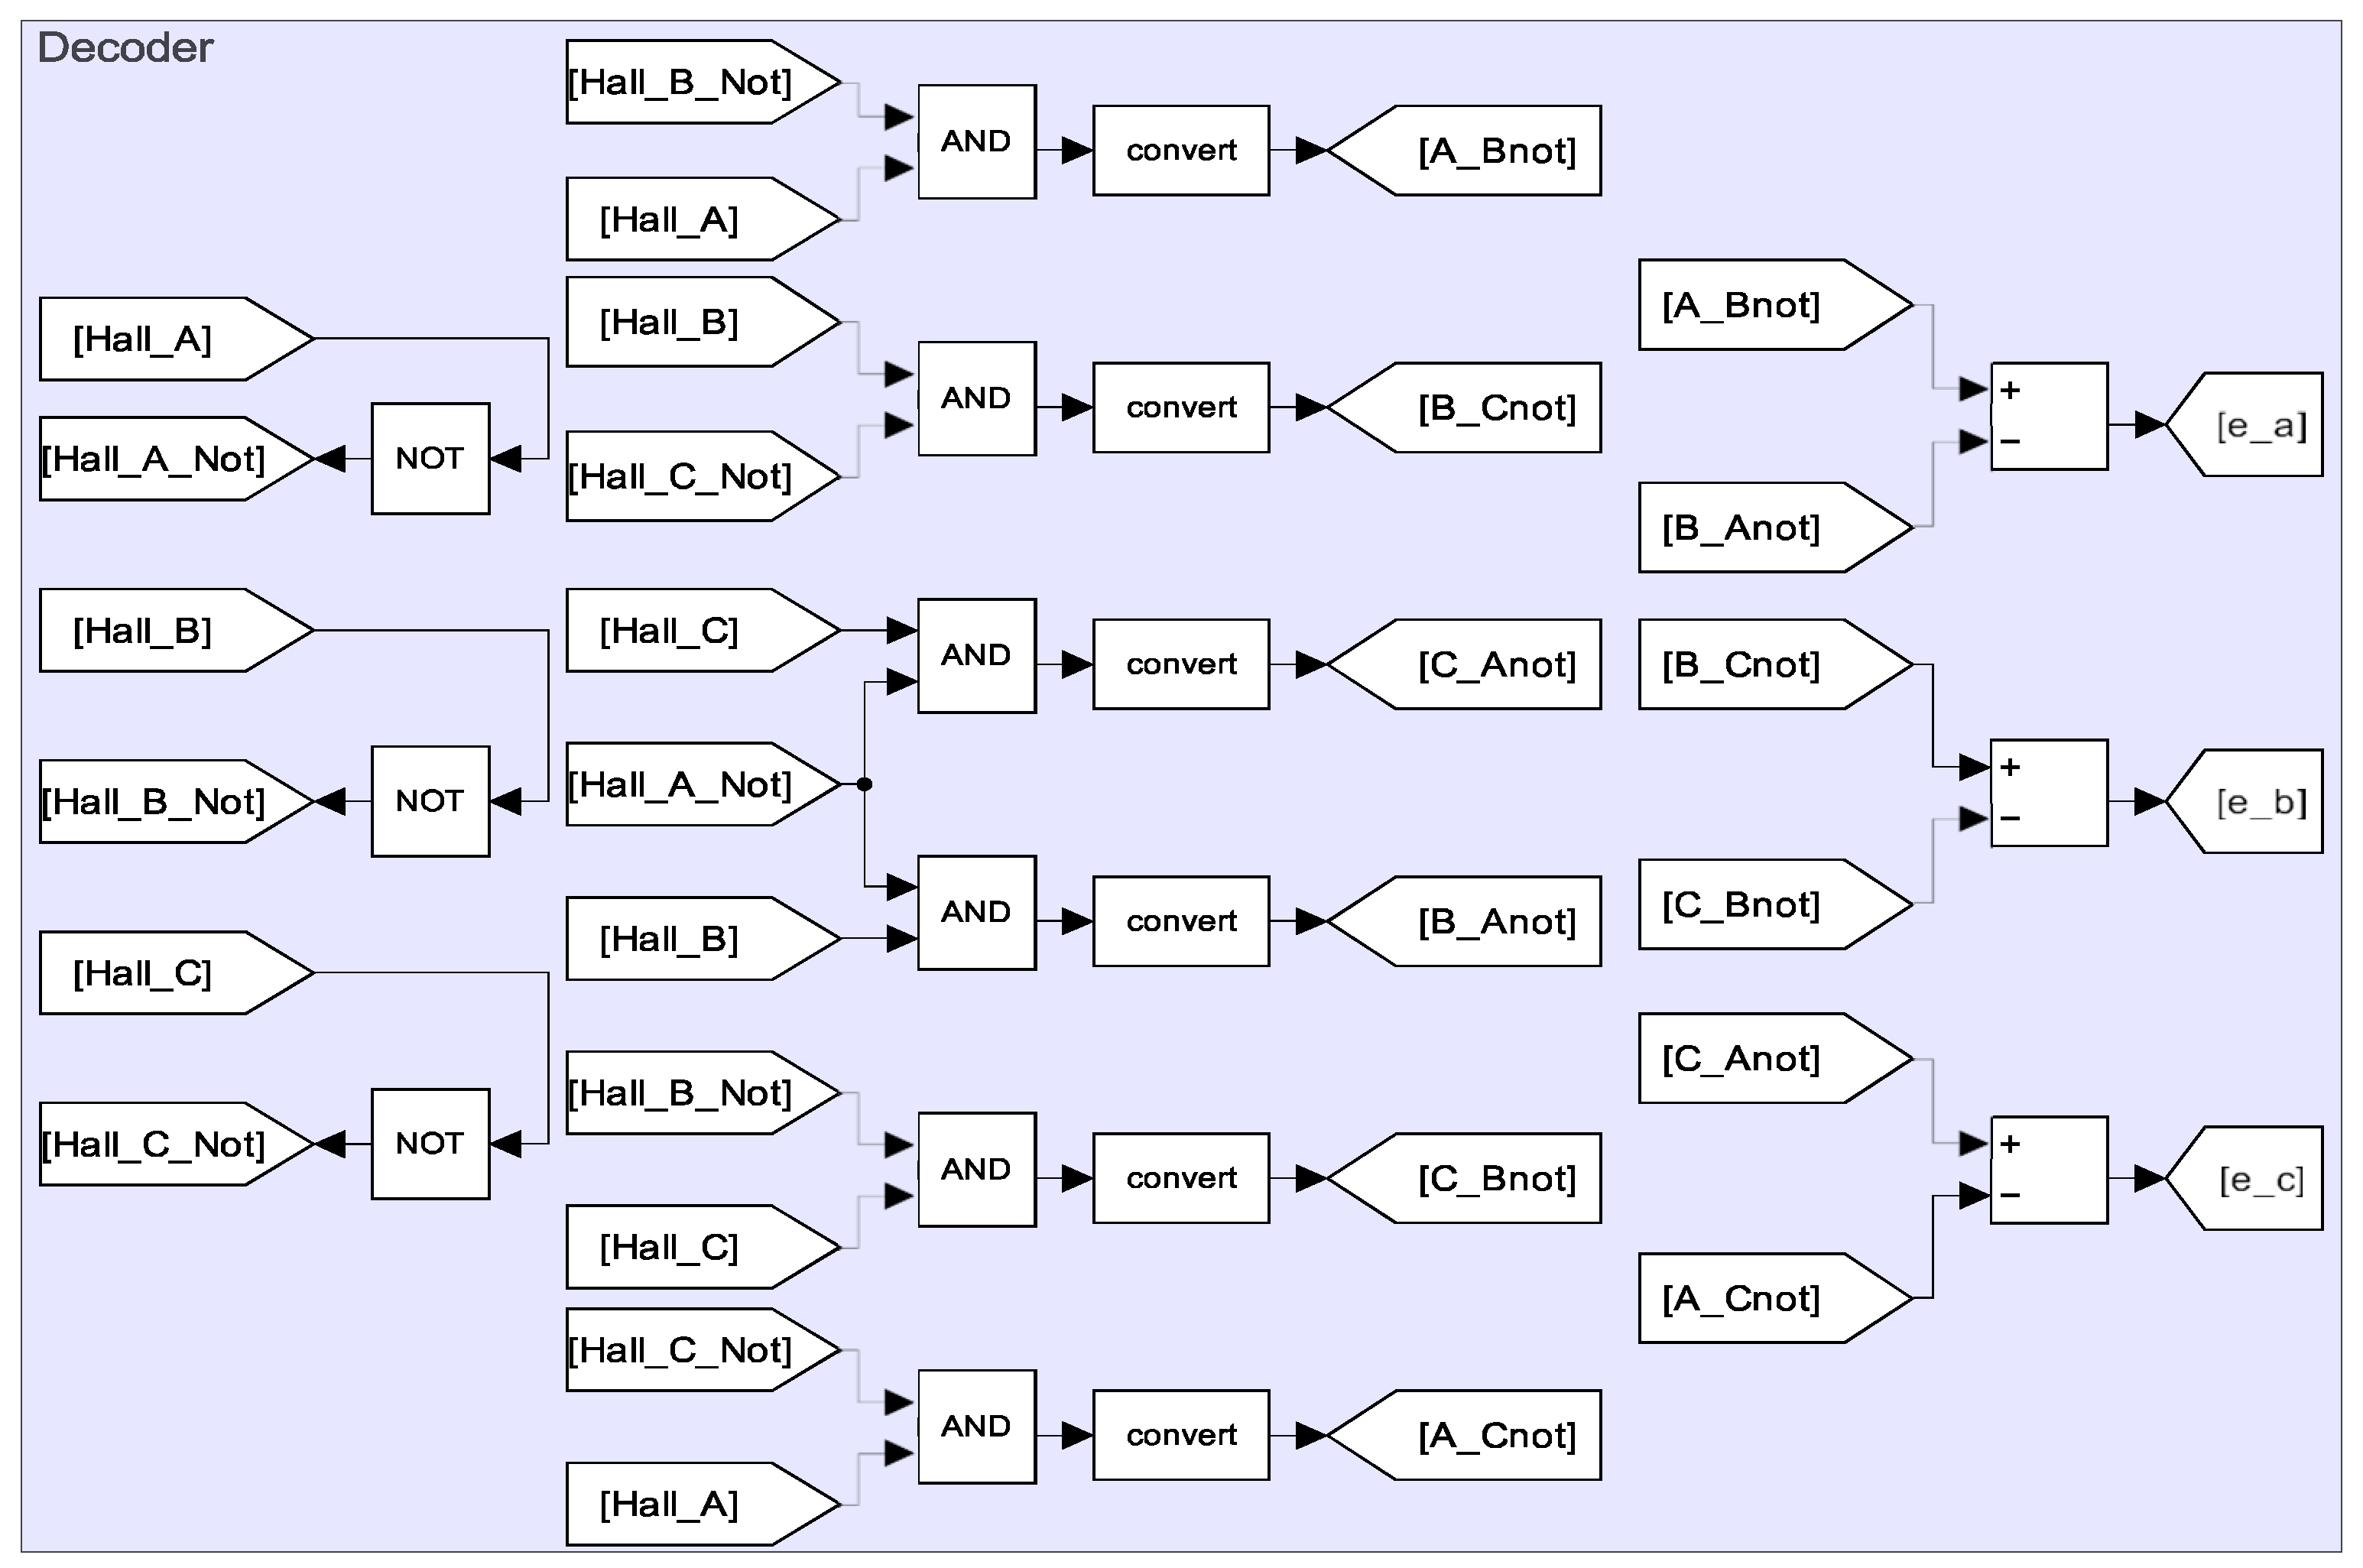
are generated by the decoder system shown in
Figure 4. For example, to generate
, we observe from
Table 1 that there are two switching states in which
= −1 (where
and
), corresponding to the logic condition
in
Figure 4. Similarly, in two other states,
(where
and
), which corresponds to
. Therefore, the signal
can be expressed as
. The other reference signals (
and
) can be derived using the same method based on the respective Hall sensor inputs.
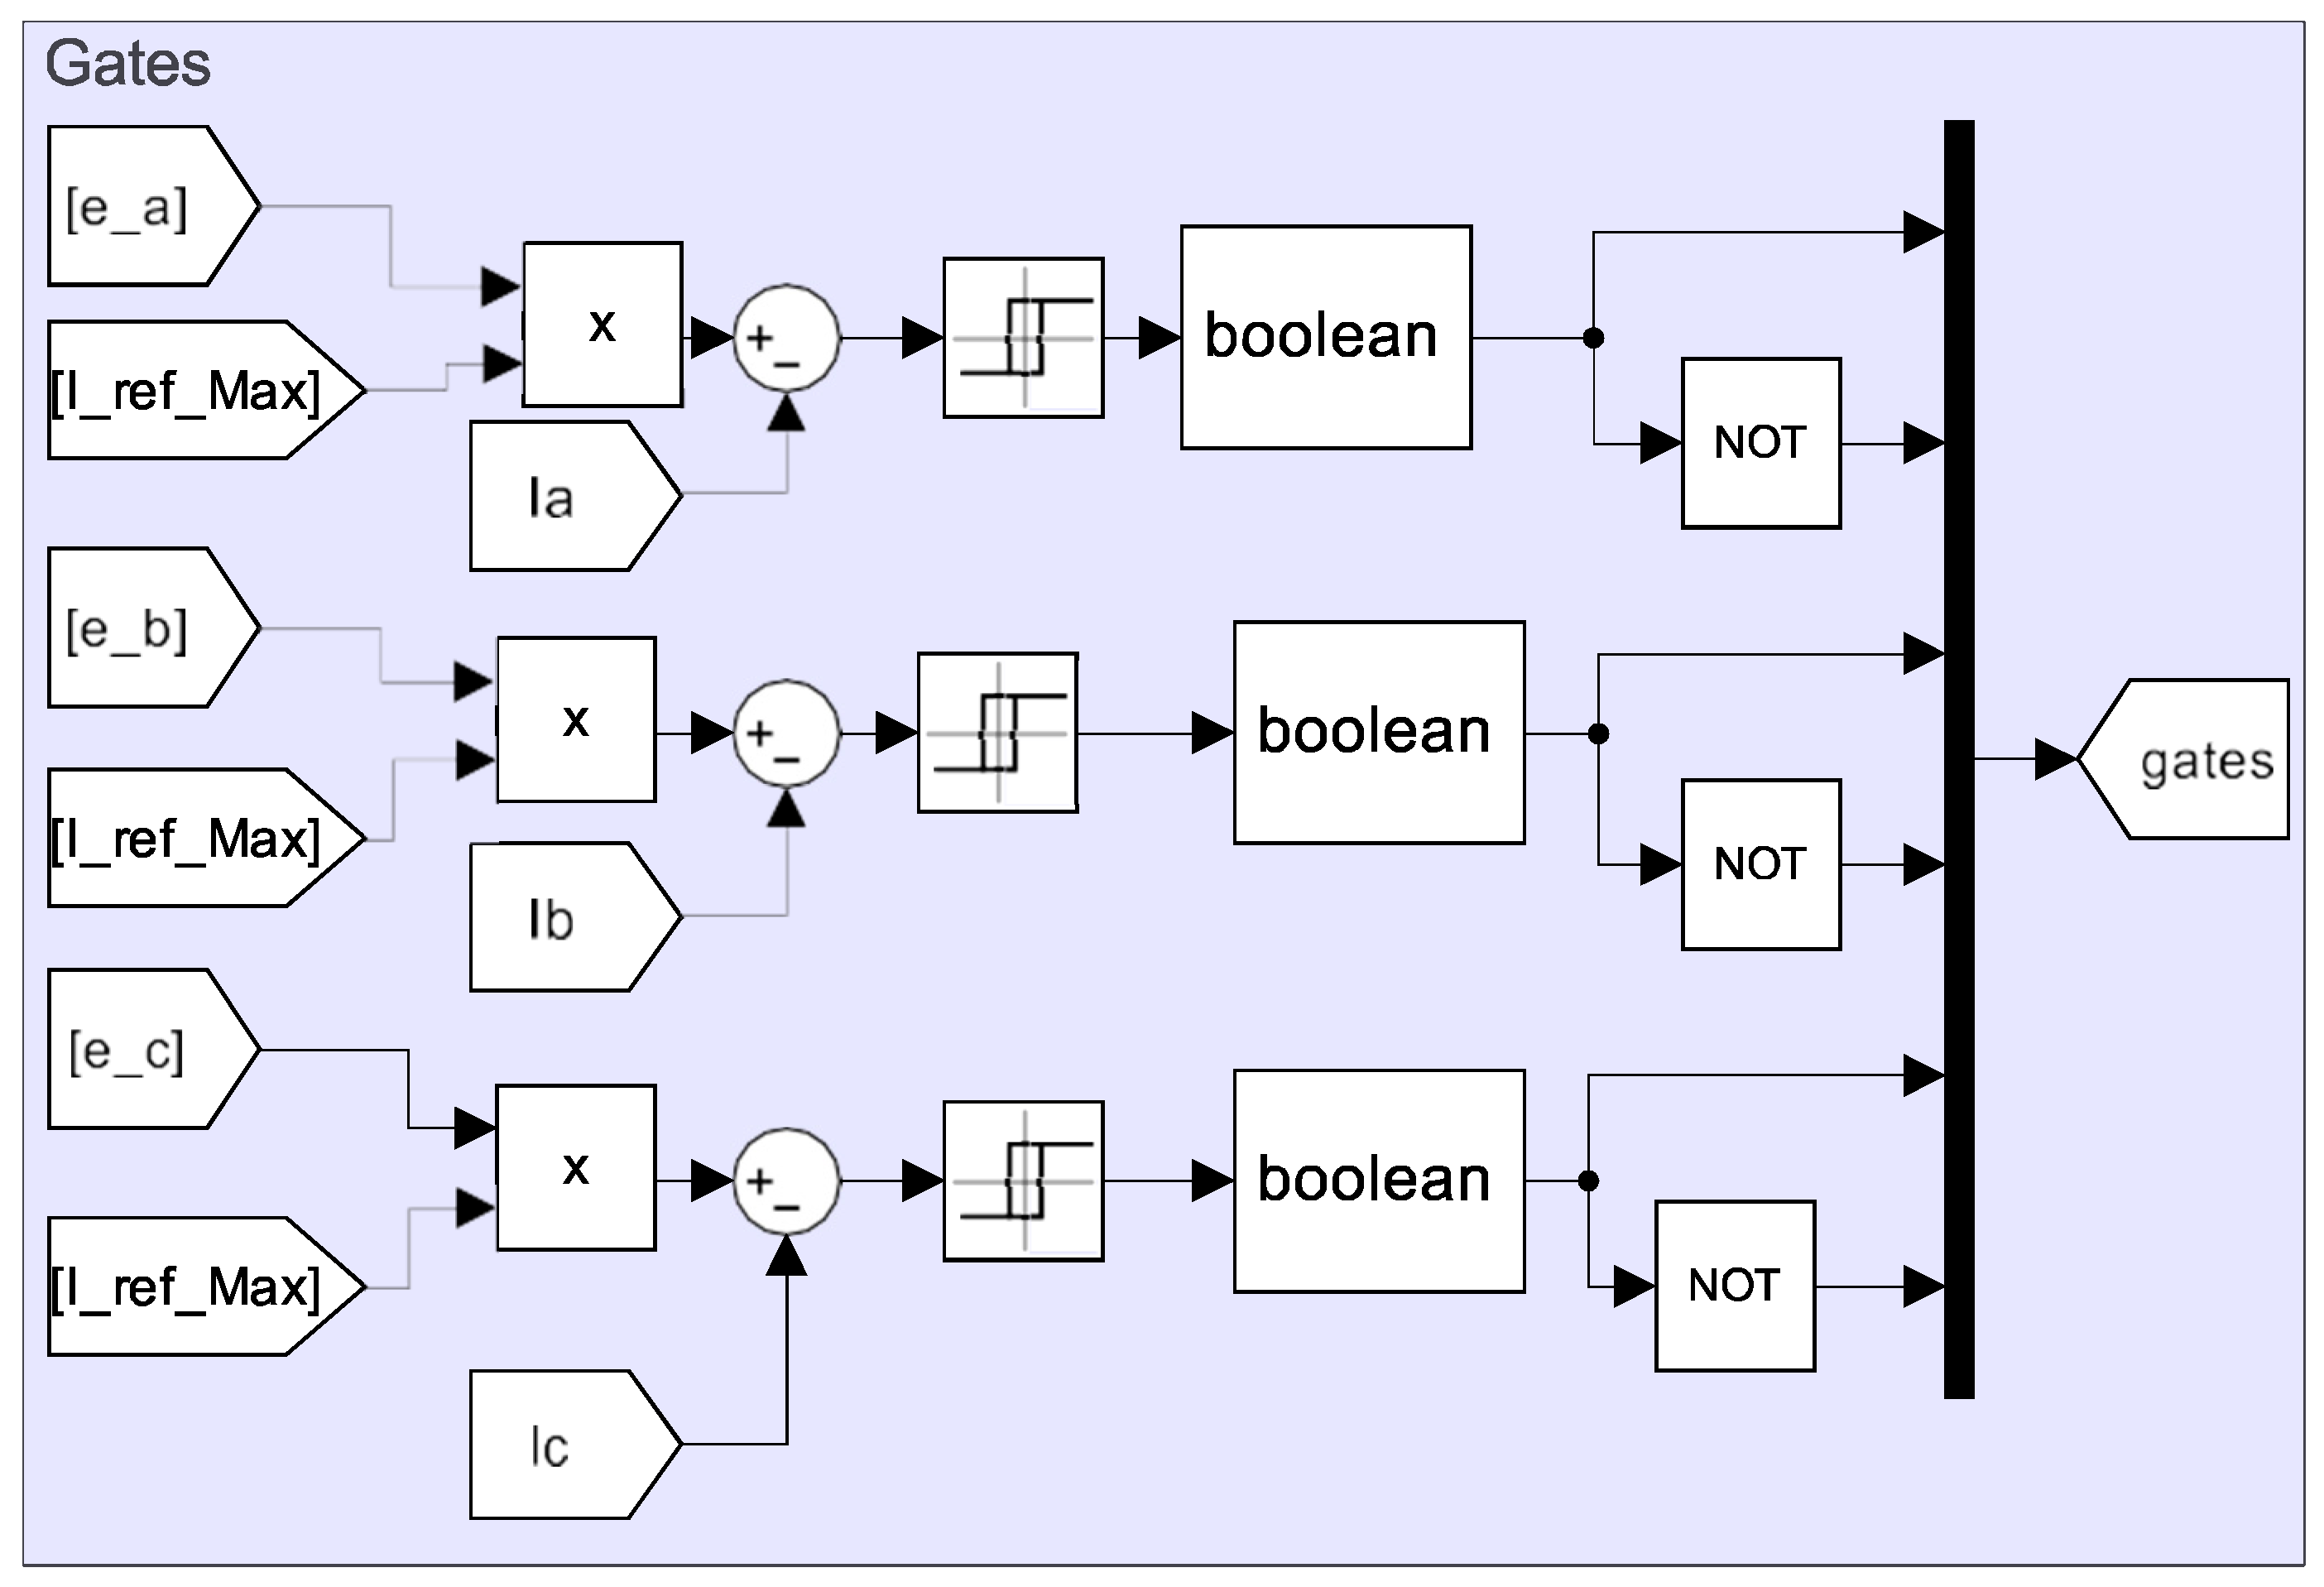
To enable current flow through the motor phases as defined in
Table 1, the motor drive gate signals are generated, as illustrated in
Figure 5. The control strategy in
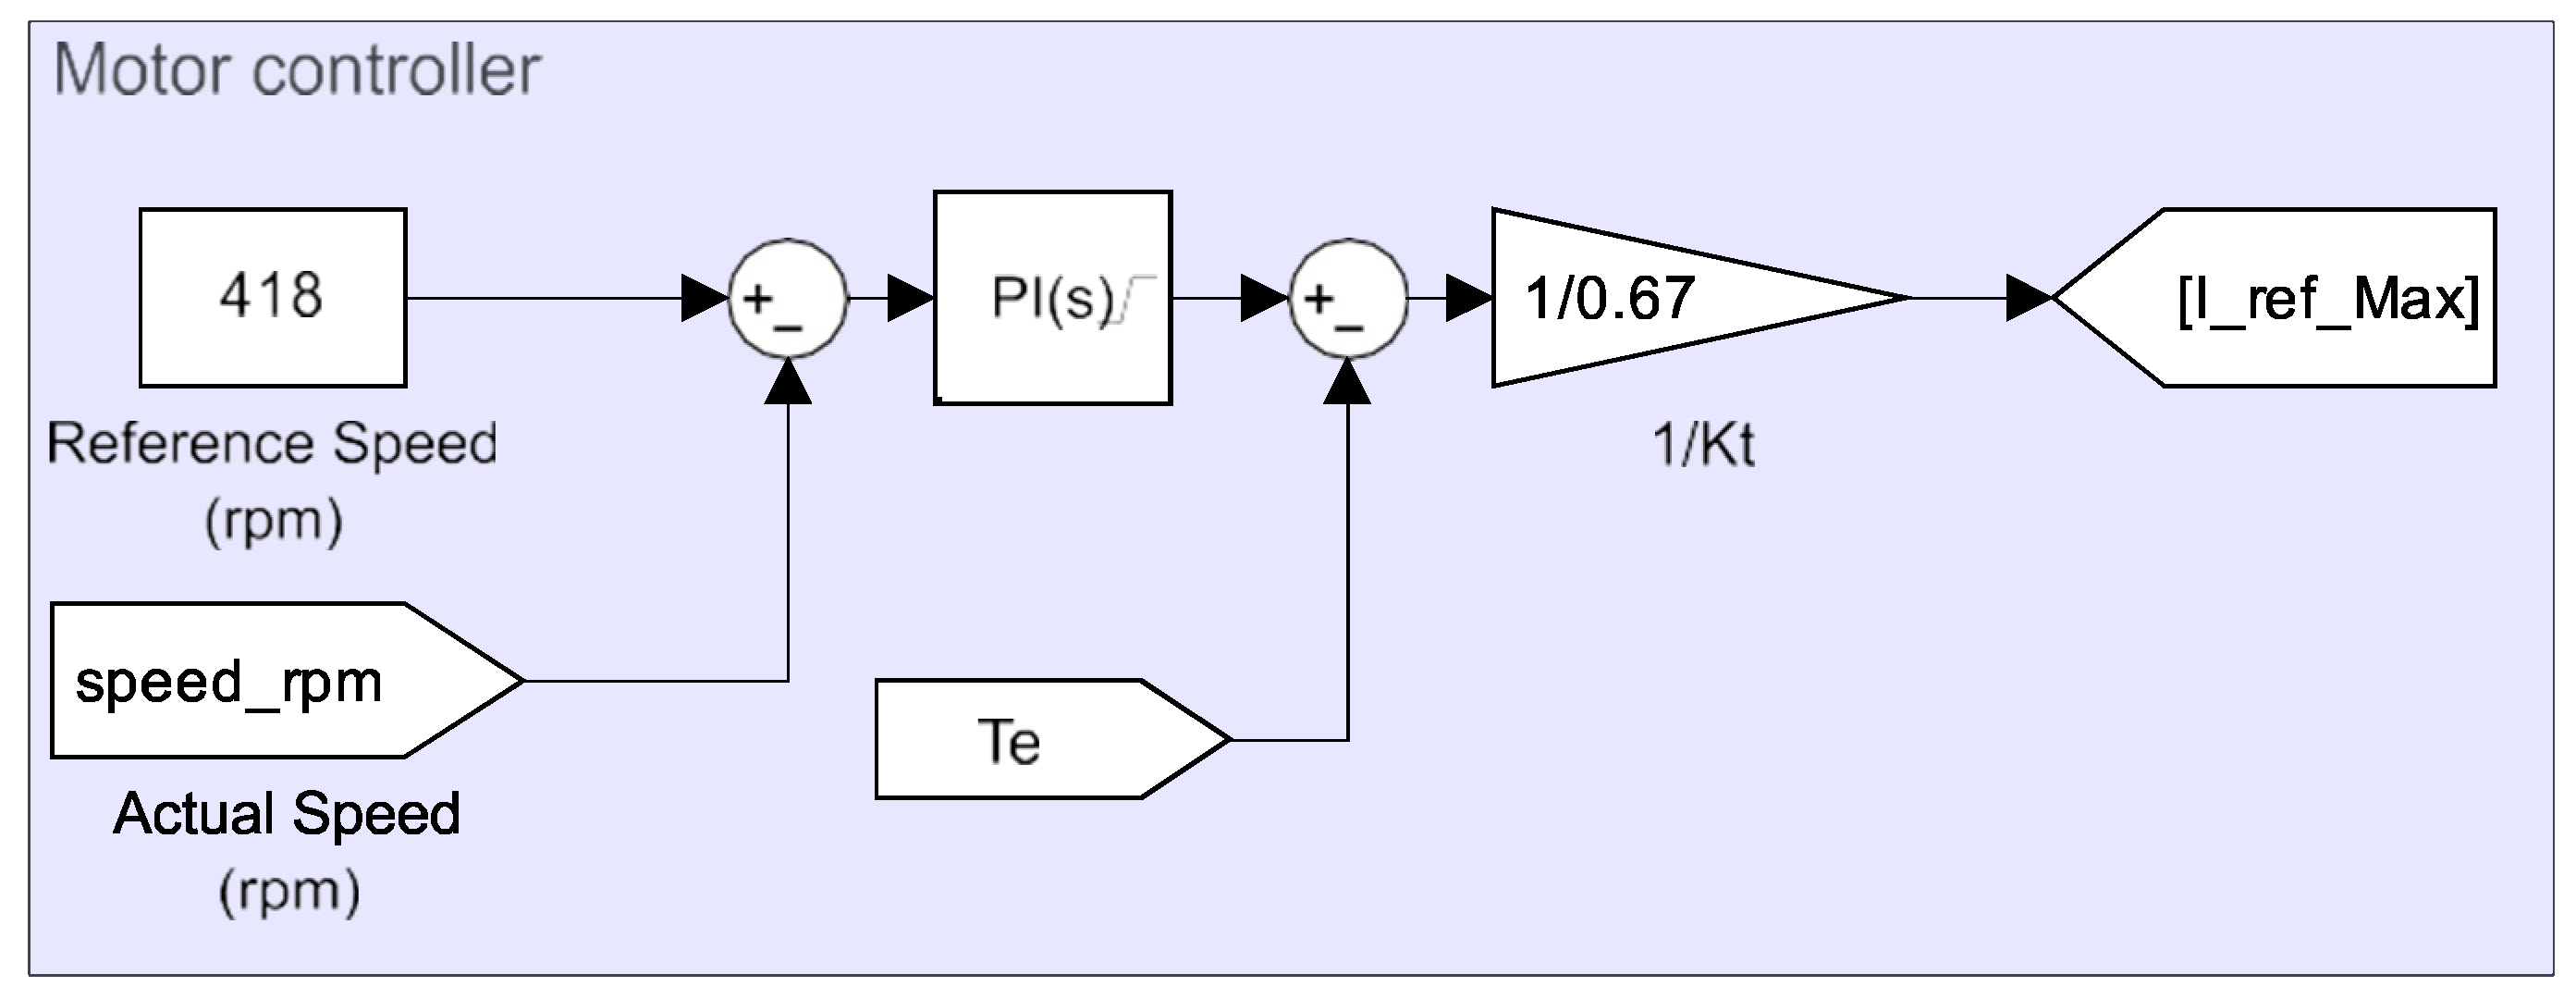
Figure 6 begins by comparing the reference speed with the instantaneous speed of the BLDC motor. The resulting speed error is fed into a PI controller with proportional and integral gains of
and
, respectively, to generate the maximum allowable reference torque
. This torque is then compared to the instantaneous motor torque, and the difference is divided by the torque constant
to produce the maximum allowable reference current.
This maximum current is multiplied by the reference signals
,
, and
, and then compared with the instantaneous phase currents, as shown in
Figure 5. The resulting signals pass through a type of hysteresis relay, with the thresholds defined in (11), to generate pulses—and are subsequently converted from analog to logic signals using a boolean unit.
Here, is the previous value of the output, which means maintaining the current state in the dead band, and denotes the error signal obtained by comparing the maximum reference current with the instantaneous value of each phase current.
These final control signals are sent to the VSI gate drivers. Ultimately, the output of this control chain governs the motor drive gate signals. To provide a stabilized DC voltage for the VSI and the BLDC motor, a DC–DC buck-boost converter is used. This converter consists of two switches, an inductor
and a DC-link capacitor
(
). The minimum critical values for the DC-link capacitor
and the inductor
in the buck-boost converter are determined from (12) and (13).
where
is the switching frequency,
and
are the ripple of inductor current and DC-link voltage, and
is the VSI current on the DC side.
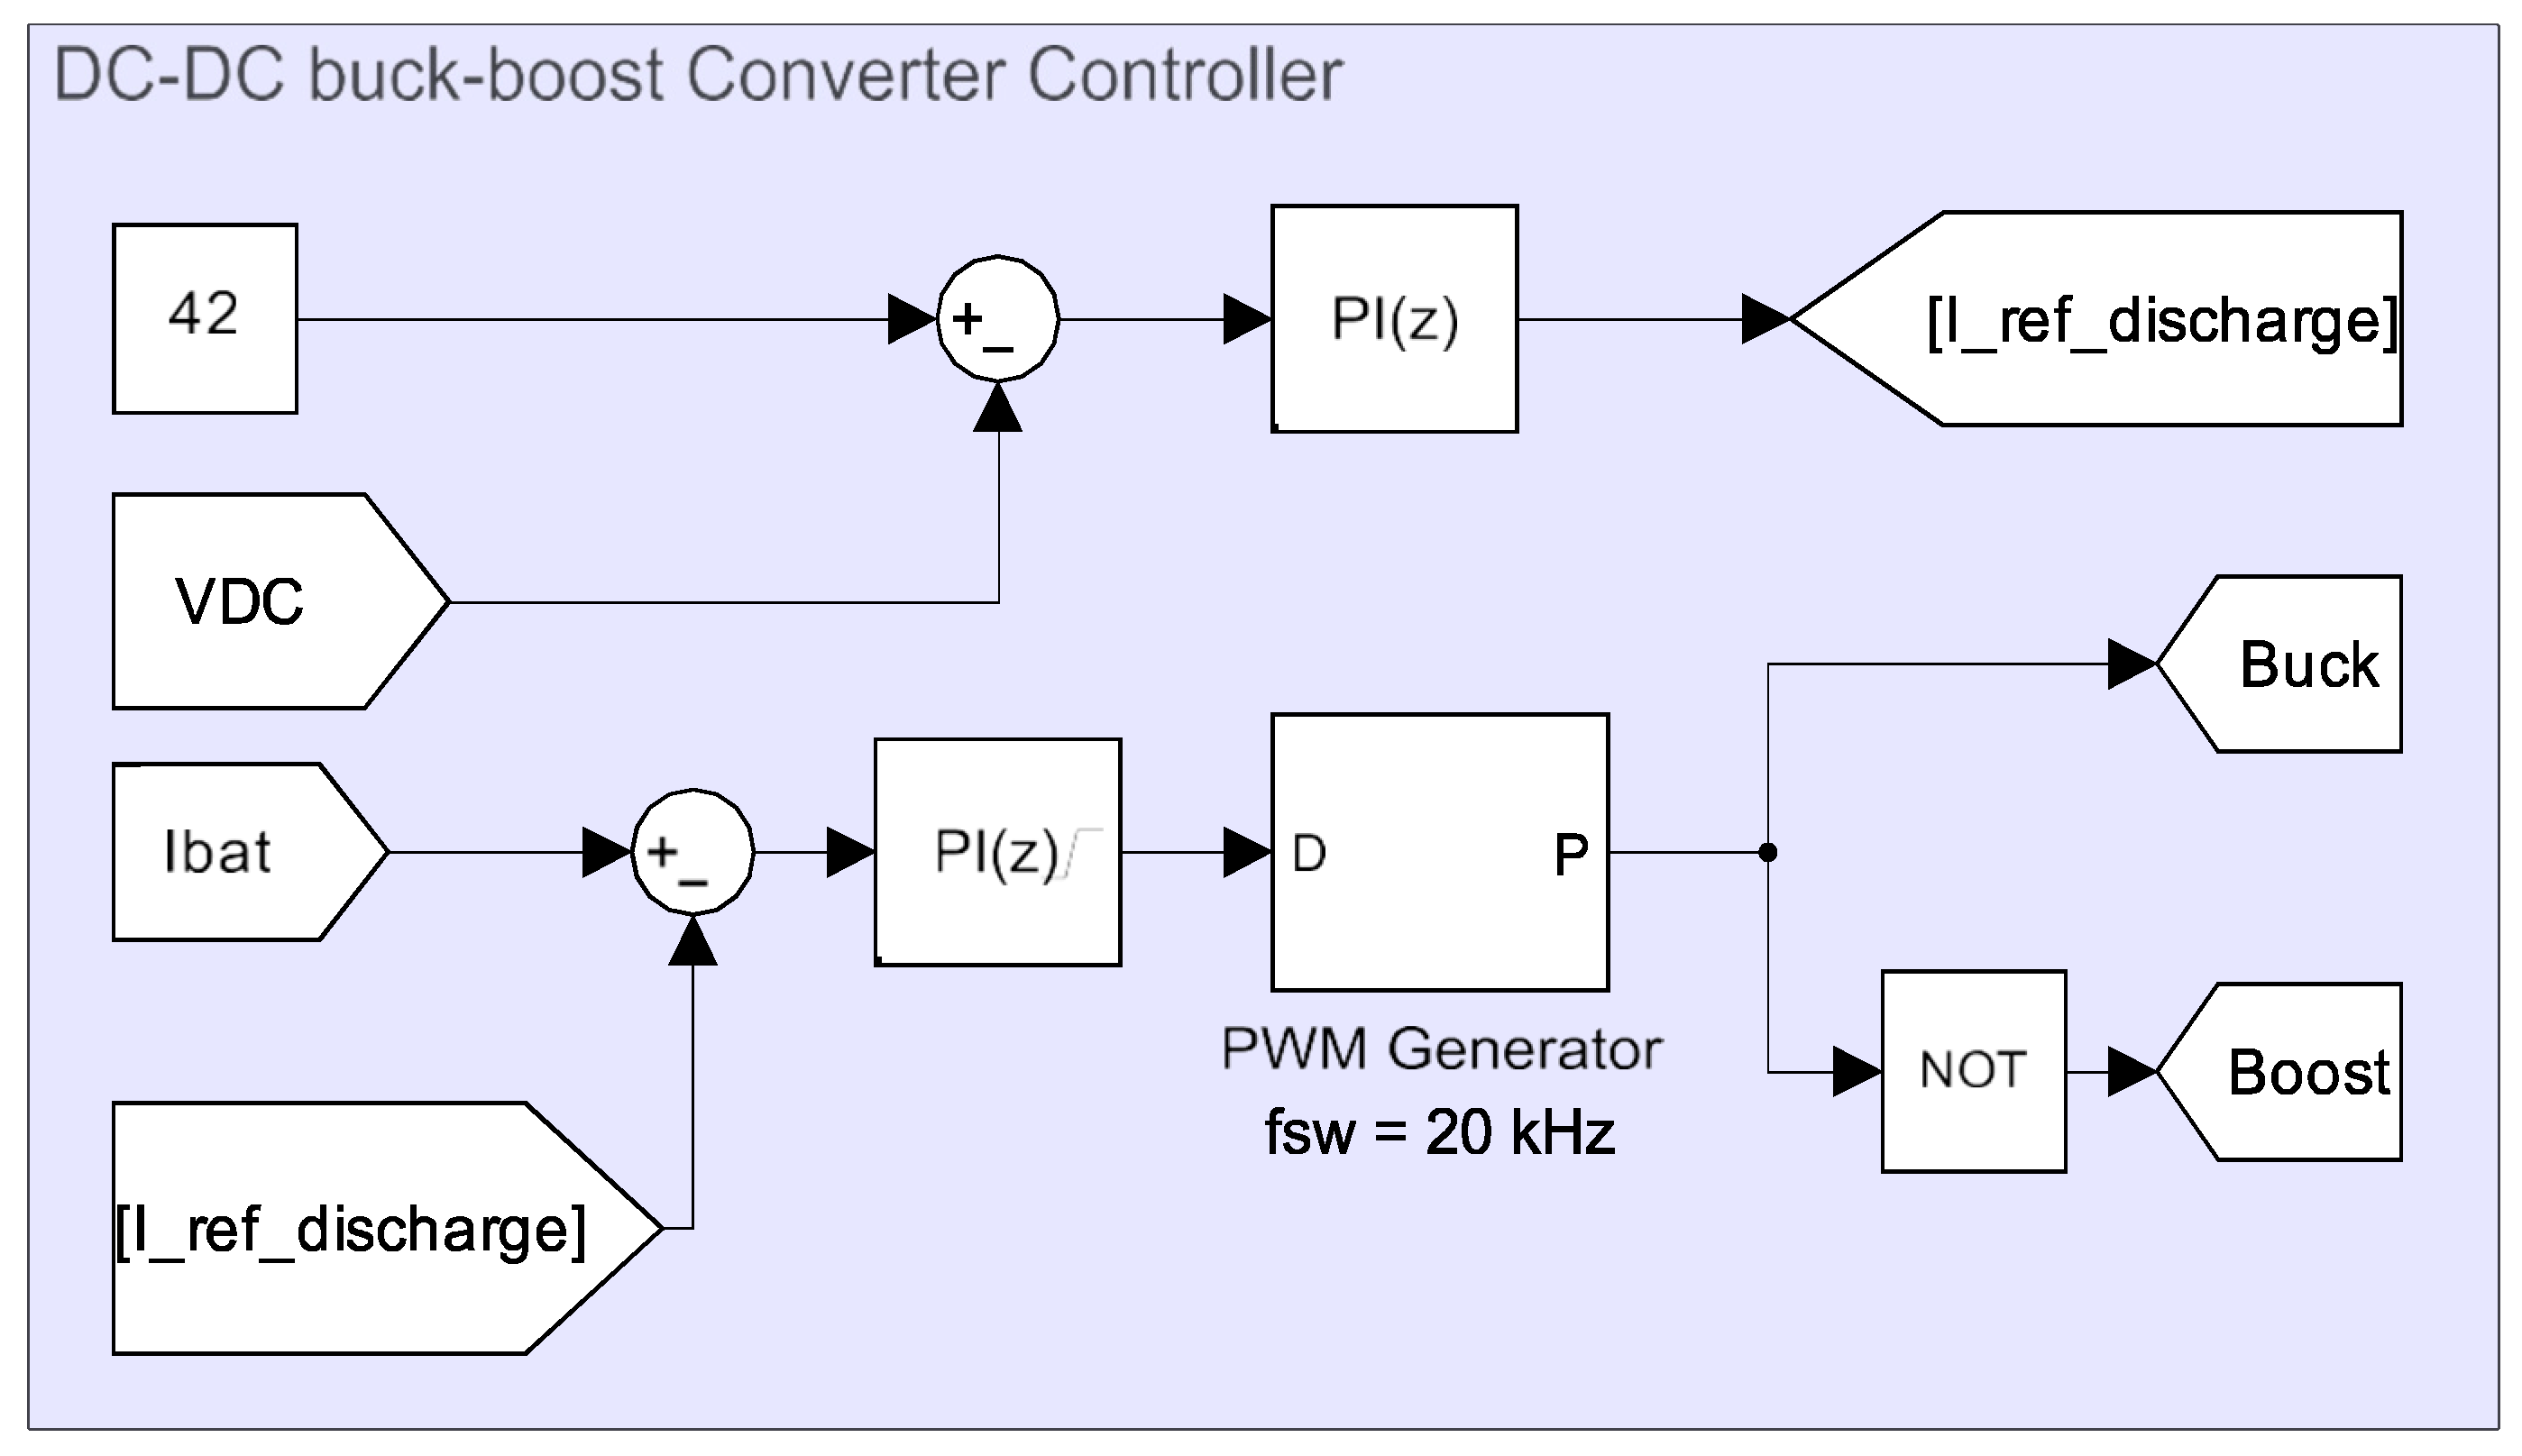
The buck-boost converter controller shown in
Figure 7 adjusts the current drawn from the battery based on keeping the DC-link voltage constant on
. The PI controller in this controller has proportional and integral gains of
= 0.5 and
= 50, respectively. The pulse generator has a frequency of
.
The relationship between the power drawn from the battery and the mechanical output power of the motor is obtained from (14).
where
and
are the battery power and the mechanical output power of the motor and
,
, and
are the efficiencies of the buck-boost converter, the VSI, and the BLDC motor.
3. Simulation Results
The introduced model was simulated in the MATLAB/Simulink R2024a environment. The battery used in this simulation was a generic lithium-ion battery model available in MATLAB/Simulink. The nominal voltage, nominal capacity, and initial SOC of the battery were set to and , respectively. The internal resistance of the battery was , and the nominal discharge current was 5.56 A. The effects of temperature and battery aging are not considered in this model. The VSI was modeled using the Universal Bridge block in MATLAB/Simulink, with the power electronic device type set to “MOSFET/Diodes”. The BLDC motor was implemented using the Permanent Magnet Synchronous Machine block, configured with a trapezoidal back-EMF waveform. All motor parameters were set according to predefined values (presented later in Table 3). The simulation was run for 0.3 s to achieve optimal waveform clarity for analysis. Initially, the reference speed was set to (, based on a 10-inch wheel diameter of a scooter), and the load torque was maintained at . To evaluate the model’s sensitivity to speed changes, the reference speed was reduced to at . Additionally, to assess the model’s sensitivity to load changes, the mechanical load was increased to 2.2 Nm at .
Figure 8 illustrates the motor speed, torque, and three-phase currents, which exhibit a phase difference of 120 electrical degrees. Within
, the motor speed stabilized at a reference speed of
. After the speed reduction, the control system responded effectively, stabilizing the motor speed at the new reference value in less than
. When the load was increased, no visible change occurred in the speed diagram, indicating that the motor successfully maintained its speed without ripple. As shown in
Figure 8, at
, a momentary decrease in speed causes the BLDC motor to enter generator mode, with the torque reversing to negative values. By comparing the torque waveforms in Zones 1, 2, and 3, it is observed that Zone 3 exhibits the highest torque ripple, while Zone 2 shows the lowest. This reveals that both speed and load variations proportionally affect the torque ripple. In addition, a comparison of the steady-state current waveforms in Zones 1 and 2 shows that the motor current amplitude remains nearly unchanged despite the reduction in speed, indicating consistent torque demand.
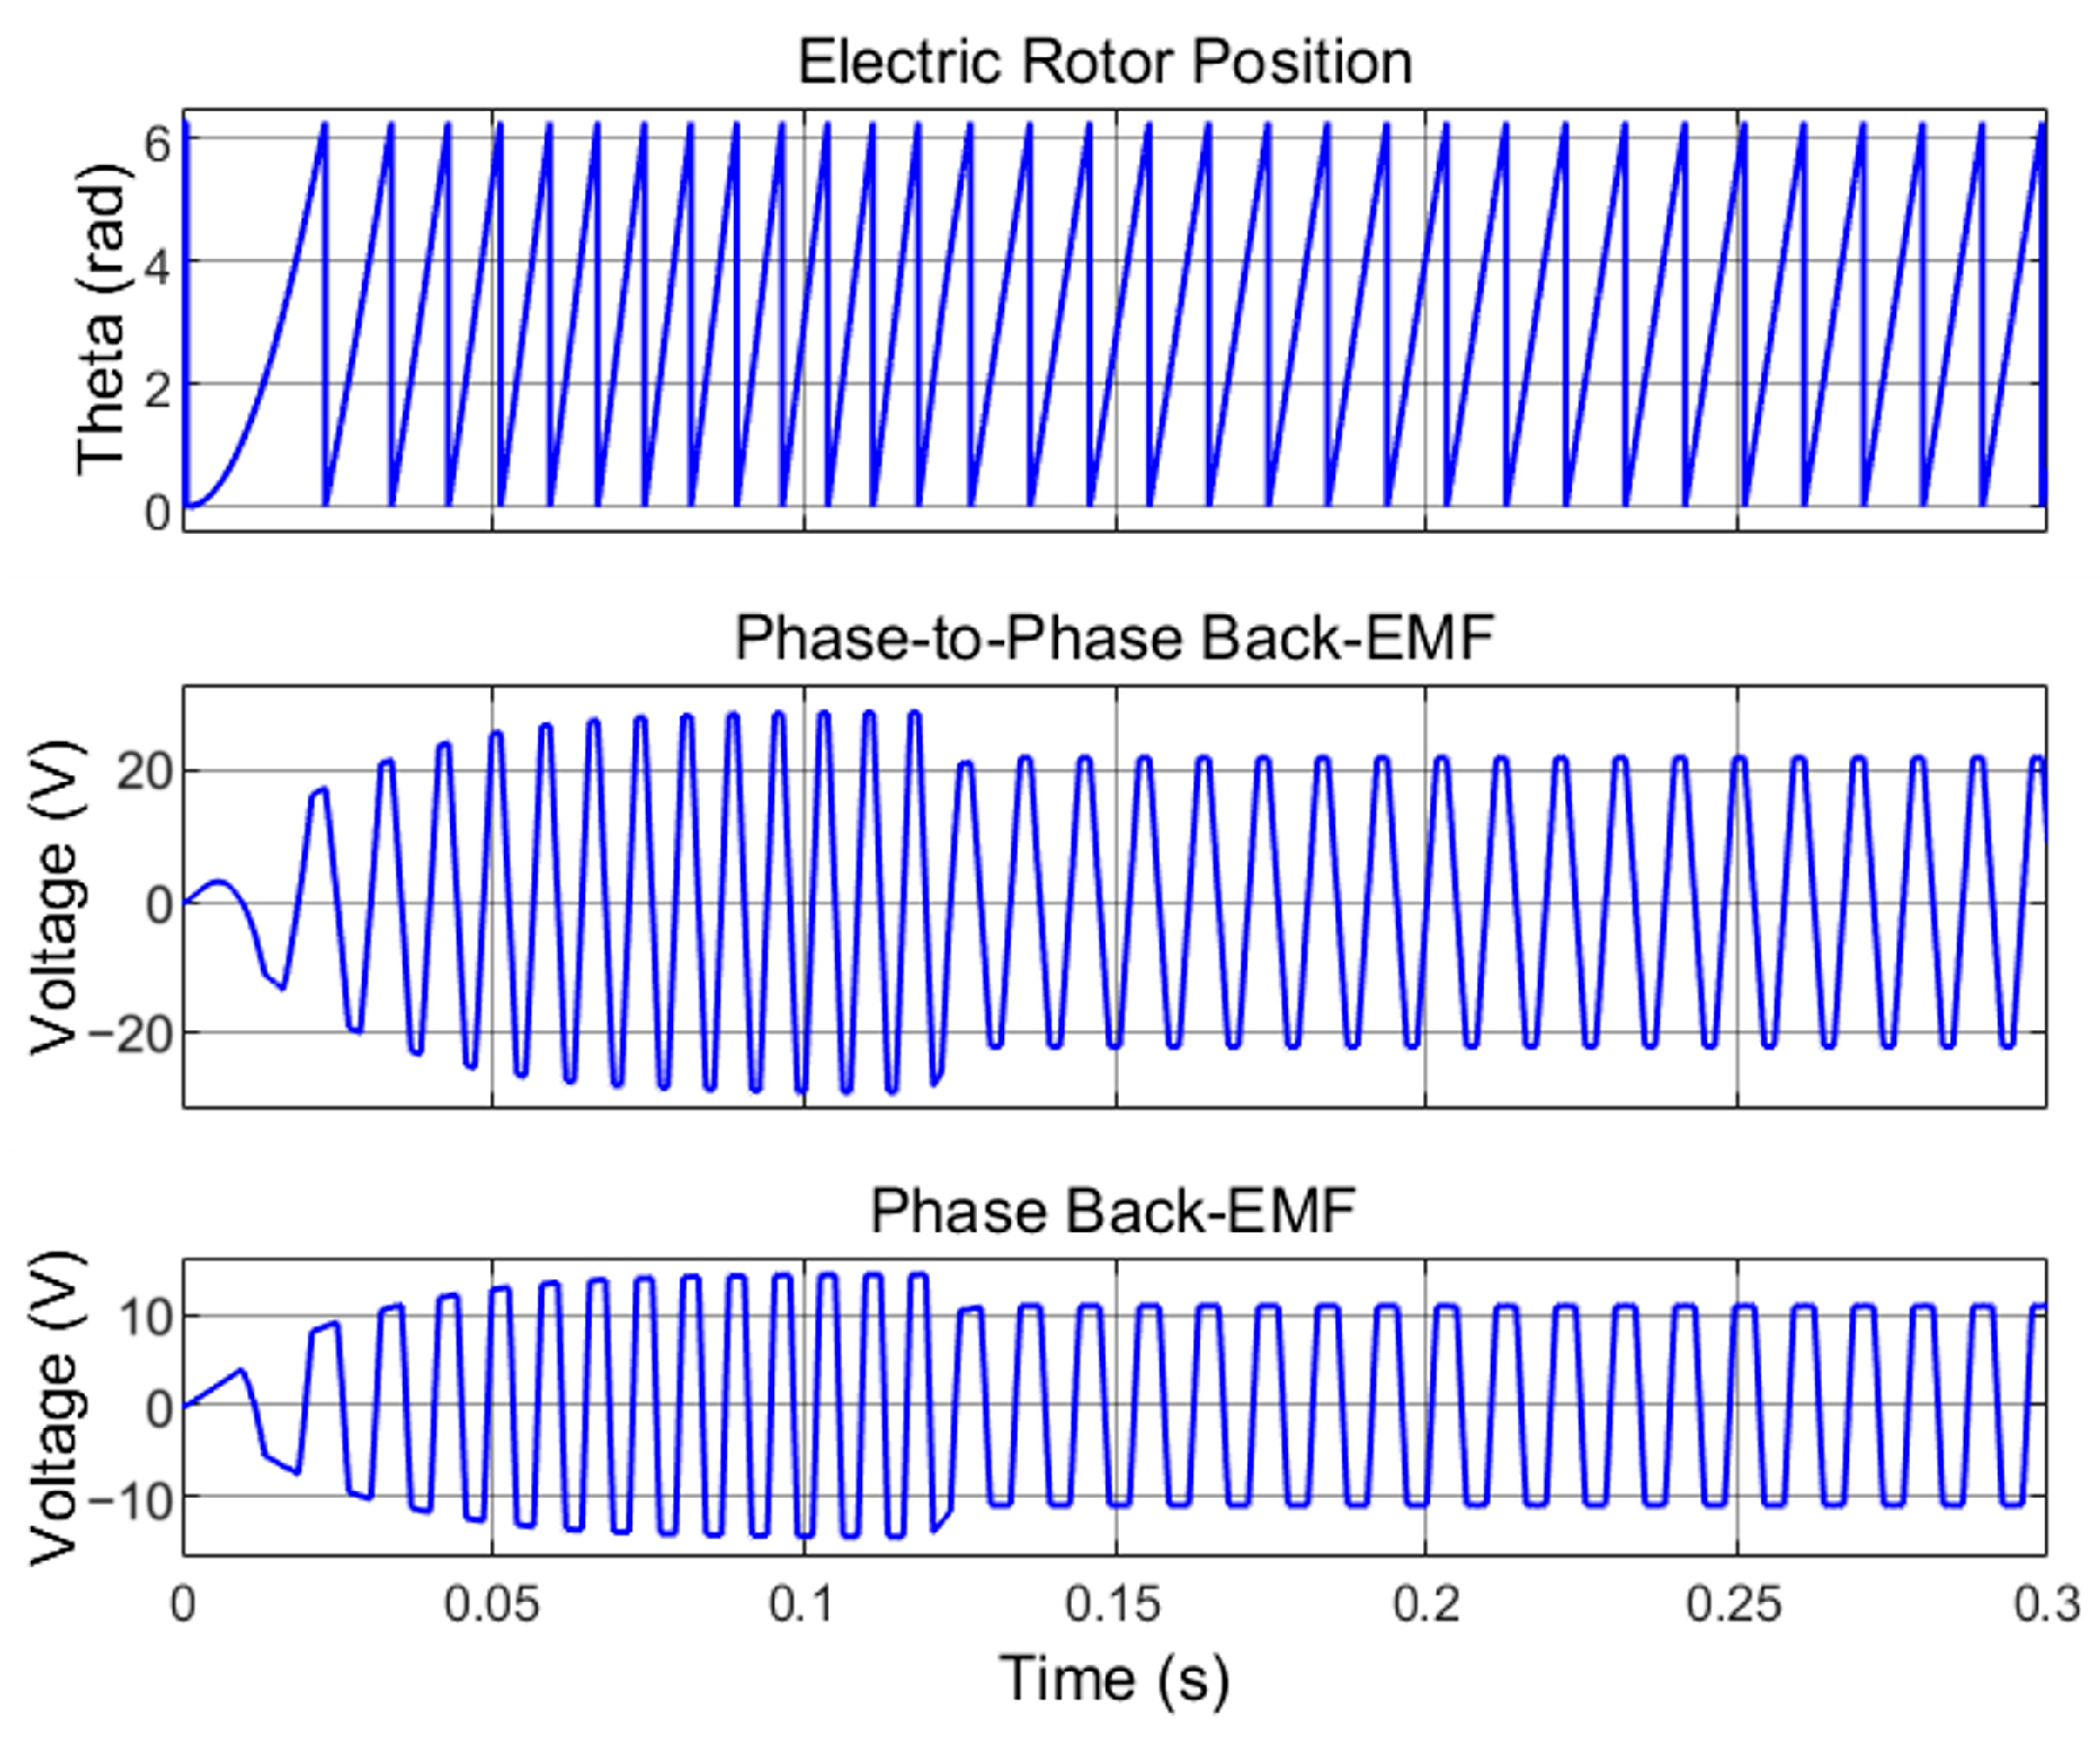
According to (8), back-EMF has a direct relationship with frequency. This can also be seen in
Figure 9, where both the frequency and the amplitude of the back-EMF decrease with decreasing speed. The point at which the phase back-EMF crosses zero potential is called the ‘zero crossing’ [
33]. In
Figure 9, the zero crossings of the phase back-EMF (
) occur consistently at θ = 90° and 270° electrical, marking the transitions from positive to negative and from negative to positive, respectively. These points are critical for rotor position estimation in sensor-less control strategies.
As shown in
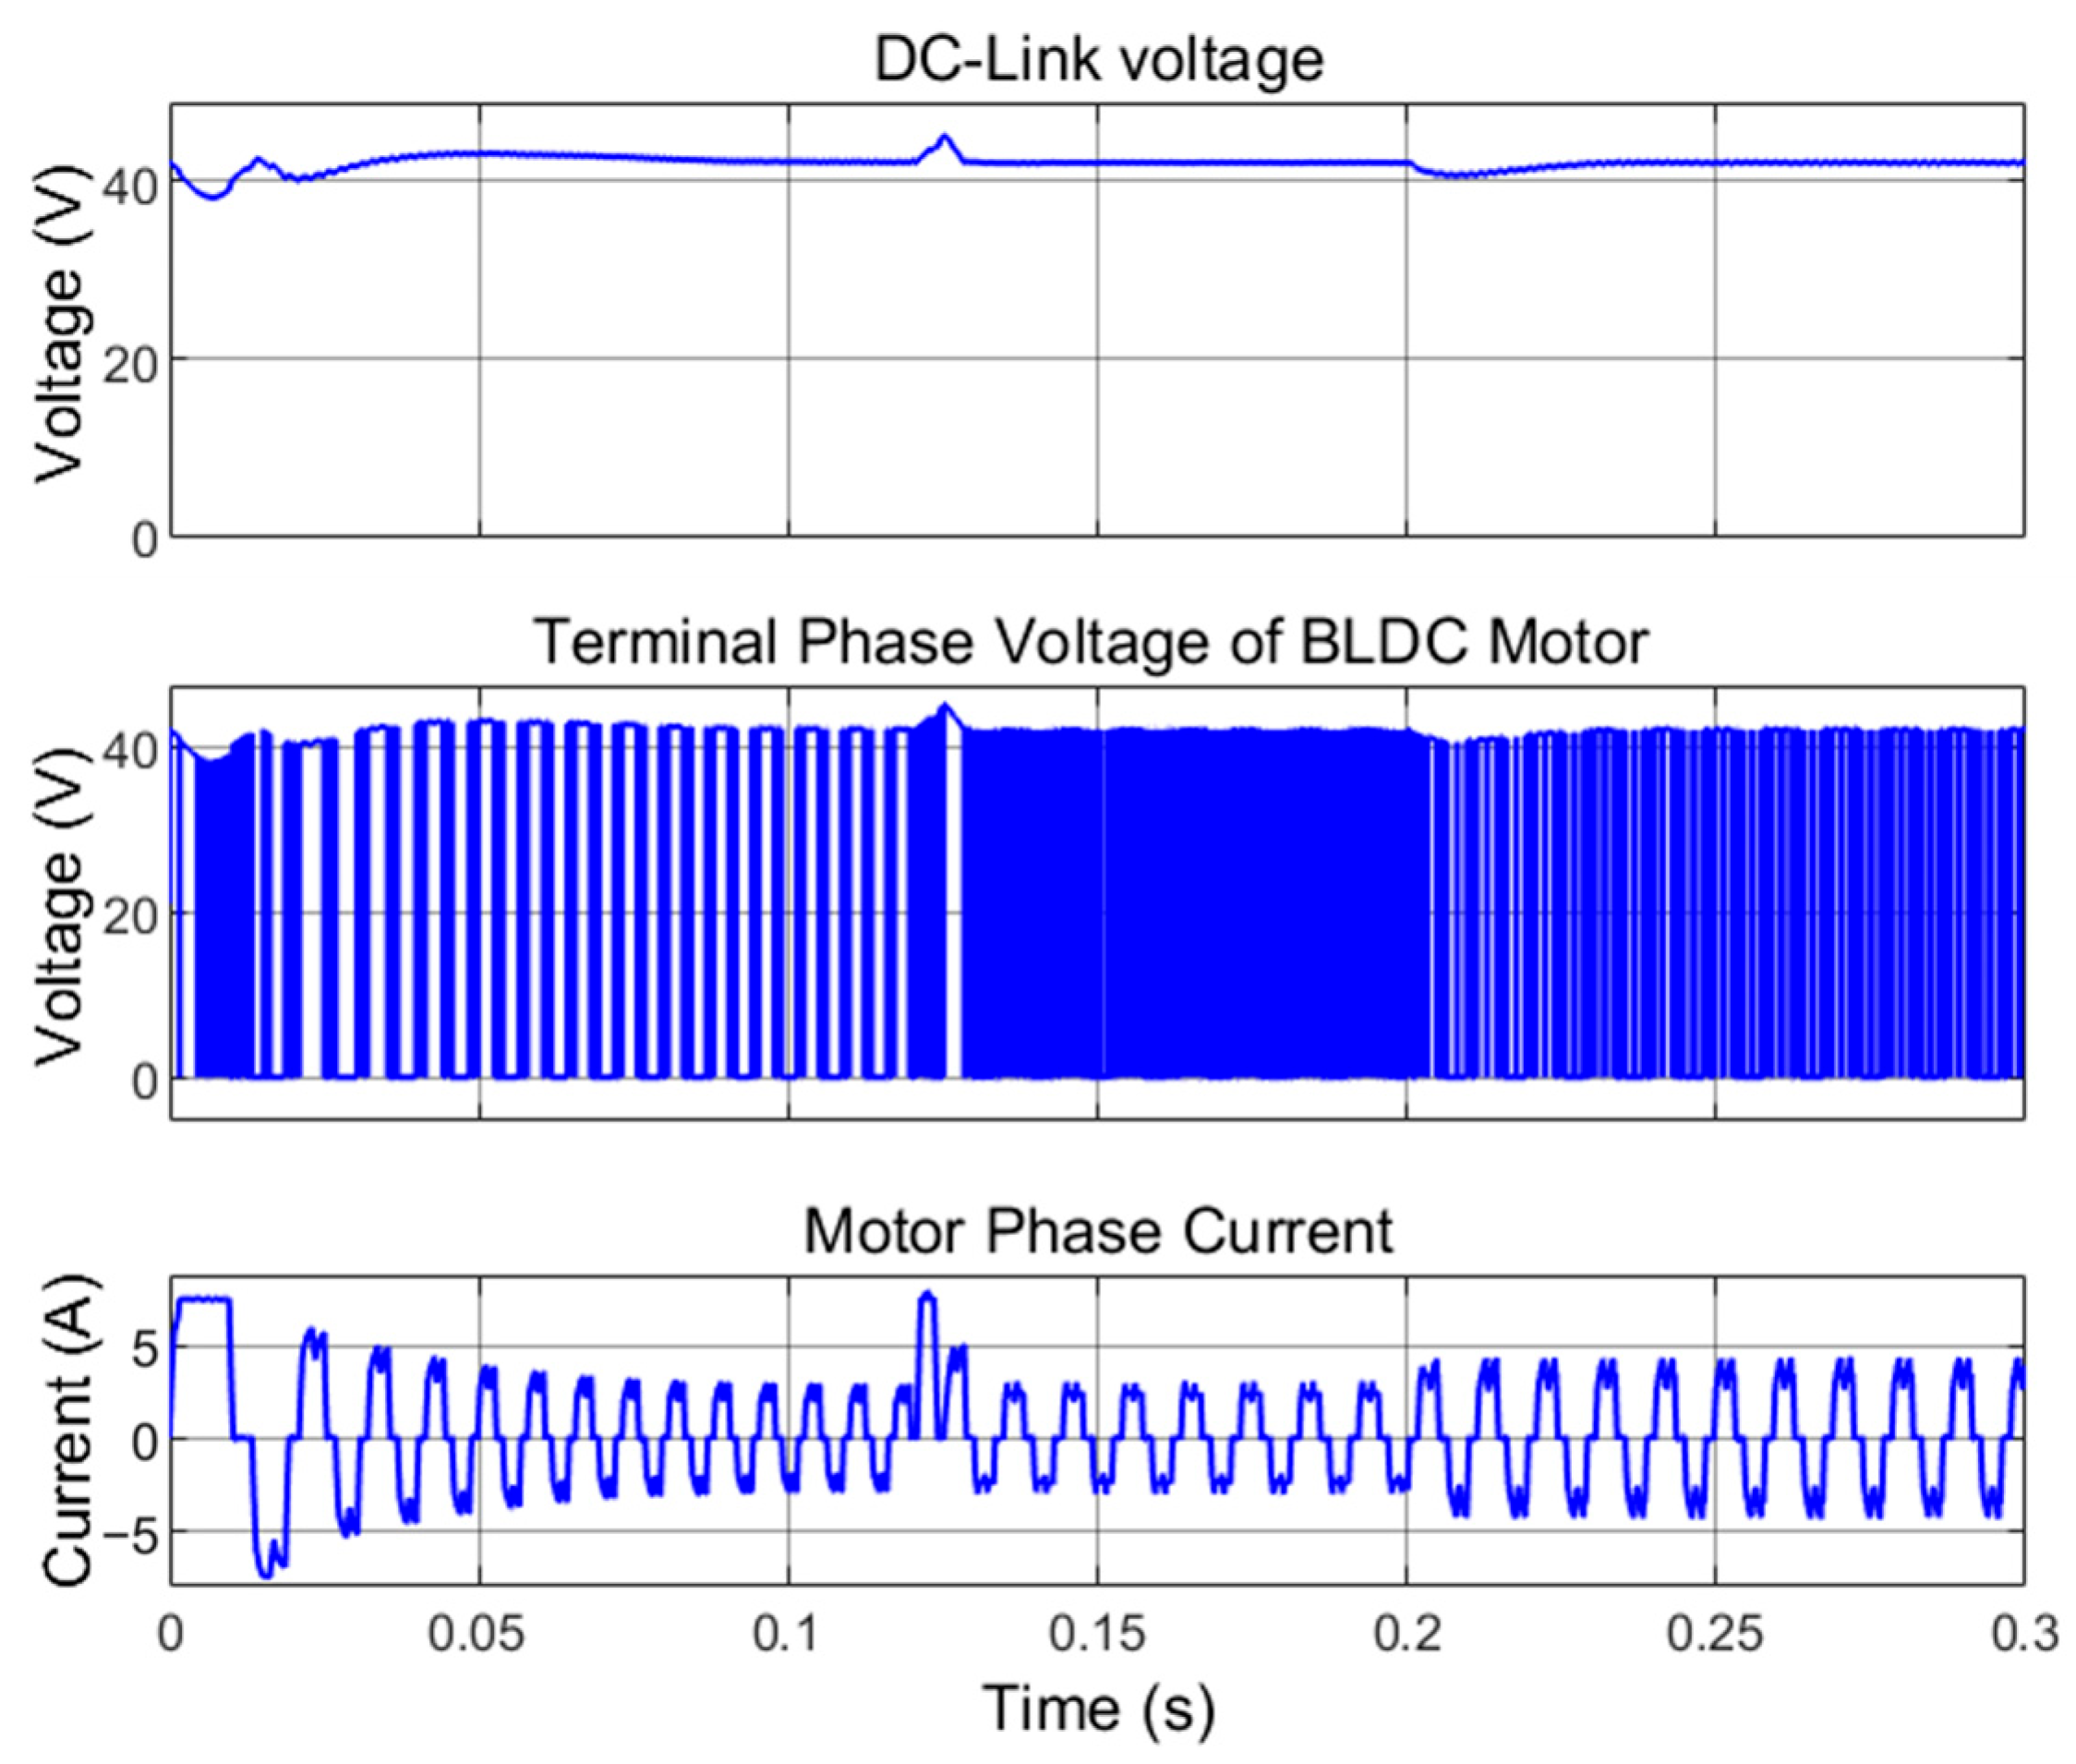
Figure 10, the voltage pulses applied to phase A are used to regulate the phase current. Using hysteresis current control, these pulses are applied in the direction opposite the current deviation, ensuring that the current remains within the desired reference band.
Figure 10 shows that despite the changes in motor speed and load, the control system maintains the DC-link voltage at 42 V with only minor fluctuations. Furthermore, the frequency of the current waveforms in Zone 2 (from the moment of
to
) and Zone 3 (after the moment of
) remains constant at
, while in Zone 1 (from the moment of
to
) it is higher, at
. These values are consistent with those predicted by (15).
where
is the number of rotor poles and
is the motor speed.
One notable feature of the phase current waveform shown in
Figure 10 is a momentary notch that occurs during commutation. This phenomenon is caused by the switching transitions of the MOSFETs in the inverter bridge. Initially, MOSFETs
and
are on, allowing current to flow into phase A and return through phase B. As the rotor advances, the next commutation step requires current to flow into phase A and return through phase C, which necessitates turning off
and turning on
(i.e., switching from
to
conduction). During the brief interval when
is turned off before Q4 is fully on, the current path flows through the anti-parallel diode D3. This transient appears as a small tooth at the top of the current waveform at each commutation instant. The same phenomenon occurs at the bottom of the waveform during the switching transition from
to
.
Motor efficiency is calculated as the ratio of mechanical output power to electrical input power, as shown in
Figure 11. The efficiency is found to be 79.3% in Zone 1, 89.4% in Zone 2, and 80.8% in Zone 3. These variations are primarily attributed to copper losses (
), core losses (hysteresis and eddy currents), and mechanical losses (friction and windage) of the BLDC motor, with peak efficiency observed in Zone 2, where the motor operates near its optimal load–speed condition. This indicates that motor efficiency has an inverse relationship with both speed and load. As speed increases, the frequency of magnetic flux variation also increases, leading to higher iron losses. Additionally, as the motor load increases, the torque and current rise proportionally (since torque and current are directly related, as shown in (7)), resulting in increased copper losses. These losses reduce the overall motor efficiency.
As shown in
Figure 11, in Zone 2, the motor power decreases with decreasing speed, which is consistent with Equation (6). This behavior occurs under nearly constant torque, as illustrated in
Figure 8, and confirms that mechanical power scales proportionally with speed. In Zone 1, the power loss in the power electronic components (DC–DC converter and inverter) is calculated as the difference between battery power (90 W) and motor electric power (87 W), resulting in a 3 W loss. However, in Zones 2 and 3, this loss increases to approximately 14 W and 23 W, respectively, despite the lower motor power in Zone 2 and the higher load in Zone 3. The increase in power losses at lower speeds can be attributed to higher conduction and switching losses in the inverter, as illustrated in
Figure 10. Specifically, the pulse density in the inverter output is significantly higher in Zone 2 than in Zone 1, indicating increased switching activity. This elevated switching is required to maintain the desired current under reduced back-EMF at lower speeds, as shown in
Figure 9, leading to greater power dissipation in semiconductor devices and passive components.
As shown in
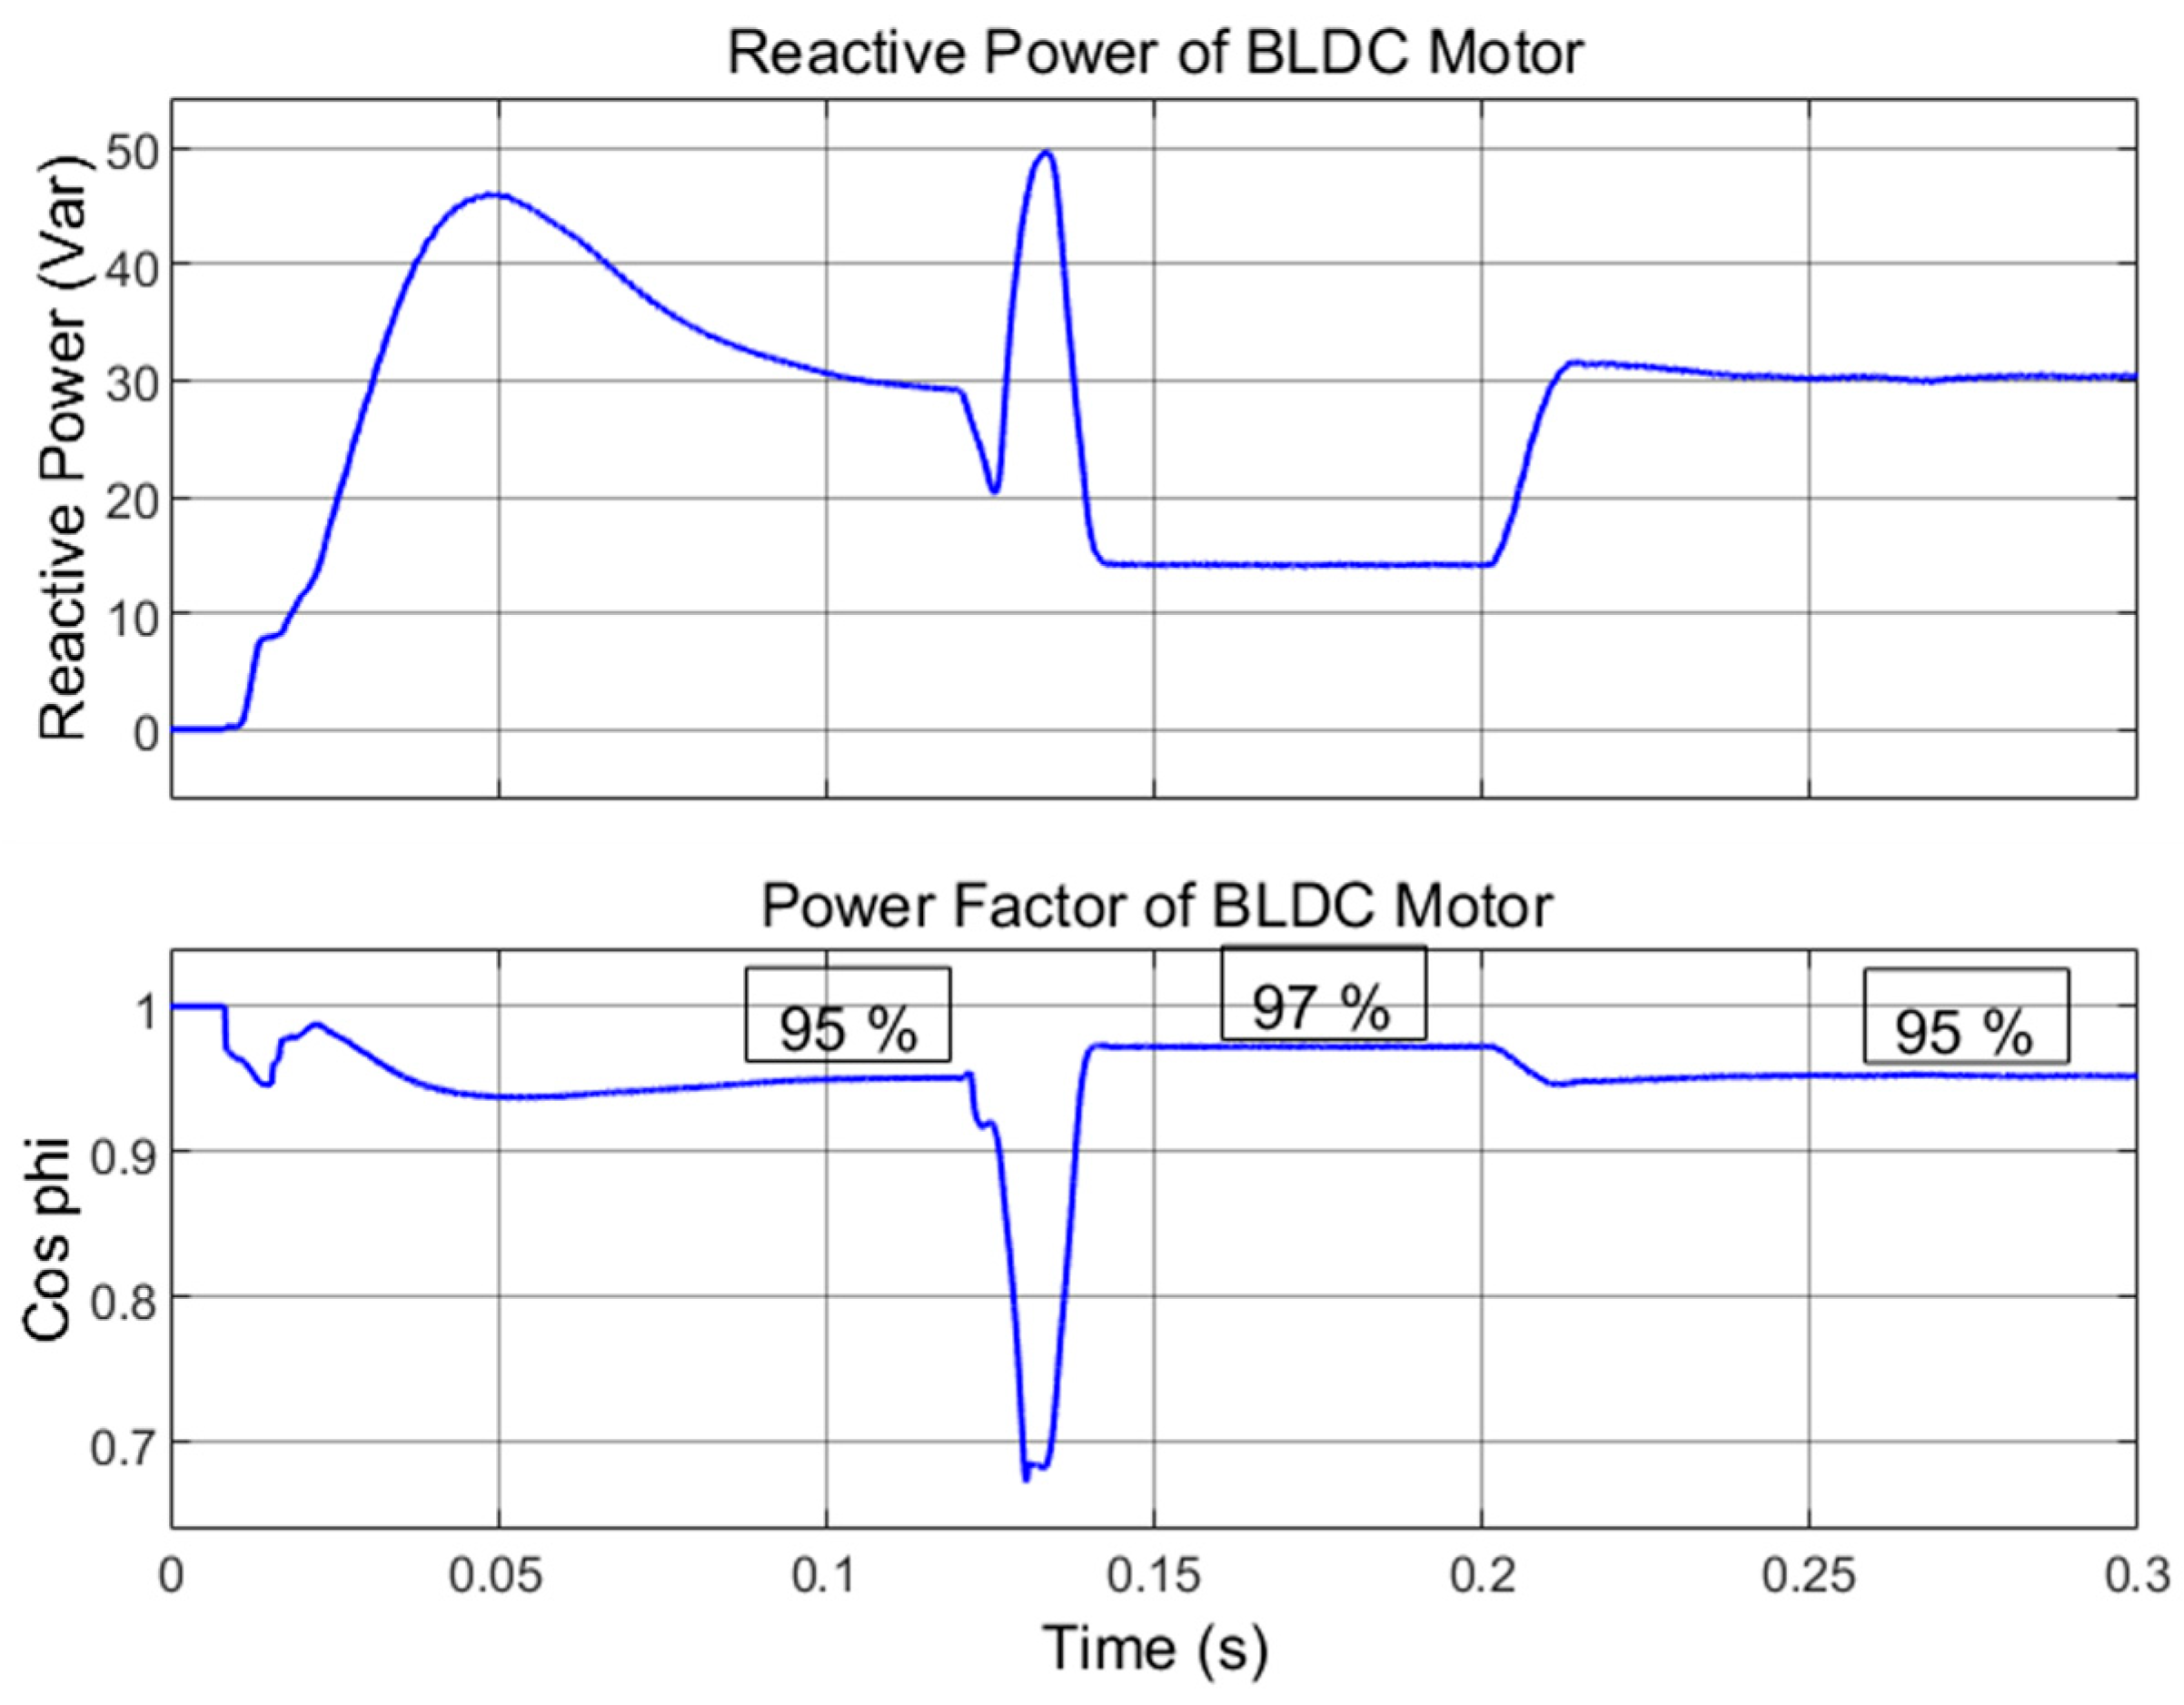
Figure 12, the motor’s reactive power consumption is directly proportional to its speed and load, and it is inversely related to the power factor. In Zone 2, decreasing the current results in an increase in the power factor, while in Zone 3, increasing the load leads to a decrease in the motor’s power factor.
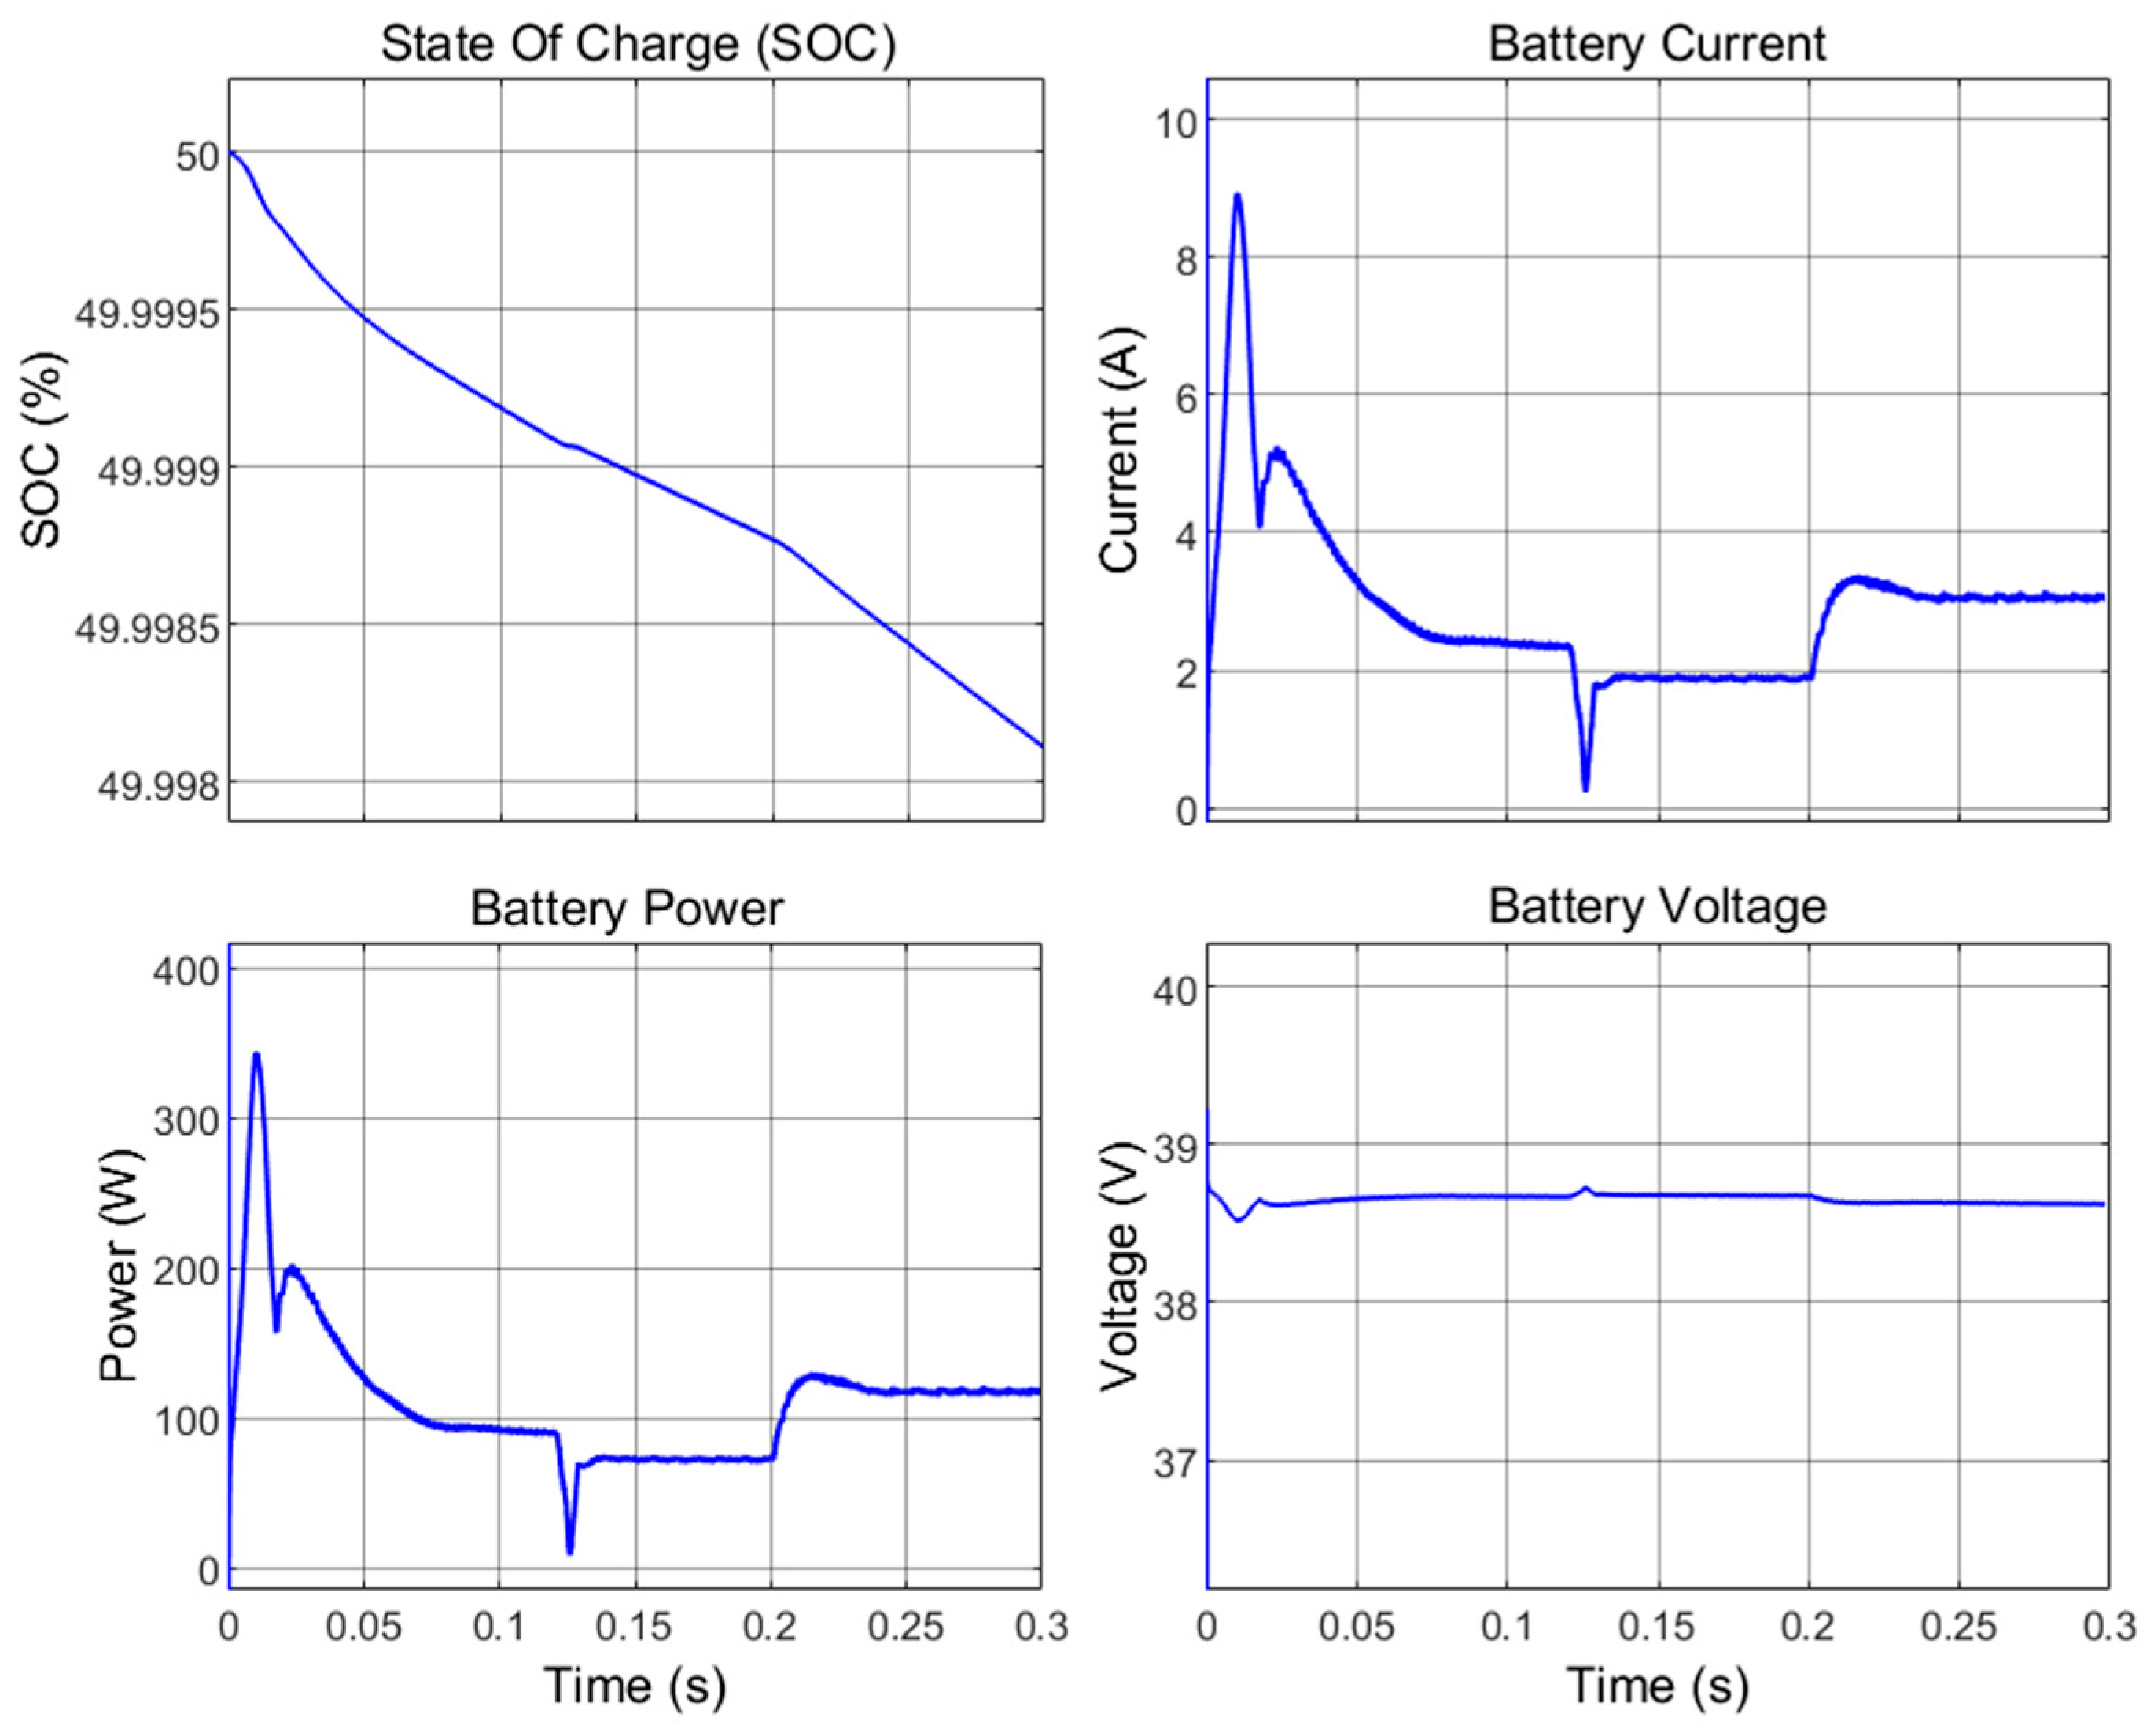
The battery’s current diagram in
Figure 13 shows that despite momentary disturbances in this parameter at times of changing the motor’s speed and load, the buck-boost converter controller was able to control the current drawn from the battery. The current drawn from the battery stabilizes at
after the motor speed reaches a steady state. In Zone 2, as the speed decreases, the current drops to
. In Zone 3, with an increase in the motor load, the current rises to 3 A.
As shown in the SOC diagram in
Figure 13, the battery discharge rate increases in the first and third zones, where the motor’s speed or load is higher. It can also be seen that in the first moments, when the motor’s torque is at its maximum to reach the rated speed of
, the power drawn from the battery is close to its maximum value (
).
5. Discussion
A complete analysis of the behavior of an e-scooter was conducted in this paper, providing good insight into the factors that affect the performance of this device. The complete system model, including all the main components of the e-scooter, including the battery, the DC–DC converter, the six-step three-phase inverter, the BLDC motor, and the related controllers, was simulated in the MATLAB/Simulink environment. In addition to simulations, laboratory measurements of a commercial e-scooter were analyzed to capture real-world operating conditions and enrich the overall system analysis. These investigations demonstrate that the control systems are able to effectively manage key parameters such as motor speed, current, torque, DC-Link voltage, and battery current. Compared to previous studies that often focused on individual components, the integrated model presented in this paper allows for the observation of interactions between subsystems. For example, in
Figure 10 and
Figure 13, it was seen that the speed change as well as the motor load change (at
and
, respectively) can directly affect the DC-link voltage and the battery’s voltage, current, and discharge rate. This level of interaction was not observed in previous component-based models and demonstrates the added value of this system-oriented approach.
The torque demand, as illustrated in
Figure 8, remains relatively constant across different speed levels under unchanged load conditions, resulting in minimal changes in motor current amplitude. This suggests that the mechanical load is independent of speed in the tested operating conditions. However, according to Equation (6), motor power is proportional to speed when torque is constant. Therefore, the observed reduction in power at lower speeds is consistent with the fundamental relationship between power, torque, and angular velocity.
Furthermore, from
Figure 11, it was observed that increasing the speed led to higher iron losses, while increasing the load resulted in greater copper losses. Additionally, as shown in
Figure 12, higher speed and load both contributed to increased reactive power consumption and a reduction in the motor’s power factor.
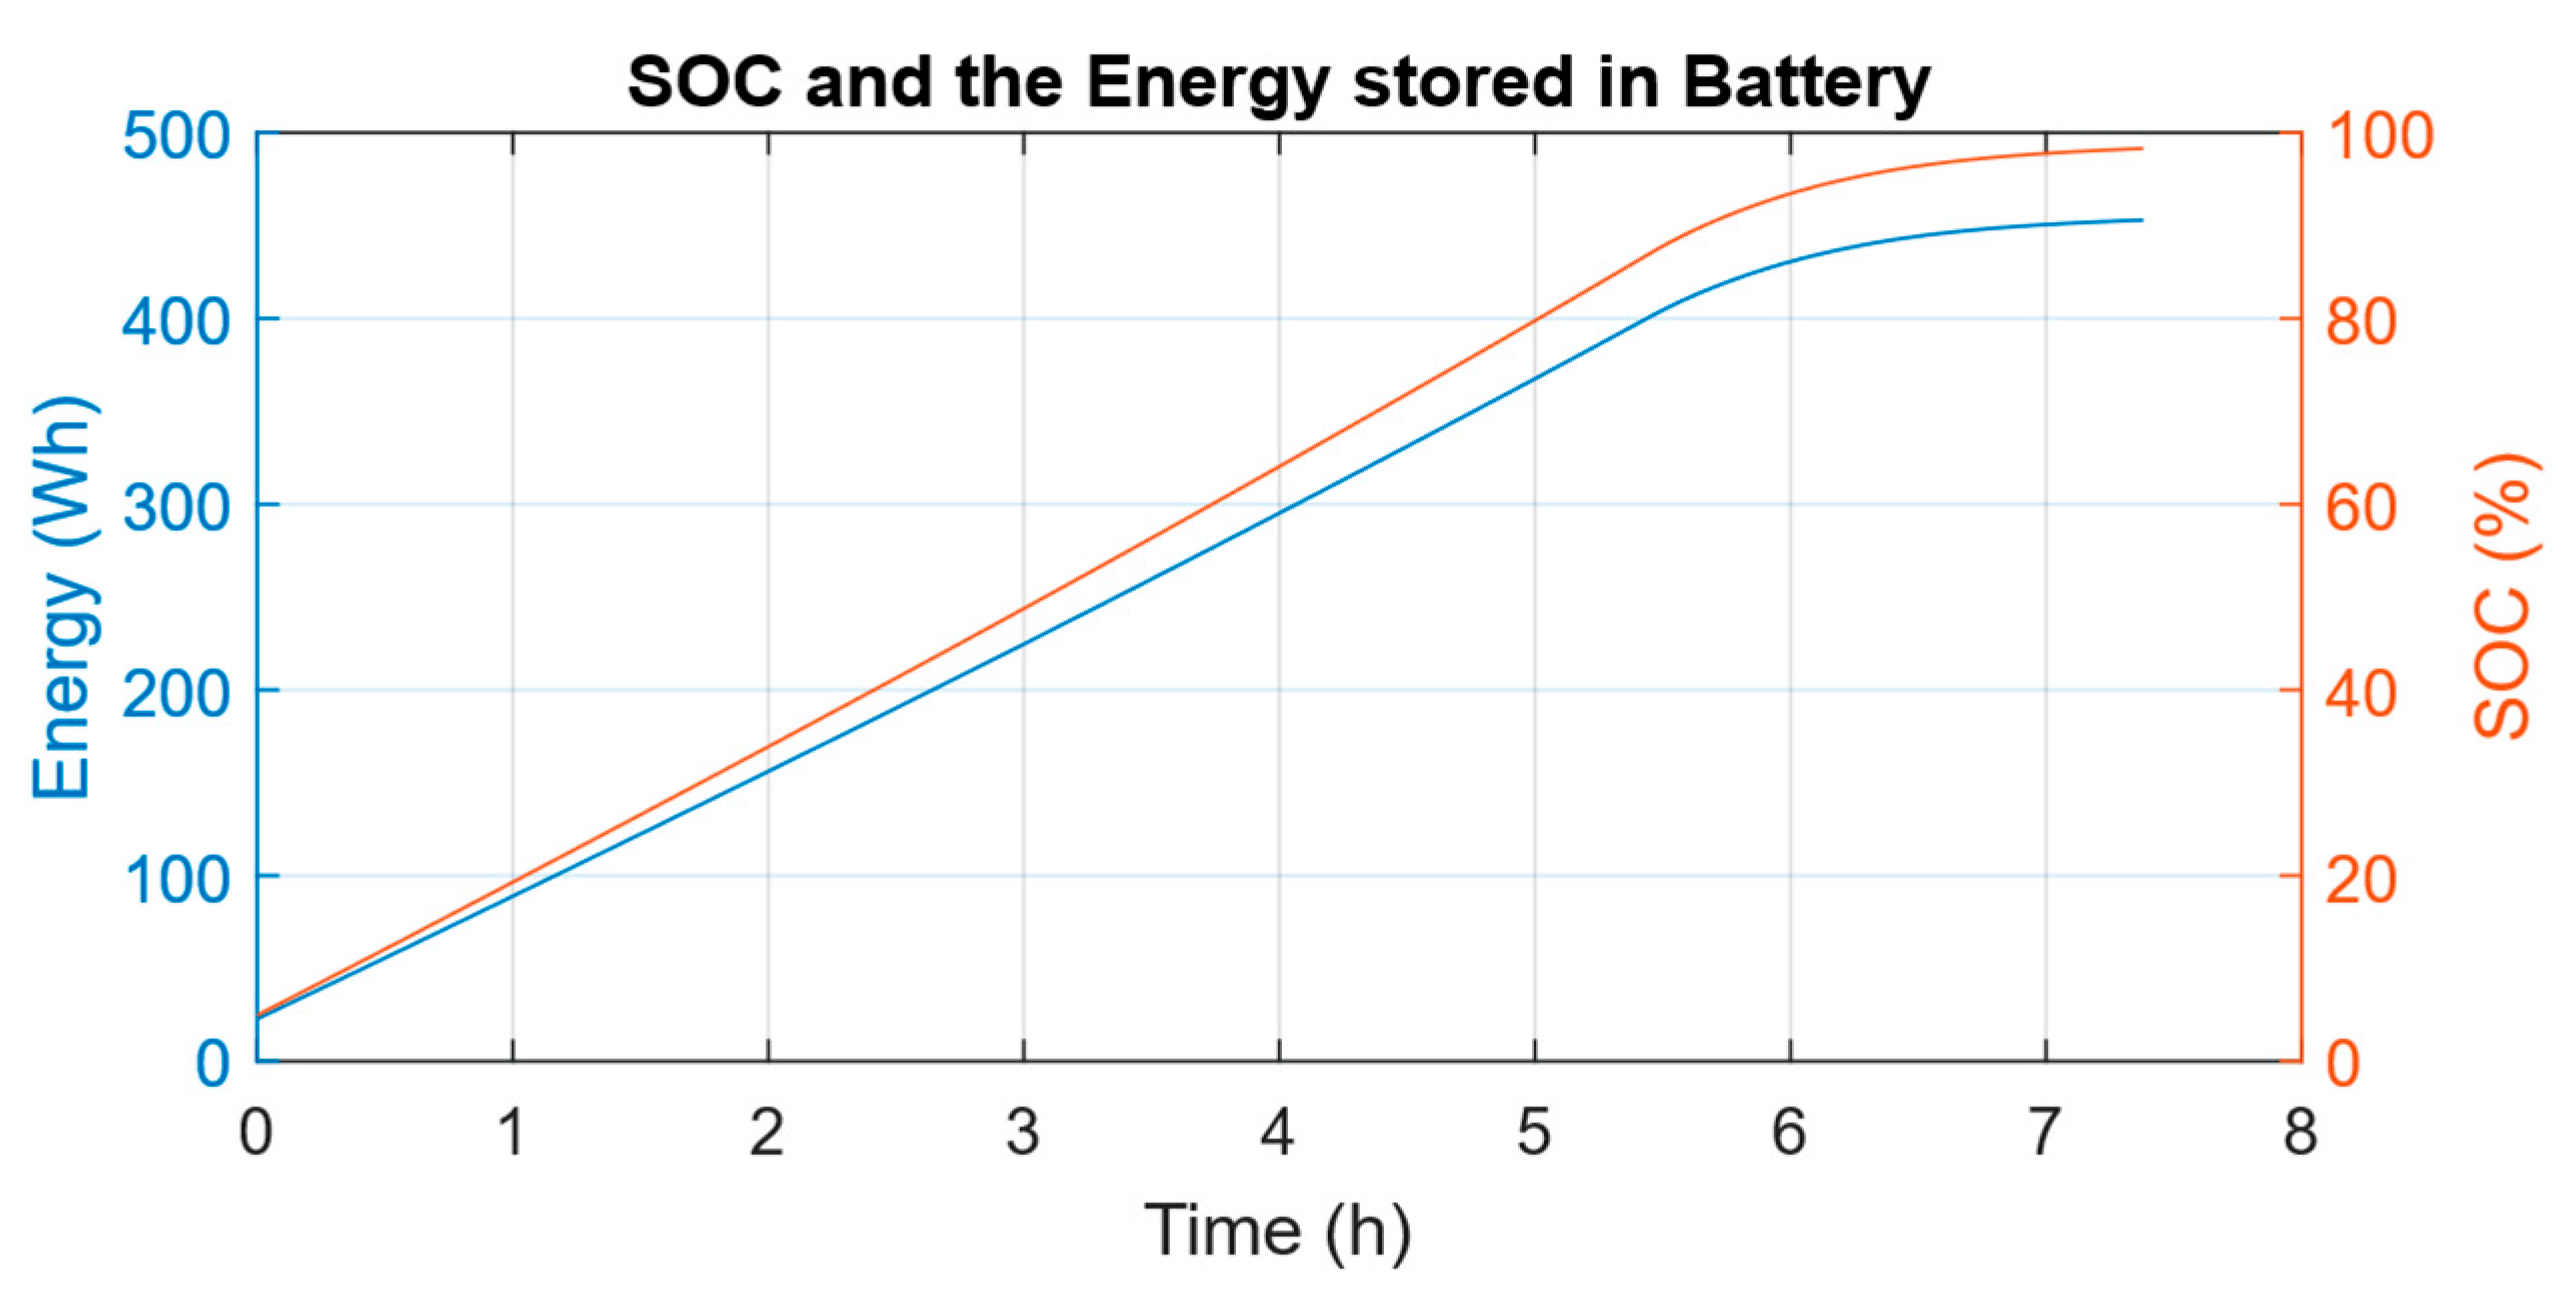
Additionally, to gain a more comprehensive understanding of the system’s behavior and to complete the energy analysis, the battery charging process of the e-scooter was experimentally characterized. From
Figure 17, it was observed that the typical charging process of such an e-scooter’s battery takes about
. Based on the total energy stored in the battery, which is
, and supported by simulation and experimental results, assuming an average voltage and current draw of
and
, respectively, the e-scooter can theoretically operate for approximately
at a speed of
, without considering losses or other factors such as route type. Therefore, this e-scooter can cover approximately 42 km on a single charge in an ideal situation.
In line with further research and development for future studies, the following points are proposed below as potential directions:
Temperature plays a critical role in the performance of both the motor and the battery. Higher temperatures lead to increased system losses and reduced efficiency. Therefore, in future analysis, this issue can be investigated, and methods can be provided to regulate the temperature of the battery and motor.
In the case of an integrated and complete e-scooter system analysis, the effects and losses due to temperature and parameters such as sloping roads, as well as iron and copper losses of the electrical parts, and friction and mechanical losses can be considered.
In the motor control system, alternative methods such as sensor-less methods and vector control (FOC) or direct torque control with advanced modulation techniques such as SPWM and SVPWM can be compared with each other, their response speed and accuracy can be analyzed in different modes and conditions, and the possibility of providing optimal solutions can be examined.
The weight of the user, the load carried, and the weight distribution conditions affect the dynamic performance and energy consumption of the scooter. Modeling the system under different loading conditions (e.g., with a light or heavy user) can increase the accuracy of the model.

