1. Introduction
With the global advancement of carbon neutrality goals, as one of the fastest-growing sources of carbon emissions, the transportation sector is undergoing a profound transformation. New Energy Vehicles (NEVs), characterized by zero emissions during operation and high energy-efficiency, have become a central solution for the low-carbon transition in transportation [
1]. Their widespread adoption not only helps reduce greenhouse gas emissions and mitigate urban air pollution but also supports the optimization of energy structures and the development of intelligent transportation systems. In recent years, the number of NEVs in operation has grown steadily, becoming a major driver of the transition in transport energy. According to EV Tank, global NEV sales reached 18.236 million units in 2024, marking a 24.4% year-on-year increase. Sales are projected to rise to 22.397 million units in 2025 [
2]. However, statistics show that, from 2017 to 2019, there was a total of 18,582 traffic accidents involving NEVs in China, and the accident rate per 10,000 vehicles was three times that of traditional fuel vehicles [
3]. Emerging risks (such as high-voltage electrical systems, battery thermal runaway, unique power response characteristics, and the complexity of intelligent control), coupled with variations in driver behavior and vehicle system integration, have led to a rising frequency of NEV-related accidents. These incidents not only result in significant casualties and economic losses but also hinder the sustainable development of NEVs. Therefore, alongside the rapid adoption of NEVs, it is essential to systematically identify and address the traffic safety risks, which has become a key issue in achieving sustainability goals in the transport sector. To effectively mitigate safety hazards, it is necessary to conduct detailed analyses of accident characteristics and develop predictive models for accident risk, thereby providing actionable recommendations for traffic management authorities to reduce the occurrence of accidents.
In accident characteristic analysis, existing studies focus on human factors, road features, vehicle attributes, and environmental conditions [
4,
5,
6,
7,
8,
9,
10,
11,
12,
13,
14]. For instance, Najafi [
15] analyzed urban accident data collected from March 2019 to March 2020 to identify the key variables influencing the severity of injury, fatal, and property-damage accidents in Rasht. This study emphasized the critical impact environmental factors and highlighted the leading role of unsafe and low-quality vehicles in increasing accident severity. Olowosegun [
16] used the official UK police crash report database from 2010 to 2018 to develop a correlated random parameter ordered probability model with heterogeneity in means. This model was applied to analyze how road characteristics, crash location, weather conditions, and vehicle and driver attributes affect the severity of accident-related injuries. Li [
17] conducted a descriptive analysis of the number of accidents, fatalities, and injuries based on police-reported vehicle crashes from 2014 to 2016. The results showed a higher proportion of accidents occurring on normal urban roads and due to unsafe driver behaviors. Hyodo [
18] investigated the impact of traffic, road, and environmental factors on the risk of severe accidents. Using an ordered probability model, this study examined three types of accidents on national highways in cold and snowy regions. The analysis revealed that, beyond traffic and road conditions, several weather variables significantly affect accident severity. Alkaabi [
19] conducted a questionnaire survey of drivers involved in road accidents and analyzed the responses from 1072 drivers using a logistic regression model. The results showed that careless driving is the leading cause of urban road accidents. Additionally, this study found that middle-aged drivers are more likely to be involved in accidents, while the risk decreases with increased driving experience. Sadeghi [
20] analyzed the effects of road conditions, weather, and various demographic factors on vehicle accidents. This study found that poor road quality increases the severity of single-vehicle collisions on highways but reduces their severity on low-speed, low-level roads. However, these studies mainly focus on accidents with fuel vehicles, with limited research on accident characteristics specific to New Energy Vehicles (NEVs), making it difficult to provide targeted guidance for NEV-related incidents.
In accident risk prediction, existing studies primarily focus on forecasting accident severity [
21,
22,
23,
24,
25,
26,
27,
28,
29]. Megnidio [
30] modeled the severity of road traffic accidents in the UK in 2020 by incorporating four categories of factors: human, road, vehicle, and environmental conditions. Similarly, Wang [
31] found that the historical accident records significantly improved prediction accuracy by comparing the prediction models based on vehicle information and driver violations with those integrating historical accident data. Pei [
32] integrated a spatiotemporal local attention mechanism to enhance the model’s predictive performance, thereby improving the accuracy of accident risk prediction. Aboulola [
33] used accident data from New Zealand (2016–2020) to evaluate and compare the performance of three deep learning models (Multilayer Perceptron, Convolutional Neural Network, and Long Short-Term Memory) and five transfer learning models (ResNet, EfficientNetB4, InceptionV3, Xception, and MobileNet) in predicting accident severity. Yang [
34] applied a Bayesian-adjusted Negative Binomial regression model to identify six significant variables from a pool of 17 potential accident-related factors, effectively improving the accuracy of accident prediction. Roland [
35] used a multilayer perceptron neural network model to predict accidents based on historical crash records, weather conditions, road geometry, and other aggregated variables. Zhang [
36] combined a Random Forest classifier with the Boruta algorithm to extract key attributes influencing accident injury severity. After that he employed the XGBoost algorithm to predict the severity level of accident outcomes. Wang [
37] proposed a Multi-View Multi-Task Spatiotemporal Network model that jointly predicts accident risk by considering both fine-grained and coarse-grained spatial correlations. This approach effectively addresses data sparsity issues and significantly enhances the performance of traffic accident risk prediction. However, existing studies mainly focus on accident severity and often overlook the relationships between different accident types and their specific characteristics. This limitation becomes more pronounced when dealing with limited accident data and imbalanced type distributions, which further reduces the accuracy of accident type prediction. As a result, it hinders the ability of traffic management and emergency response agencies to allocate resources effectively.
To address these challenges, this study proposes an accident type prediction method based on the AS–Naive Bayes algorithm. First, five typical accident types (scraping, collision, run-over, rollover, and battery fire/explosion) are extracted from a national-level traffic management platform. The relationships between these accident types and their associated features are analyzed to explore the mapping between accident types and feature variables. Next, Chi-square testing and Mutual Information are used to select features strongly related to accident types. Moreover, considering the challenges posed by imbalanced data distribution in new energy vehicle accident types, the Synthetic Minority Over-sampling Technique (SMOTE) and additive smoothing are integrated into the Naive Bayes algorithm to construct the AS–Naive Bayes-based prediction model. This method enables accurate prediction of new energy vehicle accident types and provides essential data support for accident analysis and risk management by traffic management.
The structure of this paper is as follows:
Section 2 analyzes the accident type distribution of new energy vehicles;
Section 3 introduces the accident type prediction method based on the AS–Naive Bayes algorithm; and
Section 4 provides conclusions.
2. Materials
2.1. Experimental Dataset
The data used in this paper are randomly sampled from the national traffic management platform, containing over 410,000 NEV operation alarm data involving more than 440,000 vehicles across multiple provinces. For each alarm data, features related to spatio-temporal context, environmental conditions, vehicle status, and driver behavior are extracted, including vehicle operating status, accident time period, accident cause, and road type. Detailed specifications of the data types are provided in
Table 1,
Table 2,
Table 3 and
Table 4.
In
Table 2, the division of a day into seven time periods is not based on equal time lengths but follows the practice of China’s traffic management authorities and the actual patterns of traffic flow [
39]. These periods (late night, early morning, morning, forenoon, noon, afternoon, evening, and night) correspond to different stages of daily activities and travel, such as rush hours (early morning and evening), working hours (morning, forenoon, and afternoon), and low-traffic periods (noon and night). Although the time lengths are unequal, this division reflects accident patterns more realistically, since accident risk is closely related to traffic density and driver fatigue, which do not follow an even time distribution.
It should be noted that not all the data are accident data. Therefore, during data preprocessing, each accident was classified into one of five categories based on its description: scrape, collision, run-over, rollover, or fire/explosion. Records that do not match these categories were excluded. Subsequently, by linking traffic accident data involving new energy vehicles with corresponding vehicle alarm data, a total of 651 NEV accident records were identified for analysis.
2.2. Accident Type Distribution of New Energy Vehicles
The statistical distribution of accident types in new energy vehicles shows that collisions are the most frequent, accounting for 66.1% of all cases. In contrast, severe incidents such as fires or explosions are rare, comprising only 1.8%. Detailed results are presented in
Table 5.
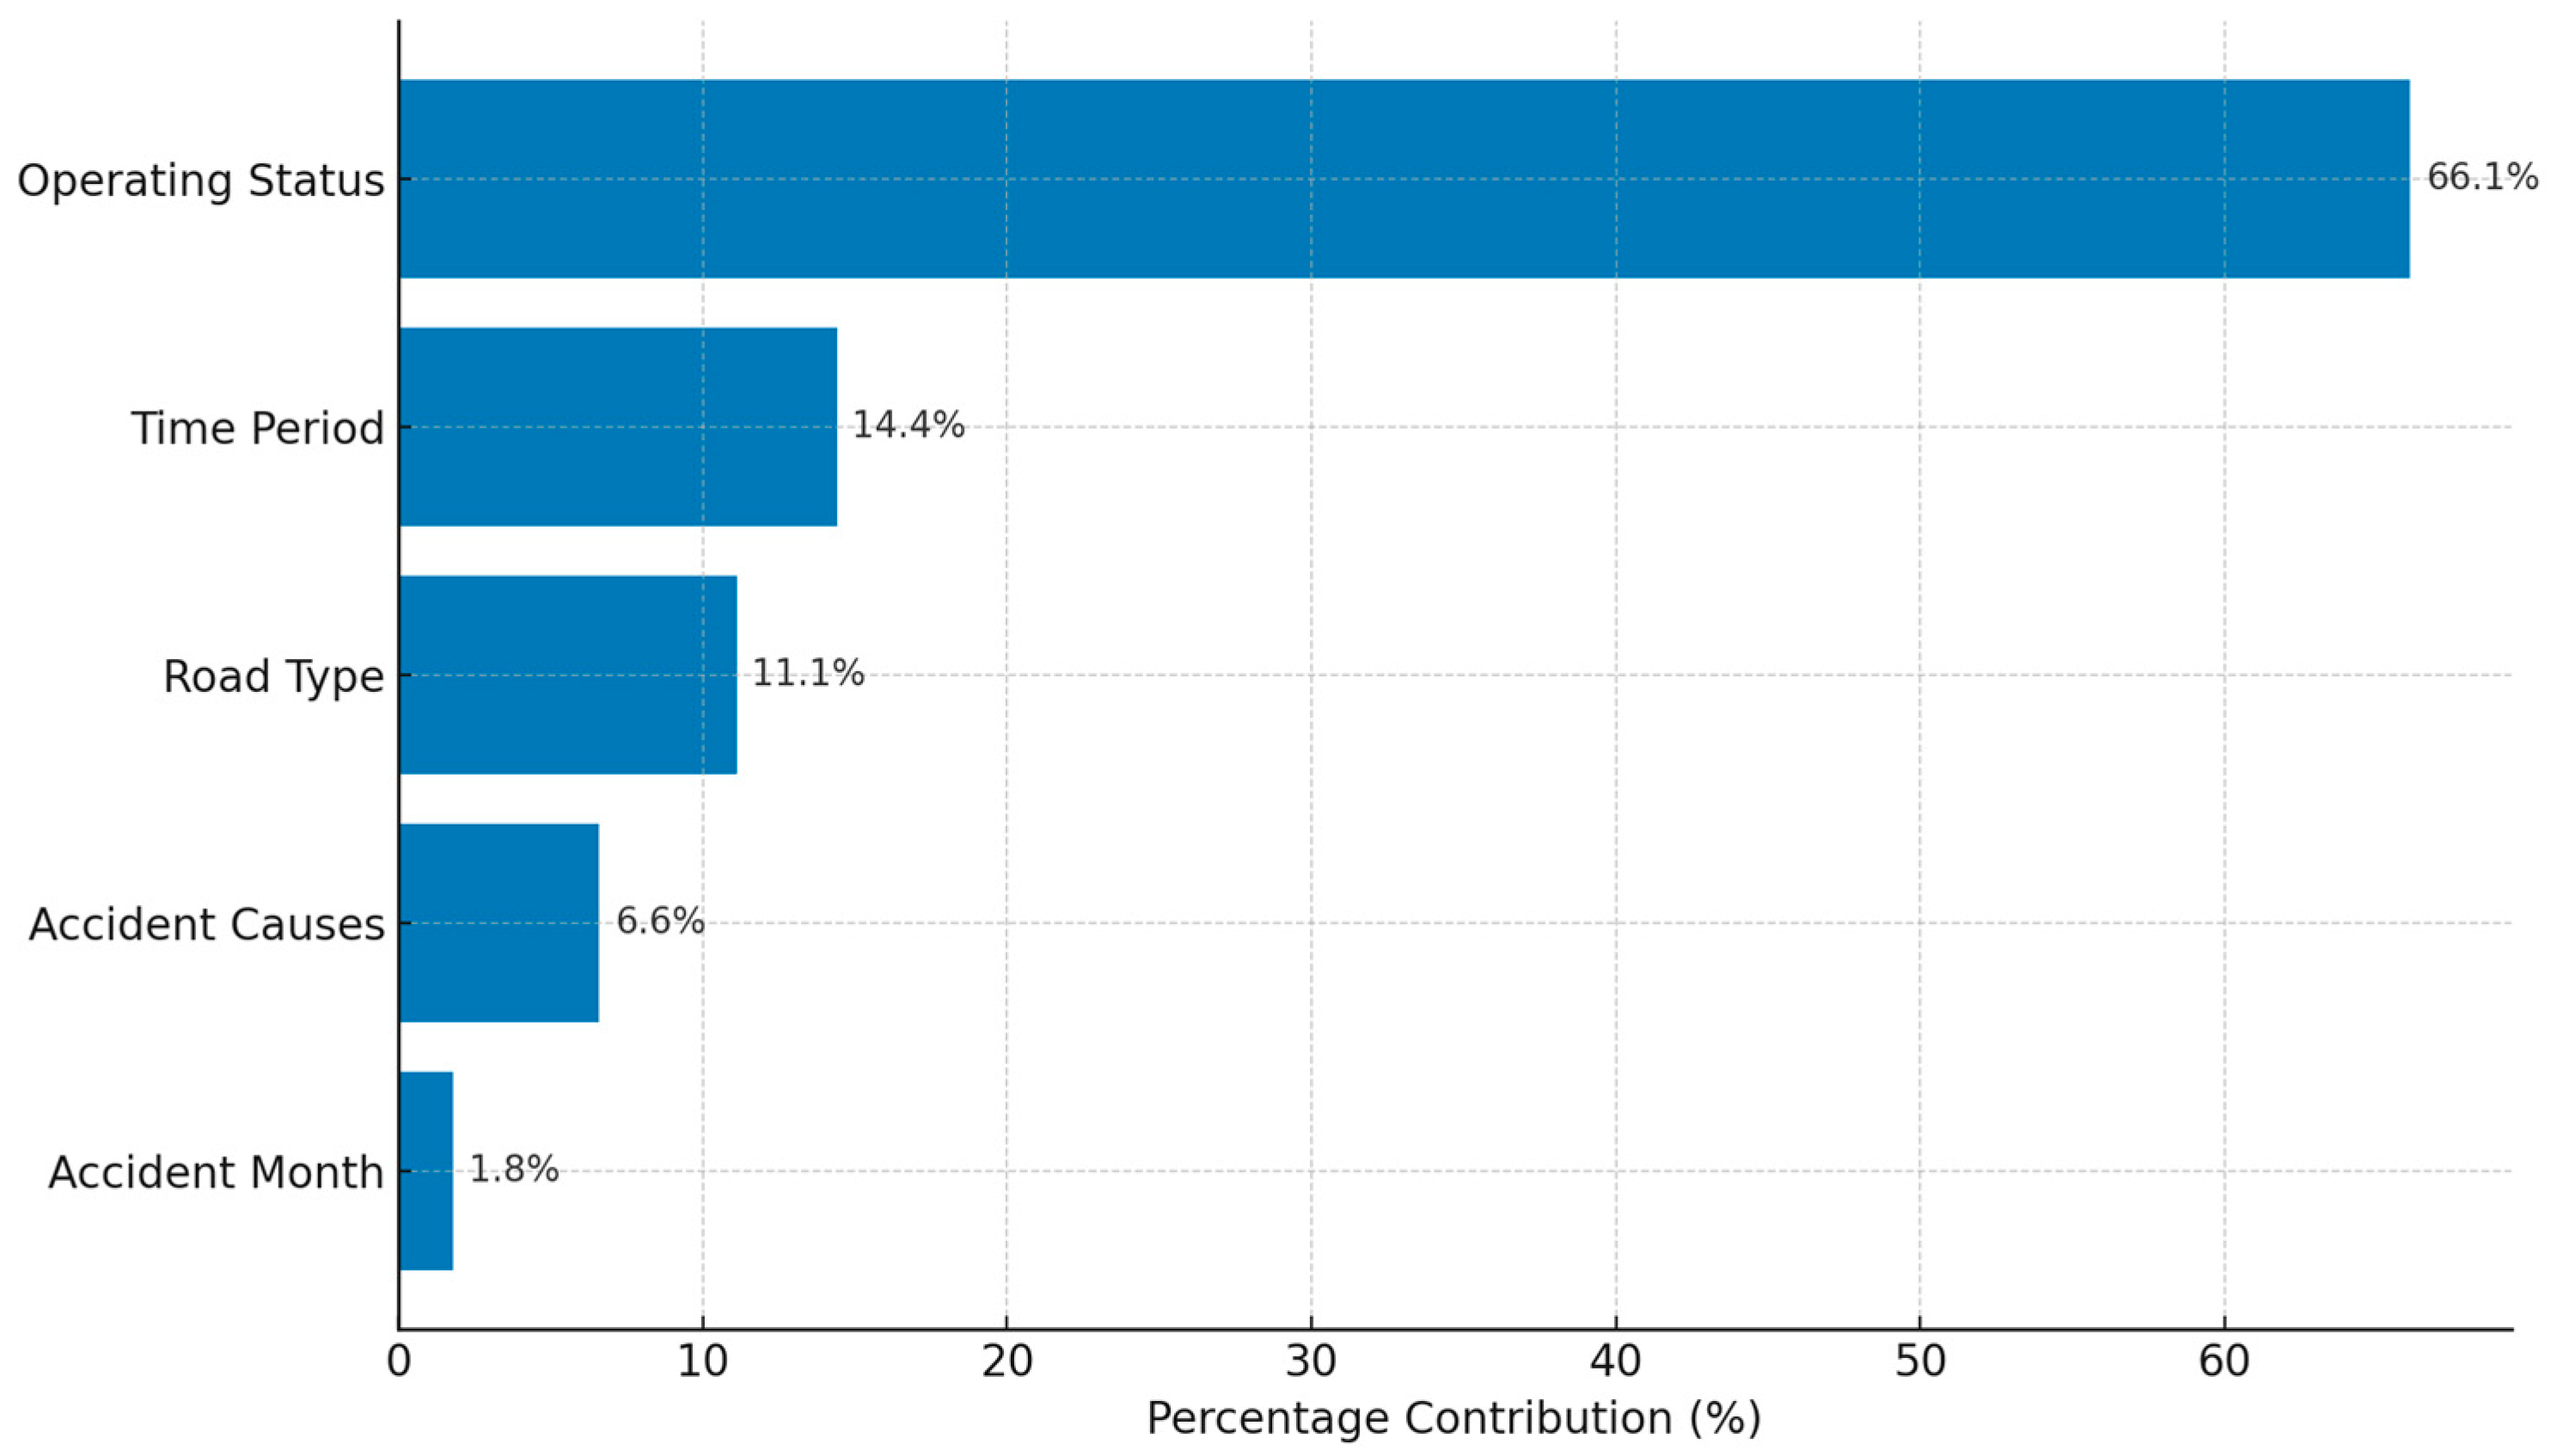
The statistical analysis of new energy vehicle accident characteristics shows that factors such as road type, vehicle operating status, accident time, and accident cause are closely related to the occurrence of accidents. Operating status has the greatest impact on the identification of accident types, with a dominant weight of 66.1%. This highlights the strong dependence of NEV accidents on whether the vehicle is in motion, idling, charging, or parked. The accident time period ranks second, at 14.4%, suggesting a moderate association between certain times of day (e.g., peak or nighttime) and specific types of accidents. Other factors, such as road type (11.1%) and accident cause (6.6%), have a smaller but still noticeable impact, indicating that the traffic environment and failure modes do influence accident types. Monthly variation contributes only 1.8%, suggesting that seasonal effects on NEV accidents are minimal.
To identify key influencing factors affecting the distribution of accident types in new energy vehicles (NEVs), a sensitivity analysis was conducted based on five variables: operating status, road type, accident causes, accident month, and accident time period. The analysis results are shown in
Figure 1.
Based on the sensitivity distribution, it can be inferred that:
- (a)
Collision-type accidents are closely associated with operating status and time period, such as high-speed driving during peak hours.
- (b)
Electrical and thermal faults tend to occur more frequently during charging or low-traffic periods.
- (c)
The influence of road type is likely related to urban congestion or narrow lanes, which contribute to minor collision or pedestrian-related incidents.
- (d)
These findings offer important guidance for NEV accident prevention, suggesting that vehicle operating status and high-risk time periods should be the primary focus of safety strategies.
As shown in
Figure 2, the most common operational faults in new energy vehicles include brake system warnings, low State of Charge (SOC), and DC-DC status warnings. The analysis shows that brake system abnormalities are often associated with a higher likelihood of collisions, scrapes, and other traffic accidents. Similarly, abnormal battery temperature and voltage increase the risk of incidents such as fires and collisions. Therefore, brake system performance, battery temperature, and battery voltage are closely linked to the occurrence of traffic accidents.
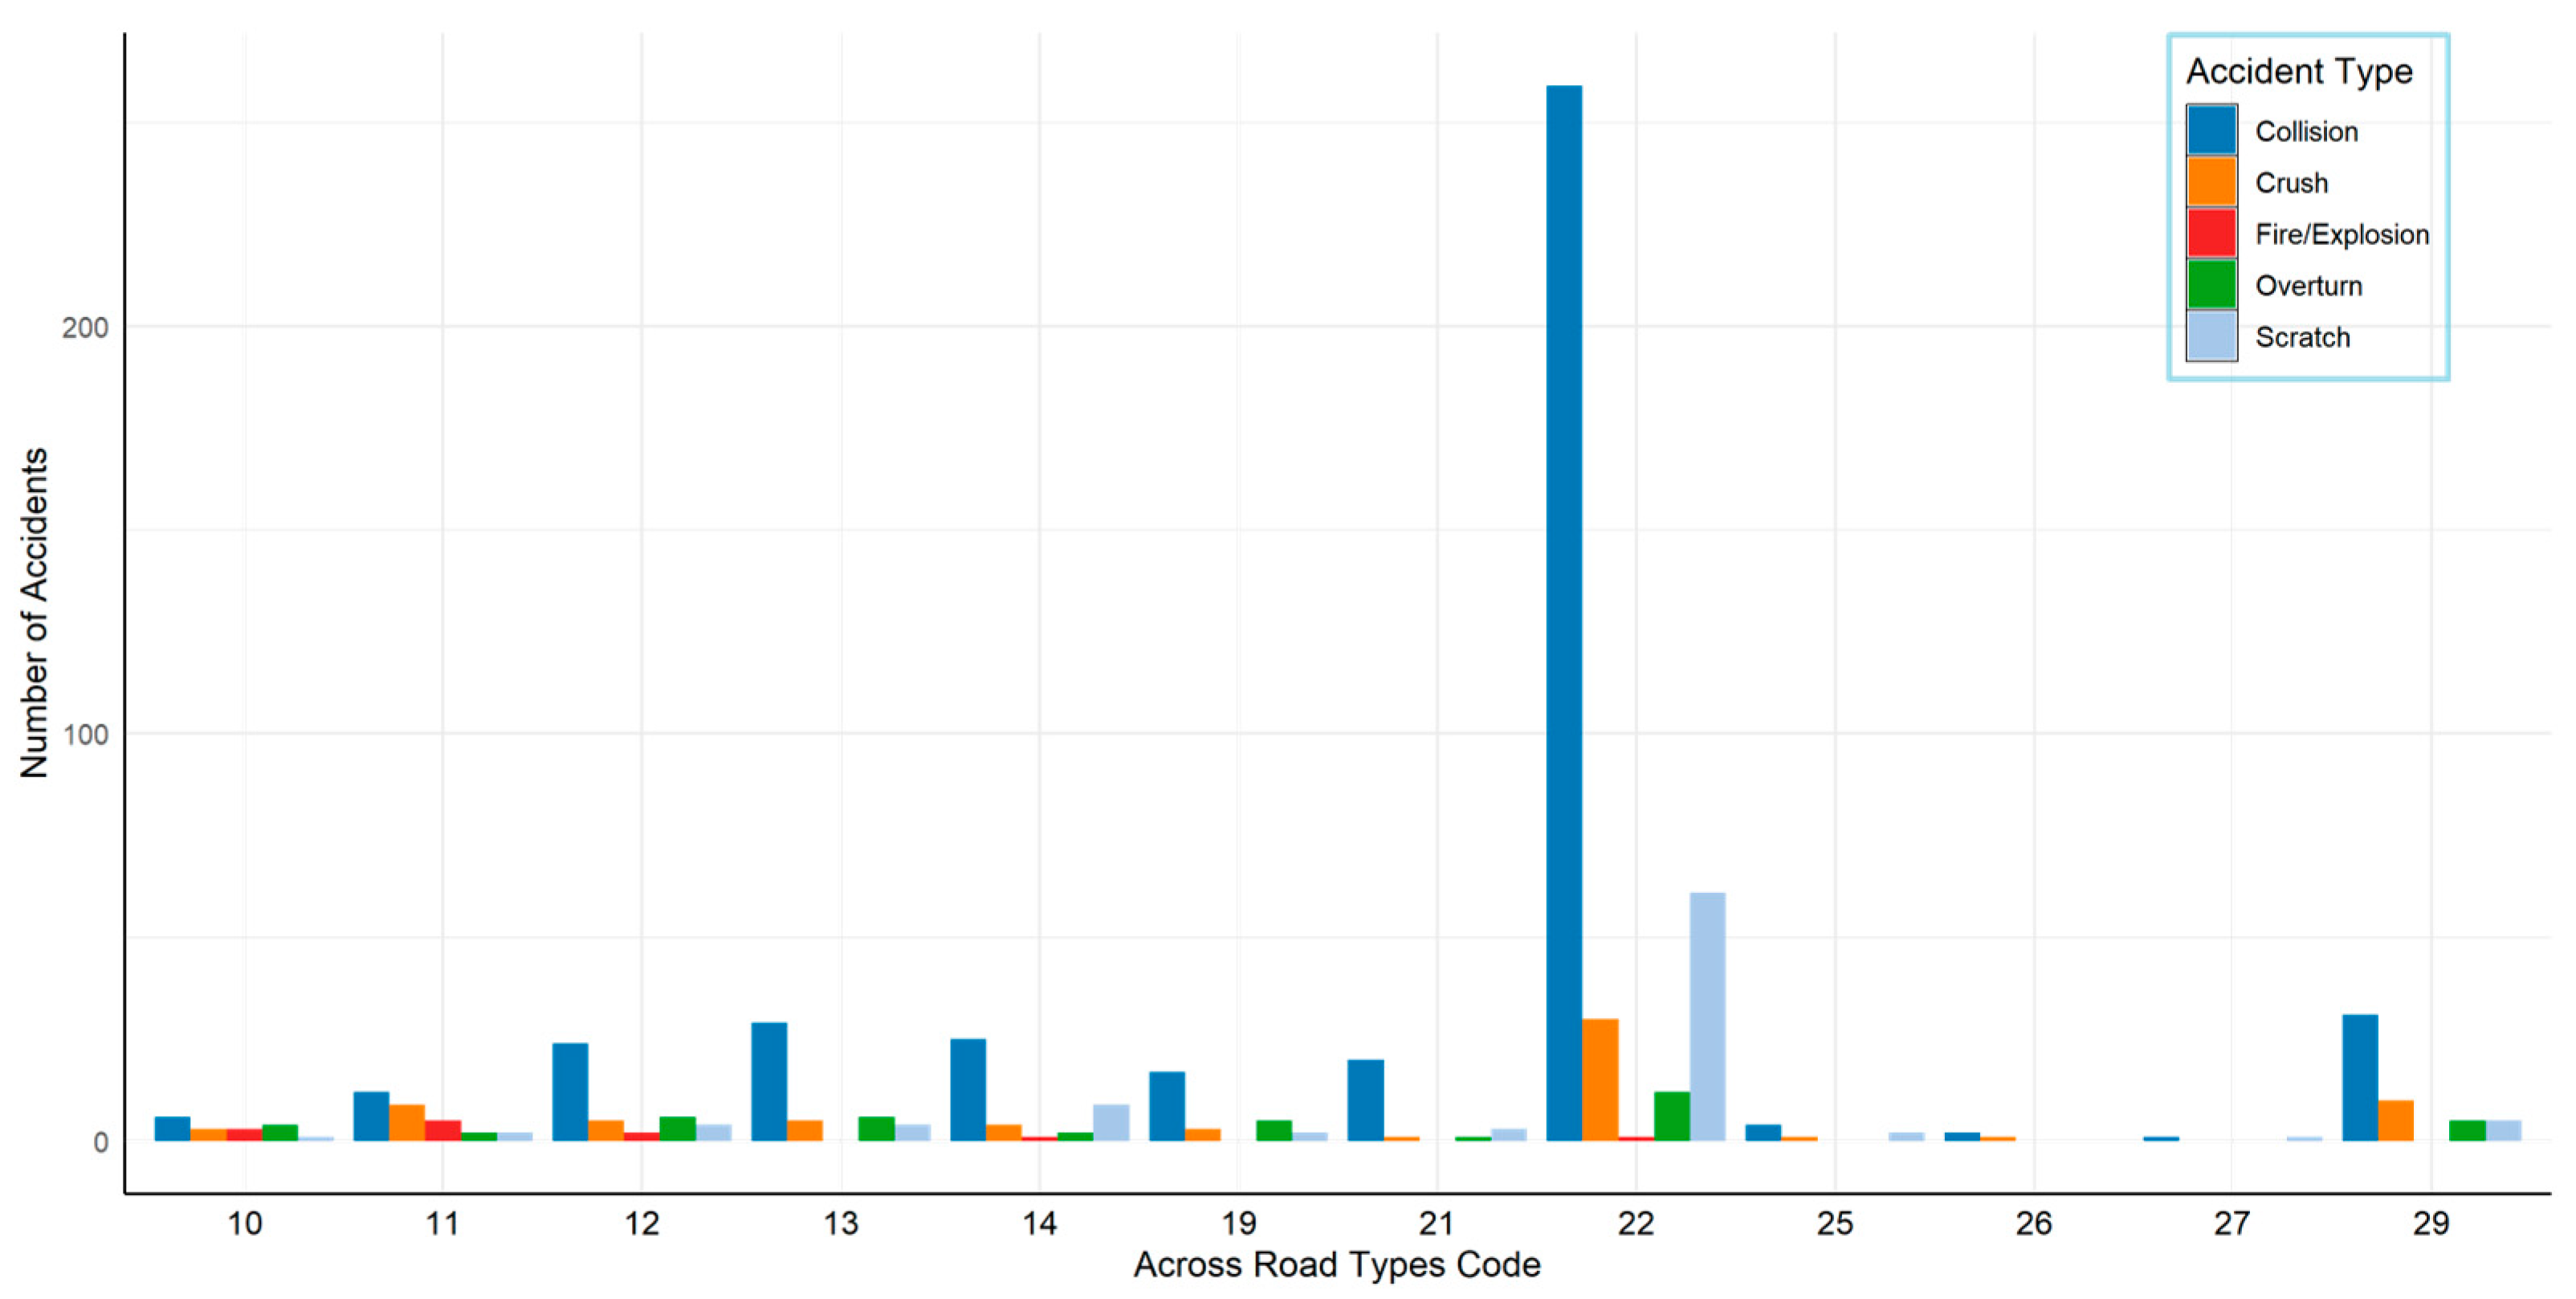
According to
Figure 3, accidents most frequently occur on general urban roads. This corresponds to the fact that these roads carry the highest traffic flow, which increases the probability of accidents.
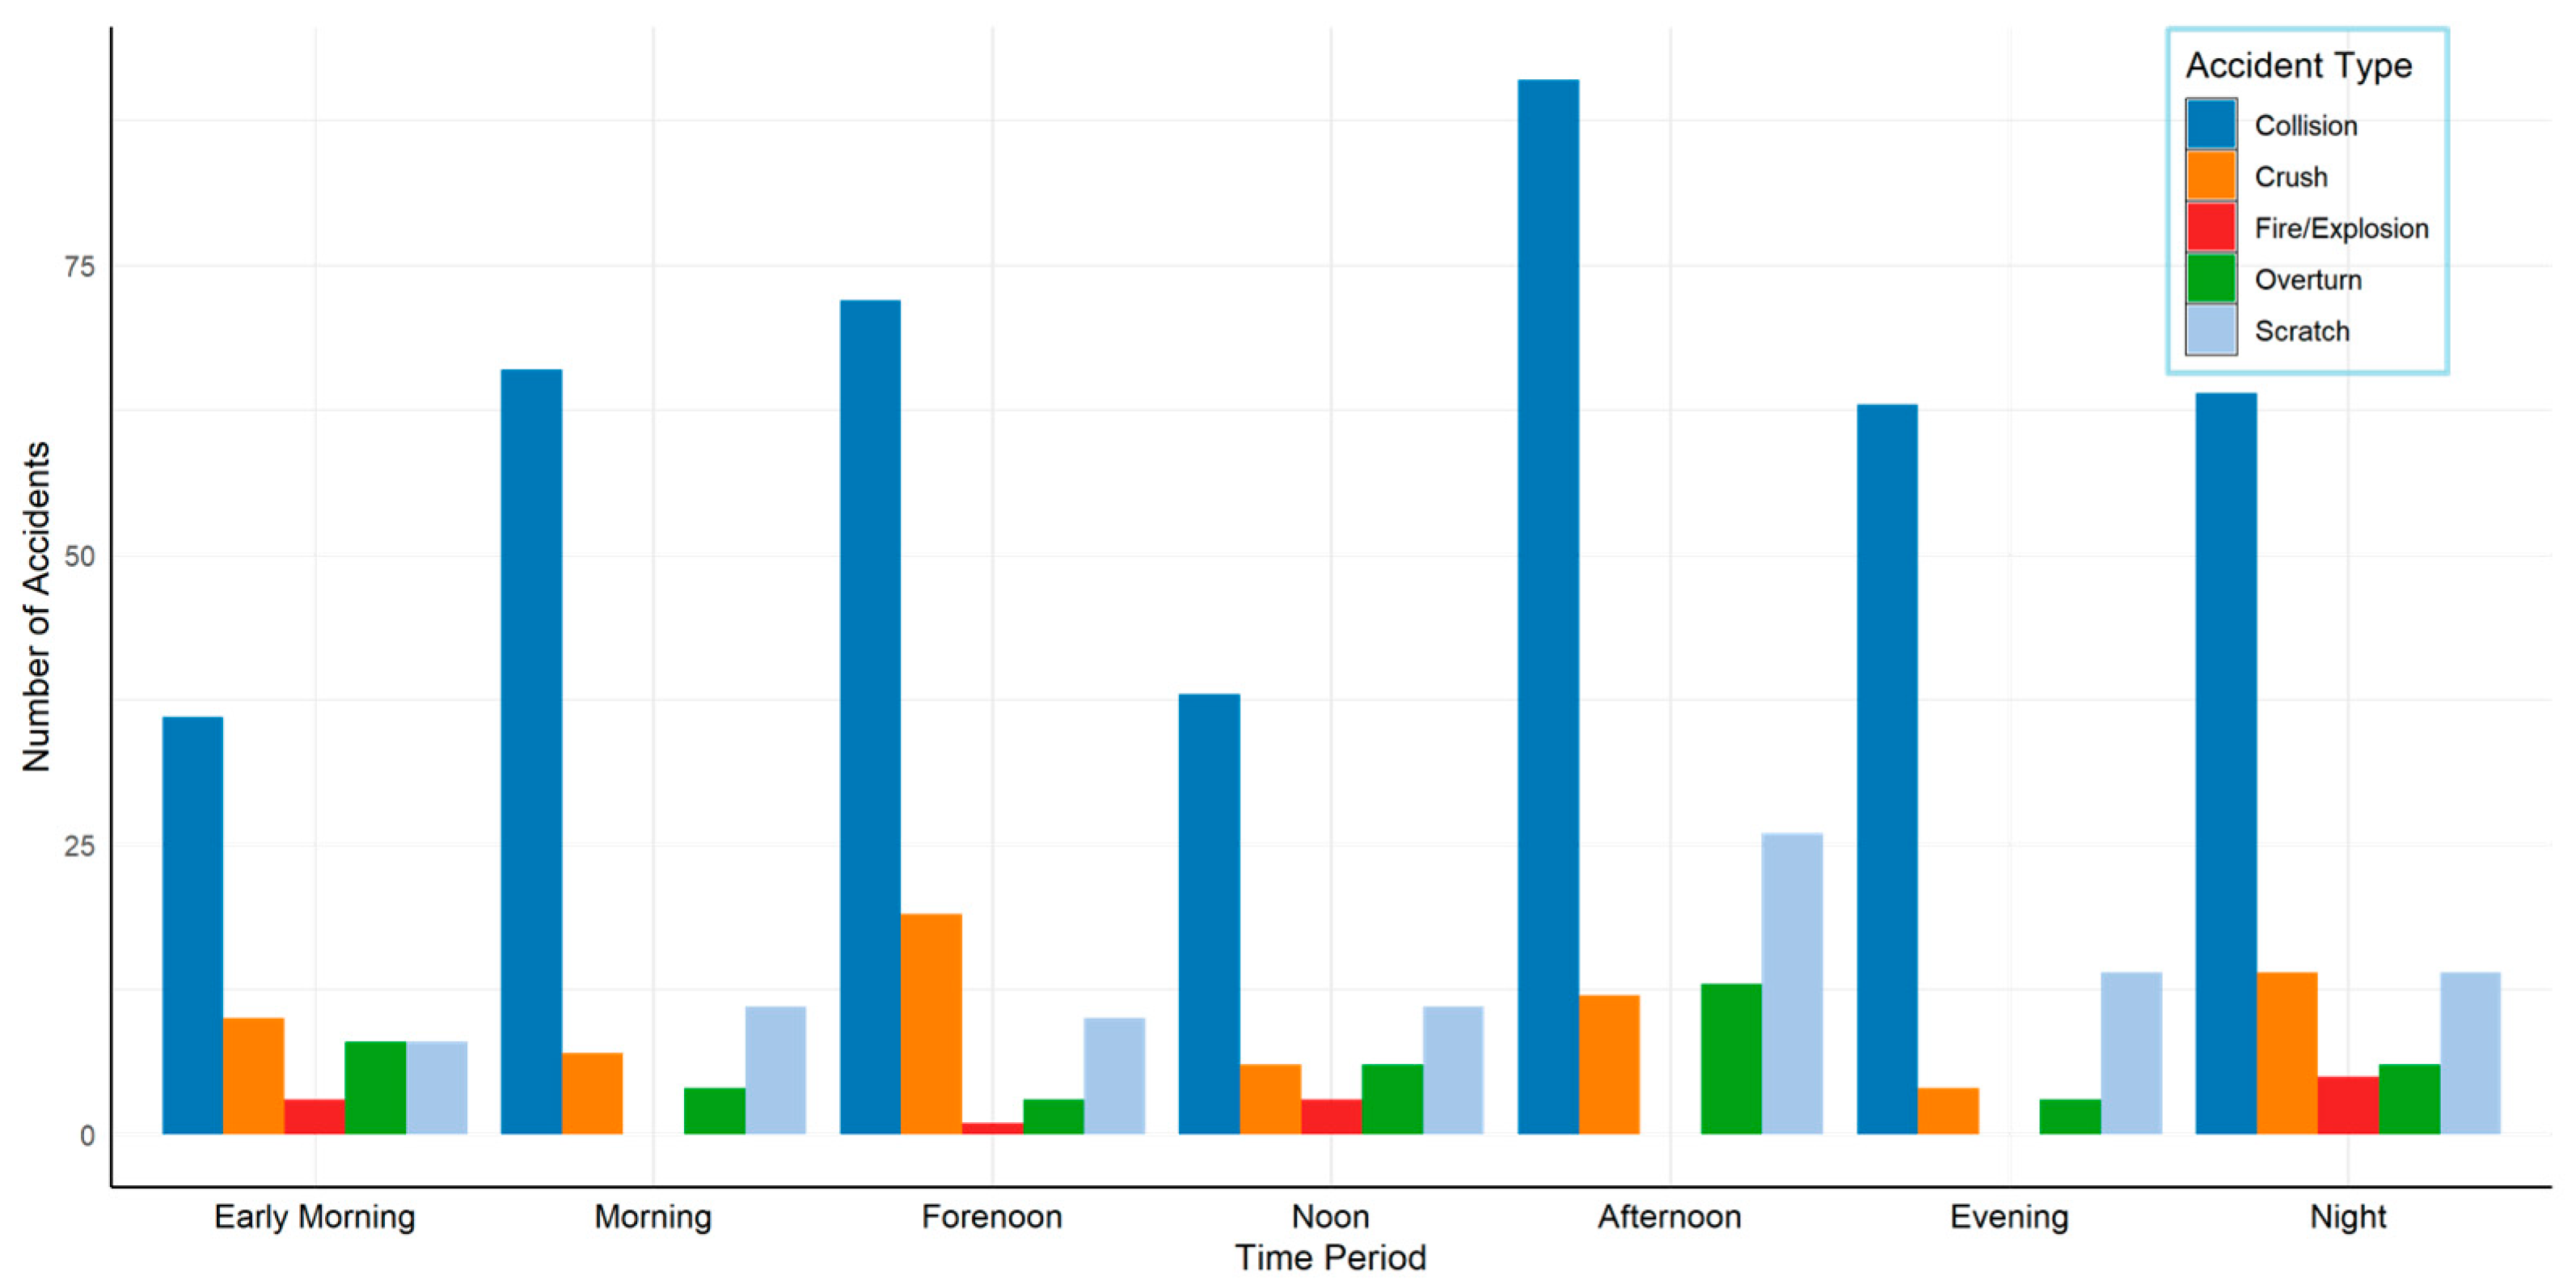
From the perspective of accident occurrence time in
Figure 4, traffic accidents occur most frequently in summer and least frequently in winter. The analysis suggests that high temperatures in summer significantly affect battery temperature and other operating conditions of new energy vehicles, increasing the risk of accidents. In terms of daily time periods, accidents are more common in the morning and afternoon, which correspond to peak travel hours with high traffic and pedestrian flow, leading to a higher accident frequency.
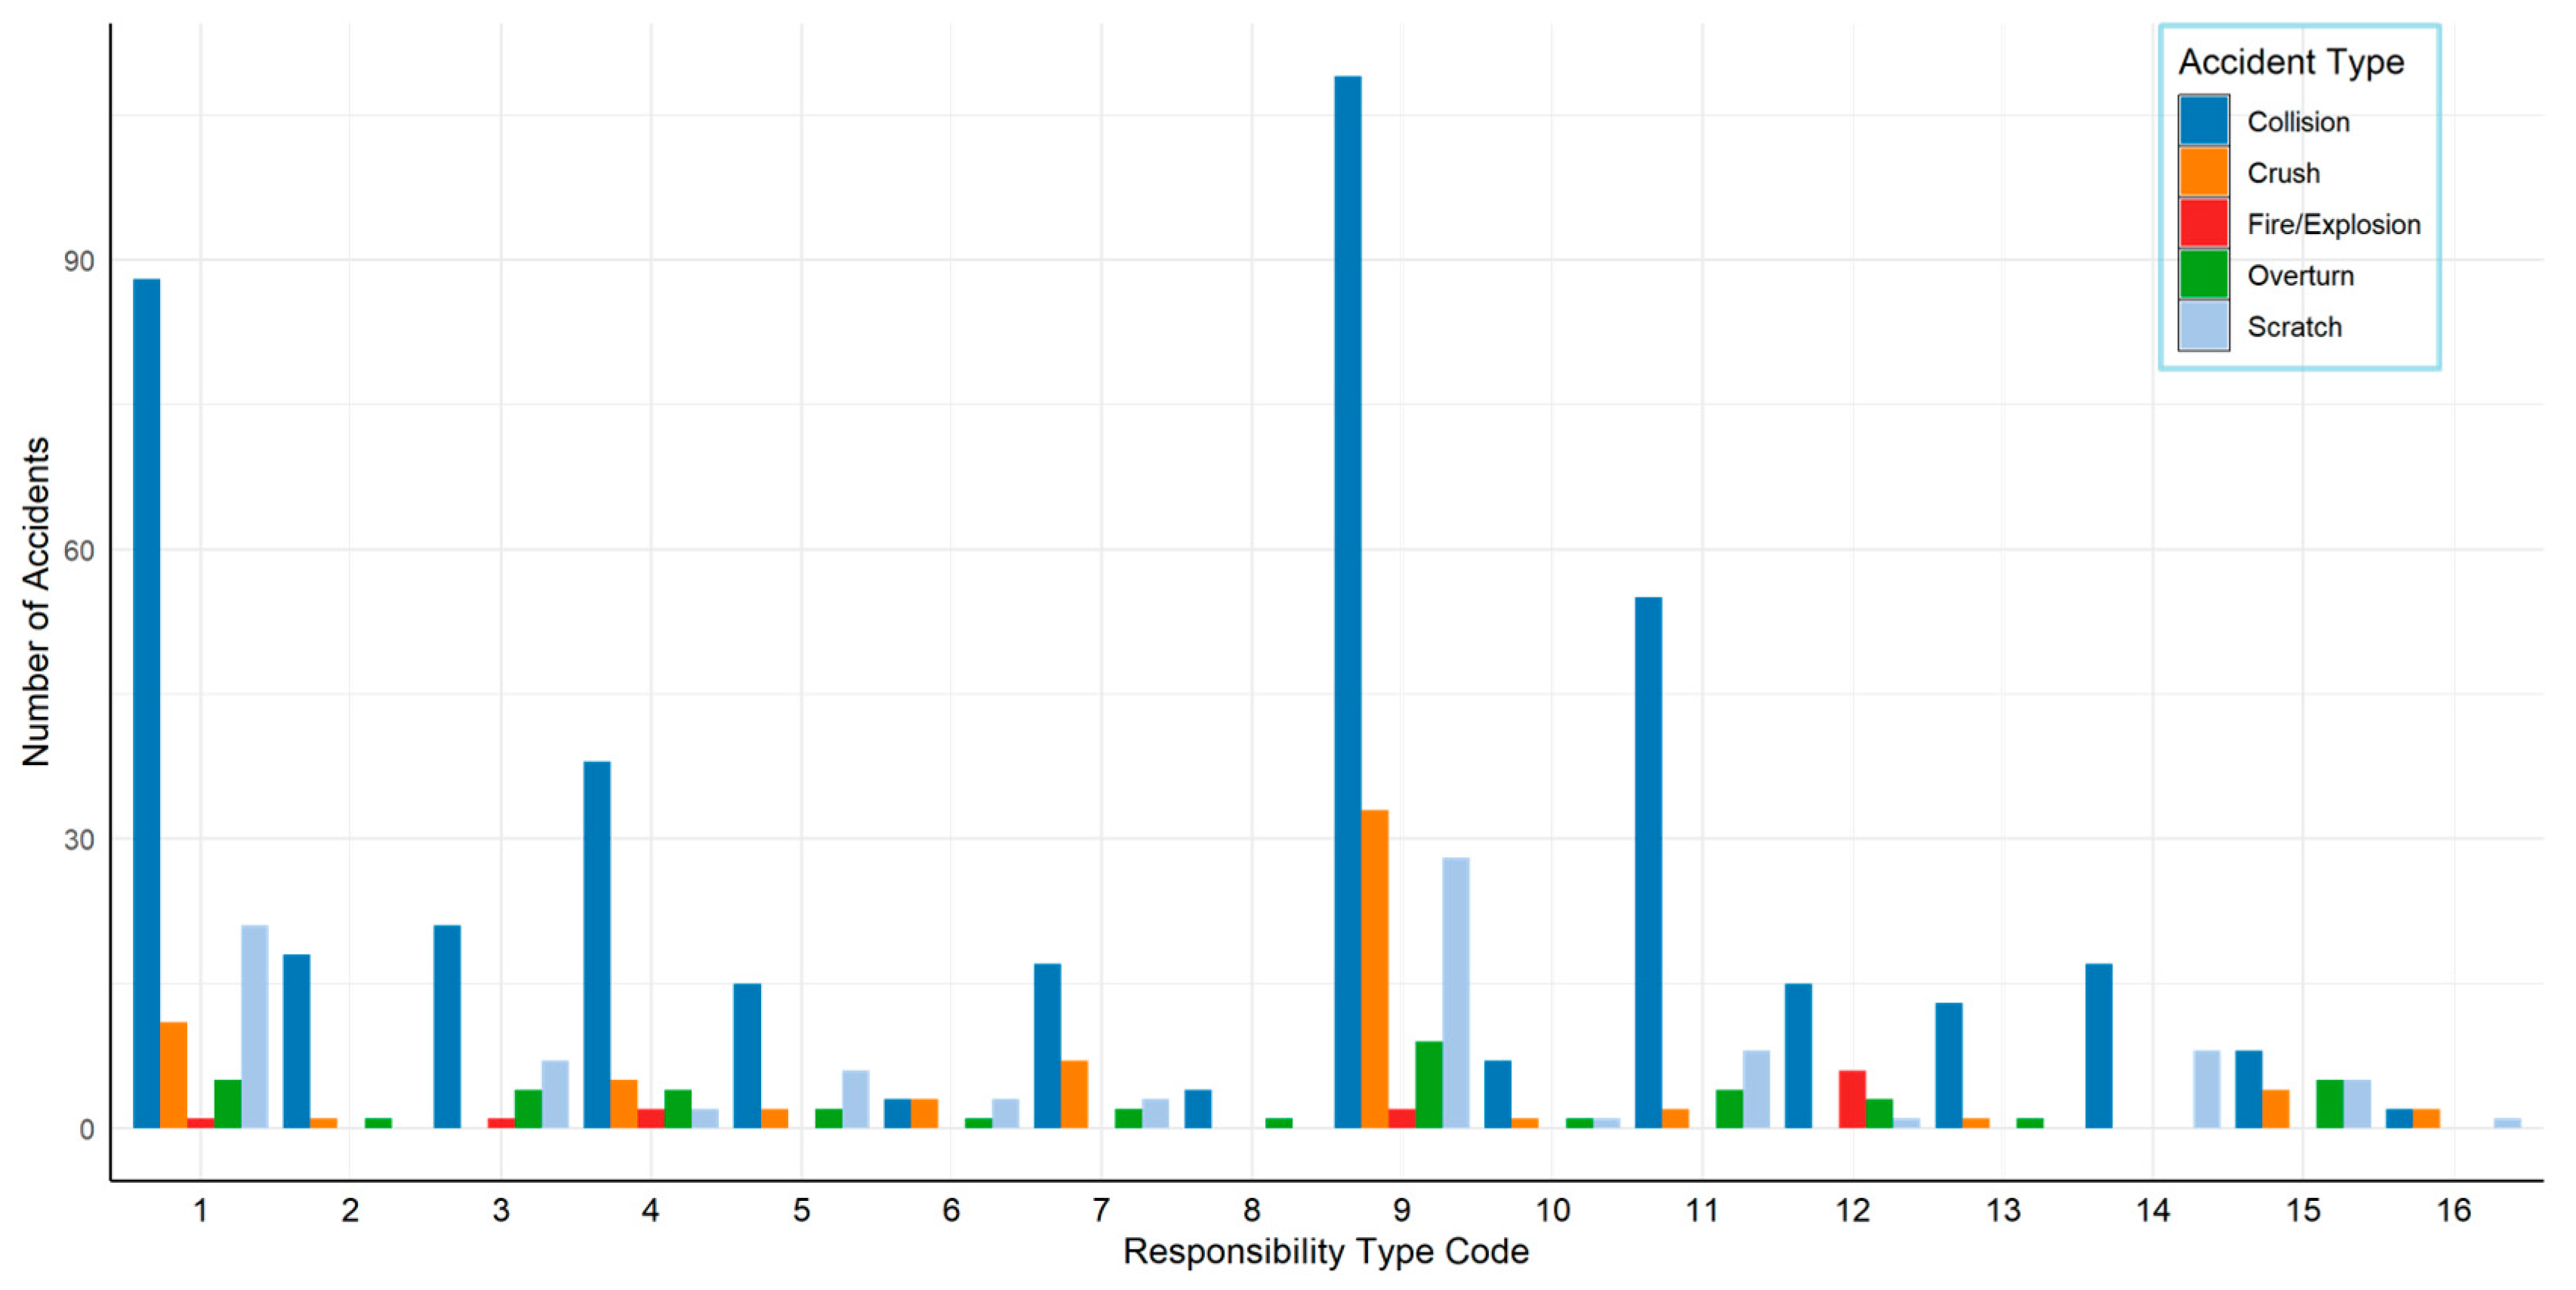
From the perspective of the accident causes presented in
Figure 5, distracted driving, running the red lights, violating traffic signals, and speeding are the main factors contributing to accidents. These dangerous driving behaviors are closely related to the driver’s driving habits.
Based on the research findings, it is recommended to adopt a multi-party collaborative safety strategy to reduce the accident risk of new energy vehicles. For traffic management departments, emphasis should be placed on strengthening patrols and traffic dispersion on urban roads with high accident rates and during peak hours, optimizing traffic facilities, and intensifying law enforcement and education efforts against dangerous driving behaviors such as distracted driving, speeding, and violations. For automobile manufacturers, it is suggested to enhance the vehicle-to-everything (V2X) data monitoring platform, establish early warning systems for key malfunctions such as brake systems and battery status, and promote active safety technologies like Driver Monitoring Systems (DMS). Meanwhile, drivers should enhance their safety awareness, regularly check the status of their vehicles, especially pay attention to the battery condition during high-temperature weather in summer, and refrain from dangerous driving behaviors.
3. The Accident Type Prediction Method Based on AS-Naive Bayes Algorithm
3.1. Data Processing Flow
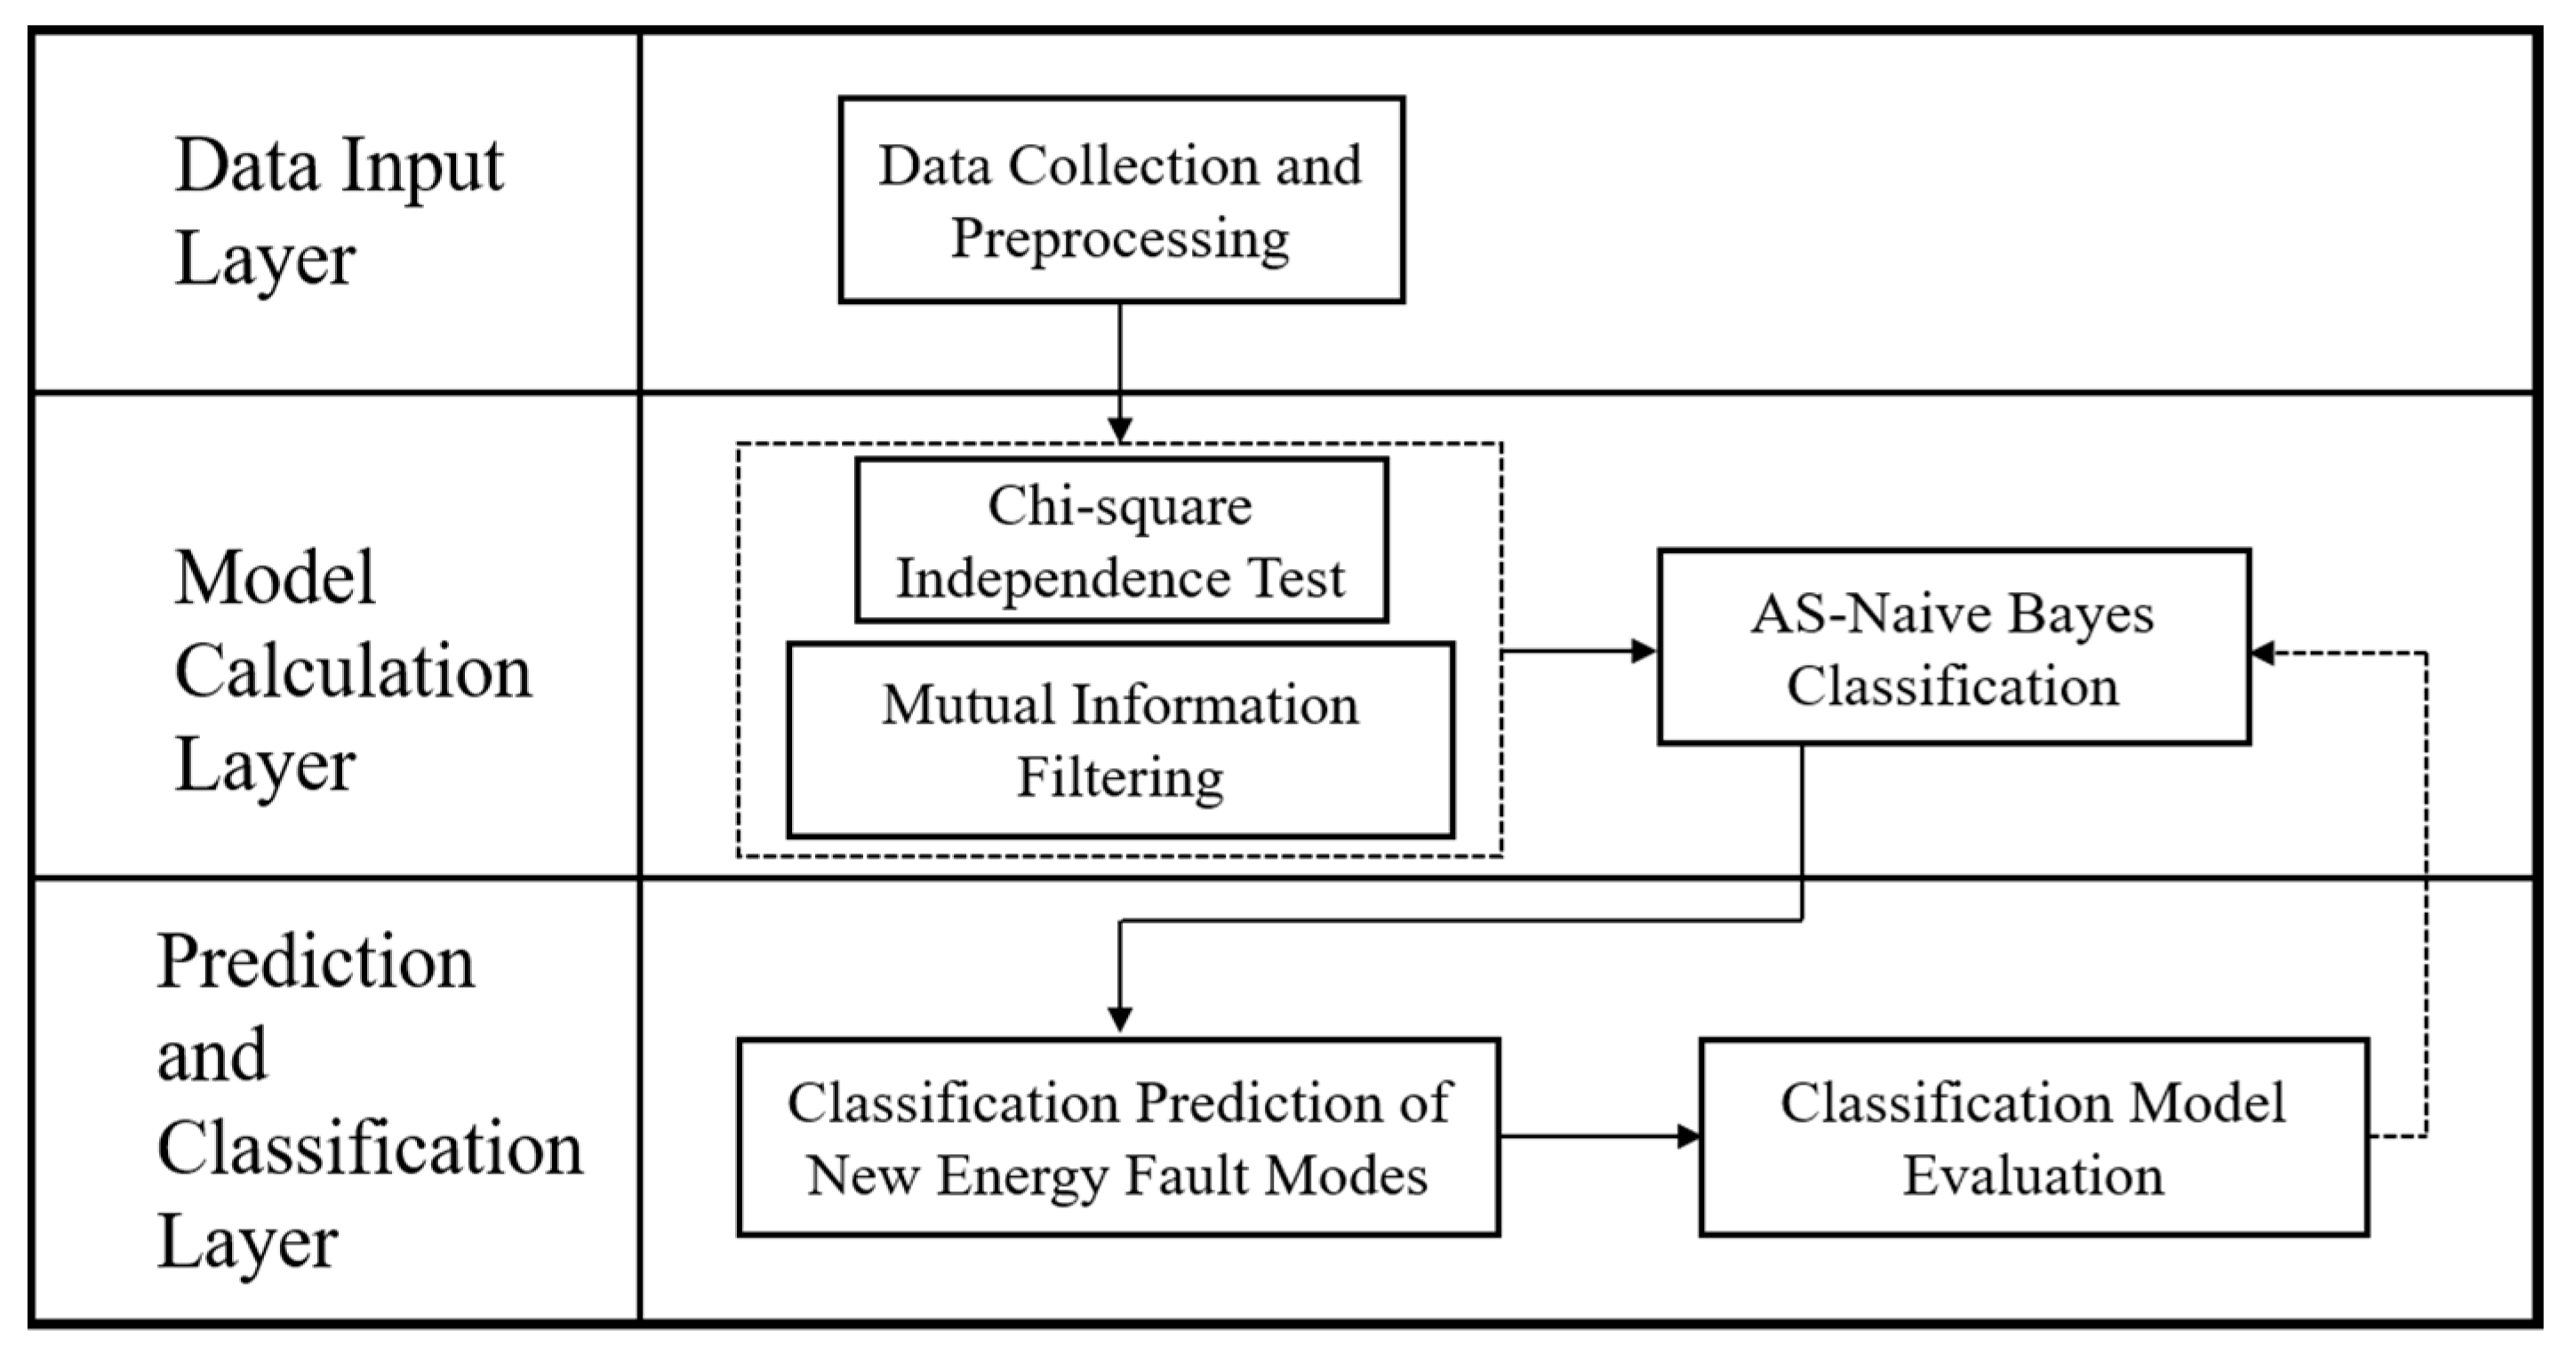
To assist traffic management authorities in handling accidents more effectively, this paper proposes an AS-Naive Bayes-based method for predicting accident types, as shown in
Figure 6. First, accident data from 2022, including scraping, collisions, run-overs, rollovers, and battery fires/explosions, are extracted from the traffic management platform. These records are then matched with the operational data of new energy vehicles using license plate numbers, resulting in 651 valid accident samples. Moreover, key features related to accidents are identified using the Chi-square test, ensuring independence among variables. These features include road type, vehicle operating status, accident time period, and accident cause. Specifically, road types were categorized into 14 classes (e.g., expressway, national road, provincial road, county road). Vehicle operating status involved 19 parameters, such as battery overcharge, drive motor temperature, and high-voltage interlock. Accident time period is represented by month and further divided into seven daily periods: early morning, morning, late morning, noon, afternoon, evening, and night. Accident causes are classified into 16 types, including drunk driving, aggressive merging, and traffic signal violations. Based on these features, an AS-Naive Bayes prediction model is developed to accurately classify accident types.
3.2. Independence Test for Accident Characteristics
As presented in
Section 2.2, the selected accident features include spatio-temporal context, environmental conditions, vehicle status, and driver behavior. To ensure the applicability of these features to the Naive Bayes approach, a Chi-square test is performed to assess their statistical independence, and the corresponding
p-values are calculated [
40]. Let the accident feature variables of new energy vehicles be denoted as
, and the accident type categories as
, where
includes
categories
and
has
categories
. The total number of new energy vehicle accident record data is
. Let
represent the frequency of feature variable
belonging to accident type
.
The Chi-square test is a non-parametric statistical method specifically designed to analyze whether there is an association between two categorical variables. The key features selected in this study, such as “road type”, “accident cause”, and “accident time period”, are essentially categorical data. The Chi-square test can effectively handle such data and determine whether they are independent when paired, making it the most suitable statistical tool for this research scenario.
Then, the Chi-square test statistics are given by [
40]:
The expression (1) approximately follows a Chi-square distribution with degrees of freedom
, where
is obtained through maximum likelihood estimation [
39]:
By selecting a significance level , the independence of the features can be assessed by comparing the p-value obtained from the Chi-square distribution.
At the chosen significance level (
), the
p-values for all feature pairs in
Table 6 exceed 0.05, indicating no significant correlation among them. Therefore, variables such as operating status, road type, accident causes, and accident time in the new energy vehicle accident data are statistically independent.
3.3. Accident Feature Filtering Based on Mutual Information
To enhance the expressive ability of features and reduce the impact of redundant dimensions, the Mutual Information (MI) method is introduced, built on the Chi-square independence test. MI quantifies the information dependency between features and the target variable. It is especially suitable for classification tasks with discrete attributes and can effectively detect nonlinear relationships.
The mutual information between two discrete random variables
and
can be defined as follows [
41]:
where
is the joint probability distribution of
and
, while
and
are the marginal probability distributions of
and
, respectively. When
,
and
are independent random variables.
To ensure a strong association between accident features and accident types while minimizing the influence of irrelevant or weakly related factors, this study treats accident type as the target variable and calculates the mutual information between it and various features, such as road type, accident cause, vehicle operating state, and accident time. Features with low mutual information values are excluded based on a predefined threshold (
). In this study, the mutual information threshold was set at 0.05. This choice was based on experience and common practice in the related literature [
42]. Features below this threshold are usually considered to have weak association with the target variable and make limited contributions to the classification model. Removing such features helps reduce model complexity, mitigate noise caused by data sparsity, and effectively prevent overfitting, thereby improving the model’s generalization ability and prediction performance.
As shown in
Table 7, features such as parking meeting, lane occupation, private roads, and public squares have significantly lower Mutual Information values compared to other key features, which means these features are evenly distributed across accident types and lack discriminative power. Therefore, they are removed. The remaining features, such as brake system warning, low SOC status, distracted driving, aggressive driving, urban roads, and highways, carry higher Mutual Information value and are retained as input variables for the Naive Bayes classifier. This selection strategy effectively improves the model’s classification performance while reducing sample sparsity and the risk of overfitting.
3.4. Bayesian Classification Method
Let
represent the accident types of new energy vehicles, which are divided into
categories. Let
represent the
-
th accident data, with
features.
denotes the value of the
-
th feature for the
-
th accident data, assuming that the features are independent of each other. According to Bayes’ theorem, the probability of
belonging to a certain category is given by [
43]:
Given the context of
,
is fixed for each category. The judgment of the category for
is determined by selecting the maximum value of
. Therefore, Equation (4) can be rewritten as:
where
and
can be estimated by the sample frequencies.
3.5. Prediction Results of Accident Types Using Naive Bayes Classification
Before applying the model, 80% of the data is randomly selected as the training set, and the remaining 20% is used as the test set. Then, additive smoothing is applied to avoid zero posterior probabilities caused by missing feature values in the training set, which may reduce model accuracy. This technique adjusts the probability estimates in the calculation of the joint probabilities
and
, as shown in Equations (6) and (7).
As shown in
Table 8 and
Table 9, the model achieves an average accuracy of 79.1%. Specifically, the accuracy for fire/explosion, collision, and scraping accidents exceeds 80%. In contrast, the accuracy for run-over and rollover accidents is relatively low, at 42.9% and 50.0%, respectively. These results are closely related to the distribution of accident types in the dataset. Collision accidents represent 61.8% of the data, while run-over, rollover, and fire/explosion accidents each account for less than 10%. This imbalance leads to model overfitting for majority classes and underfitting for minority classes, thereby affecting overall accuracy.
3.6. Handling Imbalanced Samples
In the presence of imbalanced sample distributions, traditional Naive Bayes classifiers tend to be biased toward majority classes, leading to significantly reduced performance in identifying minority classes. To address this issue, this study applies an oversampling method based on sample reconstruction to balance class distributions. Specifically, the Synthetic Minority Over-sampling Technique (SMOTE) is used to augment minority class samples in the training set. By generating new synthetic samples in the feature space, the model’s ability to learn from rare accident types (such as fire/explosion and rollover) is effectively improved.
SMOTE is a classic oversampling method that generates new samples for minority classes in the feature space, rather than simply duplicating existing ones. The core idea of SMOTE is to synthetically create new data points by interpolating existing minority class samples. The procedure is as follows [
44]:
- (1)
For each minority class sample , identify its nearest neighbors in the feature space.
- (2)
Randomly select one neighbor from these k neighbors.
- (3)
Generate a new synthetic sample
along the line segment connecting
and
using the formula:
where is a random number between 0 and 1.
This approach allows SMOTE to generate new samples with similar characteristics within the local region of the minority class, effectively expanding its decision boundary. As a result, the model can better learn the feature distribution of rare classes while avoiding the risk of overfitting caused by simple replication.
3.7. Strategy for Handling Small Sample Sizes
Given that some accident types have limited sample sizes, extremely low frequencies can distort posterior probability estimates. Specifically, if a certain feature value does not cooccur with a particular class in the training set, its estimated conditional probability becomes zero. This causes the posterior probability of that class to be zero during prediction, severely affecting the model’s generalization ability and its accuracy in identifying small-sample classes.
To address this problem, additive smoothing is introduced into the Naive Bayes model. This technique adjusts conditional probability estimates by adding a smoothing parameter
to the numerator (i.e., the frequency of co-occurrence between a feature value and a class), and adding
to the denominator, where
is the number of the potential features [
45].
The adjusted conditional probability is calculated as:
where
is the count of feature
occurring with class
;
is the total number of samples in class
;
denotes the number of potential feature values.
To optimize the prediction performance, this study applies k-fold cross-validation to tune the smoothing parameter on the validation set, identifying 0.7 as the optimal value. This method effectively prevents the zero-probability problem caused by unseen events and preserves the original probability distribution of the data through precise prior adjustment. Consequently, the model’s accuracy and robustness in predicting new energy vehicle accident types are significantly improved.
3.8. Experiments
To evaluate the prediction performance of the Naive Bayes model enhanced with SMOTE and additive smoothing in predicting new energy vehicle accident types, we also built Support Vector Machine (SVM) and Long Short-Term Memory (LSTM) models for comparison. All models are trained and tested on the same preprocessed dataset, consisting of 651 NEV accident records, using an 80/20 training–test split. Standard evaluation metrics, including accuracy, recall, and F1-score, are used for performance assessment.
The choice of SVM and STM as baseline models aims to comprehensively evaluate the performance of the proposed AS-Naive Bayes model from both classical machine learning and deep learning perspectives.
SVM: As a powerful and widely applied classification algorithm, SVM excels particularly in handling high-dimensional feature spaces and typically demonstrates strong generalization capabilities on small sample datasets, making it suitable for the data characteristics of this study.
LSTM: Considering the potential temporal characteristics (such as changes in vehicle state parameters) that may exist in accident data, we chose LSTM to explore the relationship between accident types and potential time series patterns. LSTM can effectively capture long-term dependent information, providing a deep learning perspective for model comparison.
The implementation settings for each model are as follows:
Naive Bayes (NB): Assumes independence among categorical features; implemented using the Naive Bayes package in R version is 4.2.1
SVM: Uses a radial basis function (RBF) kernel; tunes parameters through 5-fold grid search; implemented with scikit-learn in Python version 3.11.
LSTM: Employs a multi-layer architecture with 64 hidden units and a dropout rate of 0.2; trained using Keras with a TensorFlow backend; categorical features are numerically encoded.
A-Naive Bayes: Based on the standard Naive Bayes assumptions, this model introduces additive smoothing to mitigate sparsity issues. The model is implemented in Python’s scikit-learn.
S-Naive Bayes: To address class imbalance, this model uses SMOTE to synthetically oversample minority class samples before training. The classifier uses multinomial Naive Bayes model, implemented using imbalanced-learn and scikit-learn.
AS-Naive Bayes: This model combines data augmentation and model regularization strategies, first applying SMOTE to balance the training data, and then introducing additive smoothing during training. Data preprocessing is based on imbalanced learning, and model training and evaluation are implemented in scikit-learn.
As shown in
Table 10, the Naive Bayes model outperforms LSTM and SVM in terms of accuracy. This is mainly because it can effectively capture time-related patterns in features such as time and sensor status. Compared to the standard Naive Bayes, the model enhanced with SMOTE (S-Naive Bayes) achieves higher scores in Precision, Recall, and F1, as SMOTE can reduce the impact of data imbalance on prediction outcomes. Furthermore, the AS–Naive Bayes model, which integrates both SMOTE and additive smoothing, demonstrates greater robustness in sparse feature spaces. This improvement is due to the smoothing term, which reduces probability estimation bias in scenarios with limited samples or uneven feature distributions, thereby enhancing the model’s generalization ability. To provide a more balanced view under imbalanced class distributions, we also calculated the macro-averaged precision, recall, and F1-score for the AS–Naive Bayes model using the class-specific results presented in
Table 11. The results show that the macro-precision, macro-recall, and macro-F1 of the AS–Naive Bayes model are 81.8%, 75.6%, and 78.5%, respectively. Compared with the micro-averaged results (precision = 77.1%, recall = 80.1%, F1 = 78.9%), the macro-averaged scores reveal that the model still achieves strong performance across all classes, including minority classes, thus demonstrating its robustness under imbalanced data conditions.
A comparison of
Table 9 and
Table 11 shows that the Naive Bayes model enhanced with SMOTE and additive smoothing (AS–Naive Bayes) improves the prediction accuracy for small-sample accident types (such as “rollover”) from 50.0% to 72.7%. This indicates stronger overall robustness and better suitability for real-world scenarios with high-dimensional but sparse data.
In summary, the AS–Naive Bayes model, which integrates SMOTE and additive smoothing, significantly improves the prediction performance for new energy vehicle accidents under challenges such as class imbalance and feature sparsity.
3.9. Limitations of the Study
Despite the positive outcomes achieved in this study, there are still some limitations that need to be addressed in future work.
Dataset size: This study analyzed 651 valid accident records involving new energy vehicles. Although the data is authentic and effective, the sample size is still relatively small compared to traditional fuel vehicle accident data. This may limit the model’s learning ability for rare accident types. Future research should focus on expanding the dataset to enhance the robustness and generalization ability of the model.
Data reporting bias: The data was sourced from the national traffic management platform, ensuring its authority. However, some minor accidents (such as minor scrapes) that have not caused serious consequences may be underreported or unrecorded, which may lead to certain deviations in the sample data regarding accident types and severity.
Generalizability issue: The data for this study originates from China, and its analysis results and model parameters may be influenced by the specific regional traffic regulations, driving culture, road infrastructure, and characteristics of the new energy vehicle market. Therefore, caution should be exercised when directly generalizing the conclusions of this study to other countries or regions, and it is necessary to utilize local data for model validation and adjustment.
Applicable scene: The data used in this study come only from new energy vehicles (NEVs) and do not include traditional fuel vehicles. Therefore, in mixed traffic scenarios with both NEVs and traditional fuel vehicles, this method is only applicable to NEVs.
4. Conclusions
To support the sustainable development of road traffic systems, this study proposes an accident type prediction method based on the AS–Naive Bayes algorithm. First, relevant feature data for accident types (such as scratches, collisions, rollovers, tumbling, and battery fire/explosion) were extracted from the Ministry of Public Security’s regulatory platform through data preprocessing. Then, by analyzing the statistical characteristics of features under different types of accidents, such as road conditions, time, vehicle status, and driver behavior, the correlations between these features and accident types are explored. Moreover, features closely related to accident types were selected using Chi-square tests and Mutual Information. To address challenges such as small sample size and imbalanced data distribution, a new risk prediction model for new energy vehicle accident types is proposed based on the AS–Naive Bayes algorithm, which integrates SMOTE and additive smoothing techniques. Experiments on real vehicle data show that the proposed method achieves an accuracy of 84.8%, outperforming traditional models such as SVM, LSTM, and standard Naive Bayes.
Future research can be conducted with the following emphases to further enhance the value and influence of this study: (1) The real-time deployment and application of the model, deploying the accident type prediction model in the traffic management command center system to achieve real-time assessment and early warning of accident risks, providing decision support for the dynamic allocation of traffic resources and emergency response. (2) Integration with in-vehicle systems, exploring the integration of predictive models with in-vehicle information systems or Advanced Driver Assistance Systems (ADAS). The system can dynamically assess accident risks based on the real-time operating status, current time, and location of the vehicle, and issue warnings to the driver, achieving a shift from “post-analysis” to “prevention”. (3) Integrating more multidimensional data sources: future research could attempt to integrate richer data, such as high-precision weather data, driver physiological state data (obtained through wearable devices), and near-miss road traffic accident data, to construct a more accurate and comprehensive accident risk prediction model.
