Abstract
The transition to heavy-duty electric vehicles (HDEVs) offers substantial environmental benefits but raises concerns about increased pavement deterioration due to the added mass of large battery packs. A key research question is whether additional structural demands on road infrastructure could offset these benefits. This study investigates the impact of battery weight distribution on asphalt pavement performance by comparing conventional diesel trucks with electric trucks under equivalent gross vehicle weight (36 tons). Three battery placement scenarios were evaluated: (i) concentration at the steering axle, (ii) concentration at the rear tractor axles, and (iii) uniform distribution across all tractor axles. Pavement elastic response was analyzed using a representative cross-section using mechanistic–empirical modeling, with fatigue damage estimated according to the Mechanistic–Empirical Pavement Design Guide (MEPDG) fatigue law. Results indicate that tensile strains at the bottom of asphalt layers may increase by up to 60%, with relative fatigue damage rising by 185% and 34% for scenarios (i) and (iii), respectively, while scenario (ii) produced nearly equivalent damage to conventional trucks. These findings highlight the critical role of battery placement; the optimal performance seems to be achieved when weight is concentrated at the rear tractor axles.
1. Introduction
Heavy-duty freight transportation is increasingly transitioning to electric modes in order to reduce greenhouse gas (GHG) emissions and improve air quality. Medium- and heavy-duty electric trucks provide significant decreases in both the global warming potential linked to diesel combustion, typically more than 70%, and the life-cycle expenses as well, at a rate of around 11%, when compared to traditional internal combustion engine vehicles (ICEVs) [1]. These advantages support global efforts to decarbonize the freight sector and to meet national and international emission targets by 2050 [2,3].
Of course, some pertinent issues in delaying the full transition to HDEVs include inadequate availability of technology, limited travel range, constraints about payload and volume, partial economies of scale, and insufficient charging stations [4]. Even if these challenges were overcome, a considerable trade-off for the aforementioned environmental benefits would exist. Electric trucks need significantly bigger battery packs than those of light vehicles. The additional weight can make them heavier than similar diesel rigs, raising axle loads and total gross vehicle weight (GVW). Battery packs can weigh several tons for long-haul journeys, which could question current weight constraints and diminish payload capacity [5].
Because pavement degradation scales nonlinearly with axle load, the additional battery weight is especially concerning. It is well-known that pavement distress is approximately proportional to the axle load raised to the fourth power, according to the well-established fourth power law [6]. This could simply indicate that doubling axle load multiplies damage by sixteen. Therefore, it can be anticipated that significantly greater fatigue damage could result from even slight weight increases from the additional mass of the battery in heavy battery electric vehicles (HBEVs).
From the perspective of road structures, flexible pavements, comprising asphalt layers with asphalt concrete (AC) mixtures overlying granular layers, deteriorate primarily from fatigue cracking due to tensile strains at the bottom of the asphalt layers that develop as a result of repeated loading (Figure 1). As such, the first step within a pavement analysis process is to perform response calculations and estimate the strains at critical failure locations that directly affect pavement performance. The most classical failure mode corresponds to cracking that initiates at the bottom of the asphalt layers and propagates upwards (also known as bottom–up cracking) [7].
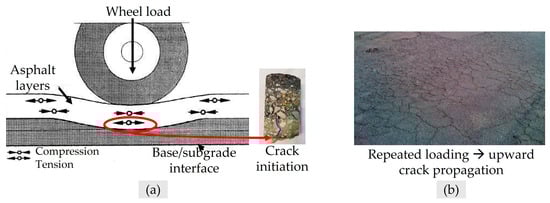
Figure 1.
Concept of bottom–up fatigue cracking: (a) illustration of strain development and cracking mechanism and (b) bottom–up cracking evolution.
Upon load repetitions, these cracks grow up, and as long as they propagate, they tend to become interconnected, appearing at the pavement’s surface as alligator (or crocodile) cracking (Figure 1). Other types of distresses, like longitudinal cracks, may come as a result of near-surface strains; these cracks tend to propagate downwards (i.e., top–down cracking). Thus, they can be easily detectable at an early stage of their development and be subject to minor treatments, e.g., crack sealing. Therefore, being more serious, bottom–up cracking drastically affects pavement damage evolution and intervention planning.
To this end, the role of layer response and performance models in pavement analysis, usually performed according to the principles of the Mechanistic–Empirical Pavement Design Guide (MEPDG), is critical. Assumptions for material behavior modeling are also crucial; the multi-layer elastic theory (MLET) is most commonly used for all pavement materials [8,9]. However, this can deviate from reality; asphalt mixtures are viscoelastic materials, which exhibit temperature and loading frequency dependency because of the binder’s nature [10], and the granular materials behave in a nonlinear elastic manner [11]. A justified selection of material behavioral assumptions can of course affect the outcome of pavement analysis and, thus, fatigue damage prediction.
No matter the material behavior mode, when a pavement is subject to heavier loads, the stress–strain state within the pavement body is intensified [10,12]. Profoundly, increased tensile strains can lead to reduced fatigue life and accelerated development of distress [13,14], thereby potentially lowering design service life, requiring more frequent maintenance actions, or at least raising relevant awareness of the decision-makers. For the case of HBEVs, beyond the total weight, the distribution of that weight among the axles, or the battery pack’s precise location, can have a big impact on the magnitude of axle loads and the resulting pavement status. A battery placed over the steer axle concentrates load differently versus placement on rear driving axles or evenly distributed across tractor axles. As such, battery mass and location must be taken into account because pavement degradation is sensitive to the additional amount of load at each axle. However, positional variability has not received as much attention in the literature as the overall GVW impacts that are most usually aligned with the optimization of requirements of transportation logistics [15].
To date, limited pavement impact studies of HBEVs have been performed. Notably, Hernandez et al. [16], using finite element simulations, showed that adding a battery within a truck can influence contact forces and pavement strains. In particular, they found strain increases around 20–30%. Zhou et al. [1], in a large-scale study with numerical simulations, analyzed the impact of adding battery masses of 0.9 and 3.6 ton per truck considering an 100% penetration rate of HDEVs. Through numerical simulations, they found 29% higher fatigue damage, 5% higher rutting, and 26% higher roughness levels. As a result of a distressed pavement, an HDEV can consume even more electricity [1], like the fuel’s consumption increases because of surface deterioration. However, to the best of the author’s knowledge, varying the weight distribution of the battery mass has yet to be thoroughly assessed.
Another critical aspect of HDEVs is the difference in vertical wheel load between HDEVs and ICEVs, as it is directly linked to the magnitude and distribution of the battery pack weight [17]. In particular, axle load distribution is altered by electric battery packs for HDEVs in multiple ways:
- Weight distribution: The truck’s chassis normally houses the battery pack, which may cause a shift in the distribution of weight and impact how the load is distributed on the axles.
- Center of gravity: The battery pack’s location may also change the truck’s center of gravity, which may have an impact on handling and stability [18].
- Axle loads: The truck’s overall weight may rise due to the weight of the battery pack, which would put more strain on the suspension and axles.
- Load distribution: Adding an electric battery may also alter how the weight is distributed between the front and back axles, necessitating modifications to the suspension system in order to preserve ideal load distribution.
There are some studies that have investigated the effect of battery pack placement on mass distribution and driver comfort [19,20]. Arora et al. [20] recommended placing the battery at the center of the truck chassis to avoid frequent crash zones, which is very important considering the huge impact of heavy-duty trucks on road crash consequences. Additionally, battery weight must have as little of an impact on the trailer’s gross freight load as possible, in order to maximize profit and truck load-carrying capacity. This is something that directly affects transportation economics, since there are remarks stating that the payload capacity of an ICEV is 1.2 times higher than HDEVs, implying that HDEV fleets might require a greater number of trips to carry the same payload [17]. From the above, it can be easily perceived that although the equipment manufacturers strive to analyze the best locations for battery placement from the viewpoint of logistical considerations, optimization is still difficult when trying to balance infrastructure-related aspects.
2. Aim and Objectives
On these grounds, the aim of the present study is to investigate the impact of different battery weight distribution of HBEVs on pavement response and performance. A typical heavy-duty truck with a weight of 36 tons was considered and a sensitivity analysis that compares different battery weight distribution scenarios was performed. These scenarios included battery weight distribution (i) at the steering axle, (ii) at the rear axle of the tractor, and (iii) distributed at all axles of the tractor. To meet the research aim, the following objectives were set:
- To establish a full pavement model comprising material properties, layer stratigraphy, and axle load determination. In terms of the model’s stratigraphy, the aim was to cover cases ranging from secondary roadways to heavy-duty motorways. Since the analysis was theoretical, the robustness of all the assumptions needed to be ensured too.
- To quantify flexible pavement responses because of ICEVs and different cases of HBEVs. Response calculations were performed with the well-known 3D-Move Analysis (version 2.1) developed in the University of Nevada, Reno [21].
- To estimate pavement performance in terms of the fatigue damage potential, which is crucial for maintenance and rehabilitation decision-making. Accordingly, relative damage was calculated based on Miner’s law and the MEPDG fatigue law was used for the estimation of the allowable traffic repetitions until failure is reached [22].
- To additionally evaluate pavement response and performance indicators with statistical methods (e.g., t-tests, descriptive statistics).
Based on these goals, this study’s contributions involve quantitatively comparing HBEVs and conventional trucks for pavement structures and identifying optimal battery placement scenarios that minimize additional pavement damage, providing insights useful for vehicle design and pavement management.
The rest of this paper is organized as follows: Section 3 includes a detailed description of the methodology followed for the research, Section 4 includes the results of the analysis, Section 5 provides discussion points and acknowledges study limitations, and Section 6 summarizes the main findings of the present research.
3. Research Methodology
3.1. Typical Pavement Section and Materials
The first step of the experimental procedure included the establishment of a representative pavement model. A typical cross-section of a flexible pavement is illustrated in Figure 2. The considered pavement consists of a unified asphalt layer for simplicity purposes, a granular base layer, and a subgrade. The illustrated thicknesses were selected based on common engineering sense for secondary roadways (i.e., 8 cm for the asphalt layers) and heavy-duty motorway structures (i.e., 15 cm for the asphalt layers) subject to lower and higher traffic volumes, respectively. The selected values are in accordance with other studies that deal with pavement analysis issues (e.g., [10,23]).
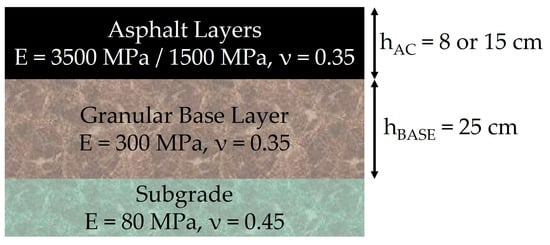
Figure 2.
Assumed pavement structure.
In regard to pavement materials, typical values for the California Bearing Ratio (CBR) were considered for the subgrade and base layer material comprising natural gravel and compacted crushed-stone granular material, respectively. The considered CBR (%) values are given in Table 1 and were thereafter converted to moduli of elasticity according to Equation (1) developed by Powel et al. [24]. Their behavior was assumed to be linear elastic.

Table 1.
Material properties for base and subgrade.
As per the asphalt mixtures of the asphalt layers, two different elastic moduli were assumed, i.e., 3500 and 1500 MPa (recall Figure 2), representing structures with higher and lower AC stiffness, respectively. These values were selected in accordance with other studies [23], and they can capture the different behavior of asphalt mixtures at different temperatures. Profoundly, an increase in temperature results in a lower modulus because of the viscoelastic nature of asphalt mixtures. To further support the selection of these values, it is mentioned that in another laboratory study, asphalt moduli were found to be less than 1000 MPa at the temperature of 40 °C [25].
3.2. Loading Considerations
Following the objective of this study, a reference loading condition was needed, which came as a result of a typical ICEV (one truck coded as ICEV). Loading data found in [17] were used to define the reference truck, which had a total weight of 36.3 tons (80 kips) distributed through a single steering axle with single tires, tandem axles with dual tires at the rear driving axles of the tractor, and tandem axles with dual tires for the trailer (Figure 3). The total weight refers to the gross vehicle weight of the ICEV with full payload capacity.
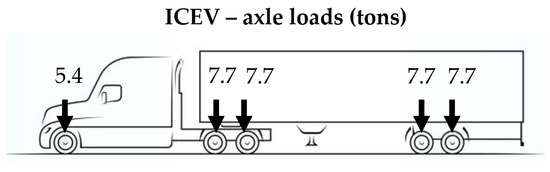
Figure 3.
Axle loads (tons) for the considered ICEV (reference truck).
For HBEVs, the maximum allowance of 0.9 tons (2 kips) was considered compared to ICEVs as per [17]. This implies that although the total net weight of HBEVs is definitively higher than 0.9 tons, the necessitated difference in the GVW lowers the payload capacity of HBEVs. Therefore, in order for the comparison to make sense, the sensitivity analysis of different weight distribution at HBEVs considered a maximum weight of 37.2 tons (82 kips). As per the different weight distributions because of the battery presence for the case of HBEVs, the distributions shown in Figure 4 were assumed according to [17]. Three trucks are illustrated, coded as HBEV-a, HBEV-b, and HBEV-c. The change in battery weight distribution was intended to optimize freight capacity, while maintaining the GVW constant. The load magnitude of the trailer axles remained the same.
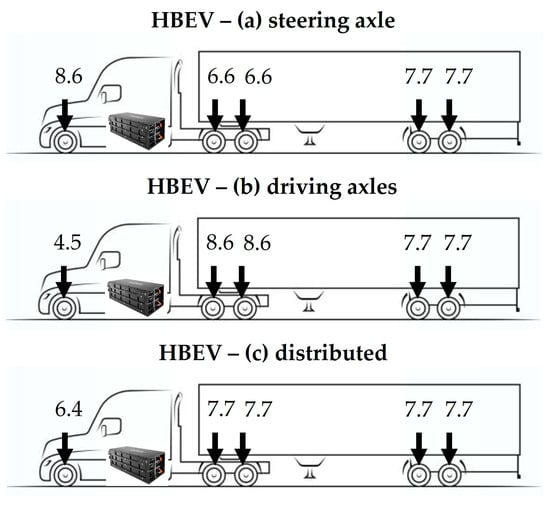
Figure 4.
Alternative weight distribution of HBEVs (tons): (a) at the steering axle, (b) at the rear driving axles, and (c) distribution at all axles of the tractor.
Once the axle loads were established, tire pressures were calculated considering typical values for the radii of the tire–road contact area. The related calculations are shown in Table 2 and the considered radii were taken from other relevant studies [26]. Of course, there can be other assumptions for the geometry axle load and tire configuration, for instance, wide-base single tires instead of dual tires [27,28]. However, only dual tires were assumed in this study for the rear tractor and trailer axles.
Table 2.
Axle loads and tire pressures.
It is obvious that the estimation of pavement damage because of each one of the four considered trucks required three different response calculations; one for the steering axle load, one for the rear driving axles of the tractor, and one for the trailer axles.
3.3. Analysis Framework
The methodological framework of the present study is illustrated in Figure 5. Considering the axle configurations of the four trucks (recall Figure 3 and Figure 4), and all of the different sets of variables (in particular the two asphalt moduli and layer thicknesses), response simulations were performed in 3D-Move. Strain calculations were made by using MLET assumptions for the behavior of all layers. Despite the fact that MLET oversimplifies material behavior, it still remains a reference calculation theory that is commonly used [29,30,31,32]. As such, it makes sense to use MLET in a preliminary approach as a guide for further and more complicated analyses by simultaneously acknowledging its constraints and impact on the analysis outputs.
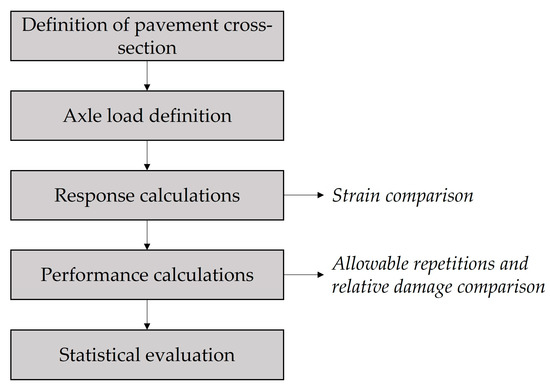
Figure 5.
Research flowchart.
For this study, the requested output included the strain at the bottom of the asphalt layer or else the pavement’s failure location. This strain refers to the horizontal tensile strain, which is the maximum of or (longitudinal or transverse strain) depending on the axle load configuration, related to fatigue phenomena. As mentioned earlier, this strain is the key input for the pavement’s remaining life estimation in terms of fatigue that usually triggers the decision-making process at pavement evaluation procedures. As such, the importance of strain knowledge for the road status assessment is highlighted.
Thereafter, the allowable traffic repetitions against asphalt layers’ fatigue, , for each axle load were calculated according to the fatigue law of the MEPDG [22]. These were calculated as follows:
where
- and ; and are binder and air-void contents (by mixture volume) with default values of 4.5% and 7.6%, respectively, considered in the 3D-Move software and assumed herein too.
- is a factor dependent on the thickness of the asphalt layers ( in inches). Its use is expected to increase the predicted pavement fatigue life (transfer function). Ch is defined in Equation (3). The parameters a, b, c, and d vary depending on the failure mode, i.e., bottom–up or top–down cracking. For the former, a, b, c, and d take the values of 0.000398, 0.003602, 11.02, and 3.49, respectively.
- : Local or mixture-specific field calibration constants; for the global calibration effort, these constants were set to 1.0. In the absence of local field calibration, unity values are commonly utilized in similar studies, e.g., [29].
- : Global field calibration constants. NCHRP 1-37A proposes the values of 1, 3.9492, and 1.281 for bottom–up cracking prediction [22].
- , : Tensile strain (m/m) at the depth for bottom–up cracking prediction and the dynamic modulus of AC (expressed in psi), respectively.
Once the allowable load repetitions () were calculated, pavement damage from each truck was estimated based on the Miner’s law, as
where
- : The predicted traffic repetitions per axle load. In the absence of specific traffic data, , and were all set equal to 1, and the calculated damage corresponded to the relative damage of each truck or else the “quasi-damage” caused from just one passage of the considered truck. The term “relative damage” is, thus, used solely for comparative purposes.
- : The allowable traffic repetitions per axle load (i.e., as calculated from Equation (2)).
Finally, the produced strain and damage output was statistically evaluated in order to assist the interpretation of any kind of the observed differences. One common way to evaluate the observed differences in two samples is to perform the well-known paired t-test. Wherever used, the null hypothesis corresponded to the assumption that a negligible difference exists between two individual samples (e.g., calculated strains). The null hypothesis was accepted when |tSTAT| < tCRIT. It is clarified that the primary aim in this study was not to develop a predictive model but rather to assess the statistical significance of observed differences between paired conditions. For this purpose, the paired t-test is an appropriate method, as it directly evaluates mean differences. While regression analysis would indeed be more suitable if the focus was on modeling strains or damage from multiple independent variables (e.g., layer thickness or AC modulus), the analysis here concentrated on evaluating condition-specific differences.
4. Results
Following the rationale of this study, critical strains at the bottom of the AC layers are first presented. In accordance with the international literature [10], for single tires, equals because of the axisymmetric loading conditions, whereas for dual tires, the horizontal strain reaches its maximum value in the longitudinal direction (i.e., ).
Figure 6 illustrates AC strains because of the four considered trucks for the case of an AC thickness of 15 cm, representing the case of heavy-duty motorways. For better clarity, a sketch of each truck (ICEV, HBEV-a, HBEV-b, HBEV-c) is given to supplement the interpretation of the figure. It is noted that the load differentiation refers only to the tractor axles, whereas the trailer axles are similarly loaded.
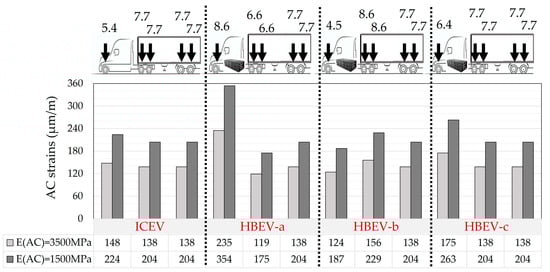
Figure 6.
Strain calculations for the cross-section with a thickness of 15 cm for the asphalt layers.
From Figure 6, it can be seen that for each pair of strains, the lower AC modulus rationally increases strain values, implying that in cases with higher temperatures (where the AC modulus is reduced), the stress–strain state within the pavement body becomes more intense. Comparing the different types of trucks, it is obvious that the steering axle of HBEV-a has the most stressing load, leading to the maximum observed strain. Truck HBEV-c follows, whereas it can be roughly said that trucks ICEV and HBEV-b appear to be nearly equivalent. Of course, this is to be further quantified in the next analysis step of damage estimation. The corresponding strains because of the four considered trucks for the case of an AC thickness of 8 cm are given in Figure 7. Similar remarks can be made from this figure too.
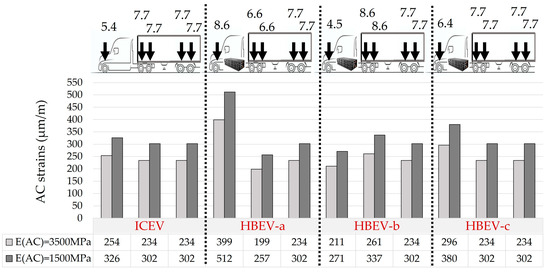
Figure 7.
Strain calculations for the cross-section with a thickness of 8 cm for the asphalt layers.
Compared to the international literature, a similar order of magnitude for the tensile strains was found in [17], where a range of 50–300 μm/m was reported for ICEV and HBEV loading. Factors that definitely affect the strain outcome include layer thicknesses, load magnitudes, assumptions for material behavior, rolling conditions, etc.
To further highlight the indirect impact of temperature conditions on the produced strains, all strain calculations for the AC moduli of 3500 and 1500 MPa were gathered in two paired samples considering data from all trucks and all axle loads. The statistical assessment of the strain differences is given in Table 3. The rejection of the null hypothesis indicates the significance of the observed differences.
Table 3.
Paired t-test for strain calculations with AC moduli: 3500 and 1500 MPa.
The next step included the calculation of the allowable traffic repetitions against failure (Equation (2)). It is clarified that these repetitions refer to individual axles and not to a particular truck; a truck’s destructiveness is expressed through the damage factor estimation (Equation (4)). Therefore, it was decided to present the data in terms of boxplots per each sample of a particular pair of the AC modulus and thickness (Figure 8). As an overview, it can be said that the section with the lower thickness (representing a secondary roadway) has a shorter life in terms of the allowable traffic repetitions, or else thinner sections reach their failure potential earlier. This is accordance with other research claiming that bottom–up cracking failure is much more critical for structures with thin AC layers [29]. On the other hand, thicker structures have a higher tolerance against fatigue failure, but when the AC modulus becomes reduced, fatigue life becomes shortened too.

Figure 8.
Boxplots of allowable traffic repetitions.
The damage potential was quantified with Equation (4), and the results are given in Figure 9 and Figure 10. Herein, the comparison is presented in terms of the truck type and the type of roadway (thick versus thin structure). From Figure 9, it can be clearly seen that for both types, HBEV-a is the truck with the most critical weight distribution, as the damage produced from this truck is, by far, higher than that of any other truck. There seems to be an agreement with other results published elsewhere, as Jayme et al. [17], after thorough simulation analysis with variable battery placement scenarios and pavement structures, concluded that vehicle equipment manufacturers are unlikely to place the battery on the steering axle, as it is an extreme condition from the view of pavement response and performance. Notably, for the thinner structure, the relative comparison is much sharper. Again, trucks ICEV and HVEB-b appear to be equivalent in terms of the produced damage. Similar remarks can also be made from Figure 10, where the lower AC modulus is considered.
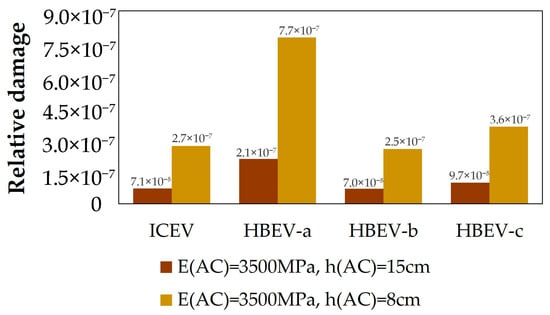
Figure 9.
Relative damage for structures with higher AC stiffness (modulus: 3500 MPa).
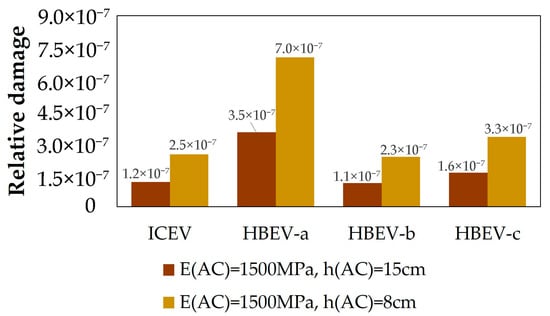
Figure 10.
Relative damage for structures with lower AC stiffness (modulus: 1500 MPa).
Moving forward, Table 4 quantifies the percent change in the damage factor between the alternative cases of HBEVs by keeping the ICEV as the reference truck. It can be seen that the worst alternative weight distribution comes from the HBEV-a (weight distribution at the steering axle), while the best alternative weight distribution comes from the HBEV-b (weight distribution at the rear driving axles of the tractor). This is consistently valid for all of the four considered pavement structures. Similar damage increases around 180–200% have also been reported elsewhere for the case of HVEB-a, thereby arguing against the battery placement on the steering axle, as mentioned earlier too [17].
Table 4.
Percent damage comparison between the considered trucks (reference truck: ICEV).
Furthermore, the negative percent changes for HBEV-b denote that this truck can produce a slightly lower damage than the reference truck. Recall that all these remarks refer to the scenario of full payload capacity, which means that for empty or partially loaded trucks, the results might be different. For comparability purposes, Zhou et al. [1], based on simulation analysis too, reported a fatigue increase of 29% without mentioning the exact location of battery placement. This increase rate approaches those reported herein for the case of HBEV-c.
Therefore, based on the so far analysis, it seems that for fully loaded trucks, distributing the additional battery weight at the rear driving axles of the tractor seems an optimal solution that marginally affects the pavement performance and damage evolution. Expanding the sample size of the analysis with additional structures, layers stratigraphy, and geometries of axle and tire configurations will enable to further confirmation of these preliminary remarks. The advantage of implementing this approach will be the assurance that the mechanistic pavement design reflects evolving traffic conditions and emerging transportation technologies.
5. Discussion, Limitations, and Opportunities
The design, functionality, and upkeep of pavement infrastructure face new difficulties as a result of the broad adoption of HDEVs. To guarantee long-term road performance, it is crucial to comprehend the interdependencies between HBEVs and pavement structures, given the increased axle loads and changed weight distributions brought on by big battery packs. The current study reveals that strain profiles throughout the pavement system can differentiate because of the battery weight distribution. In turn, different strains significantly impact fatigue life and maintenance needs.
Notwithstanding the information provided, this study has a number of limitations:
- First, a theoretical framework without field calibration or validation was used for the analysis. In real-scale conditions, pavements are exposed to additional environmental and weather effects apart from traffic loading. Temperature variations, moisture conditions, and rainfall events can drastically affect the evolution of pavement damage; future pavement performance monitoring of pilot test sections is necessary for an improved understanding and validation of the coupled impacts of HBEVs. In the meantime, long-term aspects like material aging, fatigue accumulation, environmental exposure, etc., can have a significant influence on performance and, thus, should be more systematically studied in the near future.
- Second, rather than using a fully coupled thermal–mechanical–viscoelastic model, modulus variation was used to indirectly reflect temperature effects. However, this approach ignored the dynamic nature of loading (i.e., temperature- and frequency-dependent) and the temporary effects of braking and acceleration forces that could alter pavement damage evolution.
- Third, the vehicle layouts did not include regenerative braking or acceleration forces, which may also have an additional impact on pavement wear patterns [1]. These are inherently related to HBEVs and thus should be jointly studied in the future.
- Finally, only one truck type with a unique axle load configuration and a single value of GVW was considered. Variable GVW depends on non-pavement-related aspects, i.e., transportation logistics, route planning, etc. Beyond detecting variations in pavement performance (as in the present study), extension of the response analysis with variable GVW, truck types, and axle configurations could offer an optimized scheduling of vehicle route planning in favor of pavement performance and optimal road asset condition.
From the previous limitations, it appears as a major challenge that the selection of material behavior theories can have a significant impact on the calculated pavement responses, thereby affecting the accuracy in the results. For instance, AC viscoelasticity could lead to even higher differences at higher temperatures or lower frequencies [10]. Similarly to this, granular base and subgrade materials frequently exhibit nonlinear plastic or elastic properties, especially when subjected to high axle loads. Nevertheless, the main goal of this preliminary study was to enable reliable relative comparisons amongst HBEV designs, which were made possible by the methodology used here. Presumably, since differences are already profound through MLET, which is less conservative [33], the consideration of AC viscoelasticity could provide even more critical response and performance calculations from a mechanistic viewpoint. Definitively, full-scale testing, monitoring, validation, e.g., through accelerated pavement testing, are important aspects to consider for a more solid assessment of the optimal weight distribution of HBEVs.
Furthermore, in this study, HBEVs operating at full payload capacity were considered. In addition, only one tire configuration was assumed for the tandem axles of all trucks. In real-world circumstances, load distributions based on vehicle payload can become highly dynamic, leaving margins for the battery’s load contribution to become proportionately more dominant when HBEVs operate at partial or empty payload capacity, especially if it is not evenly distributed between the axles. This is because the net weight increase in batteries in HDEVs is higher than the increase in GVW [17]. To overcome this limitation, further analysis cases should be considered followed by real-time routing and infrastructure-aware logistics planning to better understand potential changes under various loading conditions. The role of weigh-in-motion (WIM) stations should also be reassessed towards developing pilot sections subject to HBEV loading. Finally, changing the geometry of tire configuration (e.g., dual tires versus wide-base single tires) could also substantially alter the outcome of pavement response and performance analysis.
Overall, the investigation of the interdependencies between HBEVs and infrastructure conditions can offer ideas for optimization techniques towards more sustainable freight operations. For example, since the analysis with the lower AC modulus appeared to be more conservative, routes involving full-cargo HBEVs could be preferentially scheduled for early morning or late evening hours, when ambient temperatures are lower and the asphalt modulus is higher. As a result, strains could be reduced, followed by a delay of the onset of fatigue damage and possible long-term pavement maintenance cost savings. Similar conclusions can be reached for HBEV route planning at secondary roadways, where bottom–up cracking potential is more pronounced because of the lower order of magnitude for the AC thickness that these pavements consist of.
6. Conclusions
Based on the results of the preliminary simulation experiment, the following conclusions can be drawn:
- The study demonstrates that battery placement and weight distribution in HDEVs significantly affect pavement fatigue performance. Concentrating the battery mass at the steering axle produced the most unfavorable outcome, with up to ~180–200% higher fatigue damage, while placement at the rear tractor axles with dual tires resulted in negligible differences compared to conventional trucks.
- Pavement response is sensitive not only to gross vehicle weight but also to axle load distribution and tire configuration. Critical influencing factors include asphalt concrete stiffness, which is temperature-dependent, pavement layer stratigraphy, and axle geometry.
- Concentrated battery loads over specific axles can accelerate bottom–up cracking. This highlights the importance of accounting for infrastructure impacts—both direct effects on traffic operations and safety [34] and, further, indirect implications for vehicle design and fleet logistics.
- While the analysis relied on multilayer elastic theory and a simplified dataset, the results provide preliminary but essential scientific evidence that battery placement is an infrastructure-relevant design variable for HDEVs.
In terms of this study’s innovation, this research moved beyond the technological improvements of HBEVs and enhanced the scientific understanding of pavement–vehicle interactions by establishing how variations in battery mass distribution in HBEVs alter stress–strain states within multilayer pavement systems. Unlike prior studies that primarily considered gross vehicle weight, this work integrated the theoretical importance of axle load distribution and material behavior in predicting fatigue damage. As such, this study contributed a framework that can be informative for both vehicle design optimization and pavement management strategies, bridging a critical scientific gap between transportation electrification and infrastructure sustainability.
Future research should integrate high-fidelity viscoelastic pavement models, field data from pilot sections loaded with HBEVs, and advanced simulation frameworks. Such efforts can bridge pavement material modeling with vehicle design strategies, ultimately guiding sustainable freight electrification, resilient road networks, and overall infrastructure-aware policy for safer urban and interurban roads.
Funding
This research received no external funding.
Data Availability Statement
The original contributions presented in this study are included in the article. Further inquiries can be directed to the corresponding author.
Conflicts of Interest
The author declares no conflicts of interest.
References
- Zhou, Q.; Ramakrishnan, A.; Fakhreddine, M.; Okte, E.; Al-Qadi, I.L. Impacts of heavy-duty electric trucks on flexible pavements. Int. J. Pavement Eng. 2024, 25, 2361087. [Google Scholar] [CrossRef]
- Fam, A.; Fam, S. Review of the US 2050 long term strategy to reach net zero carbon emissions. Energy Rep. 2024, 12, 845–860. [Google Scholar] [CrossRef]
- Yeo, Y.; Yoo, T.; Yoo, S.; Ahn, Y.-H. 2050 net-zero scenarios and well-to-wheel greenhouse gas emissions assessment of South Korea’s Road sector. J. Clean. Prod. 2025, 492, 114809. [Google Scholar] [CrossRef]
- Moultak, M.; Lutsey, N.; Hall, D. Transitioning to Zero-Emission Heavy-Duty Freight Vehicles; The International Council on Clean Transportation: Washington, DC, USA, 2017. [Google Scholar]
- Karlsson, J.; Grauers, A. Case Study of Cost-Effective Electrification of Long-Distance Line-Haul Trucks. Energies 2023, 16, 2793. [Google Scholar] [CrossRef]
- Zhang, W.; Han, W.; Jiang, W.; Cui, T.; Wang, S.; Yang, F.; Wei, J. Fatigue Damage in Asphalt Pavement Based on Axle Load Spectrum and Seasonal Temperature. Coatings 2024, 14, 882. [Google Scholar] [CrossRef]
- Maggiore, C.; Airey, G.; Marsac, P. A dissipated energy comparison to evaluate fatigue resistance using 2-point bending. J. Traffic Transp. Eng. (Engl. Ed.) 2014, 1, 49–54. [Google Scholar] [CrossRef][Green Version]
- Svilar, M.; Peško, I.; Šešlija, M. Model for Estimating the Modulus of Elasticity of Asphalt Layers Using Machine Learning. Appl. Sci. 2022, 12, 10536. [Google Scholar] [CrossRef]
- Marecos, V.; Solla, M.; Fontul, S.; Antunes, V. Assessing the pavement subgrade by combining different non-destructive methods. Constr. Build. Mater. 2017, 135, 76–85. [Google Scholar] [CrossRef]
- Chabot, A.; Chupin, O.; Deloffre, L.; Duhamel, D. ViscoRoute 2.0: A tool for the simulation of moving load effects on asphalt pavement. Road Mater. Pavement Des. 2010, 11, 227–250. [Google Scholar] [CrossRef]
- Loizos, A.; Spiliopoulos, K.; Cliatt, B.; Gkyrtis, K. Structural pavement responses using nonlinear finite element analysis of unbound materials. In Proceedings of the 10th International Conference on Bearing Capacity of Roads, Railways and Airfields (BCRRA), Athens, Greece, 28–30 June 2017; pp. 1343–1350. [Google Scholar]
- Li, Y.; Xuan, W.; Rahman, A.; Ding, H.; Yusupov, B. Effects of Geometry and Loading Mode on the Stress State in Asphalt Mixture Cracking Tests. Materials 2022, 15, 1559. [Google Scholar] [CrossRef] [PubMed]
- Wang, H.; Al-Qadi, I.L. Evaluation of Surface-Related Pavement Damage due to Tire Braking. Road Mater. Pavement Des. 2010, 11, 101–121. [Google Scholar] [CrossRef]
- Misaghi, S.; Tirado, C.; Nazarian, S.; Carasco, C. Impact of pavement roughness and suspension systems on vehicle dynamic loads on flexible pavements. Transp. Eng. 2021, 3, 100045. [Google Scholar] [CrossRef]
- Martinez-Boggio, S.; Monsalve-Serrano, J.; García, A.; Curto-Risso, P. High Degree of Electrification in Heavy-Duty Vehicles. Energies 2023, 16, 3565. [Google Scholar] [CrossRef]
- Hernandez, J.; Jayme, A.; Cardenas Huamam, J.J.; Al-Qadi, I.L. Effect of Heavy-Duty Electric Vehicles on Tire–Pavement Contact Forces. J. Eng. Mech. 2025, 151, 04024104. [Google Scholar] [CrossRef]
- Jayme, A.; Hernandez, J.; Al-Qadi, I.L.; Cardenas, J.J.; Hafeez, M.; Villamil, W. Impact of Heavy Commercial Electric Vehicles on Flexible Pavements; Report No. FHWA-ICT-25-003; Illinois Center for Transportation: Rantoul, IL, USA, 2025. [Google Scholar] [CrossRef]
- Previati, G.; Mastinu, G.; Gobbi, M. Mass, Centre of Gravity Location and Inertia Tensor of Electric Vehicles: Measured Data for Accurate Accident Reconstruction. World Electr. Veh. J. 2024, 15, 266. [Google Scholar] [CrossRef]
- Suriyamoorthy, S.; Gupta, S.; Kumar, D.P.; Subramanian, S.C. Analysis of hub motor configuration and battery placement on ride comfort of electric trucks. In Proceedings of the 2019 IEEE Vehicle Power and Propulsion Conference (VPPC), Hanoi, Vietnam, 14–17 October 2019; pp. 1–6. [Google Scholar] [CrossRef]
- Arora, S.; Abkenar, A.T.; Jayasinghe, S.G.; Tammi, K. Heavy-Duty Electric Vehicles, from Concept to Reality; Elsevier: Amsterdam, The Netherlands, 2021. [Google Scholar] [CrossRef]
- Siddhartan, R.; Krishnamenon, N.; Sebaaly, P. Pavement Response Evaluation Using Finite-Layer Approach. Transp. Res. Rec. 2000, 1709, 43–49. [Google Scholar] [CrossRef]
- NCHRP. Final Report: Guide for Mechanistic-Empirical Design of New and Rehabilitated Pavement Structures, NCHRP 1-37A Project; Transportation Research Board National Council: Washington, DC, USA, 2004. [Google Scholar]
- Gkyrtis, K. Pavement Analysis with the Consideration of Unbound Granular Material Nonlinearity. Designs 2023, 7, 142. [Google Scholar] [CrossRef]
- Powell, W.D.; Potter, J.F.; Mayhew, H.C.; Nunn, M.E. The Structural Design of Bituminous Roads; Transport and Road Research Laboratory (TRRL) Report 1115; TRRL: Berkshire, UK, 1984. [Google Scholar]
- Alnadish, A.M.; Aman, M.Y.; Katman, H.Y.B.; Ibrahim, M.R. Influence of the Long-Term Oven Aging on the Performance of the Reinforced Asphalt Mixtures. Coatings 2020, 10, 953. [Google Scholar] [CrossRef]
- Theyse, H.L.; De Beer, M.; Maina, J.W.; Kannemeyer, L. Interim revision of the south African mechanistic-empirical pavement design method for flexible pavements. In Proceedings of the 10th Conference on Asphalt Pavements for Southern Africa (CAPSA), KwaZulu-Natal, South Africa, 11–14 September 2011. [Google Scholar]
- Rahman, S.; Ahmed, A.; Erlingsson, S. Responses of a thin flexible pavement loaded with tires of various dimensions and configurations. Road Mater. Pavement Des. 2025, 26, 680–699. [Google Scholar] [CrossRef]
- Khan, S.; Cotter, C.; Sholar, G.A.; Tia, M. Comparison of wide base single tyre and dual tyre with different factors using heavy vehicle simulator. Road Mater. Pavement Des. 2024. [Google Scholar] [CrossRef]
- Gkyrtis, K.; Plati, C.; Loizos, A. Mechanistic Analysis of Asphalt Pavements in Support of Pavement Preservation Decision-Making. Infrastructures 2022, 7, 61. [Google Scholar] [CrossRef]
- Marecos, V.; Fontul, S.; Antunes, M.L.; Solla, M. Evaluation of a highway pavement using non-destructive tests: Falling Weight Deflectometer and Ground Penetrating Radar. Constr. Build. Mater. 2017, 154, 1164–1172. [Google Scholar] [CrossRef]
- Crook, A.L.; Montgomery, S.R.; Guthrie, W.S. Use of falling weight deflectometer data for network-level flexible pavement management. Transp. Res. Rec. 2012, 2304, 75–85. [Google Scholar] [CrossRef]
- Plati, C.; Gkyrtis, K.; Loizos, A. Integrating non-destructive testing data to produce asphalt pavement critical strains. Nondestruct. Test. Eval. 2021, 36, 546–570. [Google Scholar] [CrossRef]
- Gkyrtis, K.; Armeni, A.; Loizos, A. A mechanistic perspective for airfield pavements evaluation focusing on the asphalt layers’ behaviour. Int. J. Pavement Eng. 2022, 23, 5087–5100. [Google Scholar] [CrossRef]
- Gkyrtis, K.; Pomoni, M. Use of Historical Road Incident Data for the Assessment of Road Redesign Potential. Designs 2024, 8, 88. [Google Scholar] [CrossRef]
Disclaimer/Publisher’s Note: The statements, opinions and data contained in all publications are solely those of the individual author(s) and contributor(s) and not of MDPI and/or the editor(s). MDPI and/or the editor(s) disclaim responsibility for any injury to people or property resulting from any ideas, methods, instructions or products referred to in the content. |
© 2025 by the author. Published by MDPI on behalf of the World Electric Vehicle Association. Licensee MDPI, Basel, Switzerland. This article is an open access article distributed under the terms and conditions of the Creative Commons Attribution (CC BY) license (https://creativecommons.org/licenses/by/4.0/).