Abstract
The global electric vehicle (EV) market has experienced sustained growth over the last decade; however, adoption within the commercial EV segment remains comparatively sluggish. This disparity is driven by three primary factors: the intrinsic limitations of lithium-ion battery chemistry, which imposes constraints on charge–discharge cycling, excessive charging durations for large battery packs used in long-haul semi-trucks, and diminished charging effectiveness under cold weather conditions, which further extends downtime and increases grid demand. To address these operational and infrastructural challenges, this article proposes a novel battery swapping station layout with ‘design-integrated safety’ features, enabling rapid battery replacement while ensuring compliance with safety codes and standards. Two complementary pricing strategies are developed for deployment under differing market structures. The first is a Cournot competition, applicable to deregulated environments, where firms strategically allocate battery inventory between EV swapping services and participation in a secondary energy market. As an extension of the Cournot competition model, the profit functions are analytically derived for a duopoly in which one firm engages in dual markets, enabling assessment of equilibrium outcomes under competitive conditions. The second strategy is a degradation-sensitive pricing framework, intended for regulated markets, which dynamically adjusts swap prices based on state-of-charge depletion, duty cycle intensity, environmental exposure, and nonlinear battery degradation effects. This formulation is evaluated for six representative operational cases, demonstrating its ability to incentivize shallow cycling, penalize deep discharges, and incorporate fair usage-based pricing. The proposed architectures and pricing models offer a viable pathway to accelerate commercial EV adoption while optimizing asset utilization and profitability for station operators.
1. Introduction
Electric vehicle (EV) adoption has surged globally, with the trend becoming particularly pronounced in the post-COVID period [1]. This acceleration is driven by a combination of climate policies, technological advancements, and market incentives aimed at promoting low-emission transportation. Earlier work on the optimal spatial design of renewable-powered charging stations in dense urban environments [2] highlights infrastructure siting and cost-effectiveness as critical enablers of EV adoption. Analyzing current adoption trends, China continues to lead this transition, accounting for nearly 60 percent of global EV sales, with EVs comprising 22 percent of its domestic vehicle market. In Europe, countries such as Norway, Iceland, and Sweden are setting the pace, with EVs representing 80 percent, 41 percent, and 32 percent of new passenger vehicle sales, respectively [3]. Despite this strong momentum, adoption within the commercial EV segment, particularly for heavy-duty long-haul trucks and buses, has remained comparatively limited [4].
The relatively slow adoption of commercial electric vehicles (EVs) can be attributed to three primary factors. The first limitation stems from the intrinsic characteristics of lithium-ion battery chemistry. While lithium-ion batteries offer significantly higher energy density than older technologies such as nickel-metal hydride, their deployment in commercial EVs presents several operational challenges. These vehicles often require large battery capacities, typically ranging from 200 kWh to over 1 MWh in multi-pack configurations, leading to prolonged charging durations. In an effort to minimize downtime, operators frequently resort to charging at rates exceeding the recommended C-rates [5], which accelerates battery degradation and reduces the remaining useful life. The second limitation is the insufficient availability of commercial EV charging infrastructure. Although fast-charging stations have begun to appear along major highway corridors, widespread deployment in interior regions remains limited. This slower expansion is largely due to the need for proportional upgrades in local and regional power delivery infrastructure, including transformers, distribution feeders, and substations, to support high-power charging loads [6]. The third limitation is the reduced effectiveness of commercial EV charging under cold weather conditions. Low ambient temperatures negatively impact battery performance, lowering charge acceptance rates and reducing overall charging efficiency. As a result, charging sessions become significantly longer, and the vehicle may struggle to reach a full state of charge. These environmental constraints further compound the operational challenges faced by commercial EV fleets.
Commercial EV electrification remains a relatively niche segment within the broader electrification landscape yet holds significant potential as fleet operators increasingly pursue sustainable alternatives. While a natural adoption curve is expected, it is critical that supporting electrical infrastructure is developed with a focus on both infrastructure safety and operational practicality. Moreover, the pricing models adopted by commercial EV electrification stations must support long-term sustainability under both regulated and market-driven conditions. With this background in place, the following section outlines key research gaps that motivate this manuscript.
1.1. Research Gap and Literature Review
This section reviews the relevant literature in four subsections and identifies the research gap this manuscript addresses.
1.1.1. Cold Weather Charging Inefficiency with Open-Air Charging
A majority of existing commercial EV charging stations are designed as open-air installations, leaving them exposed to environmental elements, particularly cold weather. In a pioneering study [7], the author estimated that in the United Kingdom alone, approximately 450 MW of additional generation capacity would be required to offset the efficiency losses and increased energy demand associated with cold weather charging of 11 million vehicles. While this research provides critical insights, similar assessments have not yet been conducted for Europe and China, regions that lead the global adoption of commercial EVs.
Research gap addressed—Given their dominant role in fleet electrification, it is essential to evaluate the grid-level impacts of open-air charging infrastructure under cold climate conditions. Without such assessments for geographical areas such as Europe and China, widespread deployment of these stations could introduce unanticipated stresses on electric grids during severe weather events. The manuscript provides such an assessment.
1.1.2. Critical Comparison of EV Charging Versus EV Swapping
In addition to grid-level impact assessment of open-air charging, some papers in the literature [8,9], have performed comparative analysis of electric vehicle battery swapping and charging stations, but the comparison remains limited for a number of reasons. For instance, in [8], the authors utilized a Monte Carlo simulation framework to evaluate the service capacity and profitability of EV charging stations and battery swapping stations, focusing on taxis and buses. It demonstrates that battery swapping can offer higher service throughput and operator profits compared to traditional charging, particularly for high-utilization fleets. However, the study does not account for the opportunity cost associated with commercial vehicle downtime during charging, which is a critical factor for heavy-duty commercial EVs such as long-haul trucks and intercity buses. In [9], the authors presented a formulation to maximize the net present value (NPV) based on life cycle cost assessment so as to optimize the economic benefit from charging/swap station operations. The life cycle cost takes into account the investment cost, the operation cost, the maintenance cost, the aging, and the damage cost components; and the results were presented as a cost and benefits comparison between three optimal plans under different uncertainty conditions. The limitation of this study is in the fact that a direct net present value comparison between EV charging and EV swapping was absent.
Research gap addressed—The existing gaps highlighted in Section 1.1.2 demonstrates the need for future research that explicitly quantifies the economic and operational trade-offs of charging delays in commercial EV charging versus swapping. To this end, a long-term net present value (NPV) analysis can help fleet operators assess the NPV spread between swapping and charging, offering insights into the most economically sustainable infrastructure choice for commercial deployment. Such a long-term net present value (NPV) analysis is presented in the manuscript.
1.1.3. Detailed Layout Design of EV Swapping Station
In the area of commercial EV swapping layout design, the existing literature is very limited [10,11]. The layout proposed by the authors generally consists of a closed battery swapping building with charging equipment and charging racks and swapping aisles. In a traditional battery swapping facility, the Li-ion batteries are housed in an open form racking arrangement, which poses an unmanaged thermal runaway risk. The thermal runaway risk for open rack battery swapping is similar to what the industry has witnessed with BESS failures in South Korea and in Surprise, Arizona, in the United States [12].
To understand the issue of thermal runaway, it is important to understand that the construction of Li-ion batteries are made of four components: positive and negative electrodes, a liquid electrolyte, and a microporous separator. As the battery gets closer to the end of its remaining useful life, the vulnerability of thermal and electrical stress on the liquid electrolyte, which consists of cyclic carbonates, lithium salts, and additives increases. These linear carbonate solvents are highly flammable, with flash points below 0 °F (−17.78 °C) [13], and can initiate thermal runaway, especially under high-cycle operation with insufficient thermal management [14,15]. Alternatives have been investigated, including ionic liquids and fluorinated solvents [16], flame-retardant additives [17], and solid electrolytes based on polymers with organic or inorganic salts [18,19]. Widespread adoption is limited by trade-offs in cost, electrochemical performance, and scalability, so carbonate-based electrolytes remain prevalent in commercial systems. Once started, thermal runaway is self-sustaining and typically continues until reactive components are exhausted, making rack-based battery storage vulnerable to fire.
In addition to the fire risk problem with rack-based battery storage, the entire swapping station (building) has to be thermally controlled with HVAC systems to ensure batteries and power converters are at their ambient temperature; thus, causing higher energy usage.
Research gap addressed—There are improvements from design safety and efficiency standpoint that can be made to these rack-based battery storage configurations, as will be discussed in this manuscript. A first-of-a-kind layout of a containerized battery storage solution with integrated deflagration panels and ductwork is proposed in the manuscript.
1.1.4. Limitations on Existing EV Swapping Pricing Mechanisms
With the limitations in current commercial EV swapping layout design being discussed in Section 1.1.3, the focus will now be shifted to existing swapping pricing mechanisms. It should be noted that the idea of EV battery swapping was first developed in 2007, but it witnessed limited adoption, and the initial failure was attributed to a very low number of EVs making these swapping stations not financially viable [20]. However, with post-2025 commercial EV adoption projects in place, it is important that the pricing models are conducive for both the market and the charging/swapping station operators.
In [21], the authors made a commendable effort on modeling an optimization pricing formulation for heavy-duty EV swapping and discussed the use of Shapley value for fair profit allocation among distributed participants in EV charging and energy sharing networks. While the Shapley value is mathematically elegant and ensures fairness based on each participant’s marginal contribution, it poses significant limitations in real-world commercial EV charging contexts. First, its effectiveness relies heavily on cooperation and full transparency among participating entities, which is often impractical when the network consists of multiple independent firms with proprietary data and competitive interests. Second, when charging stations are geographically dispersed, a common feature in commercial EV infrastructure, coordinating joint operations or shared profit distribution becomes logistically challenging and economically inefficient. Additionally, calculating the Shapley value requires evaluating all possible coalitions, which becomes computationally intensive as the number of participants grows, making it unsuitable for large-scale, dynamic EV charging networks. These limitations reduce the practical applicability of Shapley value-based methods for commercial EV charging ecosystems where autonomy, scalability, and decentralized decision-making are critical.
In another recent publication [22], the authors applied a cooperative Stackelberg game to model interactions between EV aggregators and charging stations, assuming a clear leader–follower dynamic. However, such a framework has limitations when applied to the EV battery swapping market. In practice, swapping stations often operate independently and make strategic decisions simultaneously, rather than in a hierarchical or sequential manner. As such, the EV swapping market is more appropriately modeled as a simultaneous-move game, where firms compete in parallel on price or quantity. The Stackelberg assumption of one agent unilaterally leading and others optimally responding may not reflect the decentralized and competitive nature of real-world battery swapping operations. No papers are found in the literature that addresses the limitation on well-rounded and practical EV swapping pricing models.
Research gap addressed—In the commercial EV arena, profit allocation based on Shapley value and Stackelberg game theory-based market setup has their limitations. To address both of these limitations, as outlined in the preceding section, we present the following two alternative pricing models:
- A Cournot oligopoly model for a deregulated free market,
- A usage and degradation-sensitive battery pricing model for regulated markets.
Table 1 provides a visual summary of the literature review provided from Section 1.1.1–1.1.4.

Table 1.
Summary of the literature reviewed in Section 1.1.1, Section 1.1.2, Section 1.1.3 and Section 1.1.4, comparing existing literature work versus the manuscript contributions.
1.2. Manuscript Contributions and Structure
With the current research gaps identified through a detailed literature review in the preceding section, the focus is now shifted into the details of the main contributions of this article, which are as follows:
- The manuscript develops Monte Carlo simulation models to assess additional generation capacity that would be required to offset the efficiency losses and increased energy demand associated with cold weather, with traditional open-air commercial EV charging infrastructure. Europe in its entirety and China are considered, given these two geographical regions have and shall witness the highest rates of commercial EV adoption. Results are interpreted for the year 2024 and for the projected year of 2030.
- The manuscript presents an economic comparison between commercial charging and swapping scenarios in terms of net present value (NPV) savings, with fewer sets of parameters. The NPV savings analysis is extended to witness the effect of different EV battery sizes and varying off-peak energy price for EV swapping. Contributions 1 and 2 in conjunction would allow EV electrification developers and grid operators to holistically assess the choice between EV charging and EV battery swapping.
- A novel ‘design-integrated safety’ dual pack commercial EV charging station is proposed, with a detailed layout of the component equipment. This novel architecture allows for storing a higher density of energy in a smaller containerized-based controlled environment, thereby allowing for better management of ambient working temperatures, and allowing safer discharge of gases in case of a battery thermal runaway.
- Under a deregulated market operation, a Cournot oligopoly pricing model is proposed for battery swapping stations, with competing firms participating in a symmetrical and asymmetrical manner. The firm choosing asymmetrical participation (dual-market participation) is particularly interesting given the dual-market participation allows the firm to yield higher market power and better maximize its profitability.
- Under regulated market operation, a multi-component pricing model is proposed for battery swapping stations. In addition to the SOC sensitive base pricing, the multi-component pricing model incorporates duty sensitive, ambient temperature exposure, and degradation-based surcharges to ensure a holistic and fair pricing model. The proposed pricing model is tested under six diverse operating conditions to ensure wide adaptability.
The remainder of the manuscript is organized as follows:
Section 2 introduces the impacts and underlying vulnerability of cold weather on commercial open-air EV charging and presents cases from Europe and China. Economic comparison between commercial charging and swapping scenarios are available in this section. A detailed layout of the novel ‘design-integrated safety’ swapping architecture is further made available for wide industrial and academic implementation.
Section 3 outlines the mechanics of Cournot oligopoly model with symmetrical and asymmetrical (dual-market) participation. Focus is laid on firms engaging in asymmetrical (dual-market) participation due to higher market power and profitability, and the concept is reinforced with a case study from the state of Texas in the United States.
Section 4 outlines the mechanics of a multi-component pricing model in a regulated EV commercial market setup and reinforces the adaptability of the pricing model to various test scenarios.
Section 5 concludes the paper by integrating these insights into a cohesive roadmap for enhancement of future commercial EV electrification and adaptability.
2. Wider Adoption and Sustenance of Battery Swapping Ecosystems—Why Swapping Station Architecture Matters
This section critically analyzes battery swapping versus charging infrastructures at a commercial scale, demonstrating that battery swapping offers a more suitable solution for large-scale EV deployment, particularly as commercial EVs require significantly larger battery packs that are time-consuming to charge through traditional means. The analysis highlights how swapping can reduce charging inefficiency in open-air charging environments, reduce downtime, and enhance operational efficiency/profitability for fleet-based applications. Additionally, this section presents a detailed comparison of conventional charging and battery swapping station architectures alongside a novel ‘design-integrated safety’ swapping architecture, which integrates safety, modularity, and scalability to better support the future expansion of commercial EV infrastructure.
2.1. Impacts and Underlying Vulnerability of Cold Weather on Commercial Open-Air EV Charging Stations—The Case of China and Europe
The deployment of open-air commercial EV charging stations, which is currently the prevalent charging architecture for heavy-duty vehicles such as long-haul semi-trucks, faces critical limitations in cold weather environments, as shall be explored in this section. Charging efficiency declines substantially at low ambient temperatures due to several thermophysical and electrochemical factors, as outlined here below:
- The internal resistance of lithium-ion batteries increases in cold conditions, leading to reduced charge acceptance and higher conversion losses. Experimental findings [23,24] reveal that a drop in temperature from 113 °F (45 °C) to 10 °F (−12.2 °C) can elevate a battery’s internal resistance by as much as five times its nominal value.
- Battery management systems (BMSs) often throttle charging power [25] to prevent lithium plating, a condition that can permanently damage the battery during rapid charging at low temperatures.
- The thermal energy required to pre-condition or heat the battery pack before or during charging imposes an additional load on the grid and the vehicle’s onboard energy systems. At extremely low temperatures, typically −10 °F (−23 °C) and below, as encountered during arctic climates or severe winter storms, EV batteries frequently struggle to reach a full 100% state of charge (SoC) [26]. In many cases, the battery stalls at a partial SoC despite prolonged charging durations, further reducing the effective range of the vehicle. This undercharging condition is particularly detrimental for long-haul operations where range reliability is critical.
To compensate for these cold-induced inefficiencies, significantly more energy must be drawn from the electric grid to maintain vehicle readiness and battery health. However, during cold spells, grid demand often peaks due to concurrent heating loads from residential, commercial, and industrial users. As a result, open-air charging of large commercial EVs under such conditions exacerbates grid stress, potentially affecting overall power system reliability and requiring grid operators to prioritize loads or curtail less critical demand. To quantify the impact of such cold weather snaps on charging demand for large-scale commercial EV fleets, several Monte Carlo simulations were conducted for Europe and China.
Monte Carlo Simulation Framework—The details of the Monte Carlo simulation is detailed in the next few subsections.
Input parameter and distribution: A Monte Carlo simulation was developed to estimate the aggregate energy demand of commercial electric vehicle (EV) fleets under varying cold weather conditions in Europe and China. These two geographical regions represent the highest levels of heavy-duty commercial EV adoption globally [27] and were hence adopted for this study. The simulation used statistical sampling of key system parameters to estimate the aggregate EV load profile across varying ambient temperatures. Important input variables included battery pack configurations, charger types, driving patterns, trip lengths and frequency, ambient temperature, and the distribution of initial and final state-of-charge (SoC) levels; the full list of parameters, along with their types and data sources, is provided in Table 2.
Table 2.
Input parameters for Monte Carlo simulation of commercial EV charging demand estimation in cold weather.
For these aforementioned simulations, the European fleet was sized to consist of 12,000 commercial EVs, while the Chinese fleet included 76,000 commercial EVs. In conjunction, the total available battery capacity was set to 2.4 GWh for Europe and 20 GWh for China, based on 2024 data from the International Energy Agency’s Global EV Data Explorer [27], as documented in Table 3. Cold weather effects were modeled as stochastic charging efficiency losses, ranging from 0 to 15 percent for average cold conditions (25.9 °F or −3.38 °C) and from 10 to 35 percent for severe cold conditions (−10 °F or −23.34 °C). Operational constraints were included by enforcing a minimum SoC of 40 percent, thereby capping the daily usable battery energy to 60 percent of the total capacity.
Table 3.
Current and projected 2030 growth and cumulative GWh load for commercial long-haul EVs for Europe and China [27].
Convergence diagnostic: To ensure statistical reliability, convergence was evaluated using the following strategies:
- Confidence interval narrowing: The 95% confidence interval width for the estimated mean energy demand stabilized to less than 2.5% of the mean in the final 10% of iterations.
- Variance analysis: Variance reduction was confirmed across batched iterations (e.g., 10 bins of 1000 iterations each), with diminishing returns on total variance observed after 7000 iterations.
Validation strategy: To validate the model and ensure that input assumptions produced plausible outputs, the following validation strategy was adopted:
- Extreme condition sanity checks: Under severe cold assumptions, the increased energy demand and reduced charge acceptance were benchmarked against published cold weather battery degradation and efficiency studies from NREL [28].
- Scenario range sensitivity: Simulations were repeated with alternate efficiency loss ranges (e.g., 5–25% for avg. cold) to test model sensitivity. Output trends remained monotonic, and percentage increases were consistent within ±3%.
Results and interpretation: Over 10,000 simulation iterations, the mean daily energy demand for the European fleet increased from approximately 519 MWh under average cold conditions to 644 MWh under severe cold, representing an estimated 24 percent rise in energy consumption, see Figure 1a. For the Chinese region, the mean daily fleet energy demand increased from approximately 3293 MWh under average cold conditions to 3695 MWh under severe cold. This corresponds to an approximate 12 percent rise in energy consumption, see Figure 1b. These findings underscore the added strain on power systems during cold weather events when large commercial EVs rely on open-air charging infrastructure.
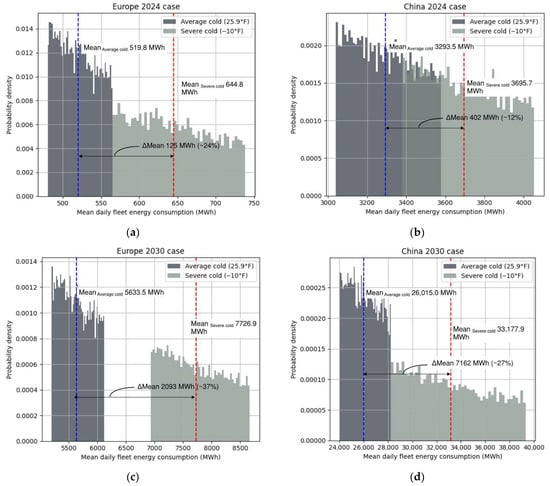
Figure 1.
Distribution based on Monte Carlo simulation of mean daily fleet energy consumption for commercial EVs in cold conditions: average cold versus severe cold conditions. (a) Europe 2024 case; (b) China 2024 case; (c) Europe 2030 case; (d) China 2030 case. The mean spread of daily fleet energy consumption between average and severe cold cases ranges between 12 and 37%.
Using projected adoption data from the International Energy Agency’s Global EV Data Explorer [27] (also documented in Table 3), a second set of Monte Carlo simulations was conducted to evaluate future energy demand for the year 2030. The simulations accounted for the anticipated increase in the number of heavy-duty commercial EVs in both Europe and China. For the European region, the mean daily energy demand increased from approximately 5633 MWh under average cold conditions to 7726 MWh during severe cold, representing a 37 percent increase, see Figure 1c. In the Chinese region, daily energy demand rose from approximately 26,015 MWh under average cold conditions to 33,177 MWh under severe cold, reflecting a 27 percent increase, see Figure 1d.
The 2030 projections are concerning, particularly Figure 1d with a mean daily fleet energy consumption delta of 7162 MWh, and highlight a significant vulnerability in future grid planning. If open-air commercial EV charging remains the default configuration, both the European and Chinese regional grids are likely to face substantial stress during cold weather events, with a mean spread of daily fleet energy consumption between average and severe cold conditions ranging between 12 and 37%. The compounding effects of temperature-induced efficiency losses, high concurrent heating demand, and large-scale EV fleet charging may drive the grid toward instability. In worst-case scenarios, such stress could result in localized or widespread blackouts. These findings emphasize the urgent need to reevaluate charging infrastructure design and grid preparedness strategies in anticipation of the 2030 commercial EV deployment targets.
2.2. Economic Comparison Between Commercial Charging and Swapping Scenarios—A Clear Winner Emerges
In this demonstrative comparison, the total annual cost for both charging and battery swapping strategies is formulated by accounting for two primary components: energy cost and lost opportunity cost due to vehicle downtime. For the charging case, in addition to the energy cost (EC) and lost opportunity cost (LOC), the annual cost () is formulated as a function of a nonlinear escalation factor, , that captures the increasing impact of battery thermal management systems (BTMSs) energy use and charging inefficiencies for larger batteries, with being an adjustable curvature coefficient. Thus, the total annual cost for commercial EV charging becomes, as shown in Equation (1):
where is the number of charging events per day.
In contrast, the battery swapping case assumes minimal vehicle downtime and the annual cost () can be formulated as shown in Equation (2) with a much smaller .
2.2.1. Numerical Result—Baseline Example Calculation
A baseline example calculation is outlined to compare the total cost of ownership for an EV semi-truck under conventional charging versus battery swapping. In the charging scenario, the vehicle operates with two battery packs totaling Assuming a charging duration of h, an hourly revenue loss of , and an electricity retail price, , the daily cost comprises both lost opportunity and energy expenses: This equates to an annual cost of USD 164,250, assuming 1 charging event per day. Discounted over a 10-year period at a rate of 5%, the net present value (NPV) of the charging cost amounts to approximately USD 1.27 million, as per Equation (3).
With discount rate (r) = 5%, discount timeframe (L) = 10 years.
In contrast, the battery swapping scenario minimizes vehicle downtime by enabling rapid battery exchange. With a swap duration of only h and a lower effective energy price of , reflecting the swap station’s ability to charge during off-peak grid conditions, the daily cost is significantly reduced: This results in an annual cost of USD 57,670, and the 10-year discounted NPV is approximately USD 445,000.
The comparative analysis demonstrates a compelling cost advantage for battery swapping. With an NPV of USD 1.27 million for charging and USD 445,000 for swapping, the lifetime savings per vehicle from adopting battery swapping is approximately USD 825,000. This example highlights the economic benefits of swapping for high-utilization EV fleets, driven by both reduced opportunity cost and strategic energy arbitrage. For this baseline example, the nonlinear escalation factor, , is considered to be zero, with the reference energy size , reflecting the assumption that the charging station infrastructure is adequately sized to handle batteries up to this capacity without additional inefficiencies. A battery size exceeding 1 MWh would incur a nonzero nonlinear escalation factor due to increased thermal management and charging losses.
2.2.2. Sensitivity Analysis—Battery Size and NPV Savings
In addition to the baseline calculation, a sensitivity analysis was conducted to evaluate how the net present value (NPV) of total cost varies for both charging and swapping strategies across a range of consolidated vehicular battery sizes, from 0.5 MWh to 1.5 MWh. The results of this analysis are presented in Figure 2a, with the sensitivity trends revealing a consistent cost spread (±USD 825,000 from Section 2.2.1 baseline) between the two strategies, with battery swapping maintaining a lower NPV across all battery sizes. Notably, this spread, which represents the NPV savings, becomes more pronounced for battery capacities of 1 MWh and above. This behavior is attributed to the nonlinear escalation factor driving the increasing opportunity cost and thermal management inefficiencies associated with larger battery packs during charging, which are largely mitigated in the swapping model. Consequently, the analysis reinforces the economic advantage of battery swapping, particularly for high-capacity commercial EV platforms.
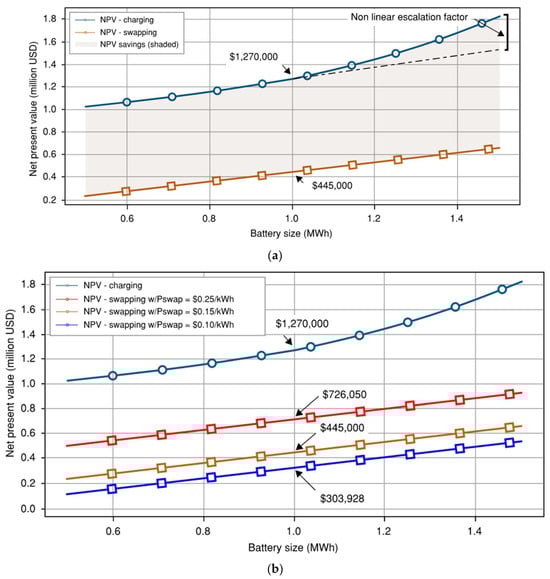
Figure 2.
Results of NPV analysis. (a) Sensitivity analysis comparing conventional charging versus battery swapping for electric semi-trucks over a 10-year lifetime. The shaded region represents the NPV savings enabled by battery swapping, which grows with increasing battery capacity due to higher idle cost avoidance and energy arbitrage benefits. (b) The effect of off-peak electricity price variation on NPV savings.
A second set of NPV analysis was conducted, to capture the effect of off-peak electricity price variation on NPV savings. Recall that in our prior analysis, the charging station was able to tap energy price at a retail rate, , whereas the battery swapping station had the ability to charge during off-peak grid conditions, with . Figure 2b shows the effect of variation of on NPV saving, highlighting the fact that with a wider spread between and , the NPV savings are amplified. The key takeaways here are the following:
- Battery swapping stations having access to lower off-peak energy rates will result in greater NPV savings.
- Even if , as seen in Figure 2b (plotted in red ink), there is still a resulting NPV saving, due to the lower lost opportunity cost related to battery swapping.
2.3. Traditional Charging and Swapping Station Architectures Versus Novel ‘Design-Integrated Safety’ Swapping Architecture
Stationary commercial EV chargers connected by wires are the prevailing technology and are typically categorized based on their intended use: overnight charging (up to 100 kW), opportunity fast charging (300 kW), and ultra-fast charging (1 MW and higher). The majority of these stationary chargers feature an open-air design, see Figure 3a. However, a challenge arises with fast charging (300 kW) and ultra-fast charging (1 MW and above) for large commercial electric vehicles due to the significant energy demand when charging 10 or more vehicles simultaneously. This high demand factor usually necessitates upgrades to substation, transmission, and distribution infrastructure, as the demand cannot be staggered in real time, thus constraining scalability. Other limitations of the open air stationary commercial EV chargers are the following:
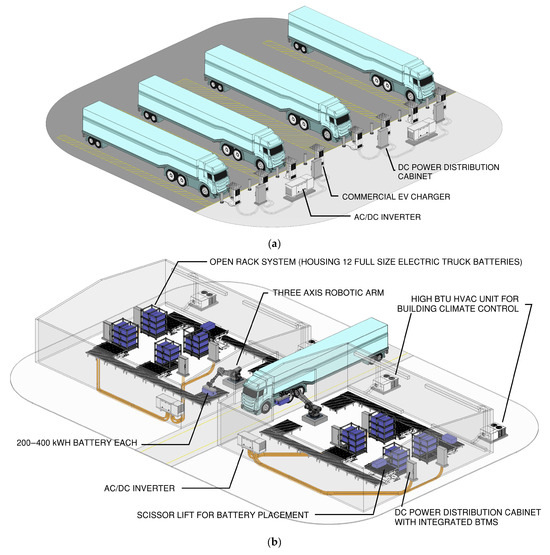
Figure 3.
Traditional commercial EV electrification infrastructure layout: (a) open-air commercial EV charging station; (b) rack-based swapping station architectures. Roof structure excluded to enhance visibility of internal components.
- Rigid charging schedule—Charging schedules in a traditional charging depot cannot be aligned with electricity price signals, as charging of the EVs have to be done in real time.
- Cold weather performance issues—Cold weather performance issues are well known with open-air charging, and extremely low ambient temperatures cause excessive current total harmonic distortion and power factor degradation.
With limitations of stationary commercial EV chargers, as discussed, battery swapping stations are emerging as an alternative, with China, Japan, and South Korea leading the technological advancement. Given the ownership of the battery pack remains with the owner of the swapping station, the EV vehicle owner does not have to pay for the full price of the battery upfront, which makes these swappable commercial EVs cheaper. In addition, other distinct benefits are the following:
- Rapid turnaround time: Battery swapping takes only a few minutes, typically under 5 min, compared to 30–90 min required for DC fast charging or several hours for conventional Level 2 charging, significantly reducing vehicle downtime and improving fleet utilization.
- Enhanced battery longevity: Since batteries in a swapping station can be charged gradually under thermally controlled conditions, their state of health (SoH) is better preserved. For instance, charging at slower rates (C/2 or lower) and maintaining temperatures between 68 and 77 °F (20 and 25 °C) can extend battery cycle life by over 30% compared to uncontrolled fast charging in harsh ambient conditions.
- Time-of-use optimization: Charging schedules within a swapping station can be aligned with electricity price signals, enabling batteries to be charged during off-peak hours when electricity costs are lower—reducing overall energy expenses for fleet operators.
- Environment control: The battery racks and chargers/inverters remain in a temperature control environment, thus preserving efficiency and being less susceptible to ambient temperature-related performance degradations.
However, with dense energies being stores in these batteries, each with a capacity of 200–400 kWh, typical racking solutions, with each rack containing 10–12 batteries (see Figure 3b), poses an overall high fire hazard risk in case of a battery thermal runaway event. The risk of a Lithium-ion battery going into thermal runaway increases as the battery’s remaining useful life degrades, with reported peak flame temperatures as high as 1787 °F (975 °C) [29].
With the limitation of the racking configurations for battery swapping stations, as outlined in the previous section, a first of a kind ‘design-integrated safety’ architecture is proposed as a suitable alternative, see Figure 4. The proposed configuration mitigates the fire hazard associated with Li-ion batteries by housing the battery racks within ISO containers equipped with top-mounted deflagration panels, in full compliance with NFPA 68 standards for deflagration venting, with exhaust ductworks channeling the exhaust gases outside the building. This containment approach is especially vital when battery swapping infrastructure is collocated with critical assets such as airports, enabling localized fault isolation and minimizing the potential for catastrophic damage. In addition to the safety aspect, the containerized charging solution proposed in this manuscript provides the added benefit of independent and more precise temperature control of these batteries, thereby allowing the temperature of the facility to be a few degrees lower (or higher) than that of the batteries within the containers, if needed, resulting in potential cost savings and smaller HVAC sizing.
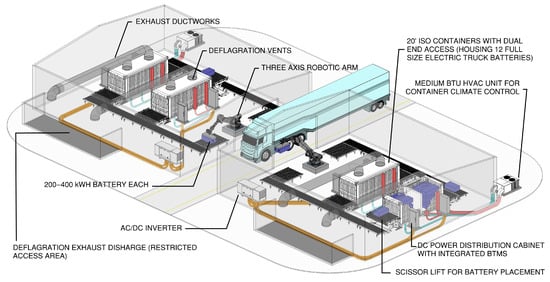
Figure 4.
Enclosed commercial EV battery swapping station layout: novel containerized-based design with deflagration panel for hot gas exhaust venting (‘design-integrated safety’). Roof structure has been excluded to enhance visibility of internal components.
3. Cournot Oligopoly Model with Symmetrical and Asymmetrical (Dual-Market) Participation
With swappable commercial EVs deemed favorable over charging-based solutions, the focus is now shifted to the pricing mechanism for commercial EV battery swapping. There exist various oligopoly models that differ based on whether firms make decisions simultaneously or sequentially. In simultaneous-move models such as Cournot or Bertrand, firms choose quantities or prices at the same time, while in sequential-move models like Stackelberg, firms act in a leader–follower structure. A comprehensive summary of the different game strategies is documented in Table 4. For commercial EV battery swapping, the high capital requirements for setting up automated swapping stations, battery storage systems, and power delivery infrastructure present significant entry barriers. Consequently, only a small number of firms are likely to participate in this market, forming an oligopoly where each firm strategically controls the quantity of swappable batteries offered. In this setting, Cournot competition is an appropriate framework, as firms compete by choosing battery quantities simultaneously, and market equilibrium is achieved through the resulting aggregate supply and price adjustments.
Table 4.
Summary of oligopoly models by move timing and strategic variables, with corresponding solution methods.
Cournot competition, commonly used to model large corporate firms like Pepsi and Coca-Cola, provides a market where a few players compete by choosing quantities rather than prices. Given the high infrastructure costs of EV battery swapping, only a limited number of firms are likely to operate, leading to similar oligopolistic dynamics. In this oligopolistic setting, each firm independently and simultaneously determines its production quantity (that is, the number of batteries offered), without cooperation or prior knowledge of rivals’ strategies. The market price is subsequently determined to clear the market based on the aggregate output. Since price is a function of total market supply, and supply depends on strategic decisions made by all firms, each firm maximizes its own profit by forming expectations about competitors’ output decisions. This interdependence captures the strategic nature of quantity competition under Cournot equilibrium.
3.1. Cournot Duopoly with Symmetric Market Participation
In the context of battery swapping, the Cournot oligopoly model exhibits distinct structural nuances due to the capital-intensive nature of the market and the dual revenue opportunities available to firms. To analytically capture these dynamics, the problem can be simplified to a duopoly framework, with the profit function becoming as shown in Equation (4). The firm’s total profit is based on price per battery swap service, , with the price per battery swap service being a function of the firm’s available swappable battery quantities, , and the competitor’s total supply, . The marginal cost of swapping (charging, labor, wear and tear) is assumed to be . represents the total number of swappable EV batteries available to the firm.
Assuming linear inverse demand, with and being the coefficients for the linear expression based on market research, the market demand function becomes as shown in Equation (5). The profit function from Equation (4) may be transformed as shown in Equation (6).
Equation (6) is a quadratic concave function in and can be optimized analytically or numerically. To maximize profit, with respect to and set it to 0, Equation (7), and solve simultaneously for both firm’s decision quantities.
3.2. Cournot Duopoly with Asymmetric Dual-Market Participation
In this second formulation, one firm participates in both the commercial battery swapping market and the energy market leveraging its remaining battery inventory to the electric grid as a secondary revenue stream. The second firm, by contrast, engages solely in the battery swapping market. This asymmetric market participation introduces interdependent strategic behavior, where each firm optimizes its output to maximize profit based on expectations of its rival’s actions, under the standard Cournot assumption of simultaneous, non-collaborative decision-making. The resulting equilibrium reflects both competition in the core service market and the influence of ancillary grid-based energy transactions. For the asymmetric dual-market participation case, represents the price per unit of energy sold to the grid modeled as a function of , with representing the number of batteries diverted for grid participation. represents the marginal cost of grid discharge mainly attributed to degradation and delivery cost.
The profit function becomes as represented in Equation (8):
Substituting : Equation (8) becomes:
Assuming linear inverse demand based on market research, the market demand function becomes, as shown in Equation (10), and grid price decreases linearly with available battery quantity, as shown in Equation (11); the profit function from Equation (9) may be transformed as shown in Equation (12).
Equation (12) is a quadratic concave function in and can be optimized analytically or numerically. To maximize profit, with respect to and set it to 0, Equation (13), and solve simultaneously for both firm’s decision quantities.
To analyze the strategic impact of dual-market participation in a Cournot-type oligopoly, we developed a numerical test bed that simulates firm behavior under the two scenarios. The equations for the Cournot model were solved numerically (iteratively) rather than relying on a closed-form analytical solution, with the KKT conditions outlined in the Appendix A section for general reference. In the first case, both firms engage solely in battery swapping and compete by simultaneously selecting the number of battery swaps to offer, with the market price adjusting linearly based on total quantity. In the second case, Firm 1 participates in both the swapping and grid power sale markets, choosing how to allocate its finite battery inventory between the two. Firm 2 remains a pure swap market competitor. Profits were computed by evaluating each firm’s revenue, based on market-clearing prices, and subtracting corresponding marginal costs. A numerical optimization routine was employed to identify Firm 1′s optimal battery allocation in the dual-market case, considering Firm 2′s best response. Results were plotted as profit contours, Figure 5a,b, based on symmetrical or asymmetrical market competition. From the two profit-contour plots, the following inference were drawn:
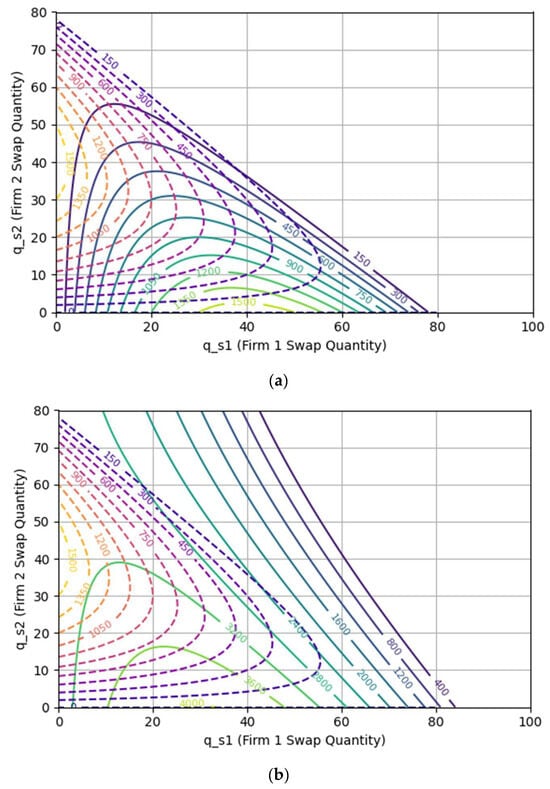
Figure 5.
Profit contours (in US dollars) under Cournot duopoly as a function of battery swap quantities: (a) symmetrical market participation with both firms having comparable market power; (b) steeper profit contour for Firm 1 participating in dual markets.
- In the pure Cournot case, Figure 5a, both firms converge on symmetric strategies. Firm 1′s best response to any given is where it reaches highest isoprofit contour. The figure reveals an important characteristic of the model: for a fixed output of Firm 1, Firm 1′s profit increases as Firm 2 lowers its output.
- Firm 1 consistently achieves higher profit in the asymmetrical (dual-market) case due to its ability to arbitrage between swapping and grid sale revenues, Figure 5b. The steeper profit contour lines of Firm 1 indicate that it can withhold a portion of the batteries available in the swapping market and leverage the same by back feeding into the grid.
- Firm 2′s profit may increase or decrease depending on how Firm 1 reallocates its inventory, and the resulting impact on swapping market prices.
- Grid participation enables better utilization of surplus capacity, improving system-level efficiency while boosting profitability for the flexible firm.
3.3. Secondary Revenue Stream Strengthening Firm 1—A Highlight from the State of Texas in the United States
It is worth exploring the mechanics of how Firm 1′s grid participation and secondary revenue stream from the energy market is strengthened, based on its relative location to major highway systems and the daily locational marginal price swing. As a use case, in a commercial battery swapping station capable of concurrently charging 36 batteries (each 400 kWh, as typical for electric bus fleets), diverting just 25% of the fleet (9 batteries or 3600 kWh/day) to off-peak locational marginal price (LMP) can yield significant annual revenue. With the average LMP rate of Texas at approximately 23.13 ¢/kWh, and assuming an LMP spread of 10 ¢/kWh (i.e., off-peak at ~13.13 ¢/kWh versus average 23.13 ¢), the firm participating in dual markets can charge at a lower rate and sell the power back to the grid, taking advantage of the LMP spread, with a revenue margin that is about USD 360, translating to around USD 131,400 in annual revenue. Factoring in higher LMP spread, as commonly seen in West Texas, practical gross revenue could realistically range between USD 150,000 and USD 300,000 per year/400 kWh battery. These findings underline the economic benefits of integrating dynamic load management and LMP spread into high-capacity commercial EV charging operations based on battery swapping.
By analyzing the spread in daily nodal pricing in a given region, the EV swapping companies can potentially access an additional revenue stream. It is essential to consider a location-based strategy that enables maximizing this revenue stream. As an example, in the state of Texas in the United States, the area with the highest grid congestion is generally considered to be West Texas and the Pan Handle area [30,31]. This is primarily due to the concentration of wind farms in that region, see Figure 6, and the limited transmission capacity to carry that power to major demand centers in other parts of the state. Congestion can lead to higher prices for electricity, especially in areas with high demand. It also increases the risk of curtailment (limiting power generation) for renewable energy sources like wind and solar. Battery swapping plants located along interstate and state highways and qualified to participate in energy storage and grid backfeed can utilize the lower-than-average nodal prices with high percentage of generation from wind energy, energy which otherwise will be curtailed, to maximize their revenue stream.
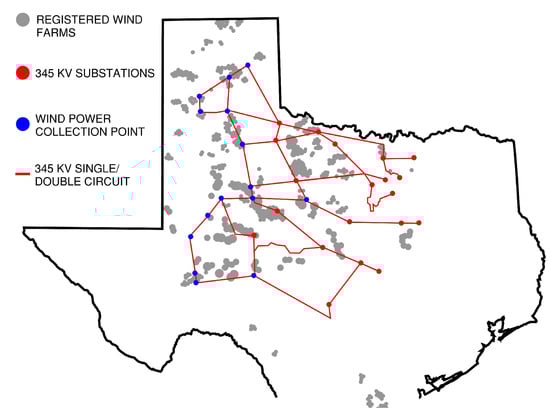
Figure 6.
The Competitive Renewable Energy Zones (CREZ) in the state of Texas in the United States with limited 345 kV EHV transmission capacity to major load centers can serve as ideal locations for battery swapping stations with dual-market participation.
4. Regulated Pricing Model Based on Actual Usage, Load Duty, and Operational Stress
In scenarios where battery swapping prices are regulated by a transportation commission or government authority, the traditional Cournot-style oligopoly dynamics may be suppressed. Price competition between firms is curtailed, as the market-clearing price is externally imposed rather than endogenously determined through strategic firm interaction. Consequently, firms no longer engage in simultaneous output-based competition, and the focus shifts from market positioning to operational efficiency and value-added service differentiation.
Under such a regulated market structure, the pricing mechanism may incorporate:
- (1)
- State-of-charge (SoC) depletion: Higher levels of energy withdrawal from the battery reduce its usable life, justifying cost adjustments based on the degree of depletion.
- (2)
- Load profile or duty intensity: Aggressive acceleration, unauthorized charging outside approved swapping station, or sustained high-current draws introduce mechanical and thermal stress, accelerating battery wear. These usage patterns can be captured through sensors built in the battery packs and factored into the pricing logic.
- (3)
- Environmental exposure: Deployment in extreme ambient conditions, such as high temperatures or sub-freezing climates, can degrade battery health. Pricing can be calibrated to account for the thermal history and operational environment of each swapped unit.
- (4)
- Discharge beyond preset contract: A degradation pricing component is added to penalize deep discharges and incentivize moderate usage. Discharge threshold can be preset by the EV user during the time the swapping is executed.
Such degradation-aware tariff models provide a mechanism for firms to ensure cost recovery and asset longevity under these pricing constraints, while also encouraging responsible battery utilization behavior by end users. A full formulation of such a pricing model is developed in the subsequent section.
The pricing factor forms the fundamental charge depletion component and can be formulated as in Equation (14). Here, representing a rolling average electricity price per kWh and accounts for the energy drawn from the battery in kWh during the swap cycle. Instead of charging a flat fee, the battery swapping station charges only for the actual energy used () by the user of the loaned battery:
The surcharge component is the second adder component accounting for aggressive usage and can be formulated as shown in Equation (15), with denoting the pricing coefficient for load intensity:
The normalized duty score, , can be computed as a weighted average of the contributing factors, as outlined in Table 5.
Table 5.
Guidelines on computation of normalized duty score,
The surcharge component is the third adder component accounting for environmental stress adjustment and can be formulated as shown in Equations (16) and (17), with representing an adjustable temperature penalty rate. This component adds a penalty for the time for which the battery’s on-board temperature management system is turned off due to range extension, which leads to the battery’s ambient temperature exceeding the preset temperature threshold, resulting in loss of life.
The fourth component, the degradation pricing component, is added to penalize deep discharges and incentivize moderate usage. The component is modeled as a quadratic penalty, see Equation (18), with denoting a degradation coefficient ($/kWh for penalty), when the depth of discharge (DoD) exceeds a predefined threshold , and a linear reward otherwise, with representing a reward coefficient ($/kWh for shallow DoD). This promotes battery longevity by discouraging high-stress discharge patterns:
The behavior of the proposed quadratic penalty, Equation (18), is worth exploring, with the amortized degradation cost shown in Figure 7a. Discharge more than the preset depth of discharge results in a steep penalty. Figure 7b shows that if higher preset discharge threshold is set during swapping execution, the penalty to exceed the higher preset discharge threshold can be set to a higher preset, thereby compensating the battery swapping provider with higher compensation for deeper discharges.
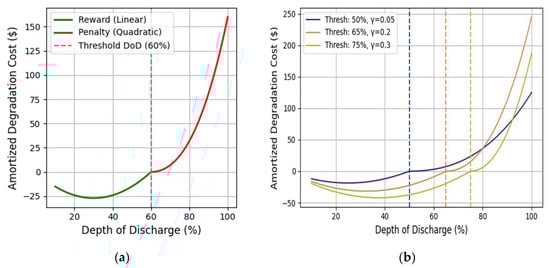
Figure 7.
Quadratic penalty function to limit depth of discharge. (a) Reward and penalty region of the quadratic penalty function with 60% depth of discharge. (b) Behavior of quadratic penalty function with different depth of discharge threshold; deeper depth of discharge threshold yields steeper penalty.
To illustrate the effectiveness of the proposed pricing model, six representative battery swapping scenarios are evaluated, and the results are shown in Figure 8 using formulation Equations (14)–(18), each reflecting varying operational stressors including depth of discharge, duty intensity, and thermal exposure.
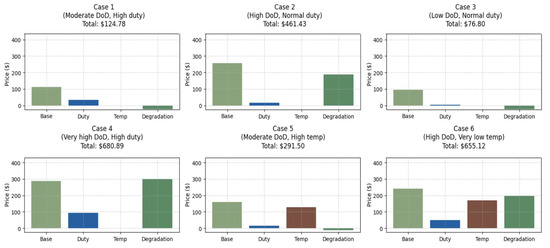
Figure 8.
Component-wise breakdown of battery swapping prices across six operational scenarios, illustrating the contribution of base energy usage, duty-induced stress, temperature exposure, and nonlinear degradation cost. Each subplot reflects a different combination of depth of discharge (DoD), duty intensity, and ambient temperature. The degradation cost is modeled as a nonlinear function of DoD, imposing a sharper penalty when DoD exceeds a set threshold (e.g., cases 2, 4, and 6), and offering a reward when DoD remains below it (e.g., cases 1, 3, and 5).
- Case 1—Moderate DoD with high-duty usage: A 35% depth of discharge (DoD) incurred under high mechanical stress conditions (e.g., hilly terrain and heavy payload), yielding a modest duty surcharge. Since the DoD remains below the threshold of 60%, a degradation reward is applied.
- Case 2—High DoD with normal duty: An 80% DoD under standard operating conditions results in a steep degradation penalty due to significantly exceeding the DoD threshold (set at 60%), even though mechanical stress remains low.
- Case 3—Shallow DoD with low duty: A 30% DoD with minimal load and nominal ambient conditions results in a low base charge, negligible duty impact, and a strong degradation reward for shallow cycling.
- Case 4—Very high DoD with high duty: A 90% DoD combined with aggressive-duty profile results in the highest degradation penalty due to a tighter DoD threshold (set at 50%), alongside a significant duty-induced surcharge.
- Case 5—Moderate DoD with high temperature exposure: A 50% DoD under elevated ambient temperature results in a small temperature penalty and a degradation reward for remaining within the DoD threshold of 50%.
- Case 6—High DoD with very low temperature exposure: A 75% DoD under thermal stress conditions leads to compounded pricing impacts from both temperature exposure and a sharp nonlinear degradation penalty due to the reduced DoD threshold of 50%.
5. Summary, Challenges, Future Work
5.1. Manuscript Summary
The analysis presented in this study underscores how the accelerated deployment of commercial EVs in Europe and China positions these regions with a strategic advantage in achieving large-scale transport decarbonization. However, for such momentum to be sustained globally, electrification infrastructures must be designed to withstand extreme weather fluctuations while embedding design-integrated safety as a central engineering priority. This paper addresses both requirements by proposing a novel safety-integrated battery swapping station layout and by developing two distinct pricing models suitable for regulated and deregulated market environments. Together, these frameworks provide a comprehensive techno-economic approach that captures the computation of technical parameters during a battery swap and aligns them with market-specific operational strategies, enabling flexible and diverse implementation.
5.2. Implementation Challenges
Despite the promise of the proposed frameworks, several challenges remain in realizing their full potential. Chief among these is the standardization of hardware for both commercial EVs and battery swapping stations. Uniform specifications for swappable battery packs, chargers, and battery containers are essential to facilitate interoperability, allowing batteries to be exchanged seamlessly across participating stations regardless of operator or geographic location. Such standardization would also enable future-proofing, ensuring compatibility with emerging chemistries, thermal management systems, and power electronics. At present, there are no internationally recognized standards governing commercial swappable batteries or the associated charging and containment infrastructure, representing a significant barrier to widespread adoption.
5.3. Future Scope of Work
Future research should focus on conducting individual regional case studies for both the dual-market Cournot model and the degradation-sensitive pricing framework, capturing location-specific market conditions, policy structures, and operational constraints. In particular, the Cournot-type framework developed in this study is built on a set of simplifying assumptions that enable analytical tractability. The model adopts a linear inverse demand function, assumes static marginal costs, treats all batteries in terms of homogenous Li-ion battery chemistry, presumes perfect station reliability, ignores network congestion or locational constraints, and applies a simplified representation of battery degradation. While these assumptions are common in early-stage economic modeling, they abstract away several real-world complexities.
The implications are twofold. First, the results should be interpreted as indicative rather than predictive, highlighting the strategic dynamics of battery swapping firms under stylized market conditions. Second, relaxing these assumptions in future work by incorporating nonlinear demand, heterogeneous battery chemistries, stochastic station reliability, grid congestion effects, or more detailed degradation models could provide richer insights into pricing, profitability, and market equilibrium. Such extensions would improve the realism of the model and strengthen its relevance for guiding policy and investment decisions in commercial EV infrastructure.
A separate extension of the existing work can be made by studying the elasticity and sensitivity of Cournot equilibrium outcomes with respect to key input parameters. For instance, shifts in demand elasticity, marginal costs, or the number of available batteries may lead to substantial changes in equilibrium prices, swap quantities, and firm profitability. Exploring these sensitivities would help identify thresholds beyond which market dynamics could become unstable or unprofitable. Such an analysis would not only provide robustness checks for the current modeling framework but also offer valuable insights into how commercial EV battery swapping markets might respond to policy interventions, infrastructure scaling, or variations in consumer adoption.
Author Contributions
The views, thoughts, opinions, and conclusions made in this manuscript are solely those of the authors and do not necessarily reflect the view of the author’s employer, committee, or other groups or individuals. The author is solely responsible for the content and accuracy of the technical manuscript. The author has read and agreed to the published version of the manuscript.
Funding
This research received no external funding.
Data Availability Statement
The original contributions presented in this study are included in the article. Further inquiries can be directed to the author.
Conflicts of Interest
The author declares that the research was conducted in the absence of any commercial or financial relationships that could be construed as a potential conflict of interest.
Abbreviations
The following abbreviations are used in this manuscript:
| CREZ | Competitive Renewable Energy Zone |
| DoD | depth of discharge |
| EV | electric vehicle |
| HVAC | heating, ventilation, and air conditioning |
| KKT | Karush–Kuhn–Tucker (conditions) |
| LOC | lost opportunity cost |
| NFPA | National Fire Protection Agency |
| NPV | net present value |
| SoC | state of charge |
Appendix A. KKT Conditions for Cournot-Style Dual-Market Framework
For the Cournot-style dual-market framework, where multiple firms simultaneously choose quantities in interrelated markets, deriving the KKT conditions allows for a rigorous mathematical formulation of the firm’s profit maximization problem under capacity and non-negativity constraints. To this end, let firm operate in two markets, a primary EV battery swapping market and a secondary grid services market. Let represent the quantity of battery swaps by firm in the primary market, and represent the energy allocated by firm in the secondary market. The inverse demand function for the primary market is represented as and the price in the secondary market is represented by .
With the above structure in place, firm maximizes profit by choosing and , with the objective function becoming as shown in Equation (A1), with constraints as shown in Equations (A2) and (A3).
where is a weighting factor that reflects different energy demands per unit of service in each market. The Lagrangian for the above formulation can be written as in Equation (A4), with representing the shadow price associated with Equations (A2) and (A3).
The KKT conditions for firm can thus be written as Equations (A5)–(A8).
Stationarity:
Primal feasibility:
Dual feasibility:
Complementary slackness:
Thus, the Karush–Kuhn–Tucker (KKT) conditions have been derived.
References
- Wen, W.; Yang, S.; Zhou, P.; Gao, S.Z. Impacts of COVID-19 on the electric vehicle industry: Evidence from China. Renew. Sustain. Energy Rev. 2021, 144, 111024. [Google Scholar] [CrossRef]
- Huang, P.; Ma, Z.; Xiao, L.; Sun, Y. Geographic Information System-assisted optimal design of renewable powered electric vehicle charging stations in high-density cities. Appl. Energy 2019, 255, 113855. [Google Scholar] [CrossRef]
- Knittel, C.R.; Tanaka, S. Challenges to Expanding EV Adoption and Policy Responses: Working Paper Series; MIT Center for Energy and Environmental Policy Research (CEEPR): Cambridge, MA, USA, 2024. [Google Scholar]
- Knittel, C.R.; Tanaka, S. Challenges to expanding EV adoption and policy responses. In Handbook on Electricity Regulation; Edward Elgar Publishing: Cheltenham, UK, 2025; pp. 405–447. [Google Scholar]
- Saxena, S.; Xing, Y.; Kwon, D.; Pecht, M. Accelerated degradation model for C-rate loading of Lithium-ion batteries. Int. J. Electr. Power Energy Syst. 2019, 107, 438–445. [Google Scholar] [CrossRef]
- Nicholas, M. Estimating Electric Vehicle Charging Infrastructure Costs across Major US Metropolitan Areas; International Council on Clean Transportation: Washington, DC, USA, 2019. [Google Scholar]
- Bayram, I.S. Impacts of electric vehicle charging under cold weather on power networks. In Proceedings of the 56th International Universities Power Engineering Conference (UPEC), Middlesbrough, UK, 31 August–3 September 2021. [Google Scholar]
- Zhang, T.; Chen, X.; Yu, Z.; Zhu, X.; Shi, D. A Monte Carlo simulation approach to evaluate service capacities of EV charging and battery swapping stations. IEEE Trans. Ind. Inform. 2018, 14, 3914–3923. [Google Scholar] [CrossRef]
- Zheng, Y.; Dong, Z.Y.; Xu, Y.; Meng, K.; Zhao, J.H. Electric vehicle battery charging/swap stations in distribution systems: Comparison study and optimal planning. IEEE Trans. Power Syst. 2013, 29, 221–229. [Google Scholar] [CrossRef]
- Chen, X.; Kai, X.; Ni, F.; Wu, Y.; Xia, Y. An electric vehicle battery-swapping system: Concept, architectures, and implementations. IEEE Intell. Transp. Syst. Mag. 2022, 14, 175–194. [Google Scholar] [CrossRef]
- Ahmad, F.; Alam, M.S.; Alsaidan, I.S.; Shariff, S.M. Battery swapping station for electric vehicles: Opportunities and challenges. IET Smart Grid 2020, 3, 280–286. [Google Scholar] [CrossRef]
- Goldsmith, V. Lessons learned from battery energy storage system (BESS) hazard analyses. Process Saf. Prog. 2025, 44, 245–255. [Google Scholar] [CrossRef]
- Xu, K. Nonaqueous liquid electrolytes for lithium-based rechargeable batteries. Chem. Rev. 2004, 104, 4303–4417. [Google Scholar] [CrossRef]
- Zhoujian, A.; Li, J.; Ding, Y.; Dang, C.; Xuejiao, L. A review on lithium-ion power battery thermal management technologies and thermal safety. J. Therm. Sci. 2017, 26, 391–412. [Google Scholar] [CrossRef]
- Bandhauer, T.M.; Garimella, S.; Fuller, T.F. A critical review of thermal issues in Lithium-ion batteries. J. Electrochem. Soc. 2011, 158, R1. [Google Scholar] [CrossRef]
- Feng, X.; Ren, D.; He, X.; Ouyang, M. Mitigating thermal runaway of Lithium-ion batteries. Joule 2020, 4, 743–770. [Google Scholar] [CrossRef]
- Gao, Z.; Rao, S.; Zhang, T.; Li, W.; Yang, X.; Chen, Y.; Zheng, Y.; Ding, Y.; Dong, T.; Li, S. Design strategies of flame-retardant additives for Lithium-ion electrolyte. J. Electrochem. Energy Conv. Storage 2022, 19, 030910. [Google Scholar] [CrossRef]
- An, Y.; Han, X.; Liu, Y.; Azhar, A.; Na, J.; Nanjundan, A.K.; Wang, S.; Yu, J.; Yamauchi, Y. Progress in solid polymer electrolytes for Lithium-Ion batteries and beyond. Small 2022, 18, 2103617. [Google Scholar] [CrossRef] [PubMed]
- Perea, A.; Dongtingy, M.; Zaghib, K. Safety of solid-state Li metal battery: Solid polymer versus liquid electrolyte. J. Power Sources 2017, 359, 182–185. [Google Scholar] [CrossRef]
- Tarar, M.O.; Hassan, N.U.; Naqvi, I.H.; Pecht, M. Techno-economic framework for electric vehicle battery swapping stations. IEEE Trans. Transp. Electrif. 2023, 9, 4458–4473. [Google Scholar] [CrossRef]
- Shi, P.; Ni, G.; Jin, R.; Wang, H.; Jinsong, W.; Chen, X. Economic operation optimization for electric heavy-duty truck battery swapping stations considering time-of-use pricing. Processes 2025, 13, 2271. [Google Scholar] [CrossRef]
- Zhao, W.; Qian, H.; Bao, X.; Yan, L. Pricing strategy for battery swapping of electric heavy-duty trucks and business model based on cooperative Stackelberg game. J. Energy Storage 2025, 131, 117482. [Google Scholar] [CrossRef]
- Chacko, S.; Chung, Y.M. Thermal modelling of Li-ion polymer battery for electric vehicle drive cycles. J. Power Sources 2012, 213, 296–303. [Google Scholar] [CrossRef]
- Ahmed, S.H.; Kang, X.; Shrestha, S.O.B. Effects of temperature on internal resistances of Lithium-ion batteries. J. Energy Resour. Technol. 2015, 137, 031901. [Google Scholar] [CrossRef]
- Jaguemont, J.; Boulon, L.; Dubé, Y.; Martel, F. Thermal management of a hybrid electric vehicle in cold weather. IEEE Trans. Energy Convers. 2016, 31, 1110–1120. [Google Scholar] [CrossRef]
- Lucas, A.; Trentadue, G.; Scholz, H.; Otura, M. Power quality performance of fast-charging under extreme temperature conditions. Energies 2018, 11, 2635. [Google Scholar] [CrossRef]
- Global EV Data Explorer. International Energy Agency. Available online: https://www.iea.org/data-and-statistics/data-tools/global-ev-data-explorer (accessed on 10 July 2025).
- Esparza, E.; Truffer-Moudra, D.; Hodge, C. Electric Vehicle and Charging Infrastructure Assessment in Cold Weather Climates: A Case Study of Fairbanks, Alaska; National Renewable Energy Laboratory: Golden, CO, USA, 2025. [Google Scholar]
- Meng, D.; Weng, J.; Wang, J. Experimental Investigation on thermal runaway of Lithium-ion batteries under low pressure and low temperature. Batteries 2024, 10, 243. [Google Scholar] [CrossRef]
- The United States Wind Turbine Database (USWTDB). U.S. Geological Survey. August 2025. Available online: https://energy.usgs.gov/uswtdb/ (accessed on 26 August 2025).
- Du, X.; Rubin, O.D. Transition and integration of the ERCOT market with the competitive renewable energy zones project. Energy J. 2018, 39, 235–260. [Google Scholar] [CrossRef]


Disclaimer/Publisher’s Note: The statements, opinions and data contained in all publications are solely those of the individual author(s) and contributor(s) and not of MDPI and/or the editor(s). MDPI and/or the editor(s) disclaim responsibility for any injury to people or property resulting from any ideas, methods, instructions or products referred to in the content. |
© 2025 by the author. Published by MDPI on behalf of the World Electric Vehicle Association. Licensee MDPI, Basel, Switzerland. This article is an open access article distributed under the terms and conditions of the Creative Commons Attribution (CC BY) license (https://creativecommons.org/licenses/by/4.0/).