1. Background
1.1. Motivation
Electric autonomous vehicles (EAVs) are increasingly recognized as a key solution for improving road safety and minimizing human error in traffic systems. With the advancement of automation technologies, particularly at Society of Automotive Engineers (SAE) Levels 4 and 5 [
1], the absence of a human driver removes conventional social interaction cues, such as eye contact, hand gestures, and verbal signals, that pedestrians typically rely on to judge crossing safety. This creates a critical gap in vehicle-to-pedestrian (V2P) communication, particularly in complex urban environments where hesitation or misinterpretation can lead to unsafe crossing behaviors. To address this motivation, this section also reviews relevant literature on external human–machine interfaces (eHMIs) and their design elements, providing the background necessary to position the present study within current research trends.
1.2. Literature Review
To address this communication barrier, eHMIs have been proposed as a means for EAVs to convey their intentions to nearby pedestrians. eHMIs encompass visual signals such as text, icons, and light patterns projected on the vehicle’s exterior, and aim to replicate or substitute the communicative role previously fulfilled by human drivers. As the deployment of EAVs increases, ensuring that these interfaces are intuitive and universally understood becomes crucial for public safety and trust.
Pedestrian safety continues to be a major concern worldwide. The World Health Organization (WHO) [
2] reported 32.7 pedestrian deaths per 100,000 people in 2018, with Thailand ranking third in total road fatalities. Between 2013 and 2017, Thailand’s Consumer Council [
3] found that pedestrian-vehicle incidents had the highest severity index, averaging 55 deaths per 100 accidents. These alarming figures underscore the urgent need for effective pedestrian-EAV interaction strategies, particularly at zebra crossings, which remain hotspots for accidents due to unclear mutual intentions [
4].
In response to this challenge, eHMI designs have evolved considerably, ranging from simple road projections [
5,
6] and symbolic displays [
7,
8] to animated visual elements and culturally adapted formats [
9,
10,
11,
12,
13,
14]. Dey et al. [
10] proposed a taxonomy of over 70 eHMI formats, reflecting diverse experimental approaches and design philosophies. Yet, despite this growing body of research, a universally accepted standard has yet to emerge. This is partly due to varying assessment methodologies: some studies rely on observed crossing decisions [
12], others on subjective ratings of trust and safety [
15], and only a few directly evaluate the clarity or speed of message comprehension.
In addition to purely visual formats, multimodal eHMI designs have been investigated to enhance clarity and robustness under varying environmental conditions. Auditory cues, such as tones or voice messages, can convey urgency or confirmation even when visibility is limited, while haptic signals delivered via wearable or mobile devices can provide discreet, personal feedback. Augmented reality (AR) overlays have also been explored to project vehicle intent directly into a pedestrian’s field of view, offering context-aware guidance. While this study focuses on visual eHMIs due to their high compatibility with current EAV hardware and infrastructure, integrating multimodal elements may further improve inclusivity and resilience in future deployments.
In addition to visual interfaces, recent research has explored other eHMI modalities such as auditory cues (e.g., tones or voice messages) [
8], haptic signals (e.g., vibrations via smartphones) [
16], and augmented reality (AR) overlays designed to enhance situational awareness through wearable or mobile devices. Each modality presents unique benefits and limitations depending on environmental context, technological access, and pedestrian needs. While the present study focuses on visual eHMIs due to their high compatibility with current EAV platforms and infrastructure readiness, future work should explore multimodal systems that offer broader inclusivity and adaptability. Moreover, ongoing international standardization efforts, such as those from ISO (e.g., ISO/TC 204 on Intelligent Transport Systems) and the UNECE (e.g., WP.29 GRVA framework on EAV signaling), underscore the urgency of evaluating and harmonizing visual eHMI formats for EAVs.
Recent work by Man et al. (2025) [
17] offers a bibliometric and systematic review of pedestrian interactions with eHMI-equipped EAVs, identifying dominant research themes, such as comprehension metrics, interface typologies, and communication modalities, while emphasizing the need for greater field validation and demographic diversity in evaluations. Complementarily, Wang et al. (2024) [
18] explored how generative AI can support autonomous driving development, particularly through synthetic scenario generation and automated behavioral modeling, which could enhance the design and testing of future eHMIs. These studies reinforce the importance of grounding visual eHMI designs in both empirical evidence and emerging AI-driven methodologies.
1.3. Research Gap
However, despite the breadth of existing work, few studies have systematically compared different visual eHMI configurations while controlling for user demographics, and even fewer have applied an objective, time-based measure of comprehension to assess interface clarity. To address this gap, the present study focuses on comprehension time as the primary evaluation metric.
This study adopts comprehension time, the duration from eHMI onset to participant understanding, as the primary metric for evaluating eHMI effectiveness. Unlike crossing behavior, which can be influenced by external variables such as personal risk tolerance or social pressure, comprehension time offers a more direct and quantifiable measure of how quickly a pedestrian decodes a vehicle’s intention [
19]. This approach also facilitates finer-grained comparisons across visual formats and demographic groups, allowing clearer insight into the cognitive accessibility of different eHMI designs.
Nonetheless, existing studies provide limited analysis of how demographic variation (e.g., age, familiarity with traffic norms) and presentation formats jointly affect comprehension performance. Additionally, most studies are conducted solely in simulated environments without real-world validation. Therefore, this research aims to address these gaps by systematically evaluating combinations of eHMI features (text, symbol, and color) in both virtual and field experiments. In doing so, the study seeks to derive practical design guidelines that improve communication between EAVs and pedestrians in real-world urban scenarios. However, there is a lack of systematic studies that compare different visual eHMI formats while incorporating demographic variation and validating findings in both simulation and real-world environments.
To the best of our knowledge, no prior study has systematically compared different visual eHMI formats while incorporating demographic variation and validating results in both simulation and real-world environments using comprehension time as the primary metric. This lack of integrated, demographically informed evaluation represents a critical research gap that the present study aims to address.
1.4. Contributions
While some individual findings in this study (e.g., the superiority of “WALK” over “CROSS” or the use of pedestrian icons over arrows) have been reported in previous work, our contribution lies in three key areas: (1) a comparative analysis across four distinct age groups to assess the demographic sensitivity of eHMI formats; (2) the use of comprehension time as a primary metric, providing more objective insight than behavioral proxies like crossing initiation; and (3) a two-stage evaluation combining virtual simulation with field experimentation, which is rarely applied in this domain. Together, these elements support the reliability, generalizability, and practical relevance of our findings for future eHMI design.
Recent advances in AI-driven EAV systems have introduced new paradigms in both perception and decision-making. For example, generative AI models have been used to create rich and diverse driving scenarios for simulation and testing, improving model robustness and rare-event coverage [
20]. Similarly, foundation models have enabled scalable, generalizable representations that unify multiple EAV tasks such as object detection, trajectory prediction, and scenario generation [
21]. From a safety standpoint, control-theoretic approaches have also gained attention in ensuring the stability and interpretability of AI decisions under uncertainty [
22]. These emerging directions support the development of intelligent and human-aligned EAV systems and provide a broader context for enhancing eHMIs that facilitate pedestrian interaction and safety.
In summary, this section has outlined both the practical motivation for improving pedestrian–EAV communication and the current state of research on eHMI design, highlighting existing approaches, methodologies, and unresolved challenges. While prior studies have examined individual elements such as text, symbols, or color schemes, few have combined these features systematically across diverse demographic groups and validated findings in both simulation and real-world settings. Addressing this gap, the present study aims to provide an integrated evaluation of eHMI formats, measured primarily through comprehension time, to derive practical design recommendations that enhance safety, comprehension, and trust in pedestrian–EAV interactions.
The novelty of this work lies in its integrated approach to evaluating visual eHMI formats for EAV–pedestrian communication. Specifically: (1) a comparative analysis across four distinct age groups to assess demographic sensitivity; (2) the use of comprehension time as the primary, objective evaluation metric; and (3) a two-stage experimental design combining controlled simulation with preliminary real-world field validation. These elements collectively address the current lack of systematic, demographically informed evaluations validated in both virtual and physical environments, enabling the derivation of practical, evidence-based eHMI design recommendations.
The remainder of this paper is structured as follows.
Section 2 describes the experimental design, including the virtual simulation setup, data collection procedures, and field-testing methodology.
Section 3 presents and discusses the results from both the simulation and field experiments, highlighting the effectiveness of different eHMI formats. Finally,
Section 4 concludes the paper with key findings and recommendations for future eHMI design in EAV systems.
2. Methods
2.1. Experimental Equipment
The virtual simulation was conducted using a custom Python-based (Python 3.13) application designed for synchronized video playback and participant response logging. Video stimuli were generated using the CARLA Simulator (Car Learning to Act), an open-source autonomous driving simulation platform that allows precise control over environmental and traffic parameters. In this study, the simulator was configured to represent a two-lane urban road with a pedestrian crosswalk. Adjustable parameters included weather conditions (clear, cloudy, rainy), ambient lighting (daytime, dusk), and traffic density (low, medium, high). The Mitsubishi Fuso Rosa bus model was selected as the EAV platform, and scripted driving scenarios ensured consistent vehicle approach speed and stopping behavior across trials. All scenarios were recorded automatically in CARLA using fixed camera viewpoints, then exported at 1920 × 1080 resolution and 60 frames per second via OBS Studio. eHMI elements were digitally overlaid using Adobe After Effects to create the experimental stimuli.
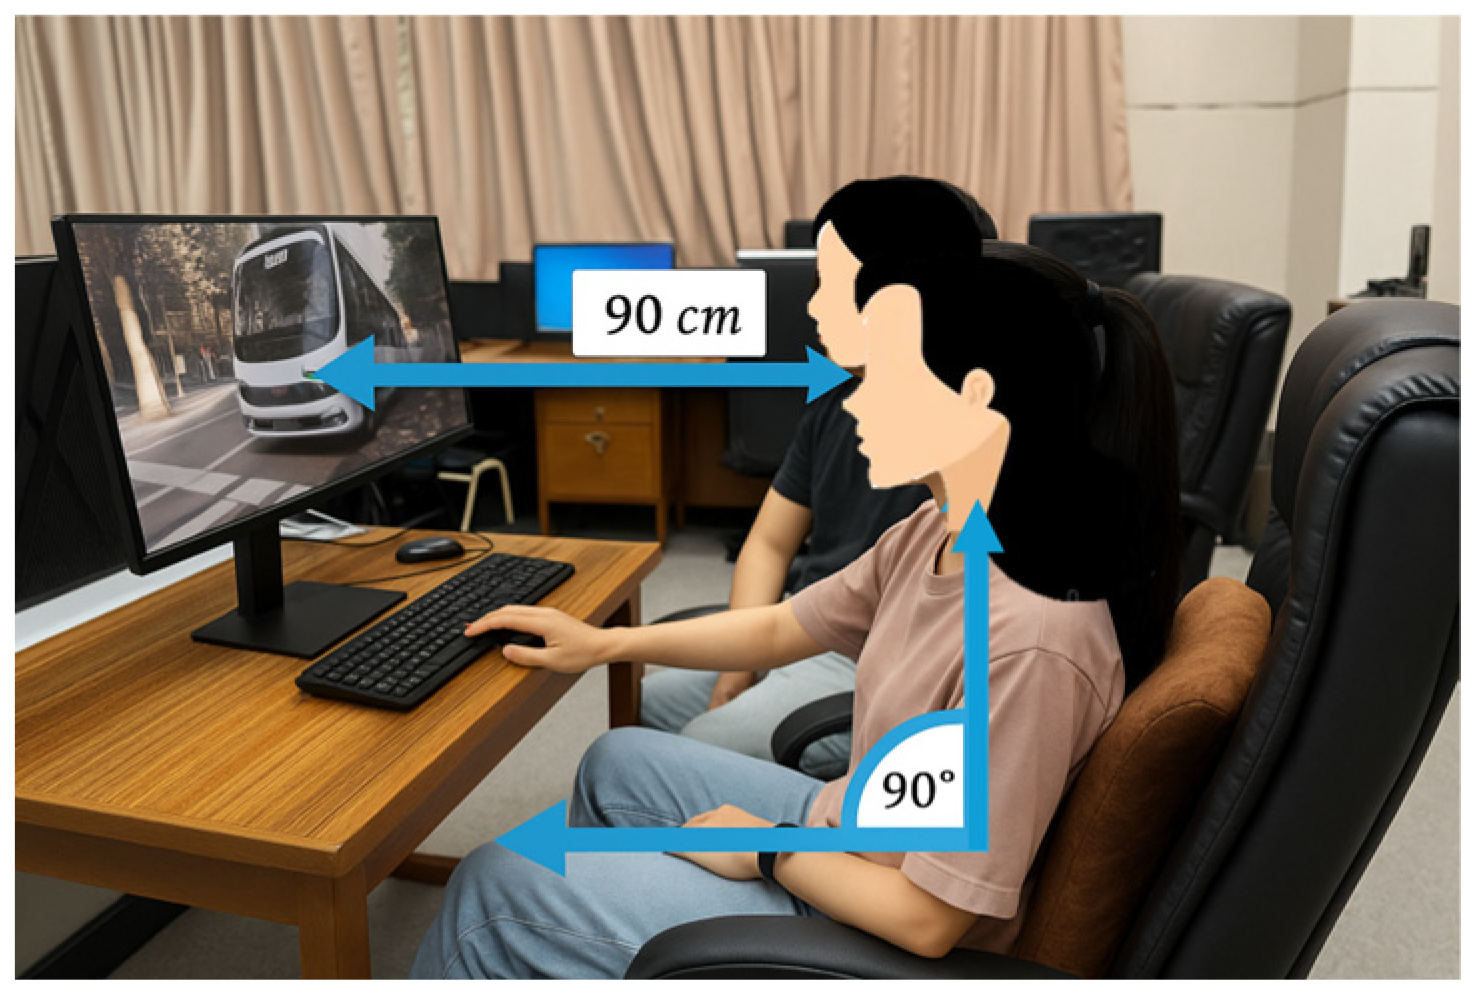
The simulation workflow was semi-automated: scenario playback and parameter variation were preprogrammed in CARLA, while stimulus presentation to participants and comprehension-time logging were managed manually via the Python interface. This setup ensured that simulation playback, eHMI presentation, and response logging were consistently synchronized across all trials. Hardware included a 24-inch LG Full HD IPS monitor, Intel Core i9-10900K CPU, NVIDIA GeForce RTX 3080 GPU, 512 GB SSD, and 32 GB RAM. Participants were seated 90 cm from the screen at a fixed height to maintain a consistent viewing angle, as shown in
Figure 1.
2.2. Experimental Procedure Design
Each participant viewed 20 simulation events. One featured no eHMI display, four used text-only eHMIs, four used symbol-only formats, eight used mixed text-symbol formats, and three no-eHMI events involved non-stopping vehicles (excluded from analysis). To maintain consistency, each event followed a fixed structure: the vehicle moved at 30 km/h for 16 m before decelerating over another 16 m and stopping 1 m before the crosswalk. It then remained stationary for 3 s. The entire sequence lasted 10 s per event.
The simulation environment setup, including the crosswalk and road layout, is depicted in
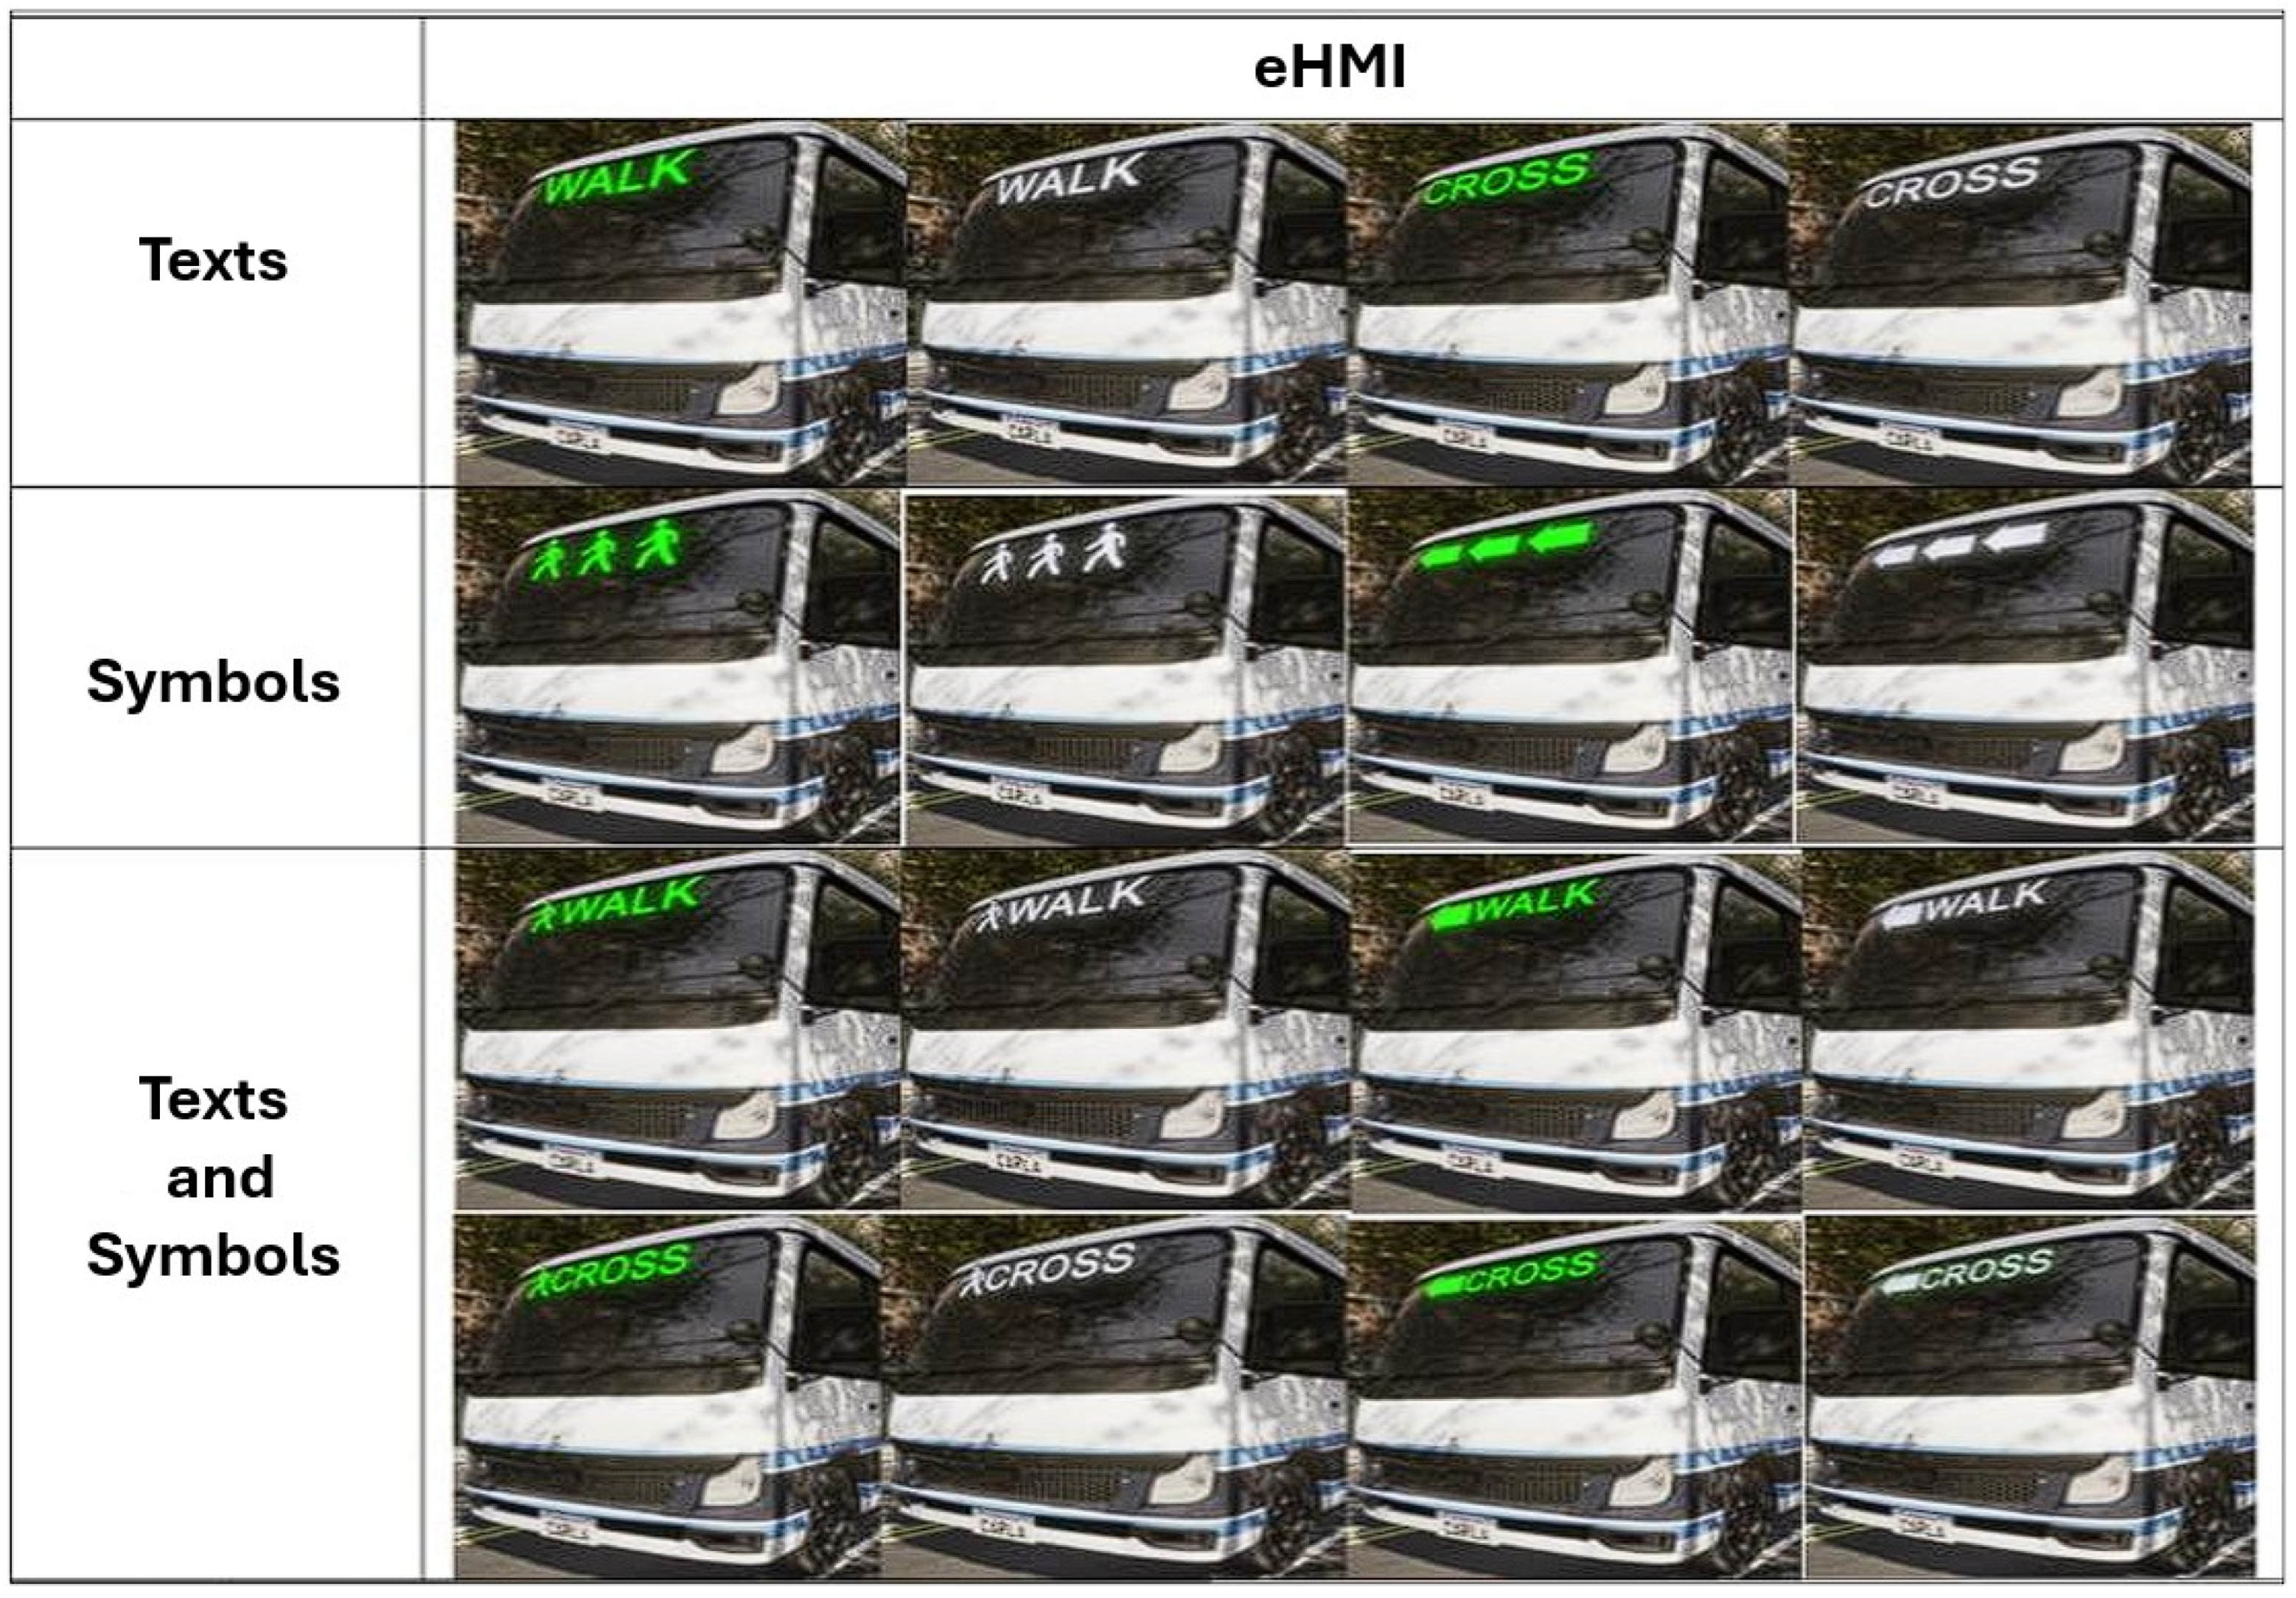
Figure 2. Displayed eHMI formats varied in message type (“WALK” or “CROSS”), icon (pedestrian or arrow), and color (green or white). Mixed formats combined both elements. The range of eHMI display models implemented for this experiment is illustrated in
Figure 3. The eHMI was placed on the top of the windshield for optimal visibility.
It is important to note that all eHMI prompts in this experiment indicated yielding behavior. This design decision was made to allow a controlled comparison between different visual formats of yield messages. However, we acknowledge that this may have led to conditioned expectations rather than genuine interpretation. While this design facilitates consistent testing of message recognition and comprehension speed, it does not capture the full interpretive range of eHMI content. Future studies should incorporate both yield and non-yield cues to better isolate comprehension accuracy under varying vehicle behaviors.
In the present study, non-yielding conditions were deliberately excluded to maintain focus on controlled assessment of yielding eHMI formats. This choice ensured consistency in vehicle behavior and minimized potential confounding factors. Nonetheless, incorporating both yielding and non-yielding cues in future experiments is recognized as essential for capturing the ambiguity present in real-world pedestrian–vehicle interactions.
Five experimental scenarios were designed for this study: one baseline condition with no eHMI and four with different eHMI configurations (text only, symbol only, color-coded, and combined text–symbol–color). The baseline condition provided a control reference to evaluate pedestrian comprehension in the absence of visual cues, while the four eHMI formats were selected to represent distinct and widely discussed design strategies in the literature and current standardization efforts. This combination of scenarios enabled both the isolation of individual visual elements and the assessment of their combined effects on comprehension time, supporting a comprehensive comparison across formats.
To provide a clear overview of the methodological flow without the use of a flowchart, the entire procedure can be summarized as follows. The study began with the design of a controlled simulation environment replicating zebra crossing scenarios, followed by the selection and preparation of eHMI formats incorporating variations in text, symbol, and color. Participants from four distinct age groups were recruited and given a standardized briefing before the trials. Each participant completed the simulation tasks while comprehension time was recorded for every eHMI condition. After completing the virtual tests, selected participants took part in a preliminary real-world field evaluation under similar conditions to validate the simulation findings. The collected data were then processed and statistically analyzed to compare comprehension times across formats and demographics, enabling the derivation of practical recommendations for eHMI design.
2.3. Sampling Method
A total of 100 participants were recruited using stratified, institution-based sampling with age-by-sex quotas to ensure diversity in gender, age group, and driving experience. The sample included approximately equal representation of male and female participants across the following age groups: 18–30 (recruited from educational institutions), 31–45 (factories), 46–60 (government offices), and over 60 (nursing homes).
Sampling frame and procedure: (i) define age × sex quotas for four age strata; (ii) identify recruiting institutions appropriate to each stratum; (iii) invite volunteers via institutional channels and enroll consecutively until quotas were met; (iv) screen eligibility and conduct standardized orientation/practice before testing. Participant counts by age group and sex are reported in
Table 1, with additional details provided in
Appendix A (
Table A1).
Balancing and control of institutional differences: Because recruiting institutions were aligned with age strata, institution type was collinear with age group. To mitigate potential confounding, we (a) enforced age-by-sex quotas within strata, (b) standardized the test environment and instructions (identical 24-inch display, fixed 90 cm viewing distance, identical lighting), and (c) used a within-subject design with semi-randomized trial order so that each participant experienced all eHMI formats under the same conditions.
Participant screening ensured that all individuals met the inclusion criteria: basic English proficiency (sufficient to understand the words “WALK” and “CROSS”), normal color vision verified using the Ishihara test [
15], and no prior experience or training with EAV systems. All participants provided written informed consent before data collection. The study protocol was reviewed and approved by the Research Ethics Review Committee for Research Involving Human Participants (Group II–Social Sciences, Humanities, and Arts), Chulalongkorn University, under Certificate of Approval (COA) No. 163/66, Project ID 660112, titled “Communication Between Autonomous Shuttle and Pedestrians at Crosswalks”.
While age groups were deliberately stratified to ensure demographic representation, we acknowledge that cognitive level and age may jointly influence eHMI comprehension. As these variables were not independently controlled or measured, future studies should consider cognitive assessments or matched-group designs to isolate the effects of age and cognitive processing ability.
2.4. Experimental Procedure
To reduce the influence of learning and fatigue effects, the 20 scenarios were presented in a semi-randomized order for each participant. The sequences were designed to ensure that eHMI types (color, symbol, and text) were evenly distributed across the trial timeline, preventing any format from appearing consistently earlier or later in the session.
Each participant received a briefing and completed practice trials. During testing, participants faced the screen and were prompted before each event. They were instructed to press the Space bar when they understood the vehicle’s intention. After each trial, they verbally confirmed the perceived message. Data accuracy was verified post-session.
2.5. Data Analysis Method
Comprehension time was the dependent variable, recorded in seconds from video start to keypress. Independent variables were the eHMI format features: color (green vs. white), text (“WALK” vs. “CROSS”), symbol (pedestrian vs. arrow), and mixed text–symbol combinations.
Four pre-specified within-subject contrasts were tested: (i) color (green vs. white), (ii) text (“WALK” vs. “CROSS”), (iii) symbol (pedestrian vs. arrow), and (iv) mixed text–symbol combinations, each analyzed separately by age group and for the pooled sample. Pairwise comparisons used paired-sample t-tests (α = 0.05). Given that the comparisons were pre-specified and limited in number, no multiplicity adjustment was applied. We acknowledge the potential for inflated Type I error and therefore report Cohen’s dz effect sizes and 95% confidence intervals (CI) for the mean differences to aid interpretation.
Descriptive statistics (mean, standard deviation, coefficient of variation) and 95% CIs were computed for each format and condition. All analyses and statistical computations were performed using MATLAB 2024a, and summary tables/figures were prepared using Microsoft Excel. Full descriptive statistics for each condition are provided in
Appendix B.
2.6. Field Experiment Design
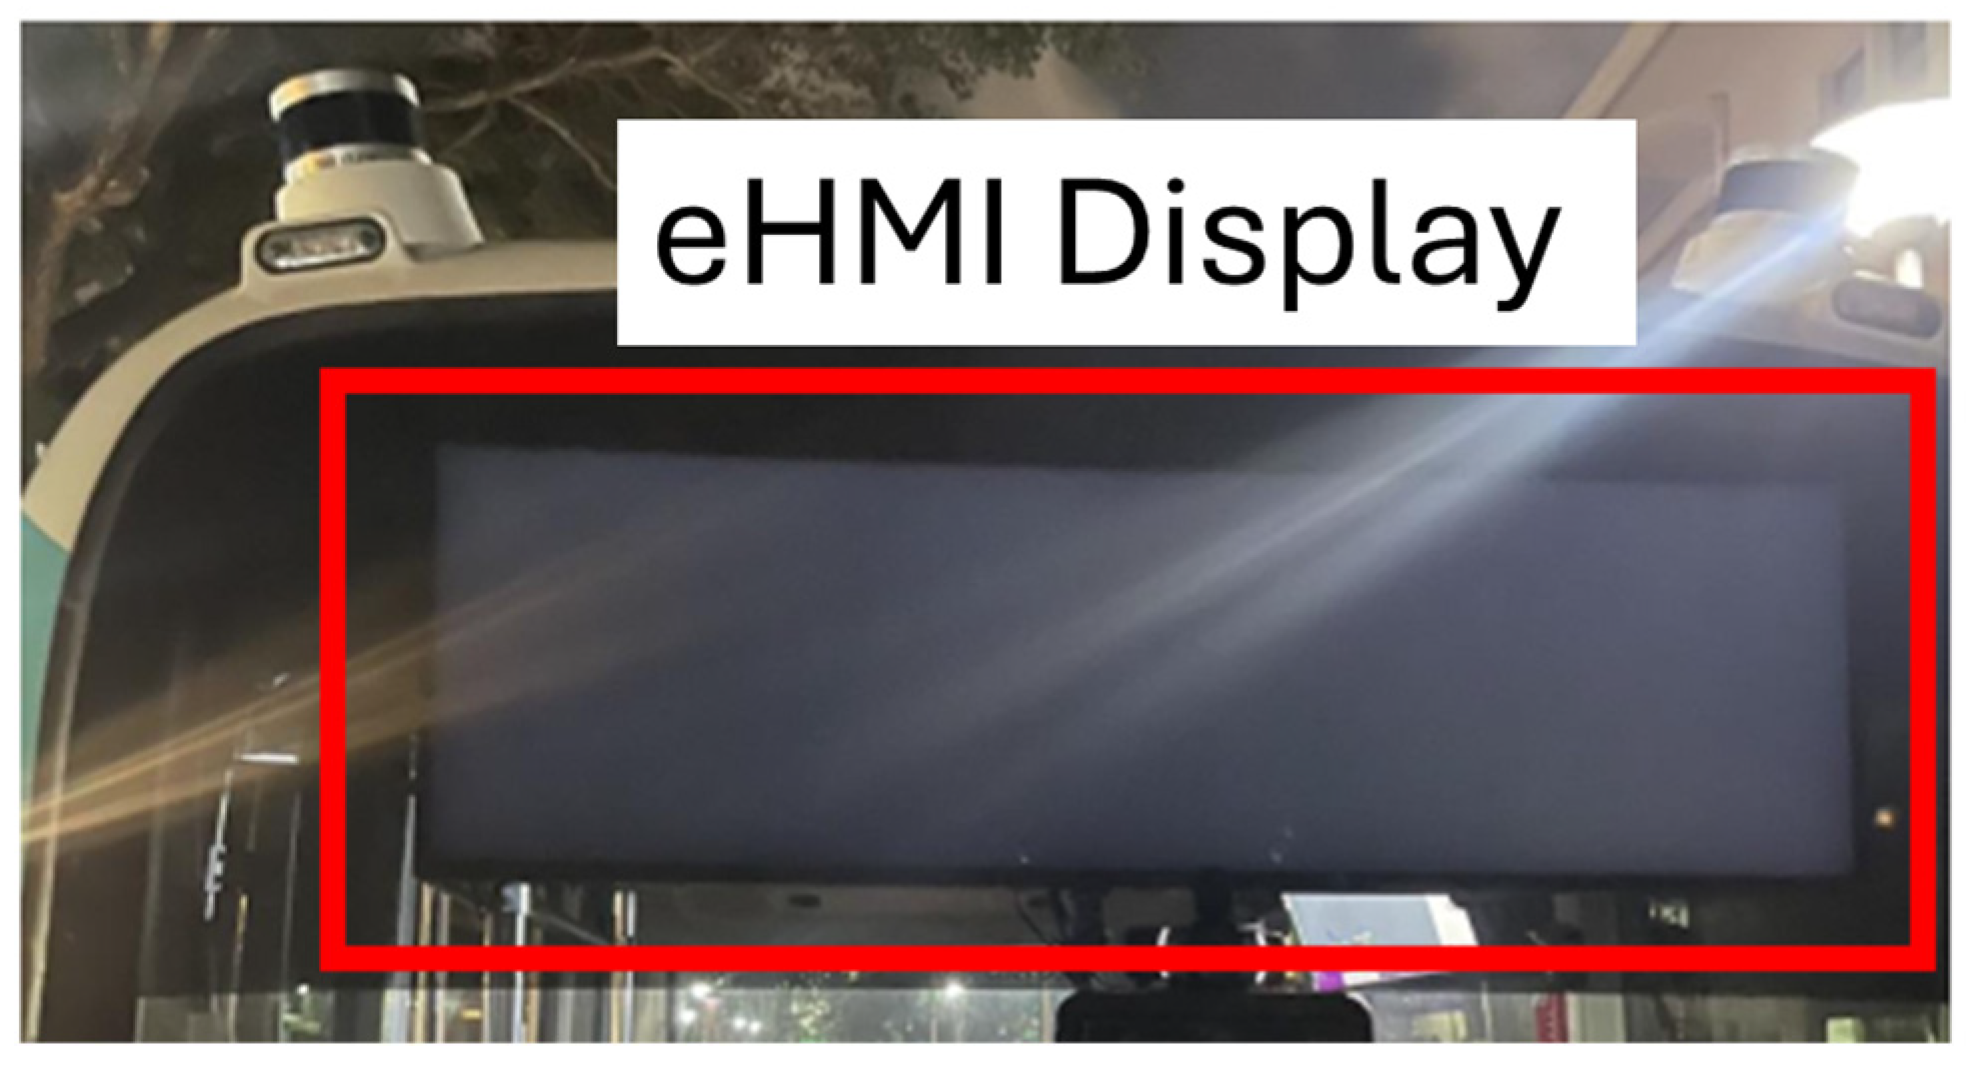
A real-world validation was conducted using a Level 3 EAV (Turing OPAL T2) equipped with a front monitor to display eHMIs, as shown in
Figure 4. Scenarios included the best-performing (green pedestrian “WALK”) and worst-performing (white “CROSS”) formats from the simulation, along with a no-eHMI condition.
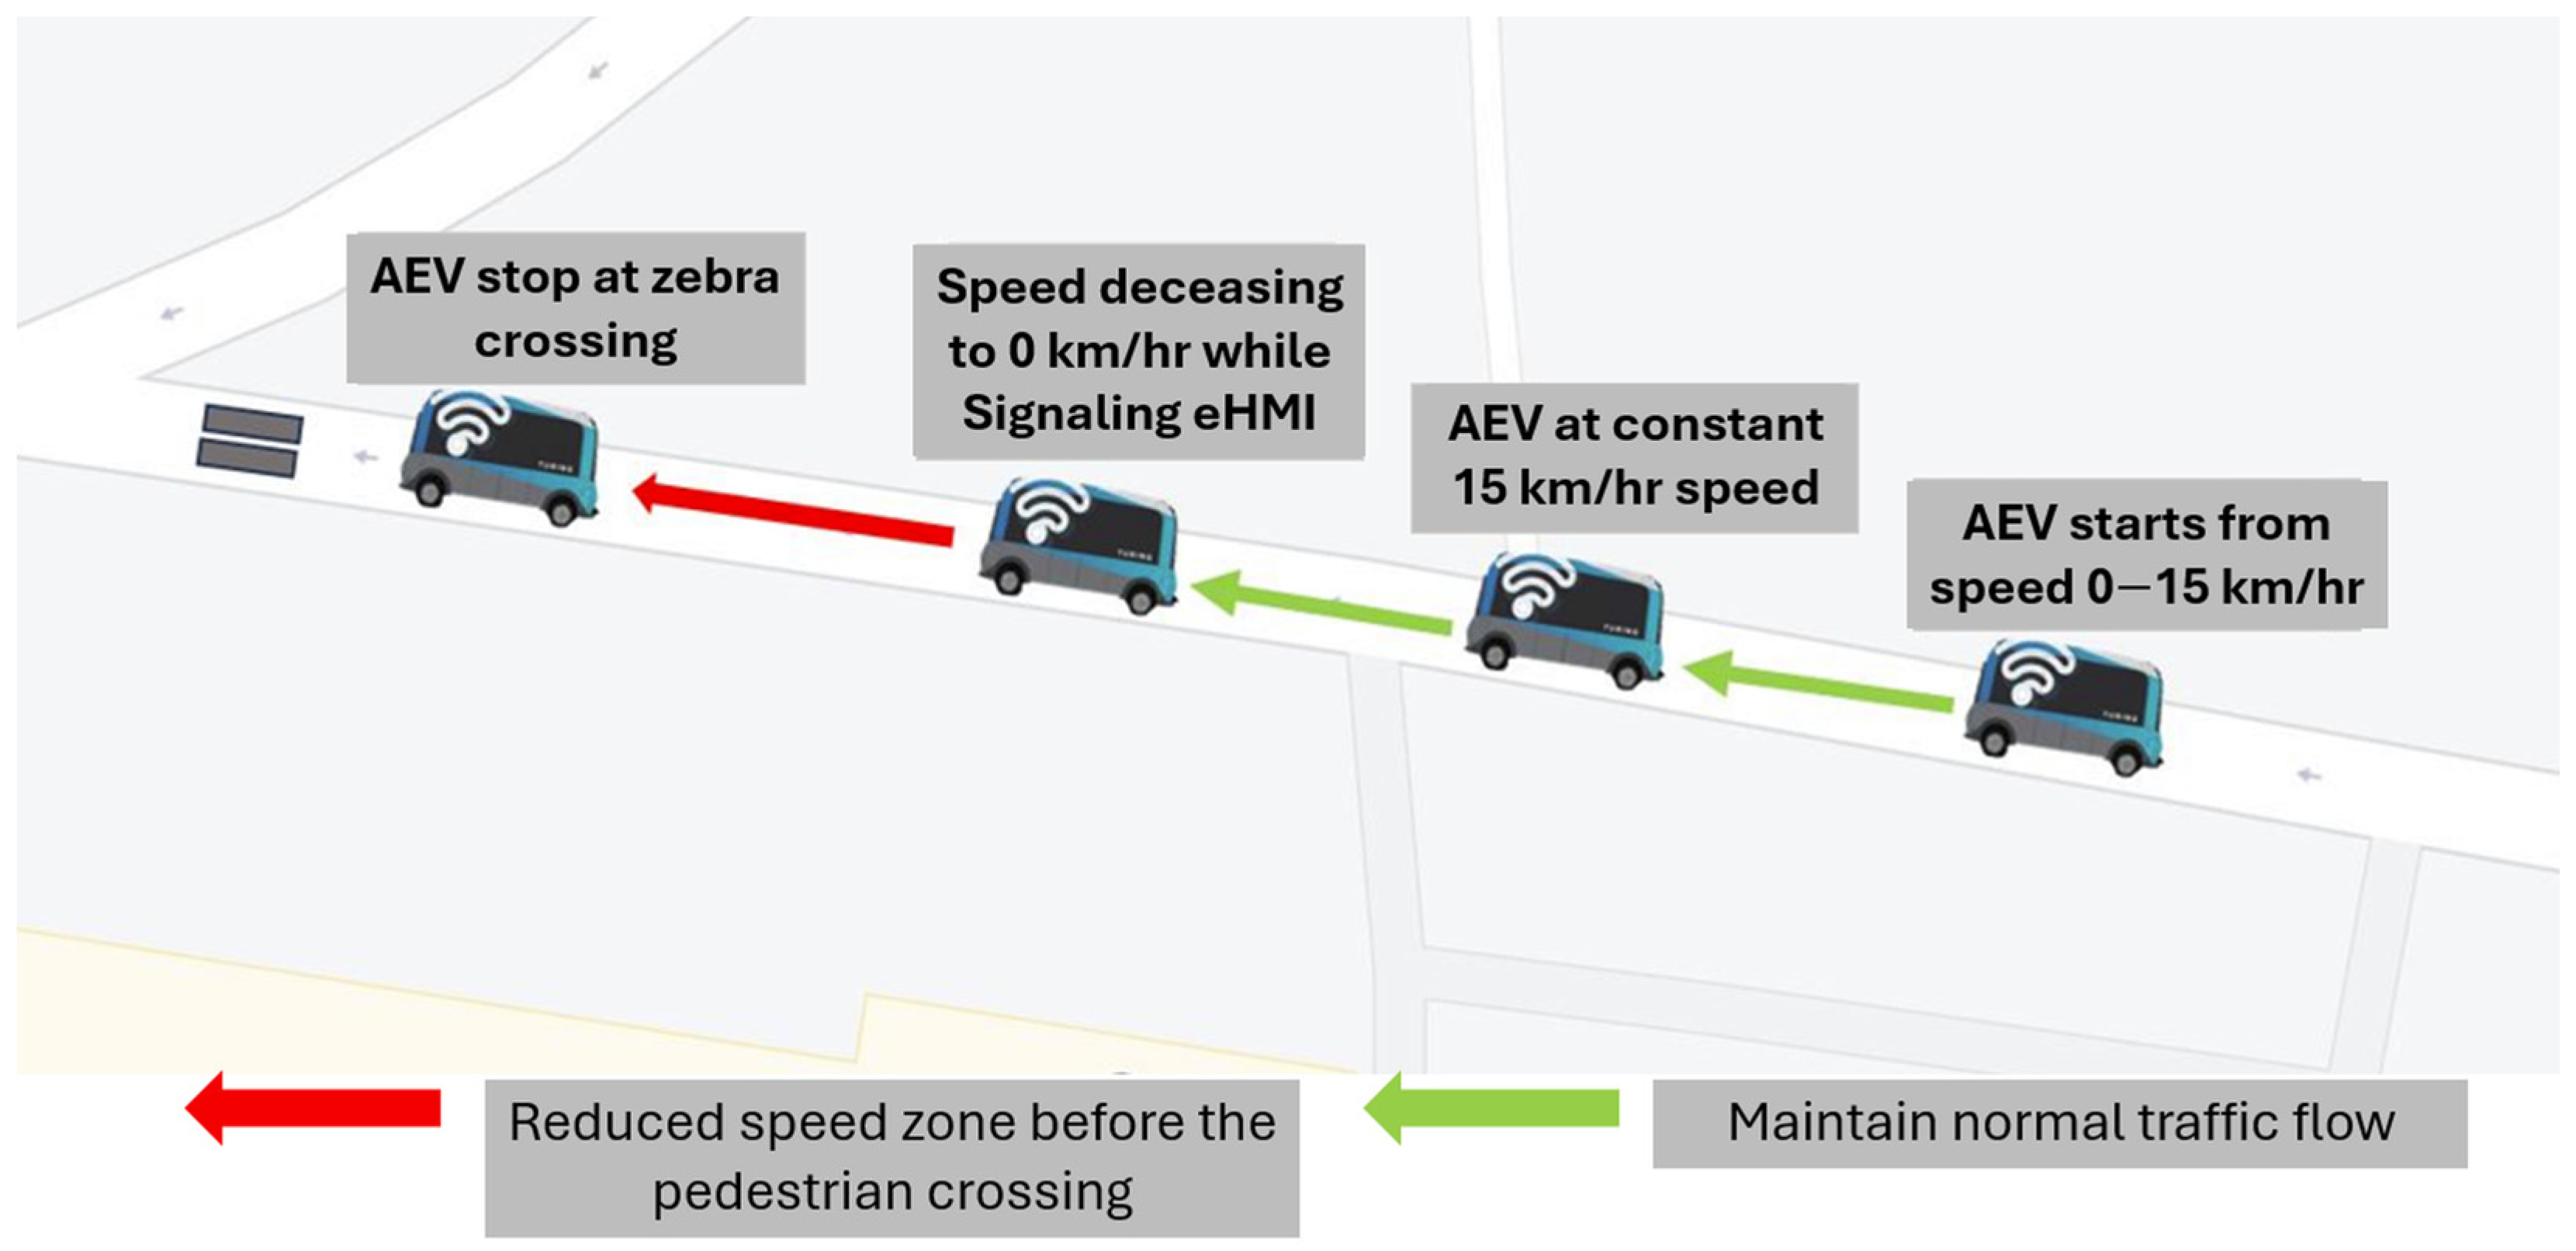
Due to safety and spatial constraints, the field vehicle traveled 50 m at 15 km/h. Testers stood 1 m from the zebra crossing and turned to observe the approaching vehicle upon cue. The movement and eHMI-based interaction setup is illustrated in
Figure 5. Two networked computers recorded keypress data and system timestamps, synchronized via Unix format.
The term ‘turnaround time’ refers to the moment at which the EAV completed its turning motion and began facing the pedestrian path. This event was recorded using synchronized Global Positioning System (GPS) timestamps and onboard video footage. The eHMI activation was triggered immediately after this point to align the signal with the vehicle’s yielding behavior.
The eHMI was displayed immediately after the vehicle completed its turning maneuver and began decelerating toward the pedestrian zone. This timing ensured that the eHMI content would reflect the vehicle’s intention to yield after the turn had been completed, preventing ambiguity between vehicle motion and display signaling. This sequence was designed to simulate realistic interactions at intersections and enhance ecological validity.
A Transmission Control Protocol (TCP) connection and 5G Customer Premises Equipment (CPE) device were employed to minimize latency in system response and synchronization, achieving average network delays of 4 ms, 26 ms, and 21 ms during testing.
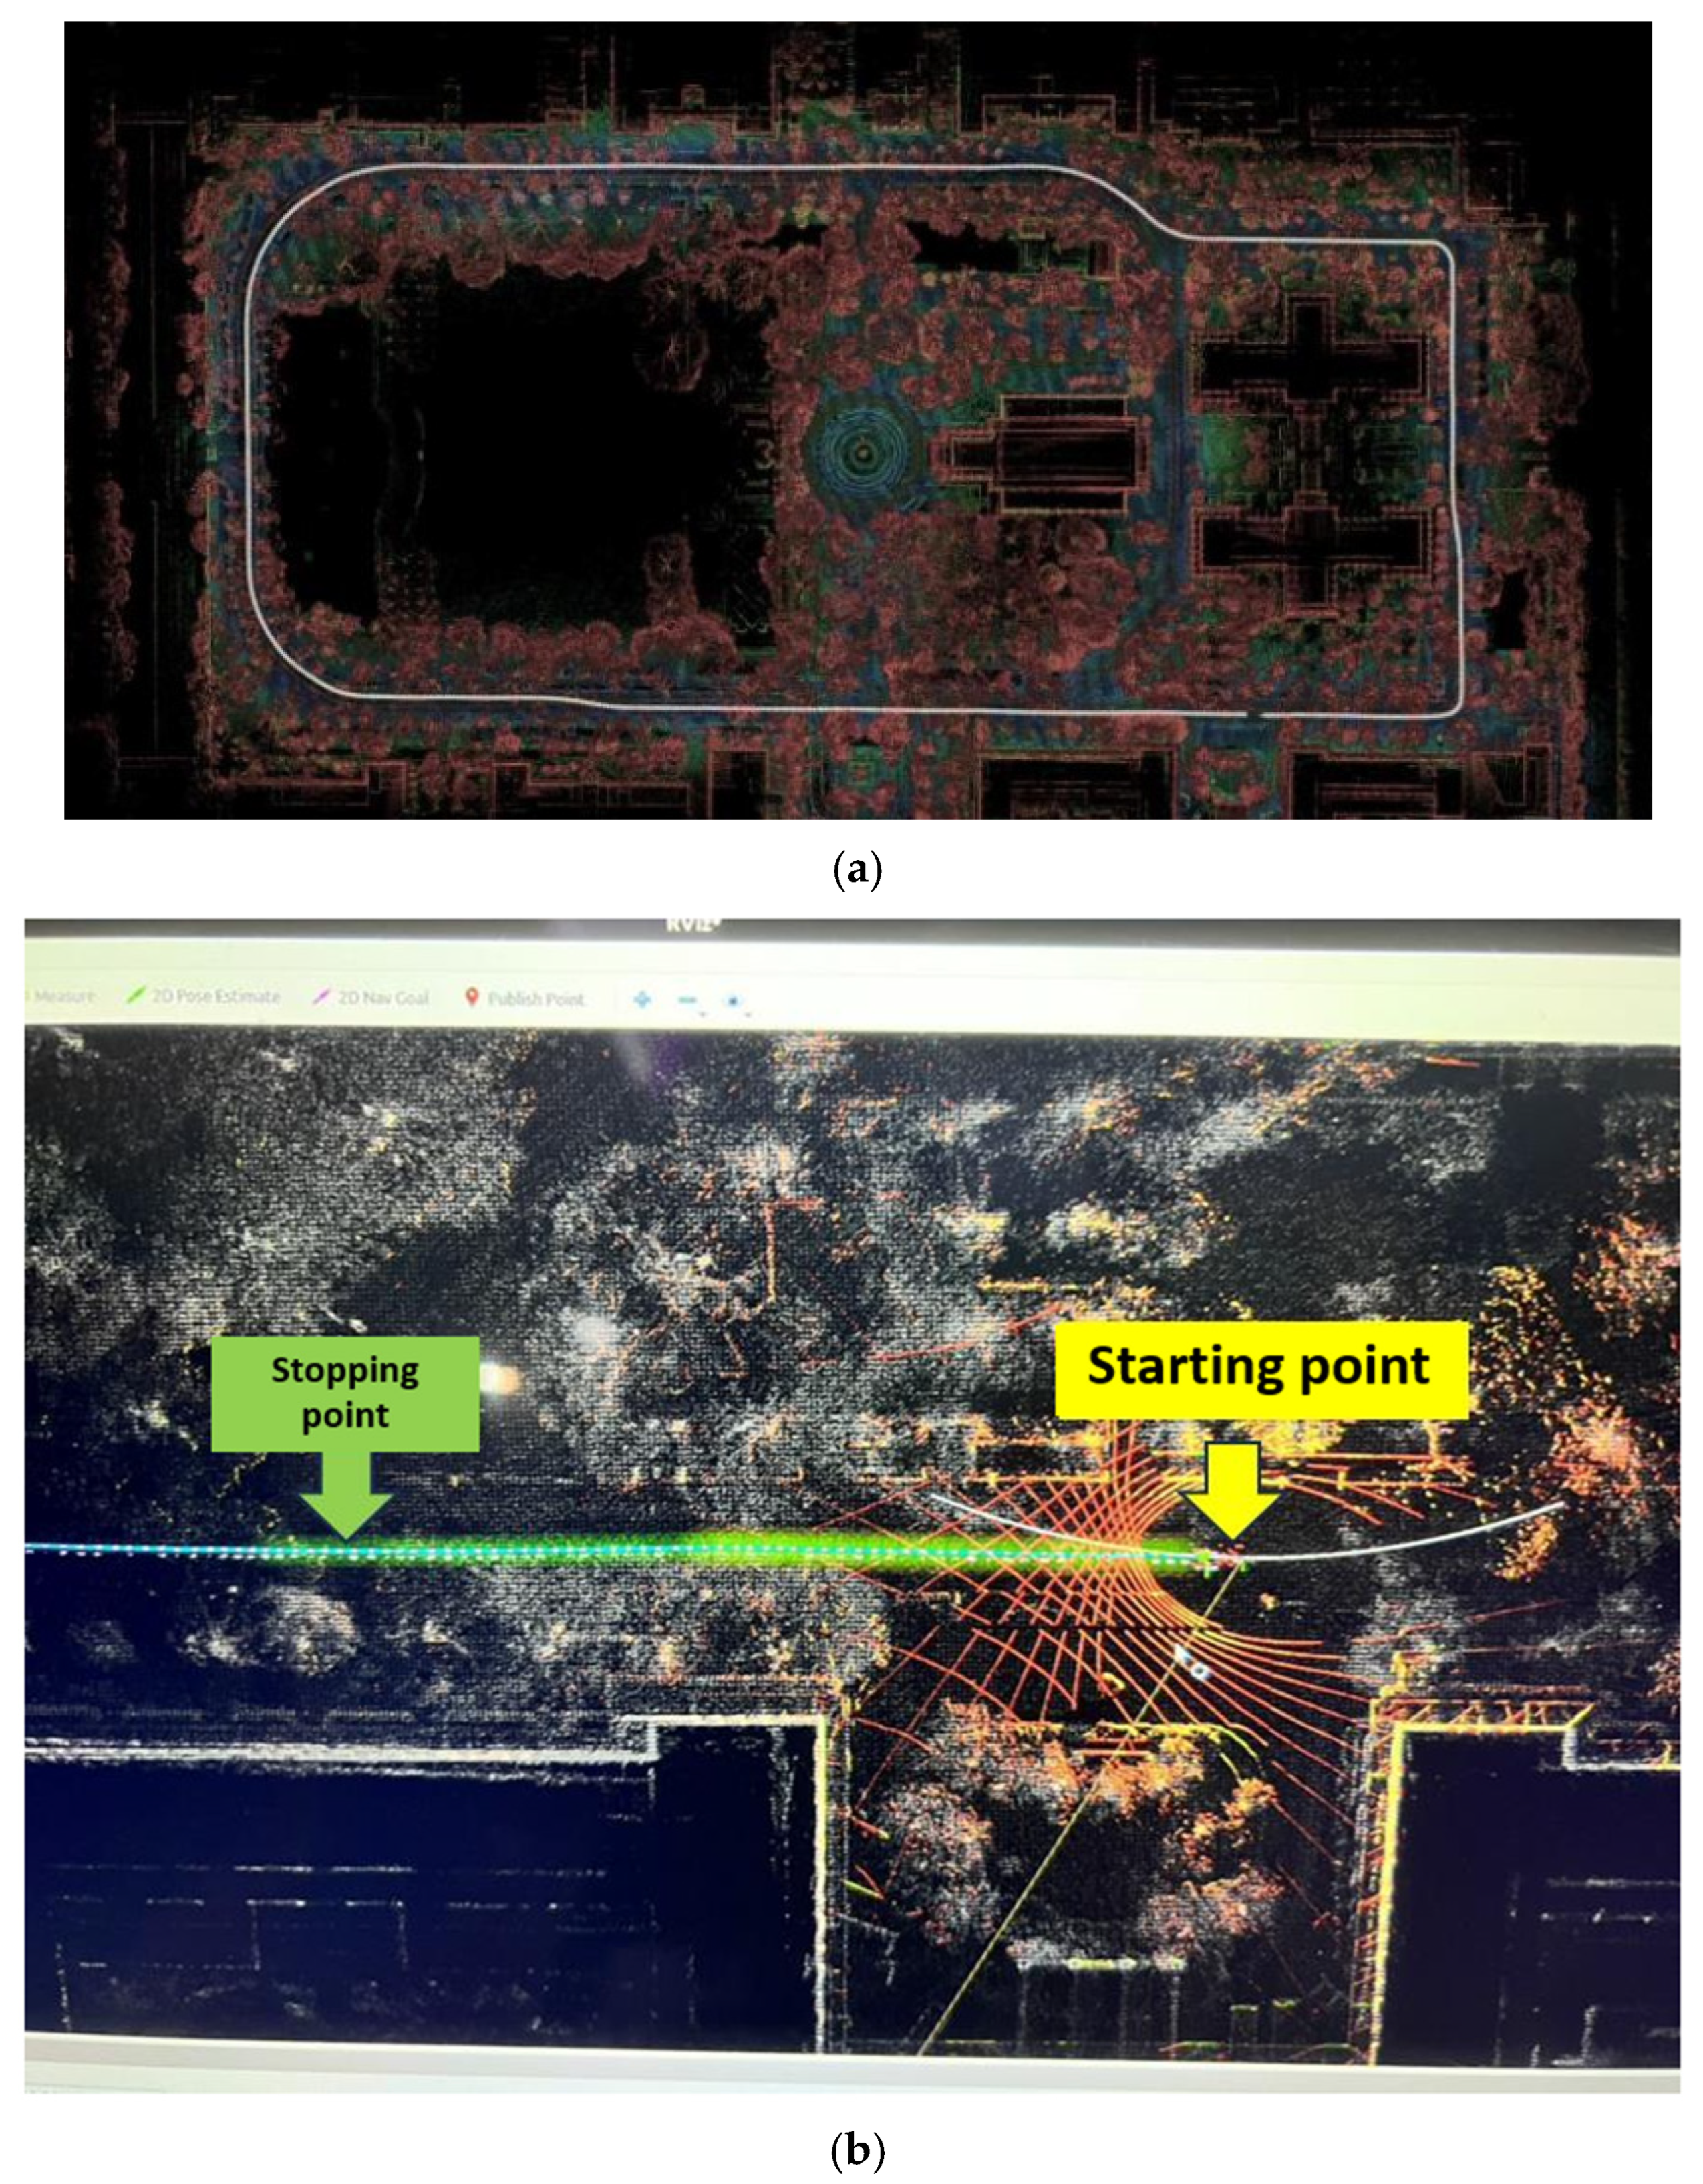
Figure 6 presents the waypoint layouts used in this study’s field testing.
Figure 6a shows the original waypoint map provided by the university’s research center, replicating the Chulalongkorn University campus road layout for autonomous vehicle navigation. For this experiment, the route was modified, as shown in
Figure 6b, to create a controlled 50 m test track. This adjustment ensured the EAV could accelerate from 0 to 15 km/h before the interaction zone. The final 16 m before the crosswalk were designated for controlled deceleration at −1 m/s
2 while the eHMI prompt was displayed to the pedestrian positioned 1 m from the stopping point. This setup enabled repeatable, safe, and scenario-specific evaluation of pedestrian comprehension of the eHMI under real-world conditions.
Although the field test procedure differed from the simulation in terms of vehicle speed and distance, the cognitive task, interpreting eHMI displays, remained consistent. The goal was not procedural replication but verification of comprehension ranking consistency across modalities. The strong similarity in response patterns supports the simulation’s predictive validity.
4. Discussions
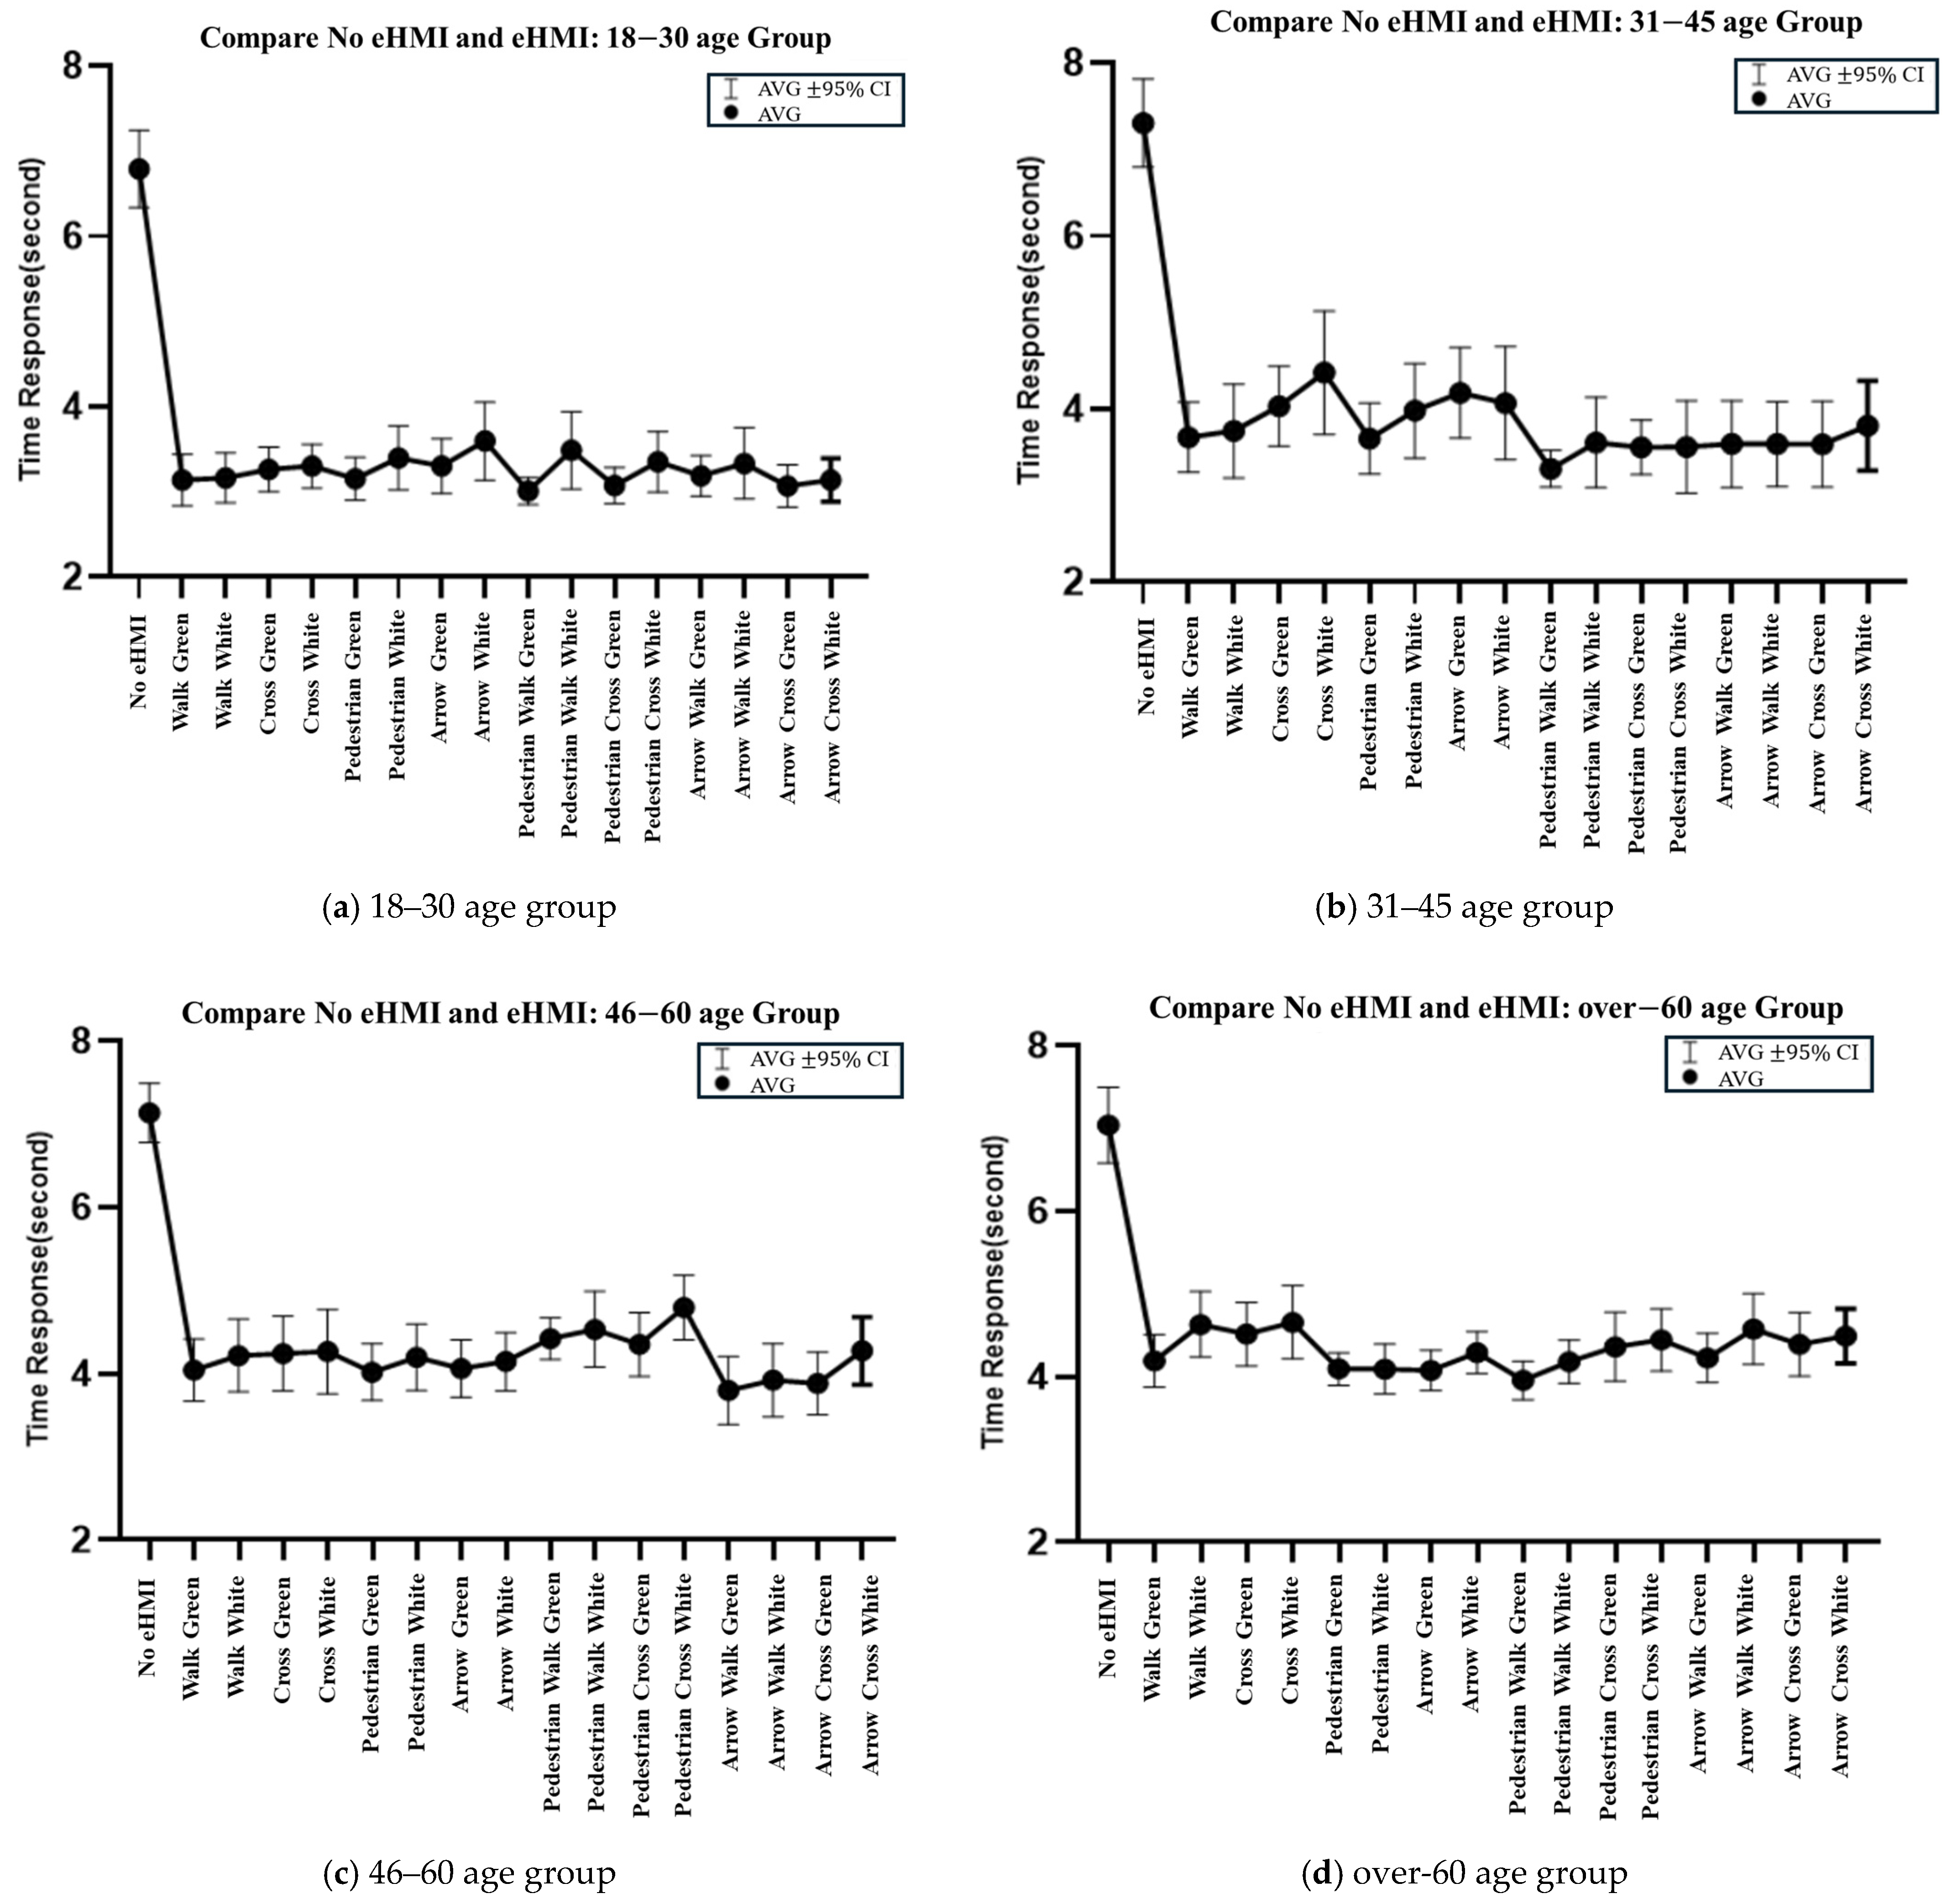
The findings from the simulation experiment confirm that eHMIs significantly enhance pedestrian comprehension of EAV intentions, supporting the study’s hypothesis that visual cues improve message clarity compared to vehicle kinematics alone. Across all tested conditions, participants exposed to eHMIs consistently demonstrated faster comprehension times than those in no-eHMI scenarios, aligning with prior studies that emphasize the communicative potential of visual displays in EAV–pedestrian interactions [
23,
24,
25].
While comprehension time differences between eHMI formats were observed, the semi-randomized presentation order was implemented to minimize potential bias caused by learning or fatigue. This helped ensure that differences in comprehension speed could be attributed to the eHMI characteristics themselves rather than to order effects.
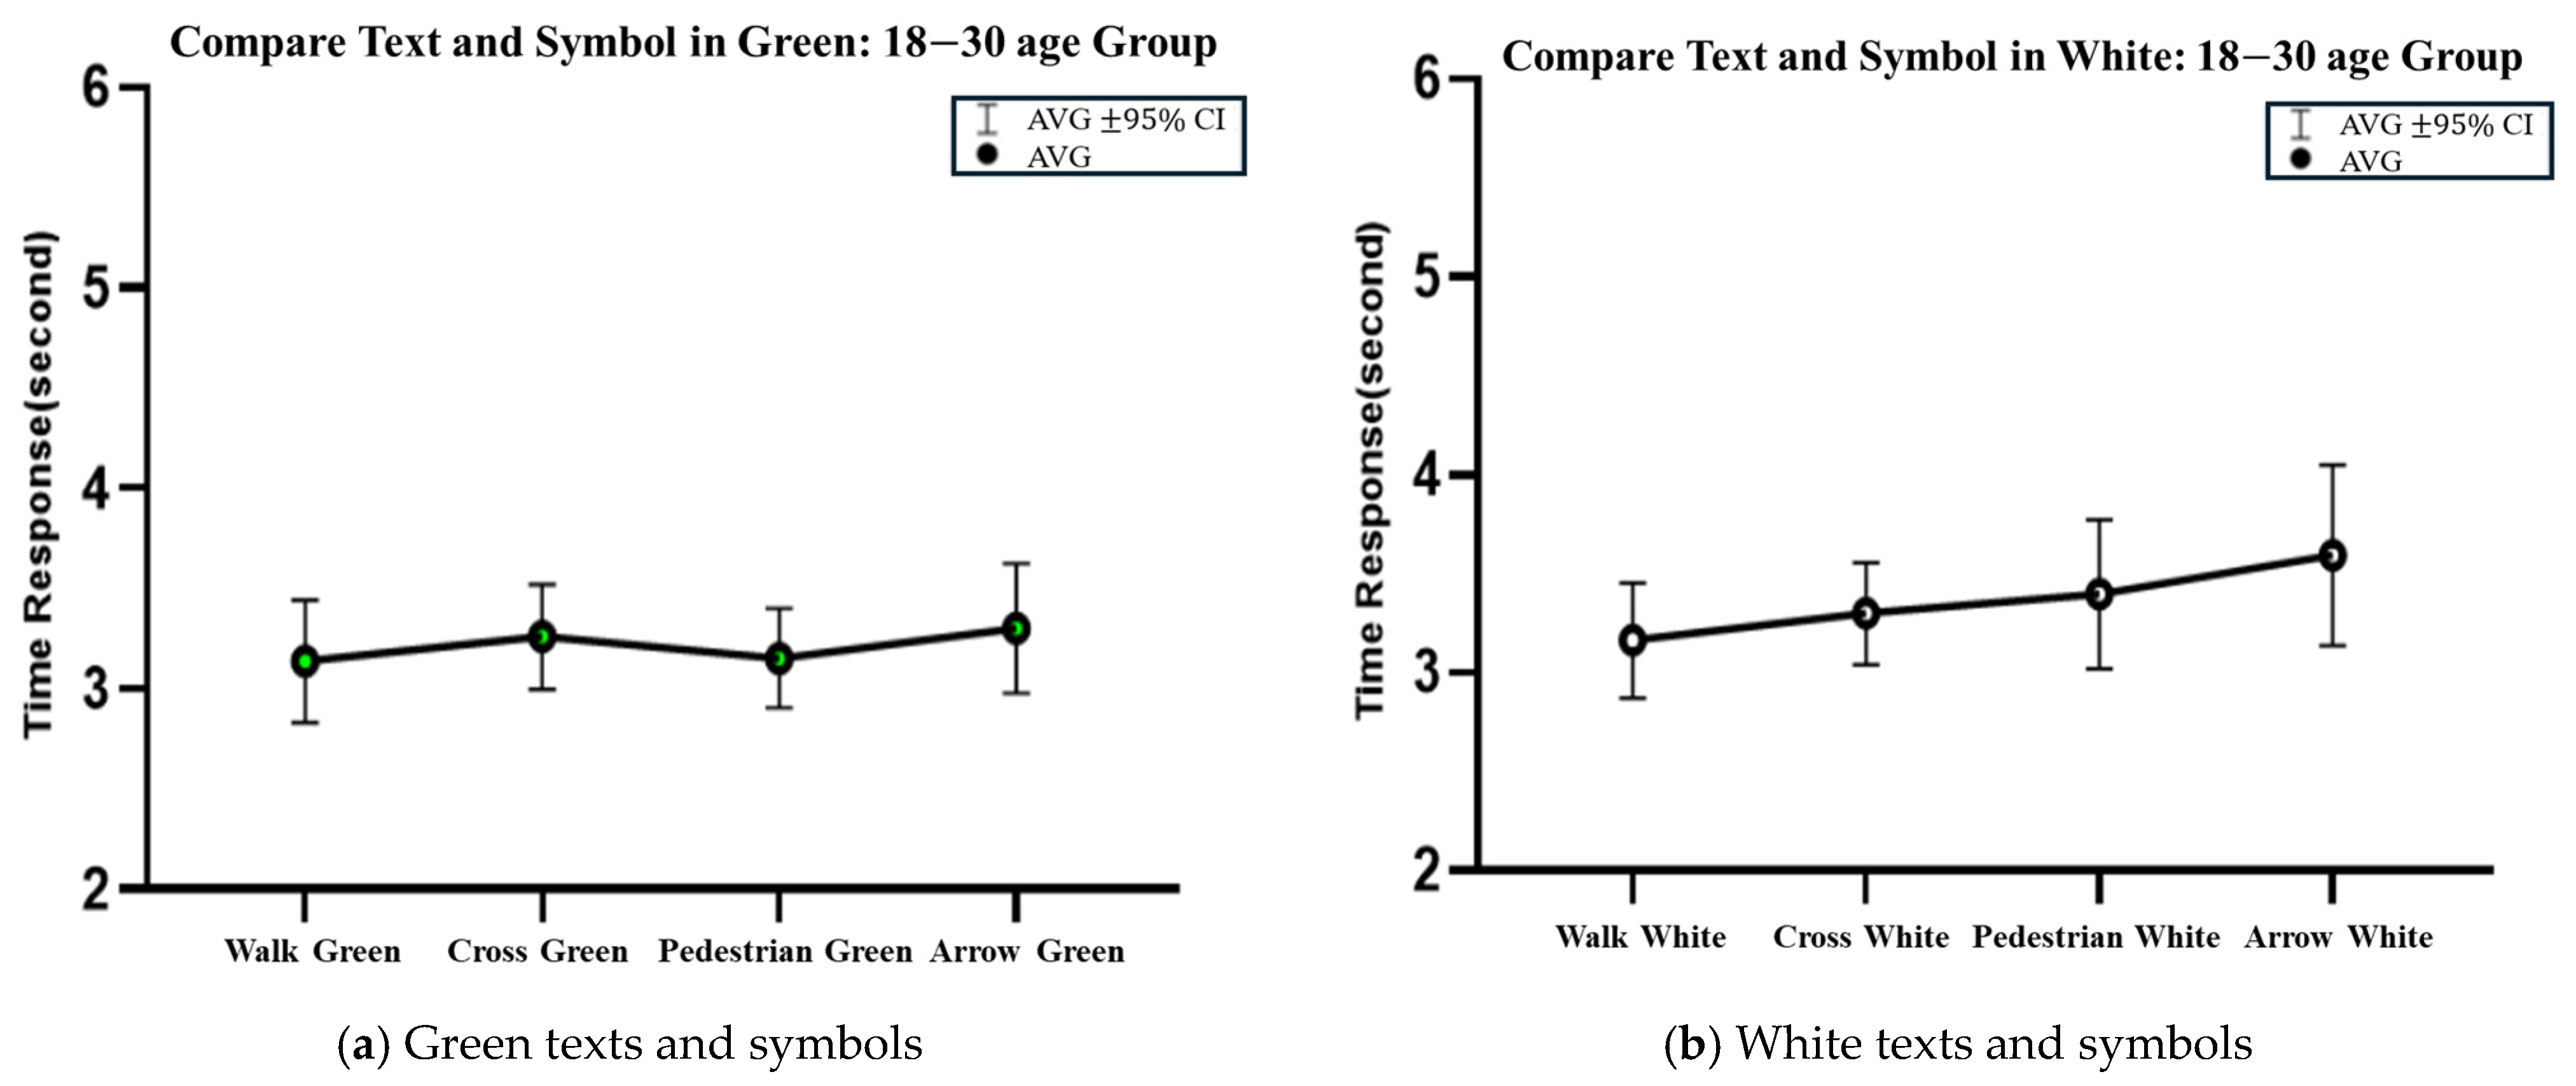
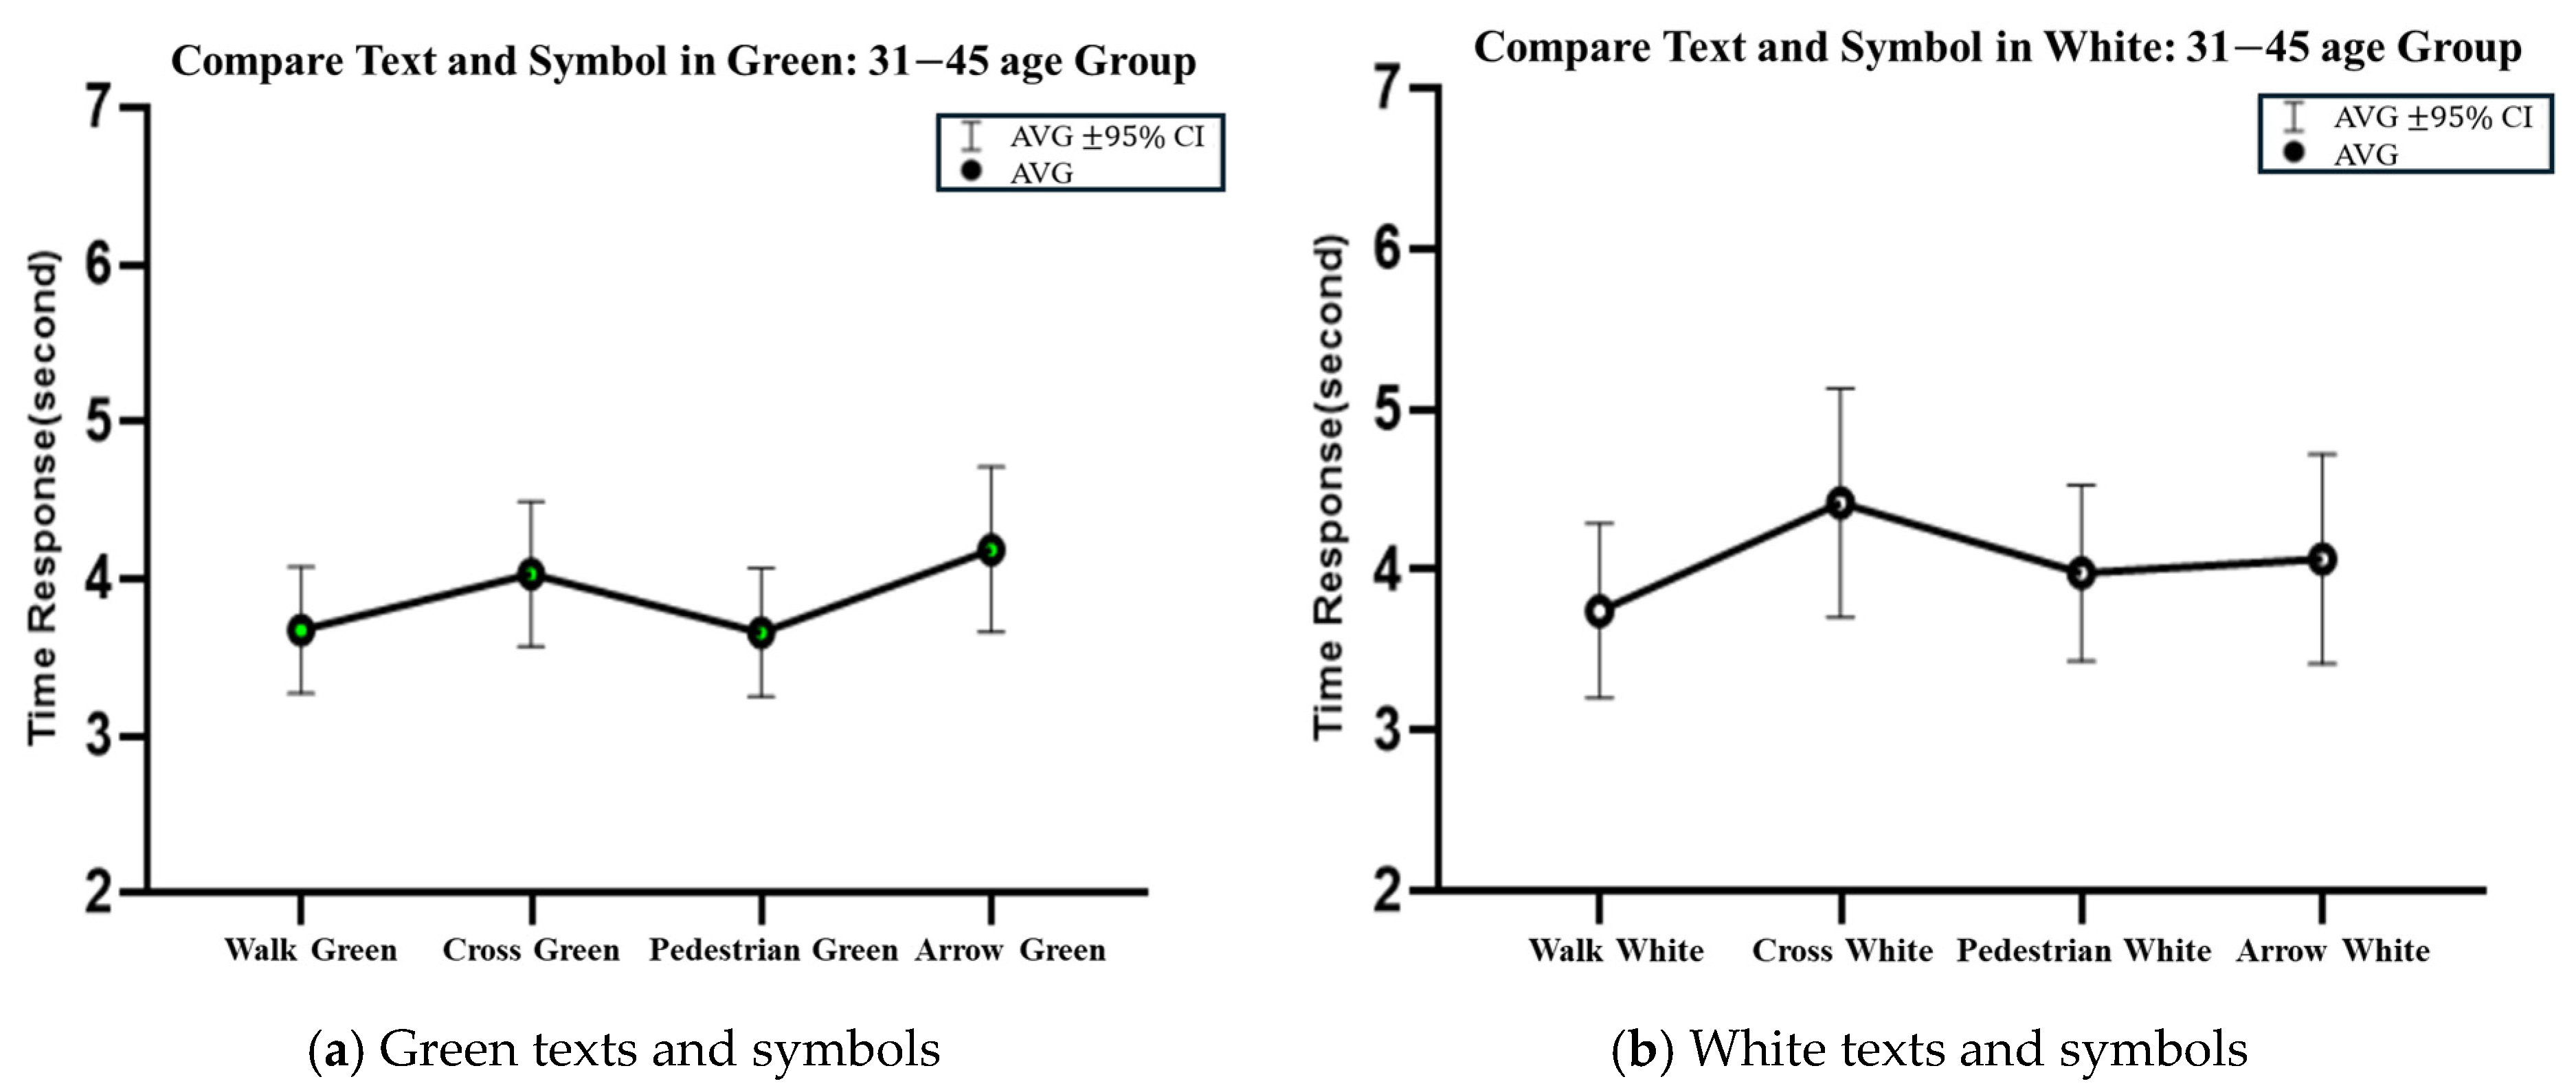
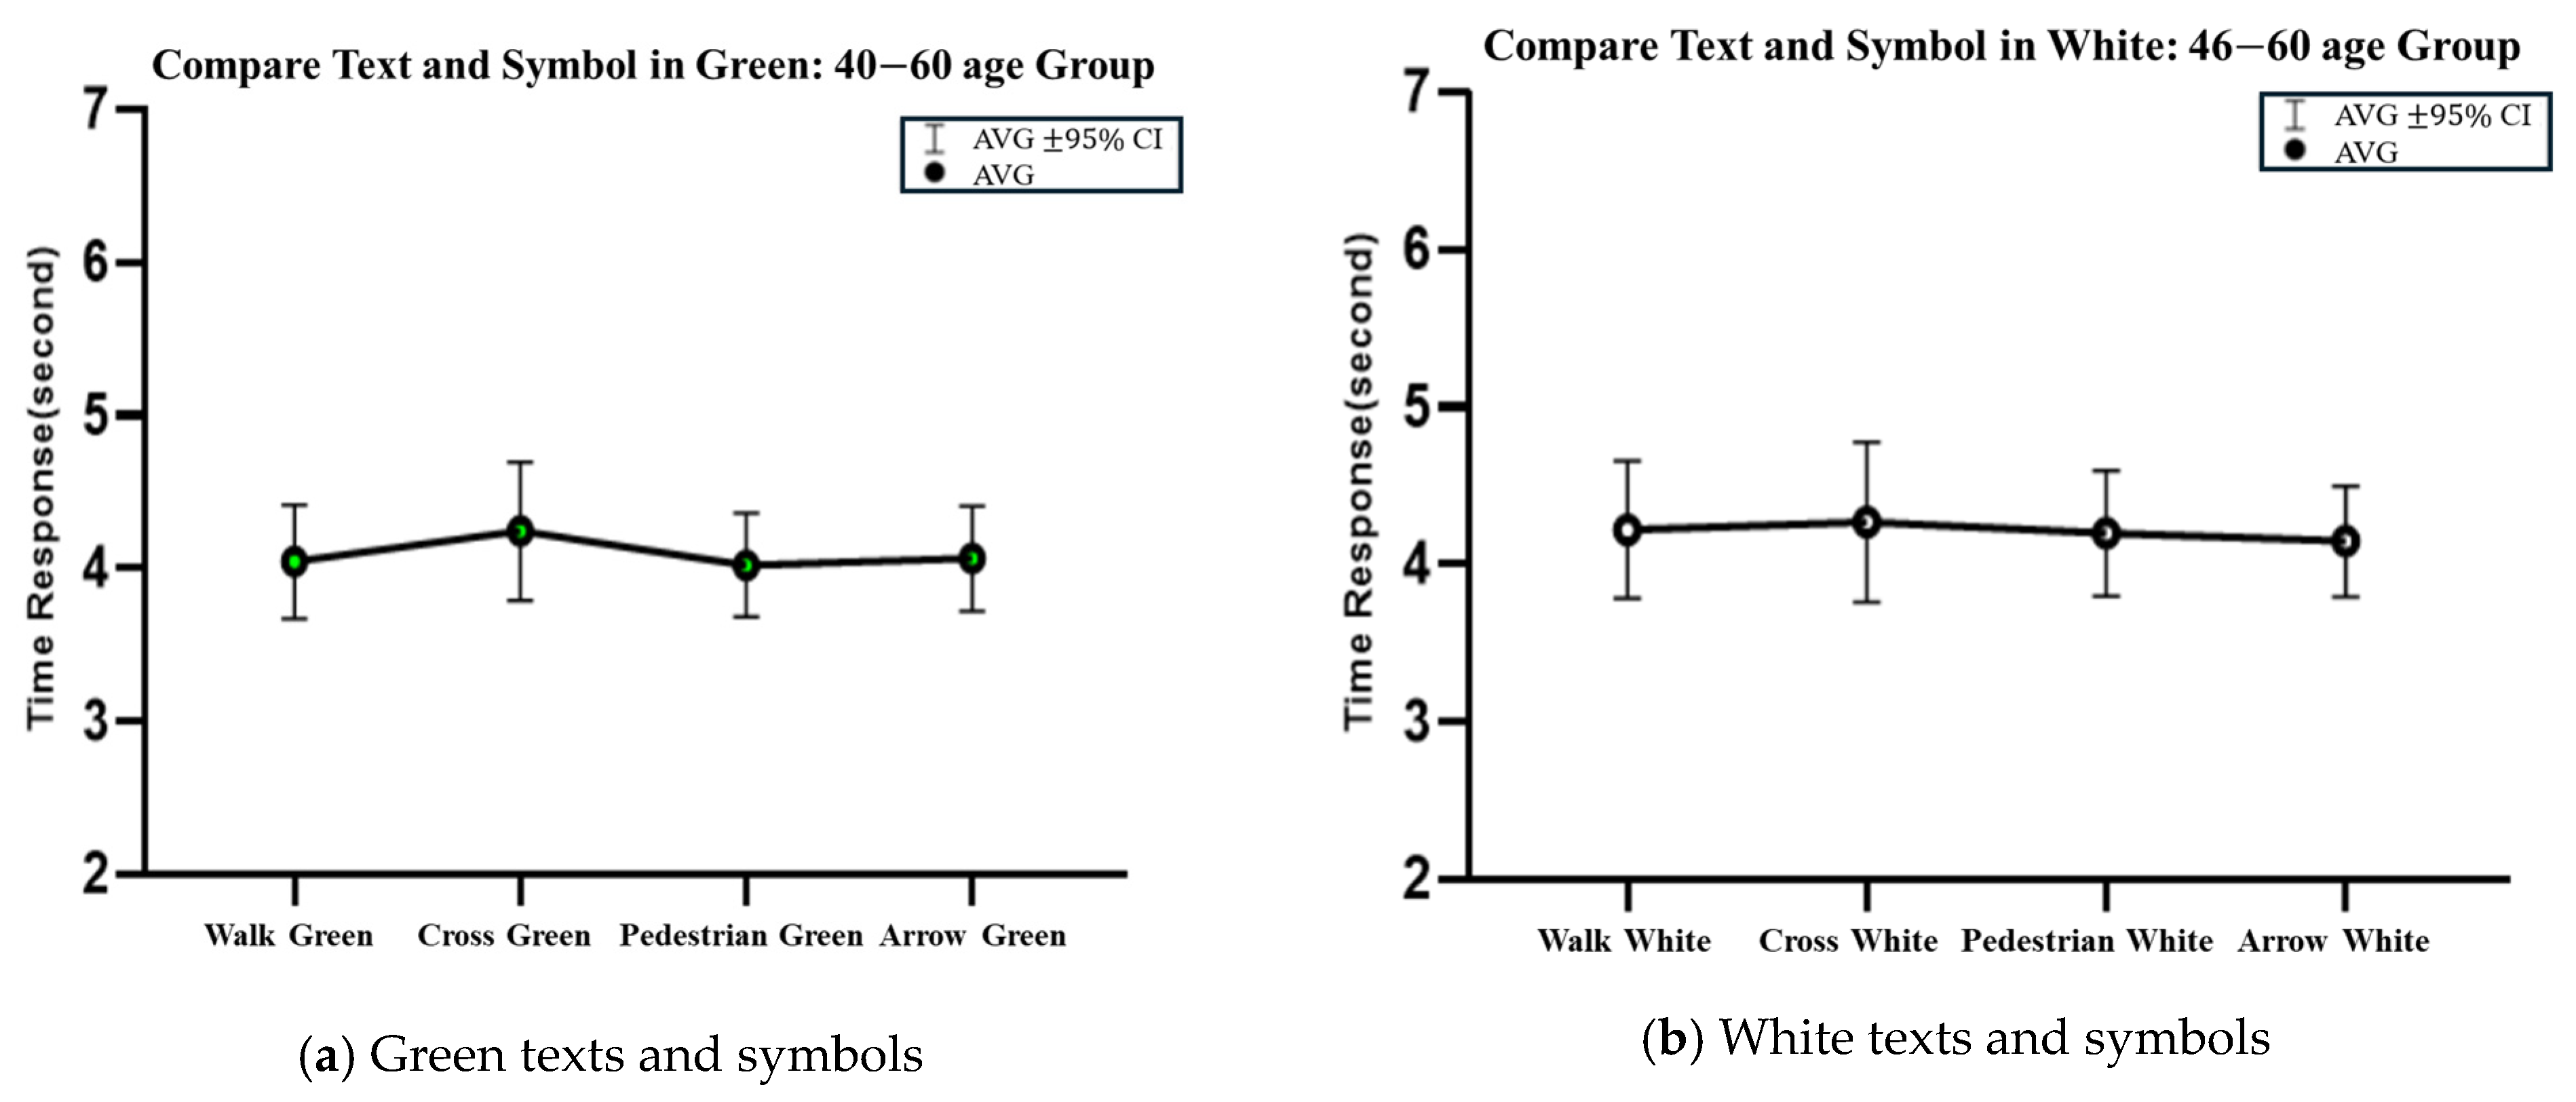
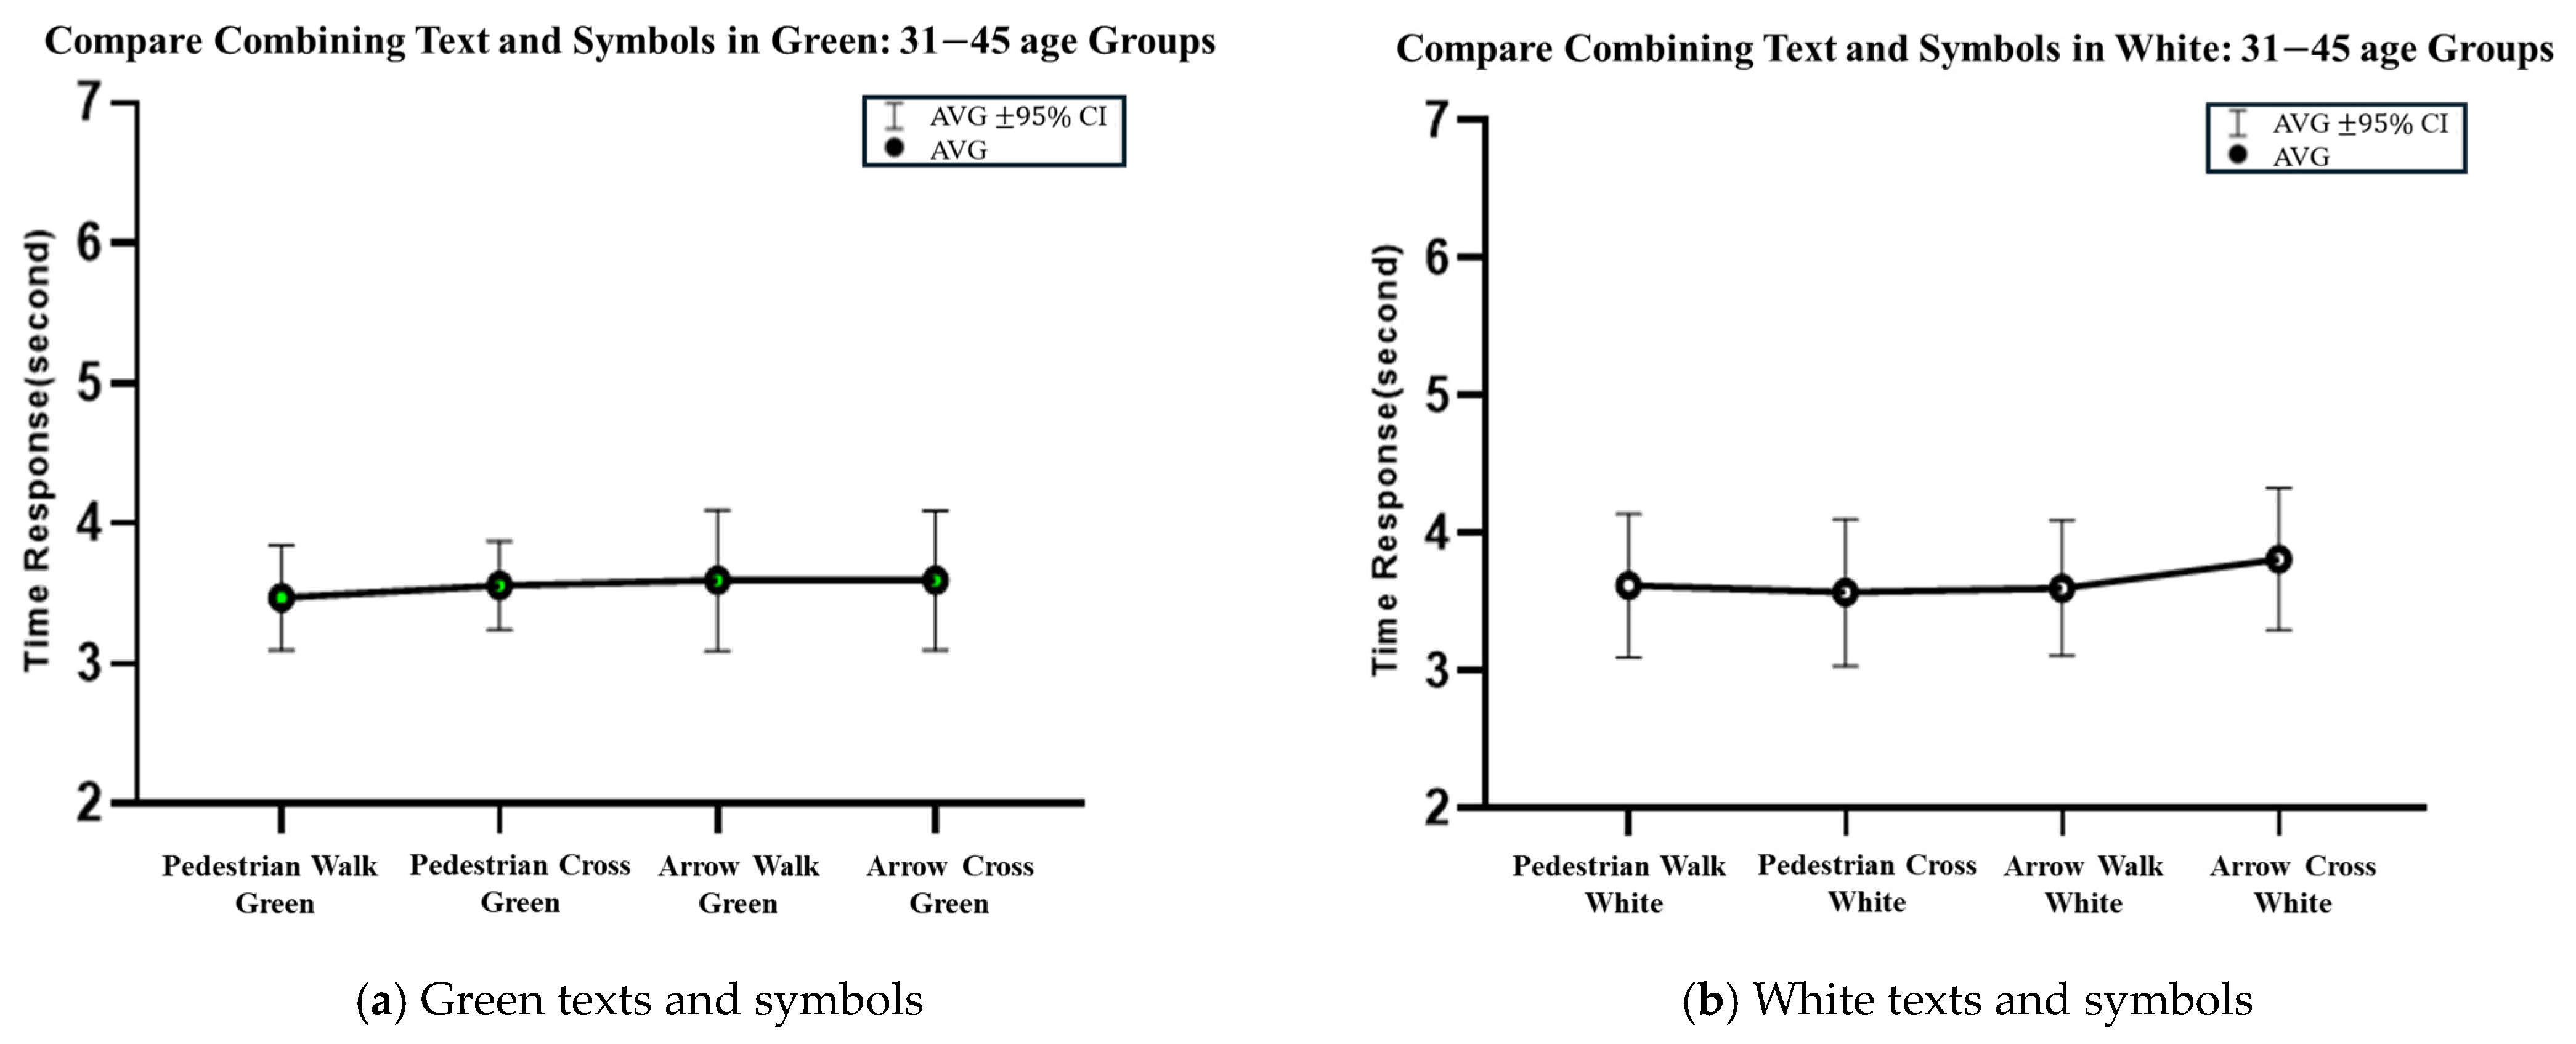
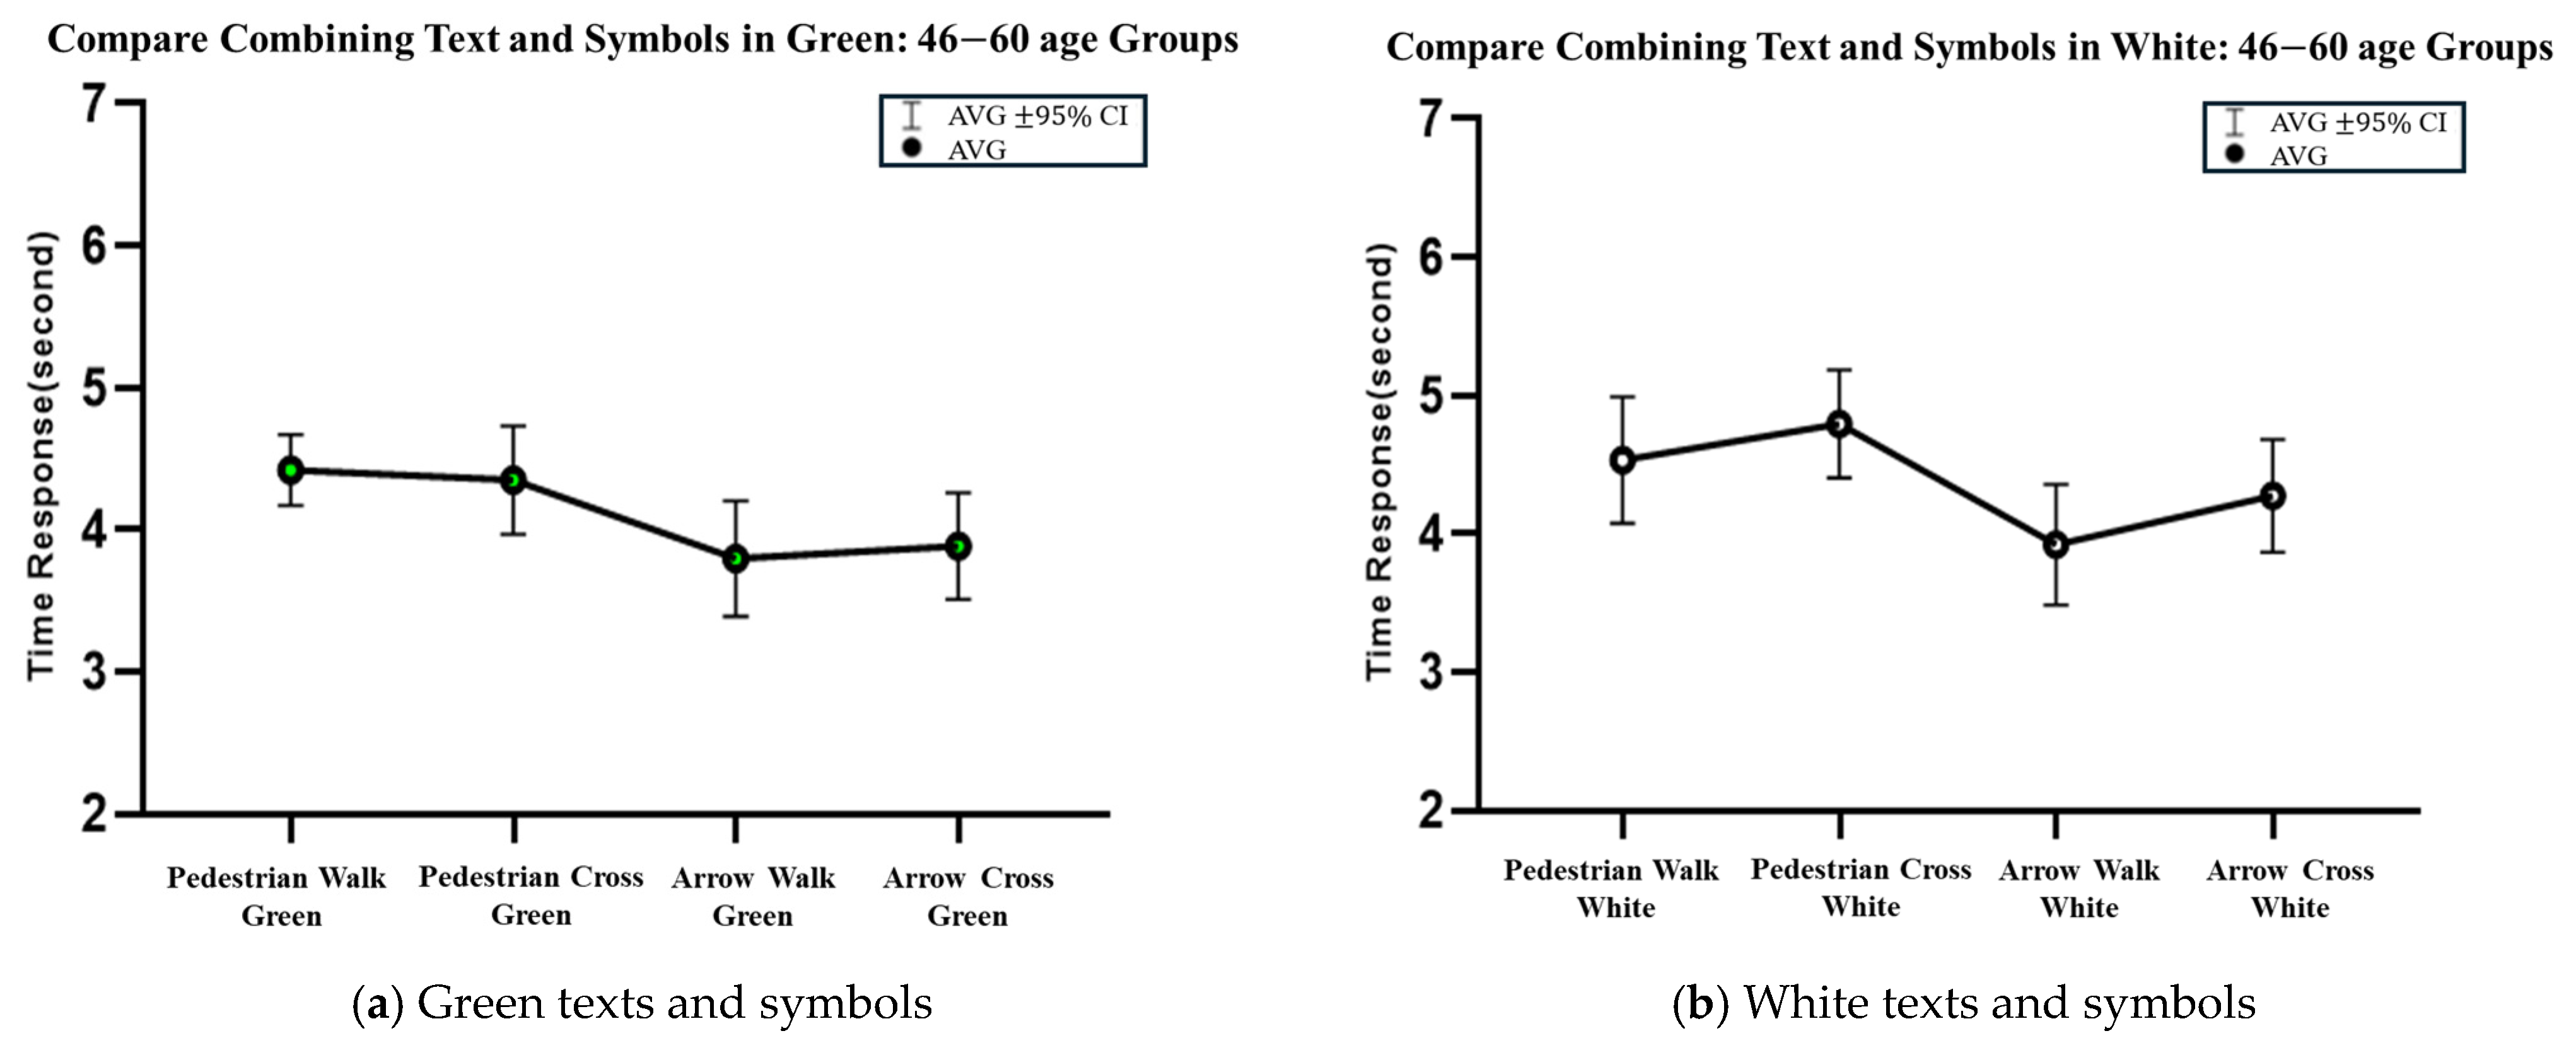
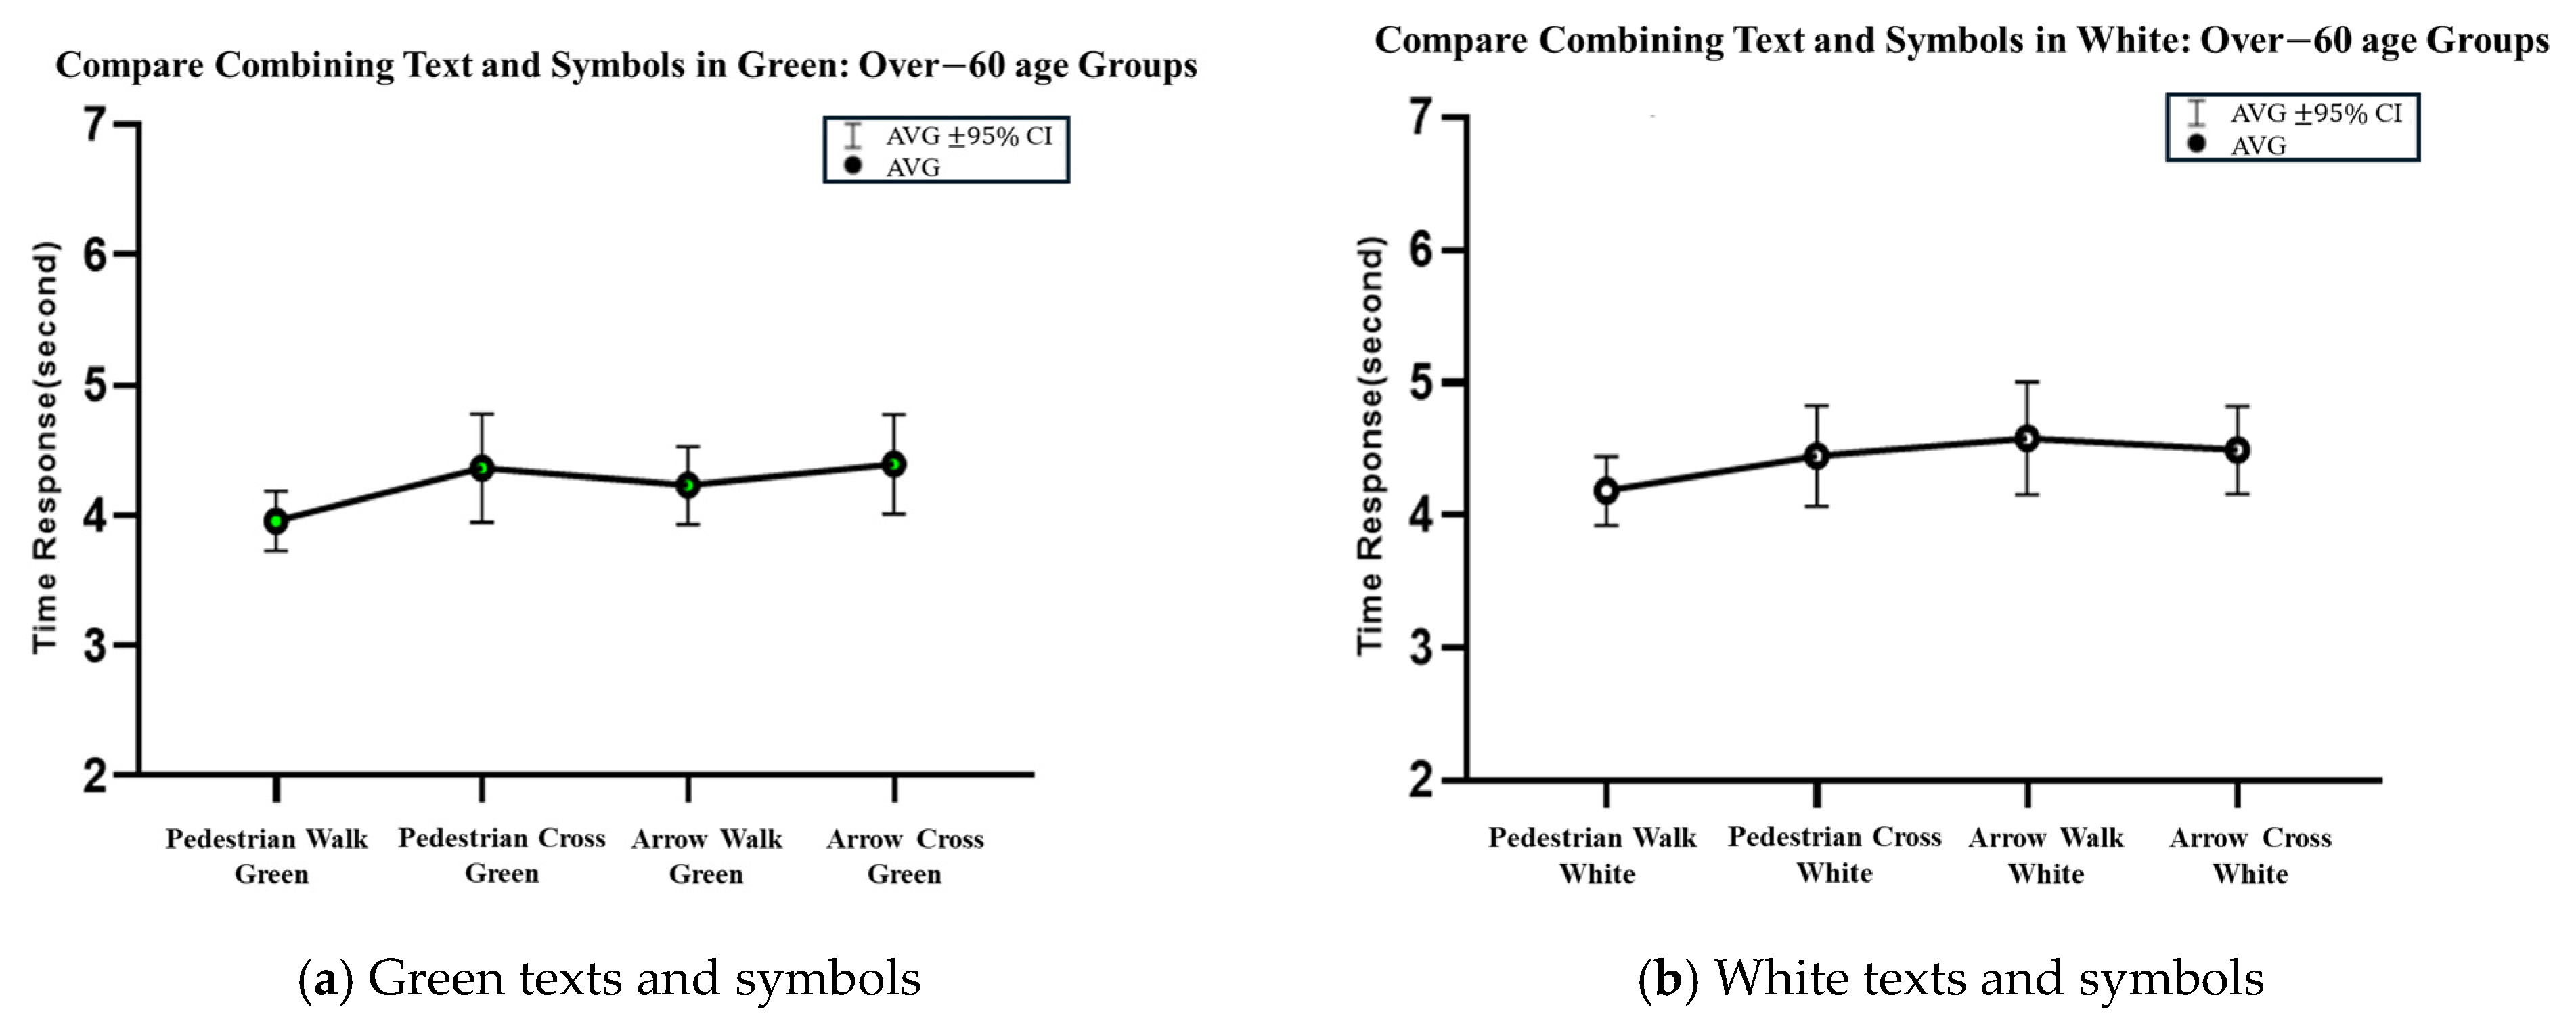
Age-related differences in performance were particularly notable. The 18–30 and 31–45 age groups responded swiftly and consistently across eHMI formats, whereas participants over 60 exhibited delayed responses and greater variability. These outcomes are consistent with prior research on cognitive aging, which highlights age-related decline in visual processing speed, motion perception, and contrast sensitivity, factors that directly affect how older pedestrians interpret road signals [
26,
27]. Furthermore, Dommes et al. [
28] found that older pedestrians exhibit more cautious and hesitant behavior in EAV crossing situations, especially in unfamiliar or ambiguous contexts, suggesting that intuitive eHMI design is critical for this demographic.
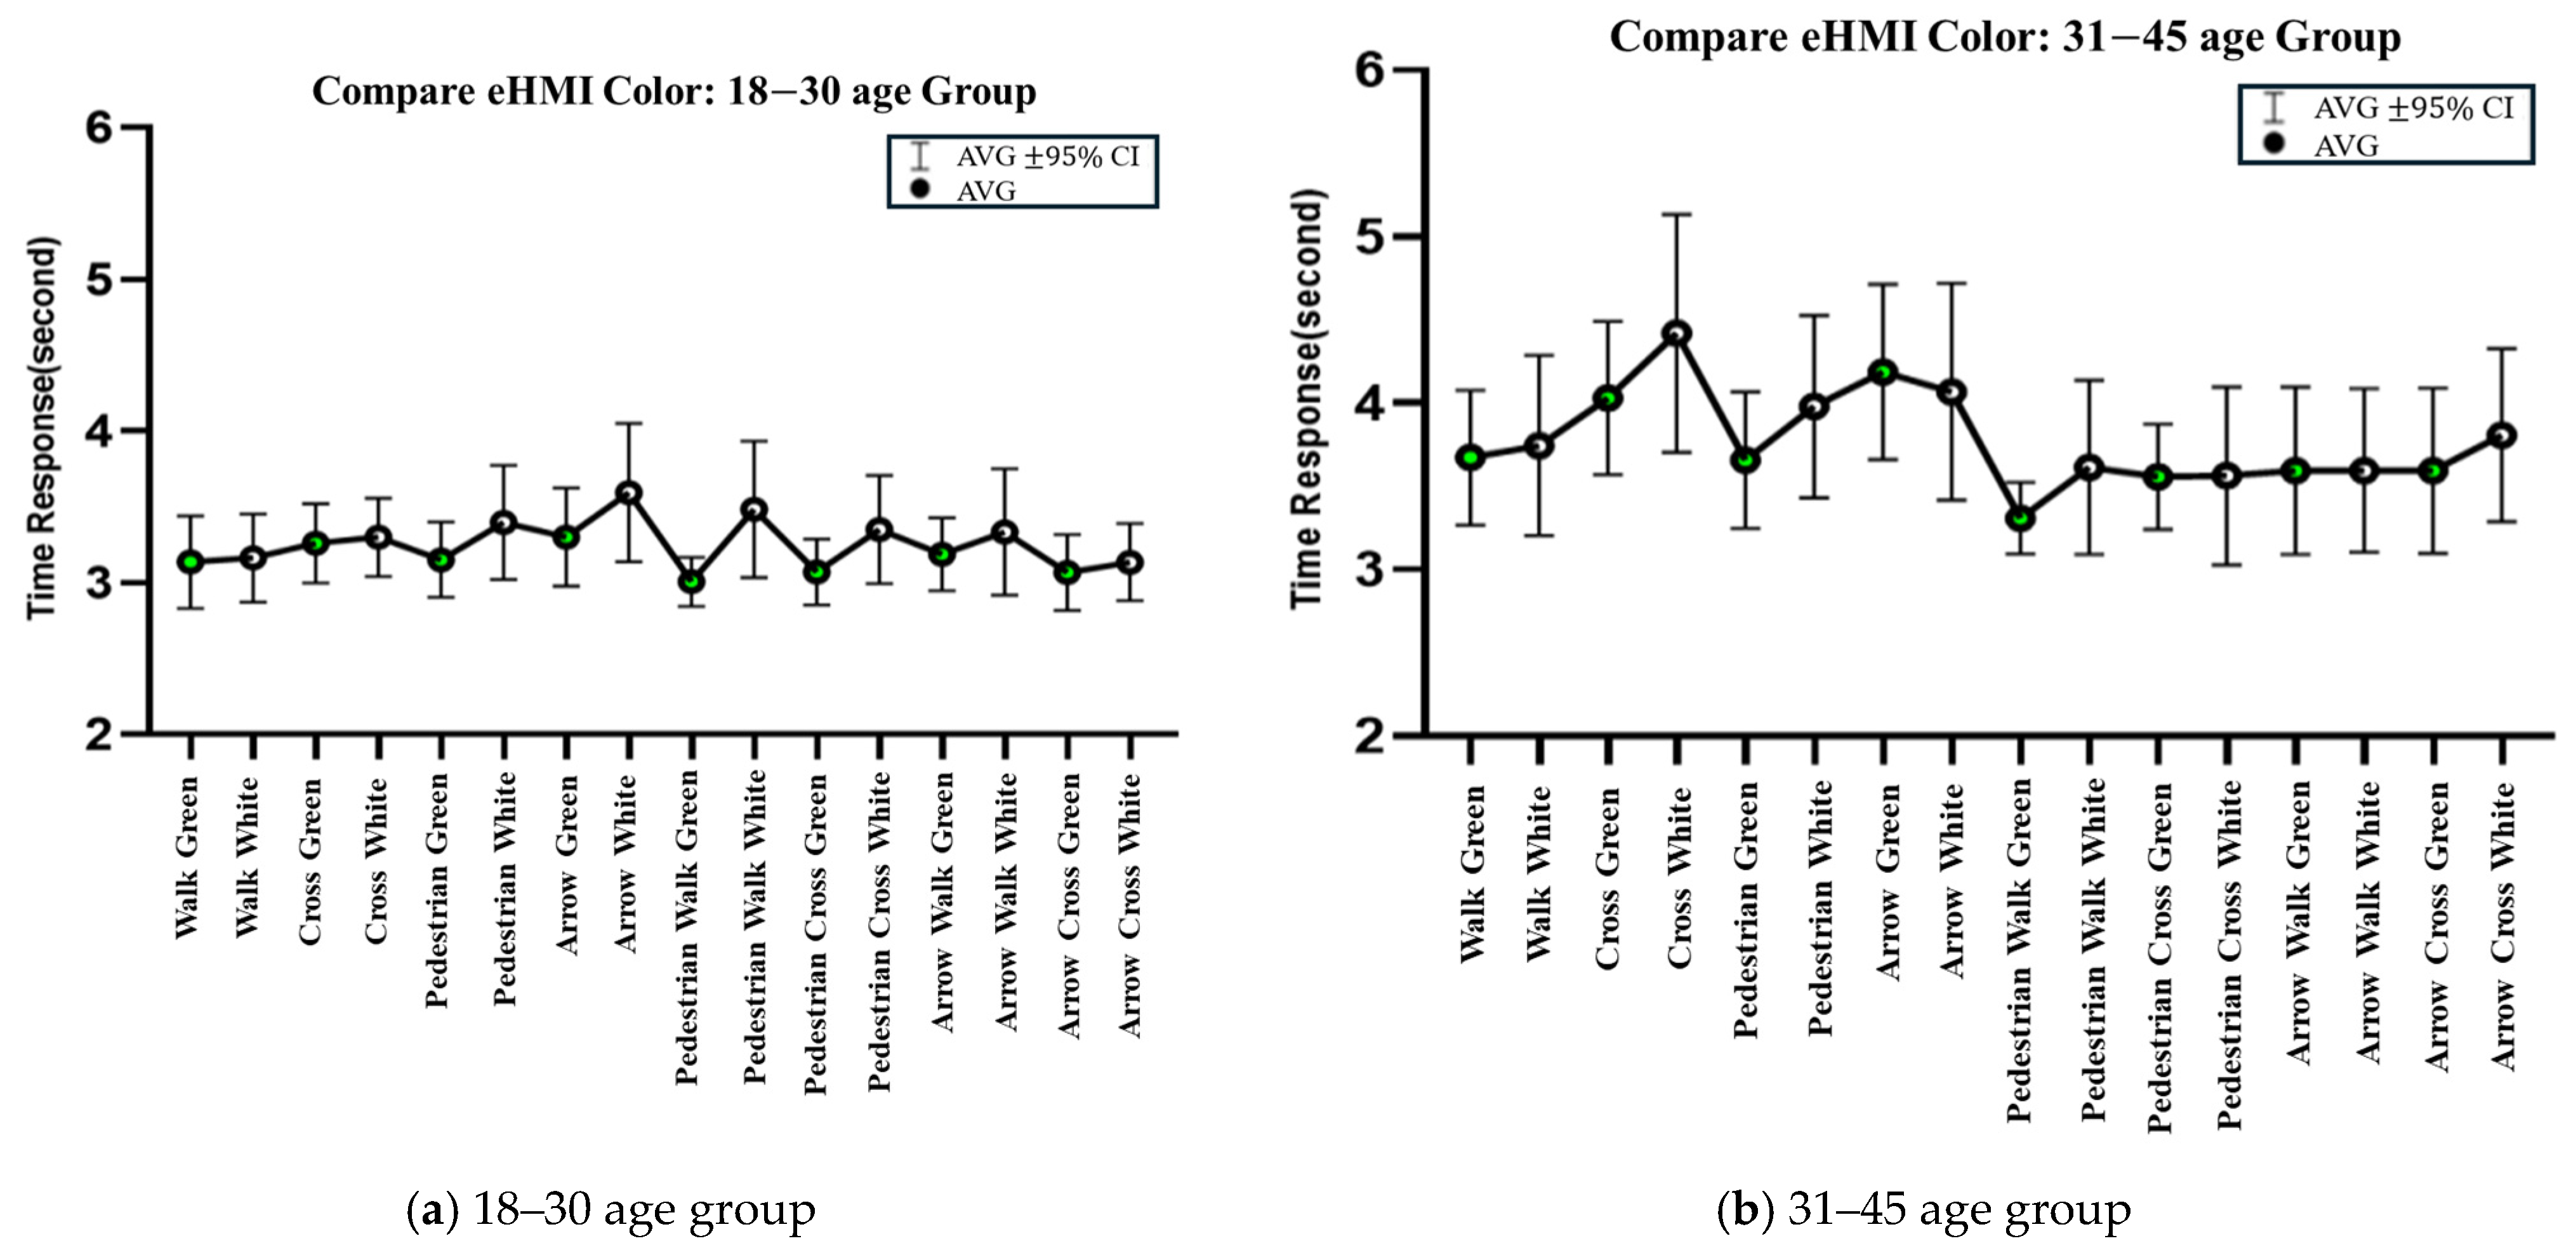
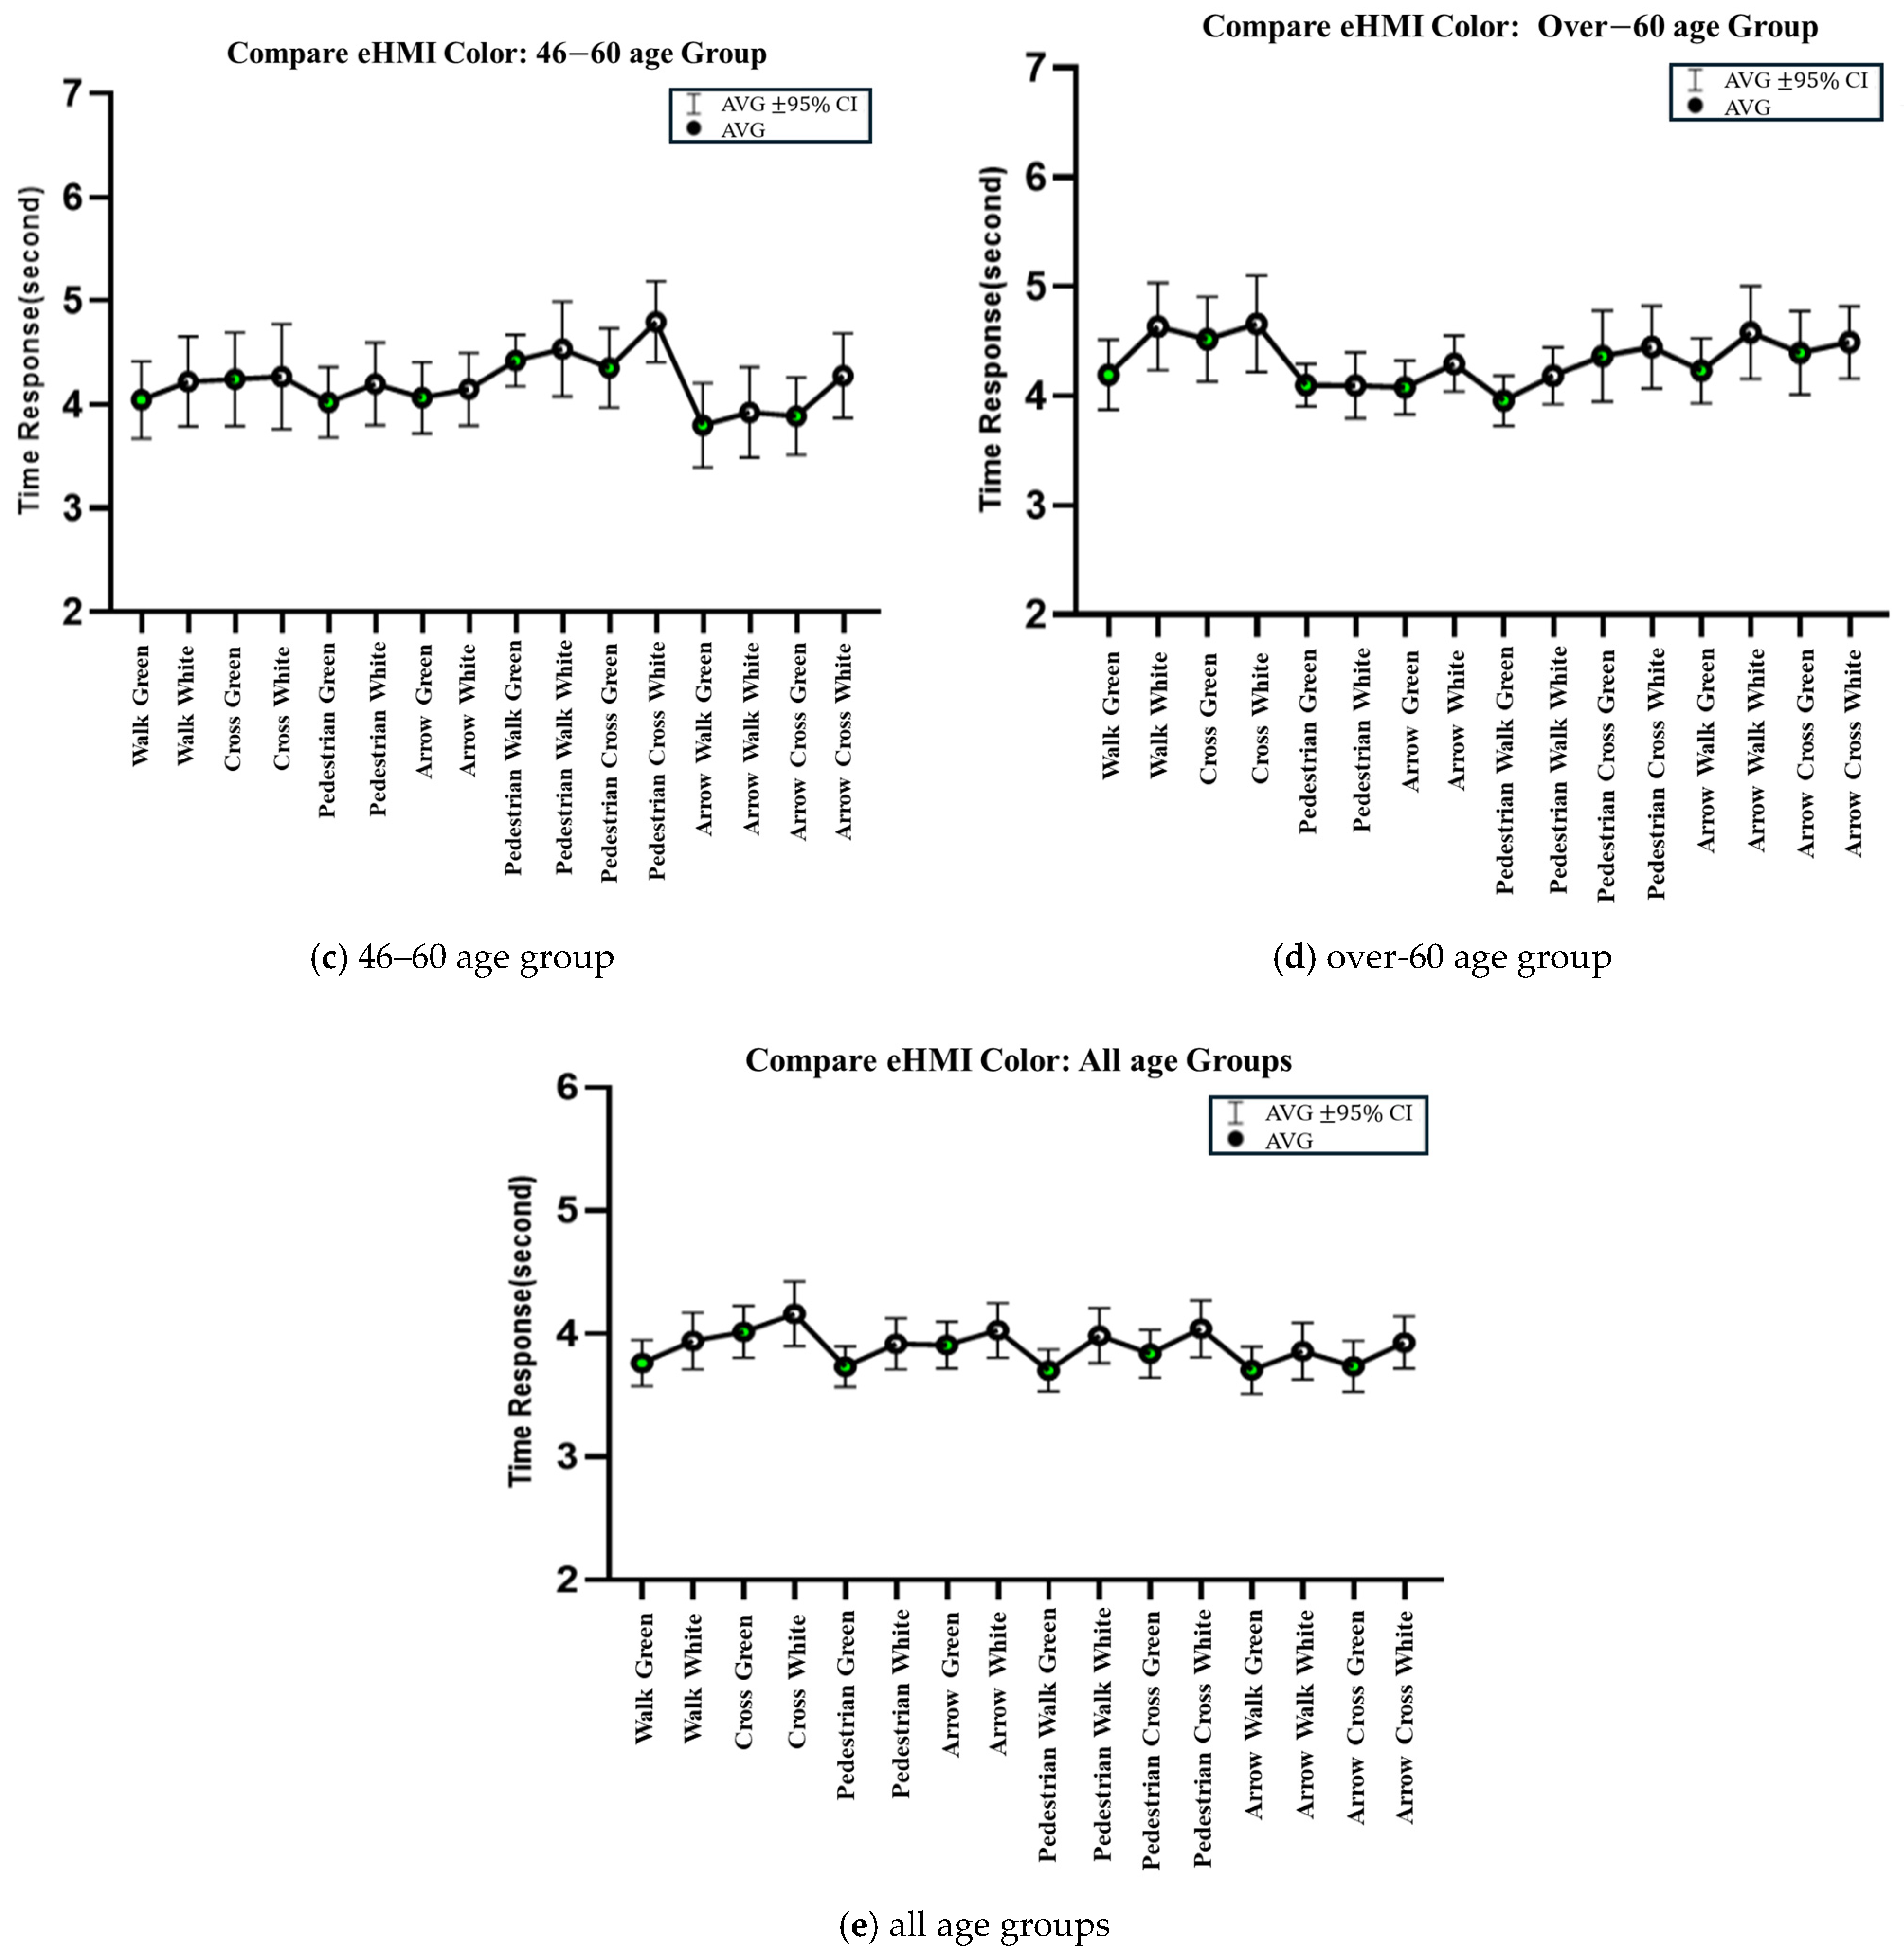
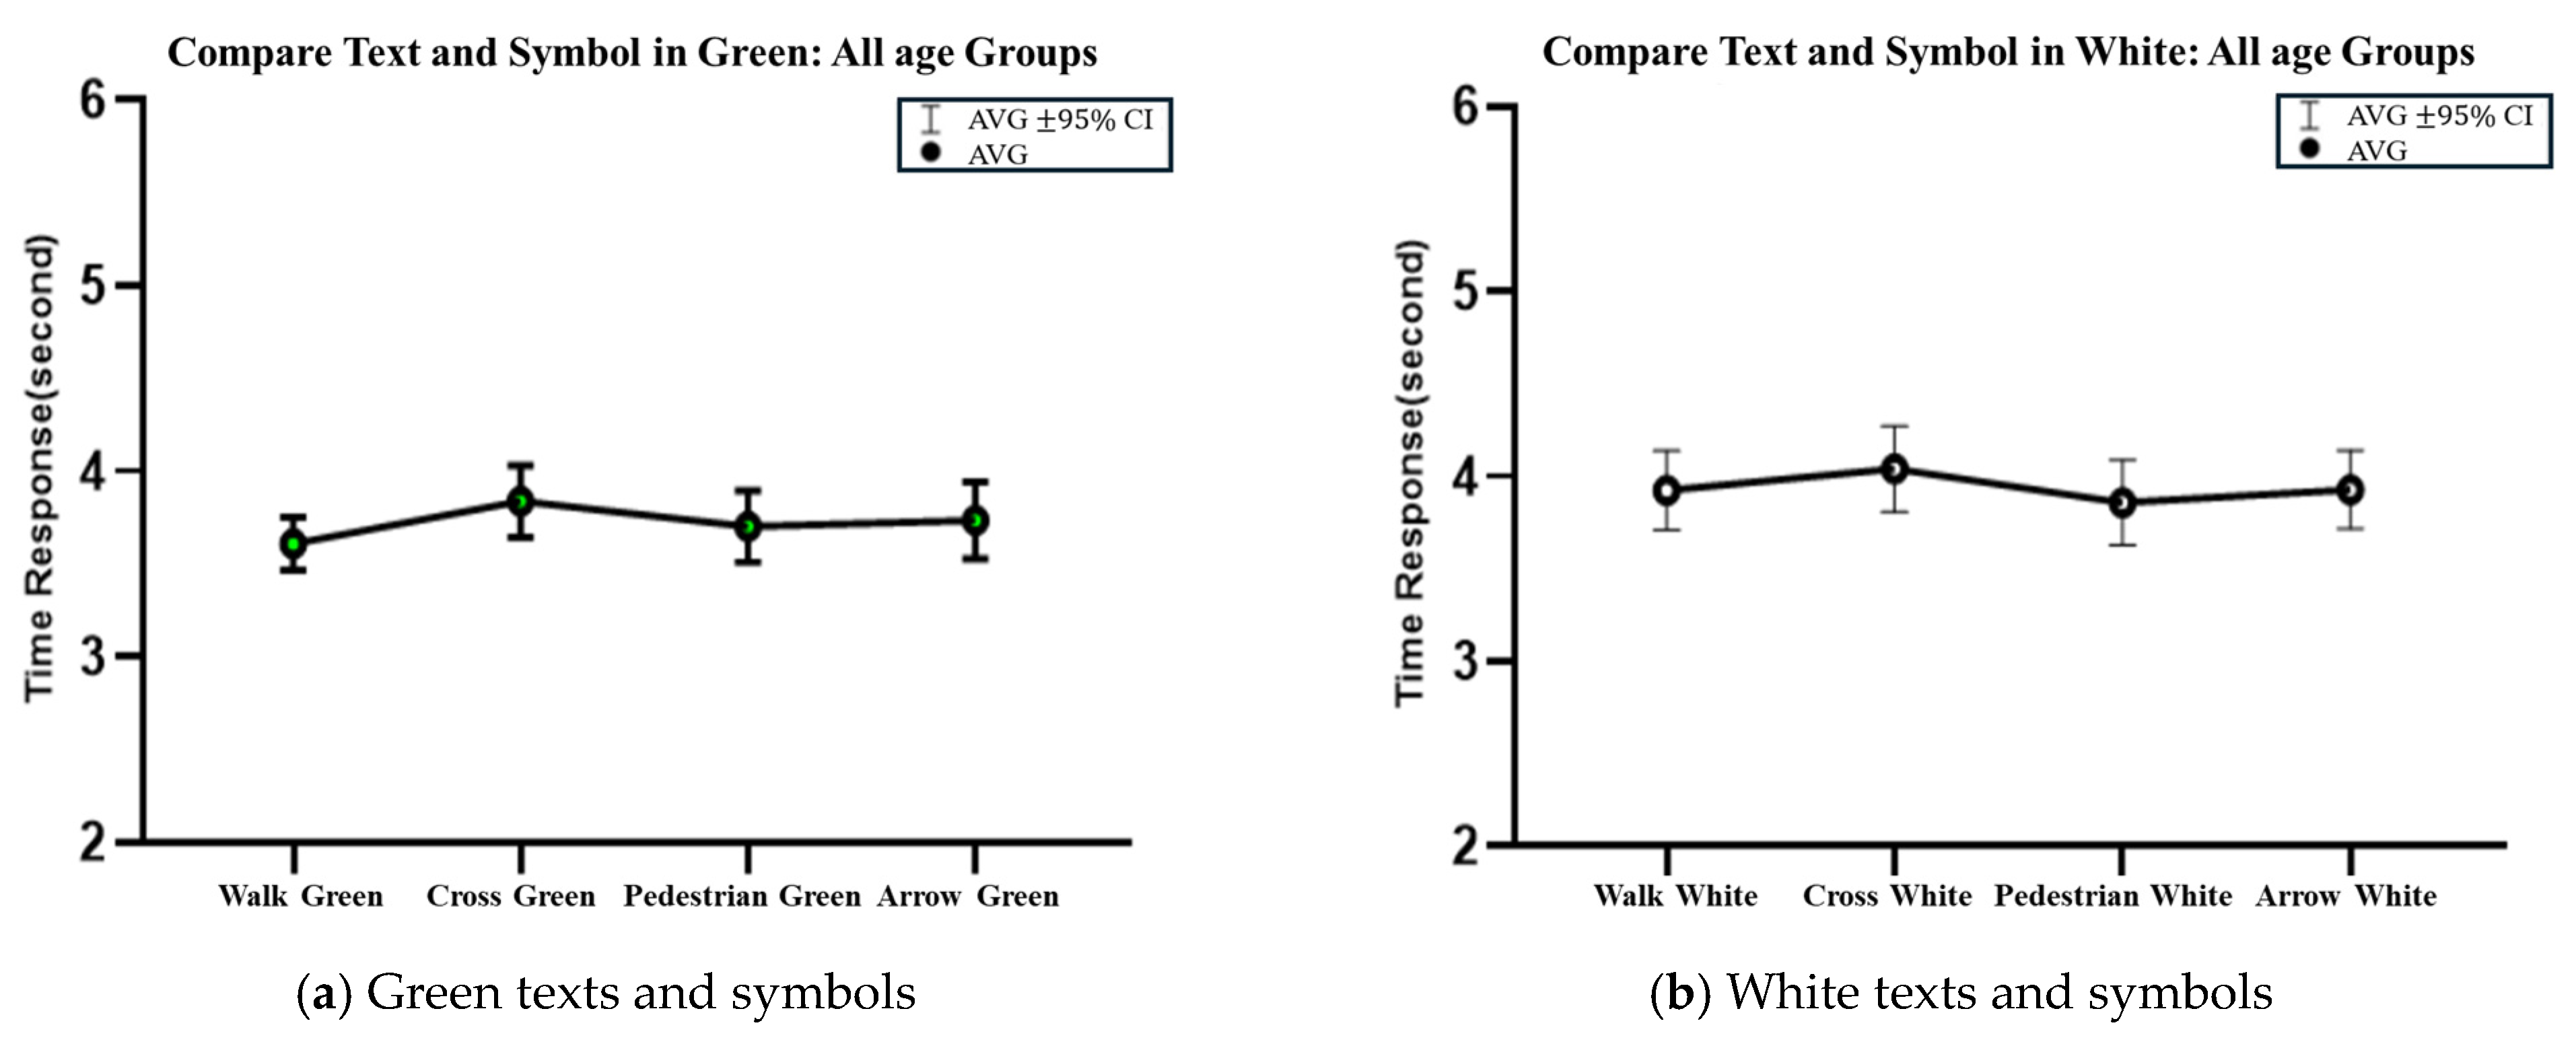
Color played a pivotal role in eHMI effectiveness. Green displays generally yielded faster comprehension than white, particularly among younger and middle-aged participants. This finding aligns with Bazilinskyy et al. [
24], who noted that green is widely associated with safety and movement due to its established role in global traffic signaling. However, the superior performance of green may also be attributed to its inherent visual salience, such as higher luminance contrast and visibility under varied screen conditions. To minimize potential presentation order bias, scenarios were presented in a semi-randomized sequence, ensuring a balanced distribution of color formats across participants. Nonetheless, perceptual factors, including ambient lighting and individual sensitivity to brightness, may have further influenced recognition times. Additionally, the diminished responsiveness to color cues observed in older participants is consistent with findings by Paramei [
27], who reported age-related declines in color discrimination. These results suggest that color alone may not ensure effective communication across all age groups, highlighting the importance of integrating textual or symbolic reinforcement to enhance eHMI clarity, particularly for elderly pedestrians.
Textual messages also impacted comprehension. The word “WALK” consistently outperformed “CROSS” across all age groups, likely due to its brevity, clarity, and stronger directive connotation. Chen et al. [
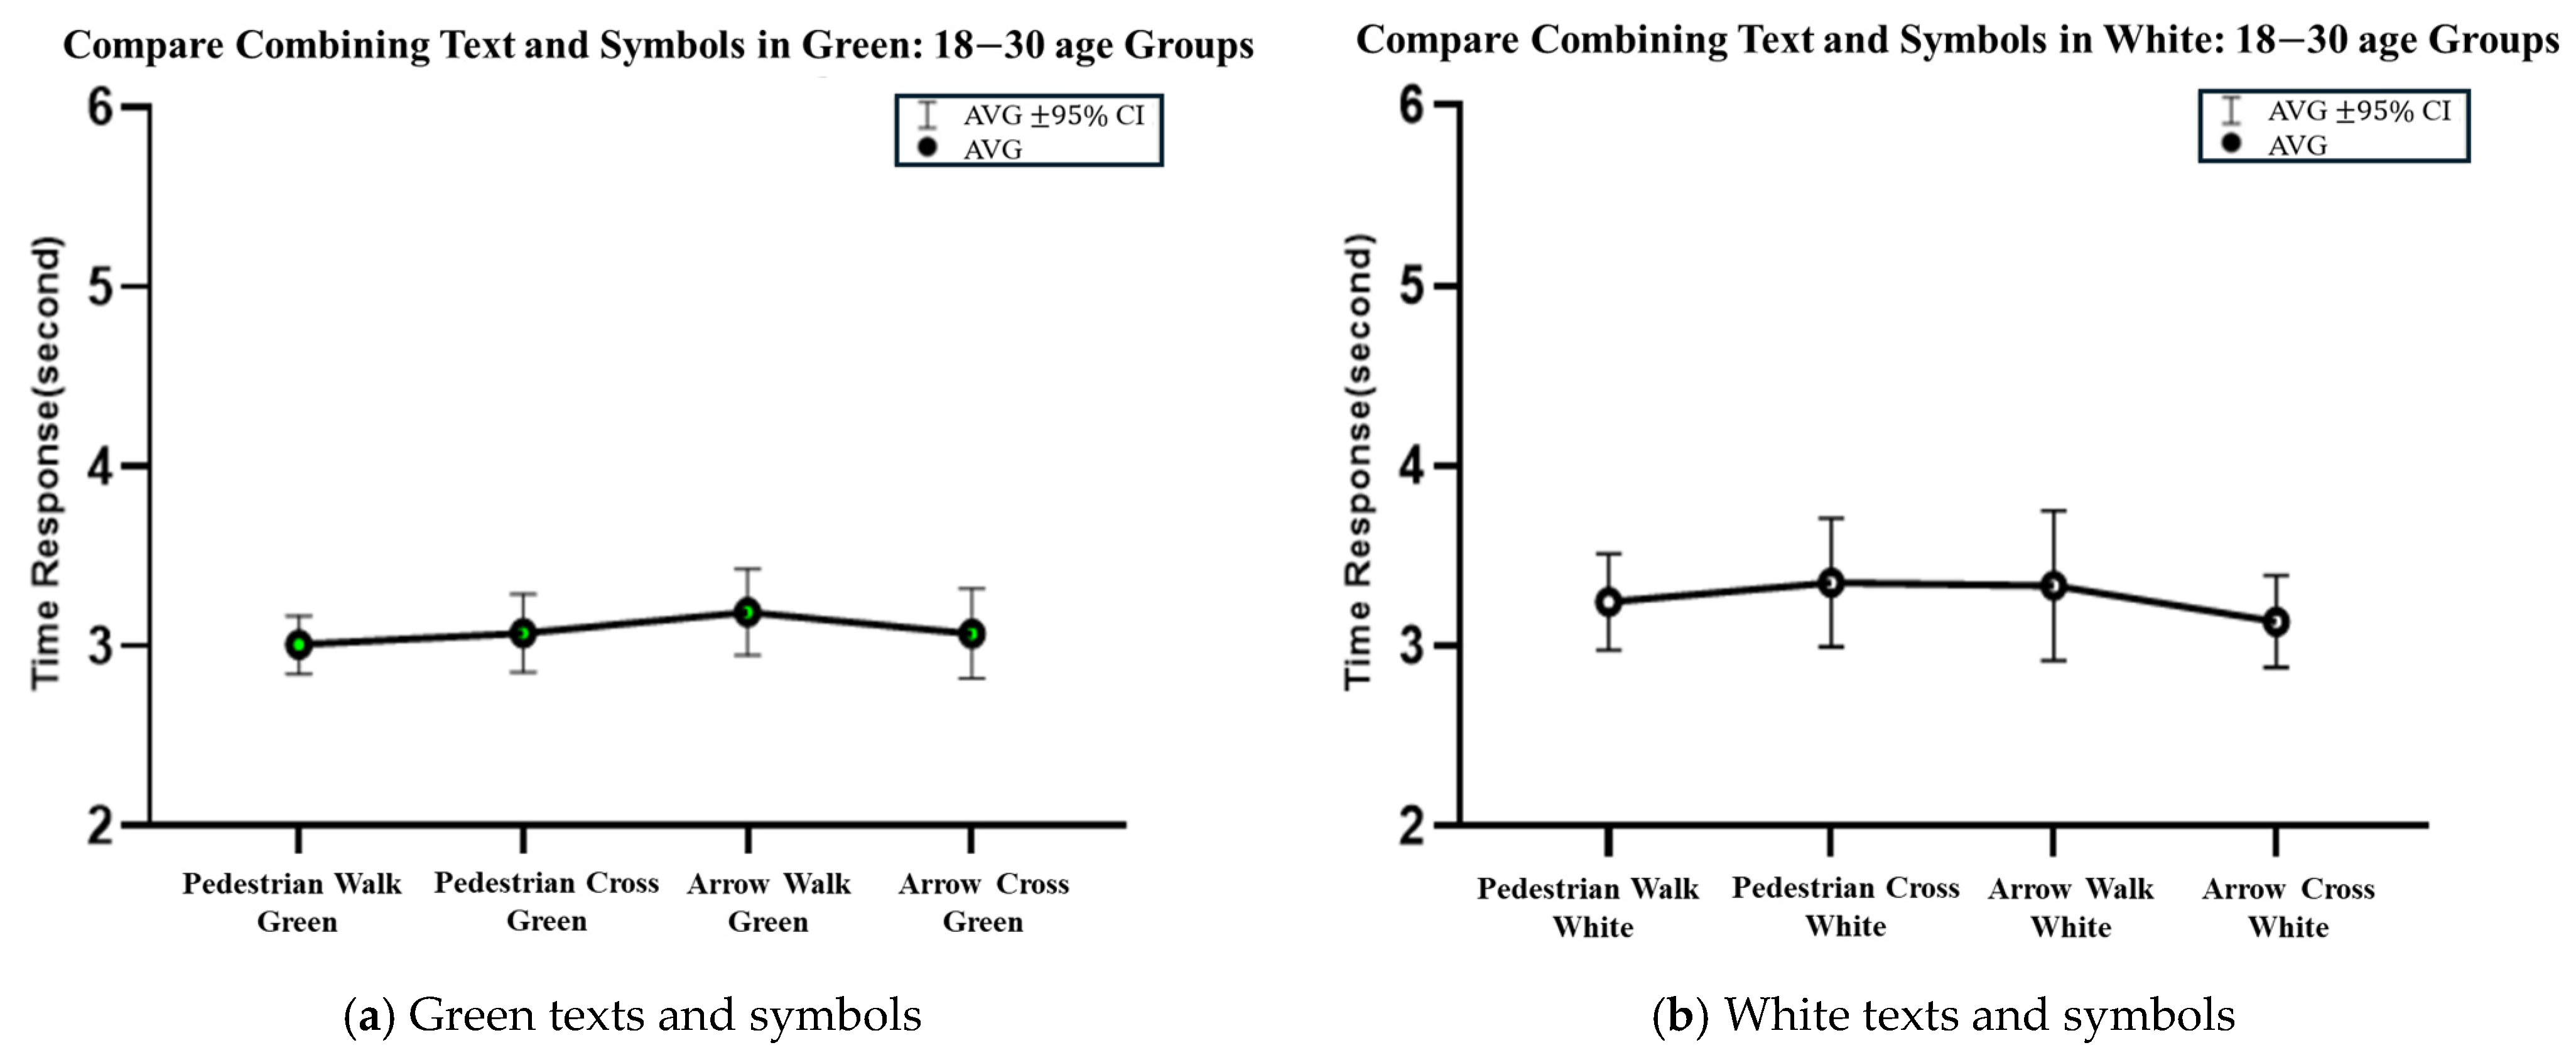
25] similarly recommend the use of short, imperative language in EAV signals to minimize cognitive load and ensure rapid understanding. Symbols, particularly pedestrian icons, also enhanced comprehension more effectively than arrows. This effect was amplified when symbols were paired with supporting text, consistent with the dual-channel processing theory that suggests multimodal signals (text + symbol) improve information retention and interpretation.
Interestingly, the 46–60 age group favored the green arrow combined with “WALK,” diverging from other age groups that preferred pedestrian icons. This pattern may reflect generational familiarity with traditional road signage or different interpretive heuristics. The over-60 group also displayed smaller performance gaps between formats, suggesting that design variation may have a reduced impact on their decision-making, a finding that warrants further investigation using behavioral metrics beyond comprehension time alone.
Validation through field experimentation further supports the robustness of the simulation findings. Despite the field study’s limited sample size, the comprehension rankings closely mirrored those observed in the simulation, indicating good ecological alignment between virtual and real-world environments. However, the small sample size reduces the ability to generalize these findings to broader populations. As Dommes et al. [
28] emphasized, real-world pedestrian behavior involves dynamic and embodied processes such as gaze shifts, hesitation, and spatial negotiation, none of which were captured in the current button-press paradigm. Future research should therefore explore immersive setups, such as virtual reality or staged crossings, to complement cognitive metrics with behaviorally grounded observations.
Overall, this study reinforces the effectiveness of eHMI formats that incorporate green color, the word “WALK,” and pedestrian symbols, particularly when used in combination. However, it also highlights the need for age-adaptive design and multimodal redundancy to accommodate perceptual and cognitive variation across demographics.
These findings have practical implications for multiple stakeholders. For vehicle manufacturers, the demonstrated advantages of green color, short imperative text, and recognizable symbols can inform the development of eHMI systems that accommodate both younger and older pedestrians. Urban planners and transportation authorities can integrate these insights into crosswalk design guidelines and AV deployment strategies to enhance pedestrian safety in mixed-traffic environments. Policymakers may use this evidence to shape regulatory standards for eHMI formats, ensuring consistency and accessibility across jurisdictions. Finally, researchers can build on these results to explore adaptive, context-aware eHMI systems that dynamically adjust display formats to match environmental conditions and demographic needs.
Recruitment was institution-aligned with age strata, so institution type is collinear with age. Although we used age-by-sex quotas, standardized procedures, and a within-subject/semi-randomized presentation to mitigate bias, residual confounding (e.g., education, cognitive processing, familiarity with technology) may remain. Future work will adopt matched-group recruitment and/or cognitive screening to better isolate age effects. This note complements our existing discussion on potential confounders.
This study did not address conflict scenarios where the eHMI signal from an EAV may be contradicted by the behavior of other road users, such as a non-autonomous vehicle ignoring traffic rules and proceeding through a crosswalk. Such situations could undermine pedestrian trust in eHMIs and pose safety risks. Future research should explore multi-agent interaction contexts, incorporating unpredictable human driver behavior into simulation and field experiments to evaluate how pedestrians interpret and act upon potentially conflicting cues. Additionally, the scope of the present study was limited to a controlled set of crossing scenarios under consistent environmental conditions, which may not capture the variability of lighting, weather, and traffic density in real-world settings. Moreover, participants were primarily drawn from specific institutional contexts, which may limit the generalizability of the findings to broader, more diverse populations.
5. Conclusions
This study offers a novel contribution by providing a systematic, age-stratified evaluation of multiple eHMI formats, integrating both simulation and real-world field testing on an actual Level 3 EAV. Unlike previous works that often focus on a single format or simulated context, this research compares multiple combinations of color, text, and symbols in a controlled yet ecologically validated framework. The findings contribute to the body of knowledge by identifying design configurations that not only achieve statistical significance but also demonstrate practical, real-world applicability across diverse age groups.
In line with this aim, this study evaluated whether eHMIs improve pedestrian comprehension of EAV intentions compared to vehicle kinematics alone. Simulation results from 100 participants in four age groups showed that all eHMI formats reduced comprehension time relative to no-eHMI scenarios. Among formats, green displays generally yielded faster responses than white, “WALK” was more effective than “CROSS,” and pedestrian symbols outperformed arrows. Mixed-format designs combining a green pedestrian symbol with “WALK” achieved the fastest and most consistent comprehension across groups. Field tests on a Level 3 EAV confirmed that comprehension rankings closely matched simulation results.
Based on these findings, the following design recommendations are proposed:
Use green as the primary display color for faster recognition.
Implement “WALK” over “CROSS” for textual cues.
Employ pedestrian symbols rather than arrows.
Combine text and symbols (e.g., green pedestrian icon with “WALK”) for optimal clarity.
Limitations include the exclusive use of yielding signals, possible demographic confounding from recruitment across different institutions, the small sample size in the field test, which limits the generalizability of these findings, reliance on 2D simulations, and the omission of behavioral measures such as gaze shifts. Future work should test both yielding and non-yielding signals, use matched-group recruitment, and adopt immersive or interactive methods with more diverse participants to enhance ecological validity. In addition, future research could explore distributed communication frameworks that enable real-time information exchange between vehicles, pedestrians, and other road users. Such systems could complement eHMI designs by providing multi-source, synchronized cues, thereby improving safety and comprehension in complex traffic environments.
