Article

Research and Quantitative Analysis on Dynamic Risk Assessment of Intelligent Connected Vehicles

by
Kailong Li
1,2,3,*,
Feng Zhang
4,
Min Li
1,5 and
Li Wang
1,3,*
1
Beijing Key Laboratory of Urban Intelligent Traffic Control Technology, North China University of Technology, Beijing 100144, China
2
Beijing Jidao Technology Co., Ltd., Beijing 100114, China
3
Beijing Key Laboratory of Cooperative and Autonomous Intelligent Control Technology for Ground Transportation, North China University of Technology, Beijing 100144, China
4
School of Electrical and Automation Engineering, East China Jiaotong University, Nanchang 330100, China
5
School of Digital Industry, North China University of Technology, Beijing 100144, China
*
Authors to whom correspondence should be addressed.
World Electr. Veh. J. 2025, 16(8), 465; https://doi.org/10.3390/wevj16080465
Submission received: 17 June 2025 / Revised: 8 August 2025 / Accepted: 11 August 2025 / Published: 14 August 2025

Abstract

Ensuring dynamic risk management for intelligent connected vehicles (ICVs) in complex urban environments is critical as autonomous driving technology advances. This study presents three key contributions: (1) a comprehensive risk indicator system, constructed using entropy-based weighting, extracts 13-dimensional data on abnormal behaviors (e.g., speed, acceleration, position) to enhance safety and efficiency; (2) a multidimensional risk quantification method, simulated under single-vehicle and platooning modes on a CARLA-SUMO co-simulation platform, achieved >98% accuracy; (3) a cloud takeover strategy for high-level autonomous vehicles, directly linking risk assessment to real-time control. Analysis of 56,117 risk data points shows a 32% reduction in safety risks during simulations. These contributions provide methodological innovations and substantial data support for ICV field testing.

1. Introduction

Autonomous driving technology has significantly enhanced road safety (data from California in 2024 shows a 38.7% reduction in accident rates [1]), but its reliable operation in complex urban environments still faces core bottlenecks: existing systems struggle to integrate multi-source heterogeneous perception data in real time (including dynamic target behaviors, road conditions, and traffic rules), resulting in a single dimension of risk assessment (focusing only on independent indicators such as collision or stability) and insufficient coordination with control decisions. This paper proposes a novel integrated framework, which innovatively achieves the following: (1) unified quantification of multidimensional risks by fusing LiDAR/V2X/high-precision map data, simultaneously evaluating four-dimensional indicators including collision probability, lateral stability, traffic rule compliance, and traffic efficiency; (2) a dual-mode assessment mechanism for single vehicles and fleets, pioneering the structural stability coefficient and collaborative interaction matrix, addressing the gap in risk quantification for formation modes; and (3) a 50 ms-level real-time decision-making loop, mapping risks into executable instructions such as collision avoidance trajectories and comfortable deceleration control. Experimental verification shows that this framework improves the accuracy of risk assessment by 62% and is particularly suitable for urban intersection scenarios with uncertainties such as random pedestrians and abnormal vehicle behaviors, but further validation of communication delay tolerance under extreme conditions is needed.

2. Related Work

Scholars have conducted some research on the quantitative analysis of driving risks in autonomous vehicles. Risk quantification in driving often employs methods such as statistics and mathematical models to transform risks into measurable indicators or values. A key focus of risk quantification research is how to establish the mapping relationship between environmental variables and driving risks.
Noh S et al. proposed a risk assessment framework suitable for urban autonomous driving, which identifies risks through long-term motion prediction and evaluates the likelihood of collisions using a unified risk measurement and probabilistic risk reasoning within a distributed reasoning architecture [2]. Pang et al. proposed an assessment framework that can predict and evaluate the likelihood of collisions in urban environments, taking into account factors such as road types, road attributes, and traffic regulations [3]. HZ T et al. developed a safety risk assessment framework based on the probability and severity of potential autonomous vehicle accidents, providing preliminary safety risk assessments for road testing of autonomous vehicles, along with application cases from Shanghai and Gothenburg [4]. Liu QC et al. studied the predictability of crash risk caused by manual takeover of autonomous vehicles in mixed traffic flow [5]. Patel A et al. proposed a new method for identifying and classifying the severity and controllability levels of driving scenarios for autonomous vehicles, employing support vector machine learning techniques to train, test, and validate the model [6]. Shetty A et al. presented a risk assessment framework that utilizes human driving data and road-testing data to evaluate the safety of autonomous vehicles, highlighting the differences in collision risks under various driving maneuvers and environmental conditions [7]. In a complex traffic environment, by using reinforcement learning or Bayesian inference to conduct real-time identification of multiple risk factors, the collision avoidance performance of the system can be enhanced [8,9]. These papers cover multiple aspects of risk assessment for autonomous driving in urban environments, including collision risk prediction, occlusion perception, interactive perception models, and comprehensive risk assessment methods, providing effective strategies and approaches to improve the safety of urban autonomous driving.
Currently, there are mainly two approaches: the model-based method and the definition function method. The model-based method refers to using machine learning algorithms to learn driving data and construct nonlinear mapping models between environ-mental variables and driving risks. Common algorithms include support vector machines, decision trees, and neural networks. Fei Ma et al. proposed a framework for identifying road section accident risks at the granular level by utilizing traffic conflicts as an intermediary [10]. Parsa, A. B. et al. used data-driven methods to characterize the model of the impact of autonomous vehicles on traffic flow and verified the effectiveness of the model with a large amount of data [11]. Li Zhibin et al. [12] proposed a rear-end collision risk prediction model based on aggregated traffic flow data, finding that the probability of rear-end collisions during the propagation of traffic waves is significantly correlated with the accident risk index and the standard deviation of upstream occupancy rates. This proves that the risk of rear-end collisions is highest when traffic transitions from free flow to congestion, and the propagation of traffic waves in congestion increases the risk of rear-end collisions. Hossain M et al. [13] proposed a Bayesian framework for predicting collisions on congested urban expressways, which can predict risks 4–9 min into the future and validated the method’s effectiveness using real data. Wang et al. [14] studied the application of potential field theory to analyze the risk changes that vehicles encounter under different traffic conditions. Wei et al. [15] established a model for lane-changing behavior of connected autonomous vehicles based on the theory of risk potential field. Wang Qingbin et al. [16] established a prediction model for ship accident risks and types based on an improved XGBoost algorithm, demonstrating significant improvements in model AUC values and prediction accuracy through experiments. Xie G et al. [17] developed a risk model for autonomous vehicle merging based on decision trees and support vector machines, allowing intelligent vehicles to assess the risks posed by other vehicles during merging and their own risk assessment of following vehicles during the merging process. Pawar et al. [18] used video detector data to reduce the operational risks of right-turning vehicles at signal-free intersections. Machine learning algorithms can reduce the impact of human subjective bias, helping to improve the objectivity of risk quantification [19]; however, this method has high data requirements, and the interpretability of models and adaptability to different scenarios still need improvement. Zhu L et al. [20] conducted in-depth research on the safety and efficiency of autonomous vehicles operating at the traffic bottleneck areas of highway ramps, focusing on the operation mechanism of autonomous vehicles in complex traffic environments. Jiang C et al. [21] studied the risk assessment of operation safety for a new type of complex traffic flow (in which truck fleets equipped with (cooperative) adaptive cruise control devices) and traditional human-driven cars (HDCs) and trucks (HDTs) in various scenarios of port highways. By studying the characteristics of traffic flow congestion, the dynamic characteristics of phase transition are investigated, and the dynamic risk assessment among adjacent vehicles is carried out [22,23].
In contrast, the definition function method quantifies risks by defining a mapping function between environmental variables and driving safety, based on various foundational theories. This method has better interpretability, does not rely on large amounts of data, and offers high computational real-time performance. Ming Yue et al. constructed a model to quantify vehicle spatial collision risks by combining relative distance and relative angle, conducting a series of simulations in typical scenarios on the CarSim–Simulink joint simulation platform to validate the feasibility and effectiveness of the proposed shared steering control method [24]. They quantified the driving risks caused by vehicle conflicts based on kinematic indicators and further achieved a more comprehensive and accurate risk assessment method for scene information using intelligent connected vehicles [25]. They used dynamic indicators such as yaw rate and centroid side slip angle to quantify the risk of lateral instability in vehicles [26]. Additionally, Wu Jian et al. [27] studied the evaluation methods for driving risks, considering multiple factors involving people, vehicles, and roads, and analyzed the causes of traffic accidents and the mechanisms of their impact on driving risks. Wang et al. [28] have developed a framework for decision-making and trajectory tracking for autonomous vehicles, providing a research foundation for the operation of vehicles at different levels of autonomy. Charly A. et al. established a methodology to identify risky driving behavior using driving performance measures [29]. Wang J et al. [30,31] utilized field theory to represent risk factors caused by drivers, vehicles, road conditions, and other traffic factors, providing a new foundation for formulating driving safety measures and proactive vehicle control in complex traffic environments. Wang Y et al. [32] proposed a decision-making planning method based on motivation and risk assessment, focusing on the decision-making behavior of human drivers. Wang Yuanyuan et al. [33] introduced a risk potential cloud model addressing uncertainty, which effectively quantifies the danger level and occurrence probability of potential collisions, establishing high-risk sensitivity and probability sensitivity driving styles, thus providing more diversified and human-like intelligent decision-making and trajectory planning methods for autonomous vehicles under varying driving risk conditions. F.K. et al. [34] primarily focused on fault detection and combinatorial coverage, considering the implementation of two types of automatic emergency braking functions. During the driving on curved sections, the quantitative representation of vehicle trajectory deviation is the core of safety assessment [35,36,37]. Large language models and artificial intelligence technologies have been utilized to study the quantification of collision risks for autonomous vehicles [38,39].
In summary, existing risk assessment methods still face the following key challenges in complex urban road environments: (1) Single dimension of risk and insufficient com-prehensive quantification: most methods, whether model-based or function definition-based, focus on assessing specific types of risk (such as collision risk or instability risk) or target specific scenarios (such as cut-in or car-following). In the complex mixed urban traffic flow (including vehicles, pedestrians, non-motorized vehicles, etc.), risks are multidimensional (collision risk, lateral instability risk, traffic rule violation risk, traffic efficiency loss risk, etc.) and multi-sourced (own vehicle state, surrounding dynamic target behaviors, static road environment, traffic rule constraints, etc.). There is an urgent need for a unified framework capable of quantifying multiple risk dimensions comprehensively. (2) The generality of the assessment subject needs improvement: current risk assessment systems mainly design around single vehicles. With the development of vehicle platoon cooperative control technology, the importance of assessing the overall operational safety of platoons and the cooperative interaction risks among internal vehicles is increasingly prominent. Currently, there is a lack of unified assessment methods that effectively cover the risks of both single vehicles and platoons. (3) Lack of a closed-loop mechanism for real-time decision support under complex and variable environments: the ultimate goal of risk assessment is to guide safe and efficient decision-making. Existing research mostly focuses on risk quantification itself or uses it as input within specific control algorithms but lacks a tightly coupled closed-loop design that integrates multidimensional, dynamic risk assessment results with real-time, robust control strategy generation, especially when responding to differentiated traffic behavior patterns and sudden changes in complex environments.
3. Risk Assessment Methodology

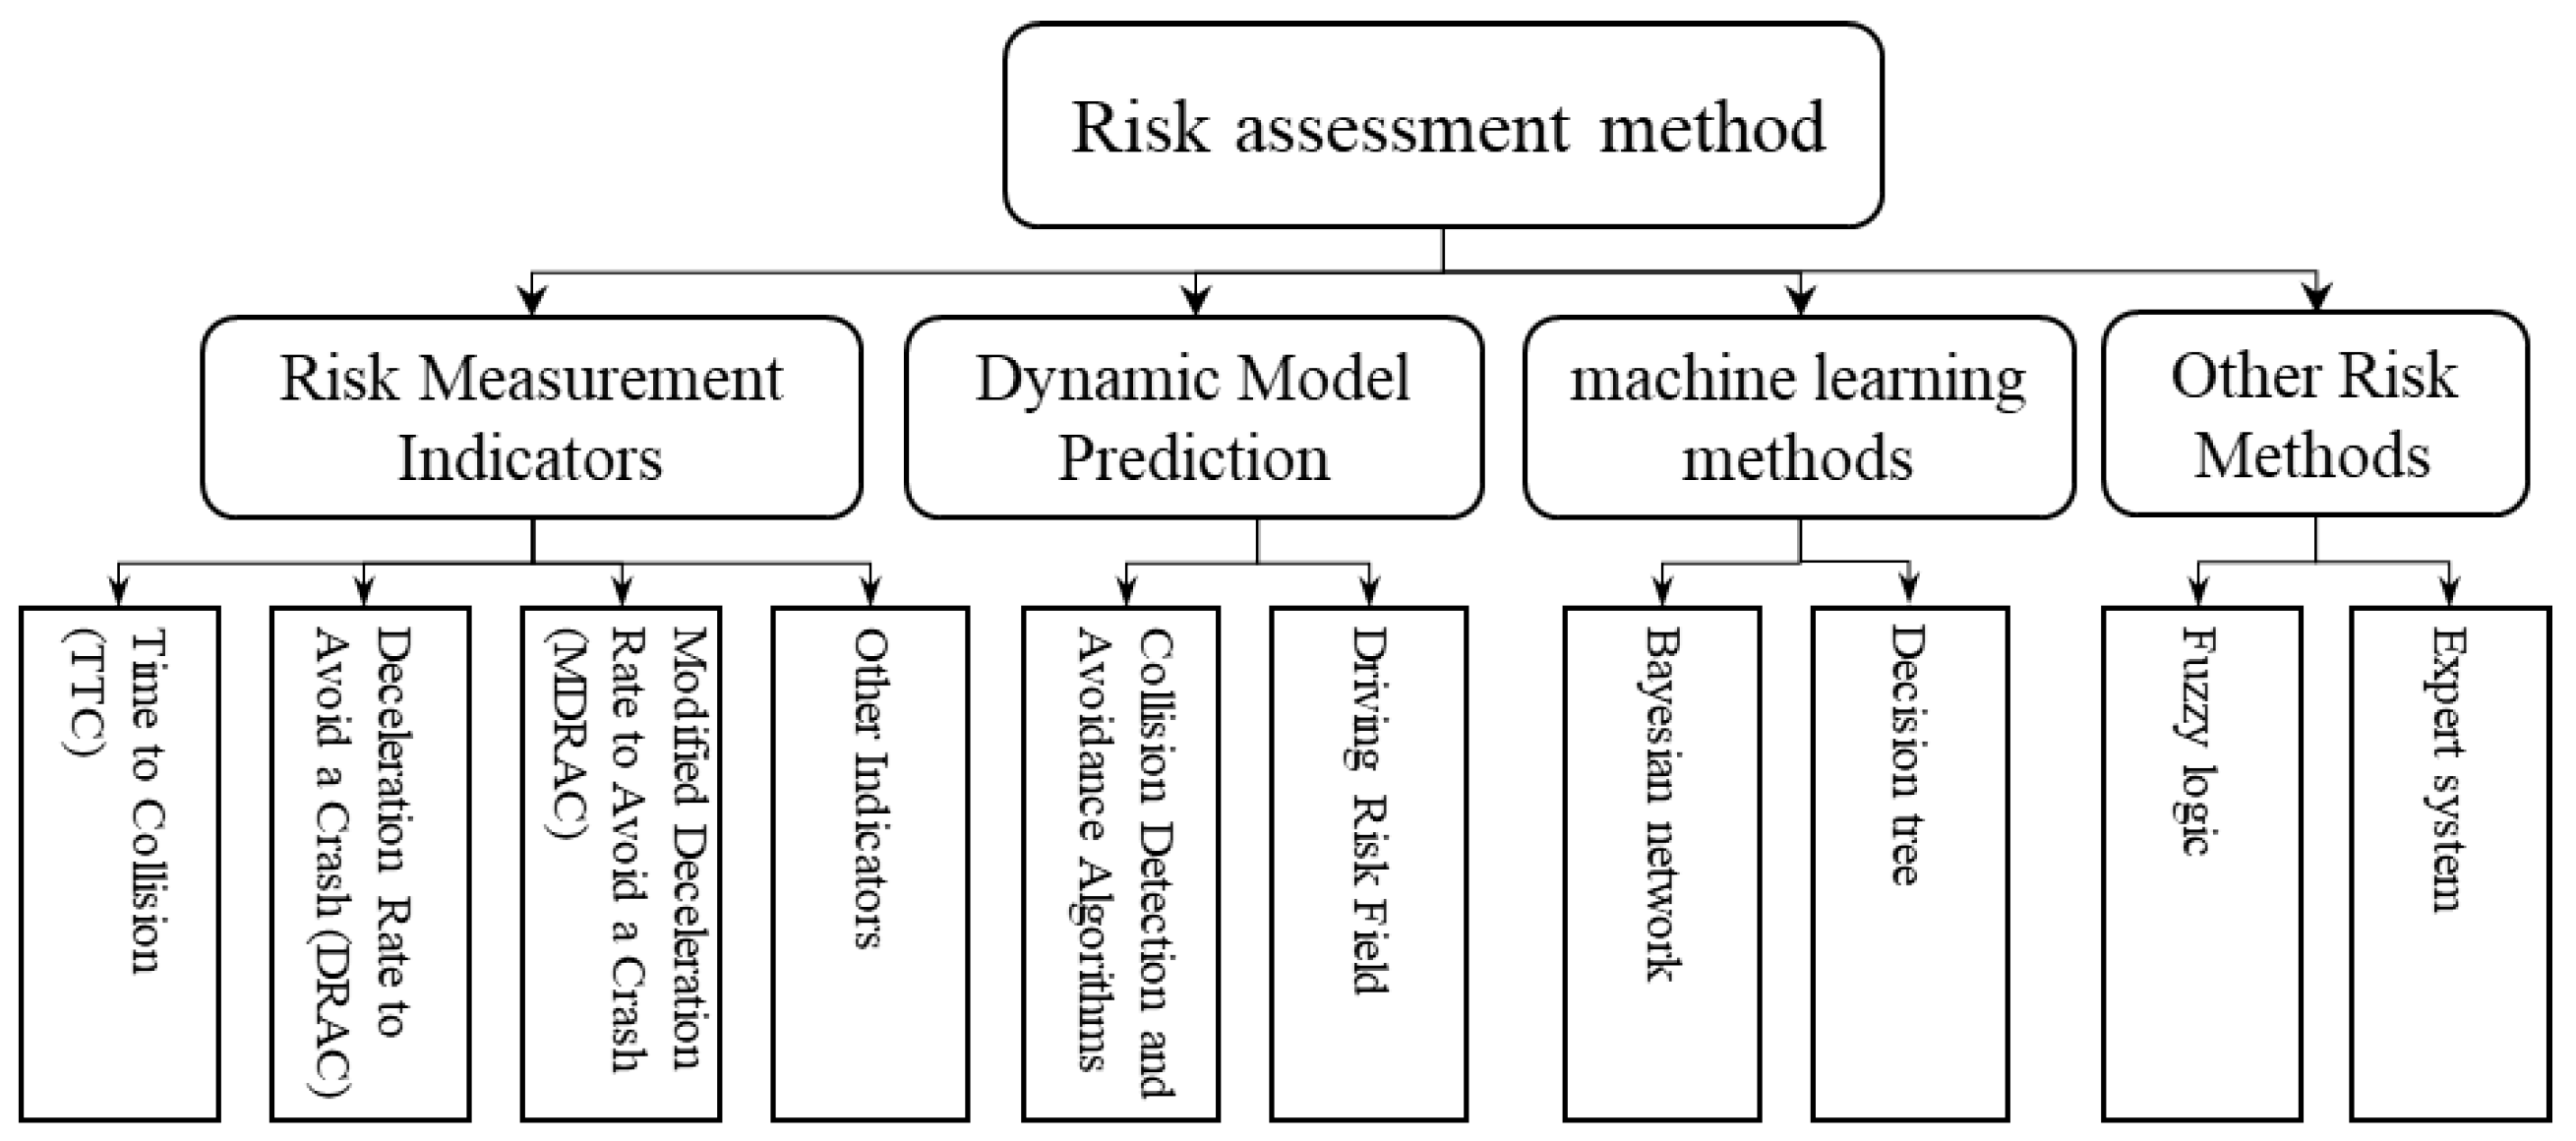
Establishing a risk assessment methodology can help systems understand and predict potential hazardous situations, allowing for appropriate measures to be taken to enhance driving safety. Risk measurement indicators are tools used to quantitatively assess the magnitude and severity of potential risks in autonomous driving systems. Dynamic modeling focuses on using physical or mathematical models to predict the future states of vehicles and their environments, evaluating potential risks. Machine learning techniques learn to identify risk patterns and make predictions by training on large datasets. Fuzzy logic and expert systems utilize fuzzy sets and rule bases to handle uncertain information, simulating the decision-making processes of human experts for risk assessment. These methods can be used individually or in combination to improve the safety and reliability of autonomous driving systems in complex environments. The risk assessment methodology is illustrated in Figure 1.

3.1. Risk Assessment Method Based on Risk Measurement Indicators

Assessment types based on indicators such as time, speed, and distance can be utilized.

3.1.1. Time to Collision

Time to Collision (TTC) is a metric that measures the time required for two objects (such as vehicles, pedestrians, or other road users) to collide, assuming their current speed and direction remain unchanged. TTC provides a quantitative way to determine how quickly a driver, or an autonomous driving system, needs to act (such as braking or steering) in order to avoid a collision in specific situations. The calculation of TTC is based on the relative speed and distance between the two objects.
When two objects are moving at a constant speed, the distance between them can be calculated using the following formula:
TTC 1 = D V
where D is the relative distance between the two objects. V is the instantaneous relative velocity of the two objects. For uniformly accelerated motion, assuming constant acceleration, the calculation formula for TTC 2 is:
TTC 2 = V + V 2 + 2 a D a
where V represents the instantaneous relative speed of the two objects, while a denotes their relative acceleration. In practical applications, TTC can assist drivers in determining how quickly they need to react in emergency situations. It also serves as a metric for Advanced Driver Assistance Systems (ADAS) to trigger warnings or automatic interventions, such as emergency braking or evasive maneuvers. A shorter TTC value indicates a higher likelihood of collision, necessitating immediate action to avoid an accident. Conversely, a longer TTC value suggests more time to react and a lower likelihood of collision. However, it is important to note that TTC does not account for the driver’s reaction time or the vehicle’s braking distance, which means that the actual time required to avoid a collision may be longer.

3.1.2. Deceleration Rate to Avoid a Crash

Deceleration Rate to Avoid a Crash (DRAC) refers to the rate of deceleration that must be implemented to avoid a collision. This is a critical safety parameter that indicates how much the driver needs to slow down in order to avoid a collision when facing an obstacle or another vehicle ahead. DRAC is typically measured in terms of the rate of decrease per second and is directly related to driving safety and vehicle control.
DRAC i = δ v Δ t = v n ( t ) v n 1 ( t ) Δ t = v n ( t ) v n 1 ( t ) 2 x n 1 x n L n 1 , v n ( t ) > v n 1 ( t )
Among them, δ v represents the speed difference between the front and rear vehicles (m/s); Δ t is the TTC. In traffic safety analysis and vehicle design, DRAC is an important factor. It not only depends on the driver’s reaction time and vehicle performance, such as braking efficiency and road conditions, but is also influenced by the driving environment, including road surface conditions, weather, and traffic density. Understanding and calculating DRAC is crucial for assessing safety risks in specific traffic scenarios, as it helps drivers estimate the safe stopping distance required in different situations. For example, if a vehicle is traveling at high speed and suddenly encounters an obstacle ahead, the minimum deceleration rate required to avoid a collision can be calculated based on the vehicle’s speed and its distance from the obstacle. If the actual deceleration rate falls below this value, the vehicle will not be able to stop in time, resulting in a collision.

3.1.3. Modified Deceleration Rate to Avoid a Crash

Modified Deceleration Rate to Avoid a Crash considers more practical driving and environmental influences, in accordance with the requirements of consistency between the law of conservation of energy and the laws of kinematics, such as driver reaction time, vehicle type, road surface conditions, and weather conditions.
MDRAC = 0.5 × Δ v / ( TTC     PRT )
where Δ v indicates the speed difference between the front and rear vehicles, and PRT (perception–reaction time) is the default time step.
MDRAC provides a more accurate calculation of the deceleration rate to help avoid collisions and ensure safety in various driving situations. By taking these additional factors into account, MDRAC aims to offer more practical and applicable deceleration guidance for diverse scenarios, thereby enhancing road safety and reducing the risk of traffic accidents.
There are many other risk indicators, such as Post Encroachment Time (PET), Minimum Safety Distance (MSD), and Collision Probability (CP). These risk metrics are crucial for the risk assessment of autonomous driving systems in specific scenarios; they not only help the system evaluate the current safety status but also provide inputs for the system’s predictive models and decision-making logic. However, accurately calculating and applying these indicators also faces numerous challenges, including the accuracy and reliability of data, as well as the comprehensive analysis and trade-offs between different indicators.
Moreover, as autonomous driving technology advances, a single risk metric may struggle to assess risks in complex environments. In such cases, it may be beneficial to consider using multiple risk metrics together. However, standardizing the measurement criteria for different indicators requires continuous adjustments and optimizations to adapt to the increasingly complex and variable driving environments. The risk assessment methods used in this paper’s experimental section are based on a comprehensive risk measurement approach that incorporates multiple risk indicators, such as TTC, DRAC, and MDRAC; the main theoretical basis for selecting them is:
(1)
Physical interpretability: TTC directly quantifies the urgency of collisions, while DRAC reflects the minimum deceleration required to avoid collisions.
(2)
Real-time computing efficiency: TTC is suitable for real-time operation of embedded systems.
(3)
Comprehensive risk coverage: MDRAC addresses the shortcomings of DRAC in curved scenarios by introducing road curvature factors.

3.2. Risk Assessment Method Based on Dynamic Model Prediction

The risk assessment method based on dynamic model prediction is a rule- and model-based approach that predicts potential risks by simulating the dynamic interactions between vehicles and their environments. Examples include collision detection and avoidance algorithms, driving risk fields, and spatiotemporal planning. This method typically relies on mathematical models and algorithms to simulate the behavior and reactions of autonomous vehicles in various situations, thereby assessing potential risks.

3.2.1. Collision Detection and Avoidance Algorithms

Collision detection and avoidance algorithms focus directly on preventing accidents. These algorithms analyze vehicle trajectories and the movements of surrounding objects in real-time, assess potential collision risks, and intervene, when necessary, such as adjusting paths or decelerating to avoid a collision.

3.2.2. Driving Risk Field

This involves creating a dynamic risk map by considering various factors in the vehicle’s surrounding environment (such as other vehicles, pedestrians, obstacles, etc.). This allows the autonomous driving system to identify and quantify potential risks in real-time, enabling safer driving decisions. Additionally, the driving risk field can help the system predict future risk changes, providing early warnings for autonomous vehicles and optimizing path planning and avoidance strategies.
The risk assessment method based on dynamic model prediction provides a powerful tool for autonomous driving systems, enabling them to better understand and predict risks in complex traffic scenarios. As models and algorithms continue to improve and computational capabilities enhance, these methods will play an increasingly important role in improving the safety of autonomous driving.

3.3. Other Risk Assessment Methods

In the risk assessment of autonomous driving systems, there are other significant methods beyond the aforementioned approaches, such as machine learning, fuzzy logic control, and expert systems. Compared to traditional rule- and model-based methods, machine learning methods can handle more complex datasets, automatically extract features, and adapt to new driving environments and scenarios. Typical machine learning methods in autonomous driving include Bayesian networks and decision trees. Fuzzy logic control and expert systems introduce human intuition and experiential knowledge by processing uncertain information and simulating the decision-making processes of human experts, thereby effectively handling and interpreting vague and uncertain information. This enhances the safety and reliability of autonomous vehicles in complex traffic environments.

3.4. Review of Evaluation Methods

In summary (Table 1), the risk assessment of autonomous vehicles is a multifaceted and multilayered process that involves extensive data processing, environmental perception, prediction, and decision-making. The comprehensive application of the aforementioned methods can assist autonomous driving systems in making more rational and informed decisions in complex and dynamic environments. Particularly when faced with various potential traffic situations and behavior patterns, autonomous driving systems can achieve safe and effective driving in intricate and ever-changing traffic conditions.

4. Risk Quantification Methods and Cloud Takeover Analysis

4.1. Risk Quantification Methods

In the field of autonomous driving, methods for quantifying risk levels are crucial for ensuring the safety and reliability of the system. These methods help assess and quantify potential safety threats, enabling autonomous driving systems to identify risks and take appropriate preventive or mitigation measures. Below is a comparison of some commonly used risk quantification methods. The advantages and disadvantages, as well as examples of their application in autonomous driving, are shown in Table 2.
The method used in the risk assessment experiments of this paper is the risk indicator measurement method, with the risk level quantification selecting the probabilistic risk assessment method, fitting the risk indicators using a normal distribution function. Due to the relatively singular scenarios in which various risk indicators measure risk magnitude, it is challenging to address the complex traffic environment of urban roads. Additionally, the differing units of risk measurement complicate quantitative analysis. Therefore, this paper normalizes various risk indicators and proposes a comprehensive risk indicator measurement method. This risk assessment method is more suitable for the complex traffic scenarios found on urban roads, with specific implementation methods detailed in the experimental analysis section later in the text.
The most direct and effective way to uniformly measure risk indicators of different evaluation types is normalization. Data normalization is the process of converting data of different scales and ranges into a unified standard, which is crucial in fields such as data preprocessing, machine learning, and deep learning. It helps to improve the accuracy and efficiency of models. When the magnitude difference in the data is large, the model may assign higher weights to features with larger ranges, ignoring other important but smaller features. After normalization, each feature is given the same importance, which can improve the overall performance of the model. Normalization can also avoid some numerical problems, such as floating-point overflow or underflow, which is very important for maintaining the stability of the algorithm and reducing calculation errors. Another advantage of normalization is that it can enhance the consistency and comparability of data, especially when dealing with data from different sources and scales.
x n e w = x x min x max x min
The transformation function is as follows:
where x max is the maximum value of the sample data, and x min is the minimum value of the sample data.
E _ t o t a l = η i E _ R i
After normalizing each type of risk indicator, weight assignment is performed, and finally, the ultimate risk measurement value is obtained by accumulating the weighted values, as shown in the formula below:
where E _ t o t a l represents the final risk value, E _ R i represents each risk measurement indicator, and i = 1 , 2 , 3 represents the number of risk types.
After normalizing the three different scales of data, a comprehensive risk assessment is usually conducted by using the subjective hierarchical analysis method and the objective entropy weight method to enhance the accuracy of the assessment [3]. The entropy weight method is an objective weighting technique that determines weight based on the variability of the data itself, avoiding the influence of subjective factors and making the weight more objective and credible. It establishes the weights of vehicle collision risk assessment indicators by analyzing the variability of the data within the evaluation decision information table. This method sets the objective weights of each evaluation indicator based on the differences in the data itself. The calculation formula is as follows:
η i = 1 e i i = 1 n 1 e i
e i = k i = 1 m p i j ln p i j
p i j = r i j / i = 1 m r i j
where k = 1 / ln n is sample size, e i refers to information entropy, and m is the adjustment coefficient. p i j represents the standardized value of the j evaluation object on the i indicator, while r i j represents the original value of the j evaluation object on the i indicator.
Research by Cafiso S et al. [40] shows that if the safety evaluation indicators follow a normal distribution, the 50th and 85th percentiles of the indicator can be used as thresholds to classify the driving risks of autonomous vehicles. The normal distribution is represented as a symmetric bell curve, where most data points are concentrated around the mean (μ), and the width of the distribution is measured by the standard deviation (σ). The formula is as follows. If the random variable ξ has a density function:
p ( x ) = 1 2 π σ e ( x μ ) 2 2 σ 2
where σ > 0 , μ R , it is said that ξ follows a normal distribution N ( μ , σ ) .
Thus, objective weighting is assigned to various risk measurement indicators, considering risks in different scenarios through a comprehensive risk measurement approach, which avoids the limitation of using a single risk indicator. Then, risk quantification is performed using normal distribution fitting in probabilistic risk assessment to classify risk levels.
This paper analyzes three effective risk indicators. Therefore, the formula for risk indicator measurement is as follows:
E _ t o t a l = η 1 E _ R 1 + η 2 E _ R 2 + η 3 E _ R 3 η 1 + η 2 + η 3 = 1
where E _ t o t a l represents the final risk value, E _ R 1 represents the normalized value of TTC, E _ R 2 represents the normalized value of DRAC, E _ R 3 represents the normalized value of MDRAC, and η 1 , 2 , 3 represents the weight parameters of various risk values.
The entropy weight objective assignment method is then used for weight assignment, with the quantification evaluation method for risk factors shown in Table 3. The table illustrates the quantification methods for key evaluation indicators in the three risk assessment methods. Based on the driving conditions of vehicles in urban road environments, three levels are categorized as “1, 2, 3.” “1” indicates low risk, “2” indicates medium risk, and “3” indicates high risk.

4.2. Cloud Takeover Assisted Decision Analysis

4.2.1. Strategic Research

For Level 3 (L3) and Level 4 (L4) autonomous vehicles, there may not be a backup user for dynamic driving tasks, meaning there is no driver inside or outside the vehicle. In this case, when the vehicle experiences a malfunction while driving on urban roads and can no longer continue dynamic driving tasks, control should be taken over by the cloud or the Automated Driving System (ADS) to implement the vehicle’s minimum risk control. Different scenarios require the design of cloud takeover strategies, and a vehicle risk assessment model should be applied to dynamically monitor the safety operation risks during the takeover process.
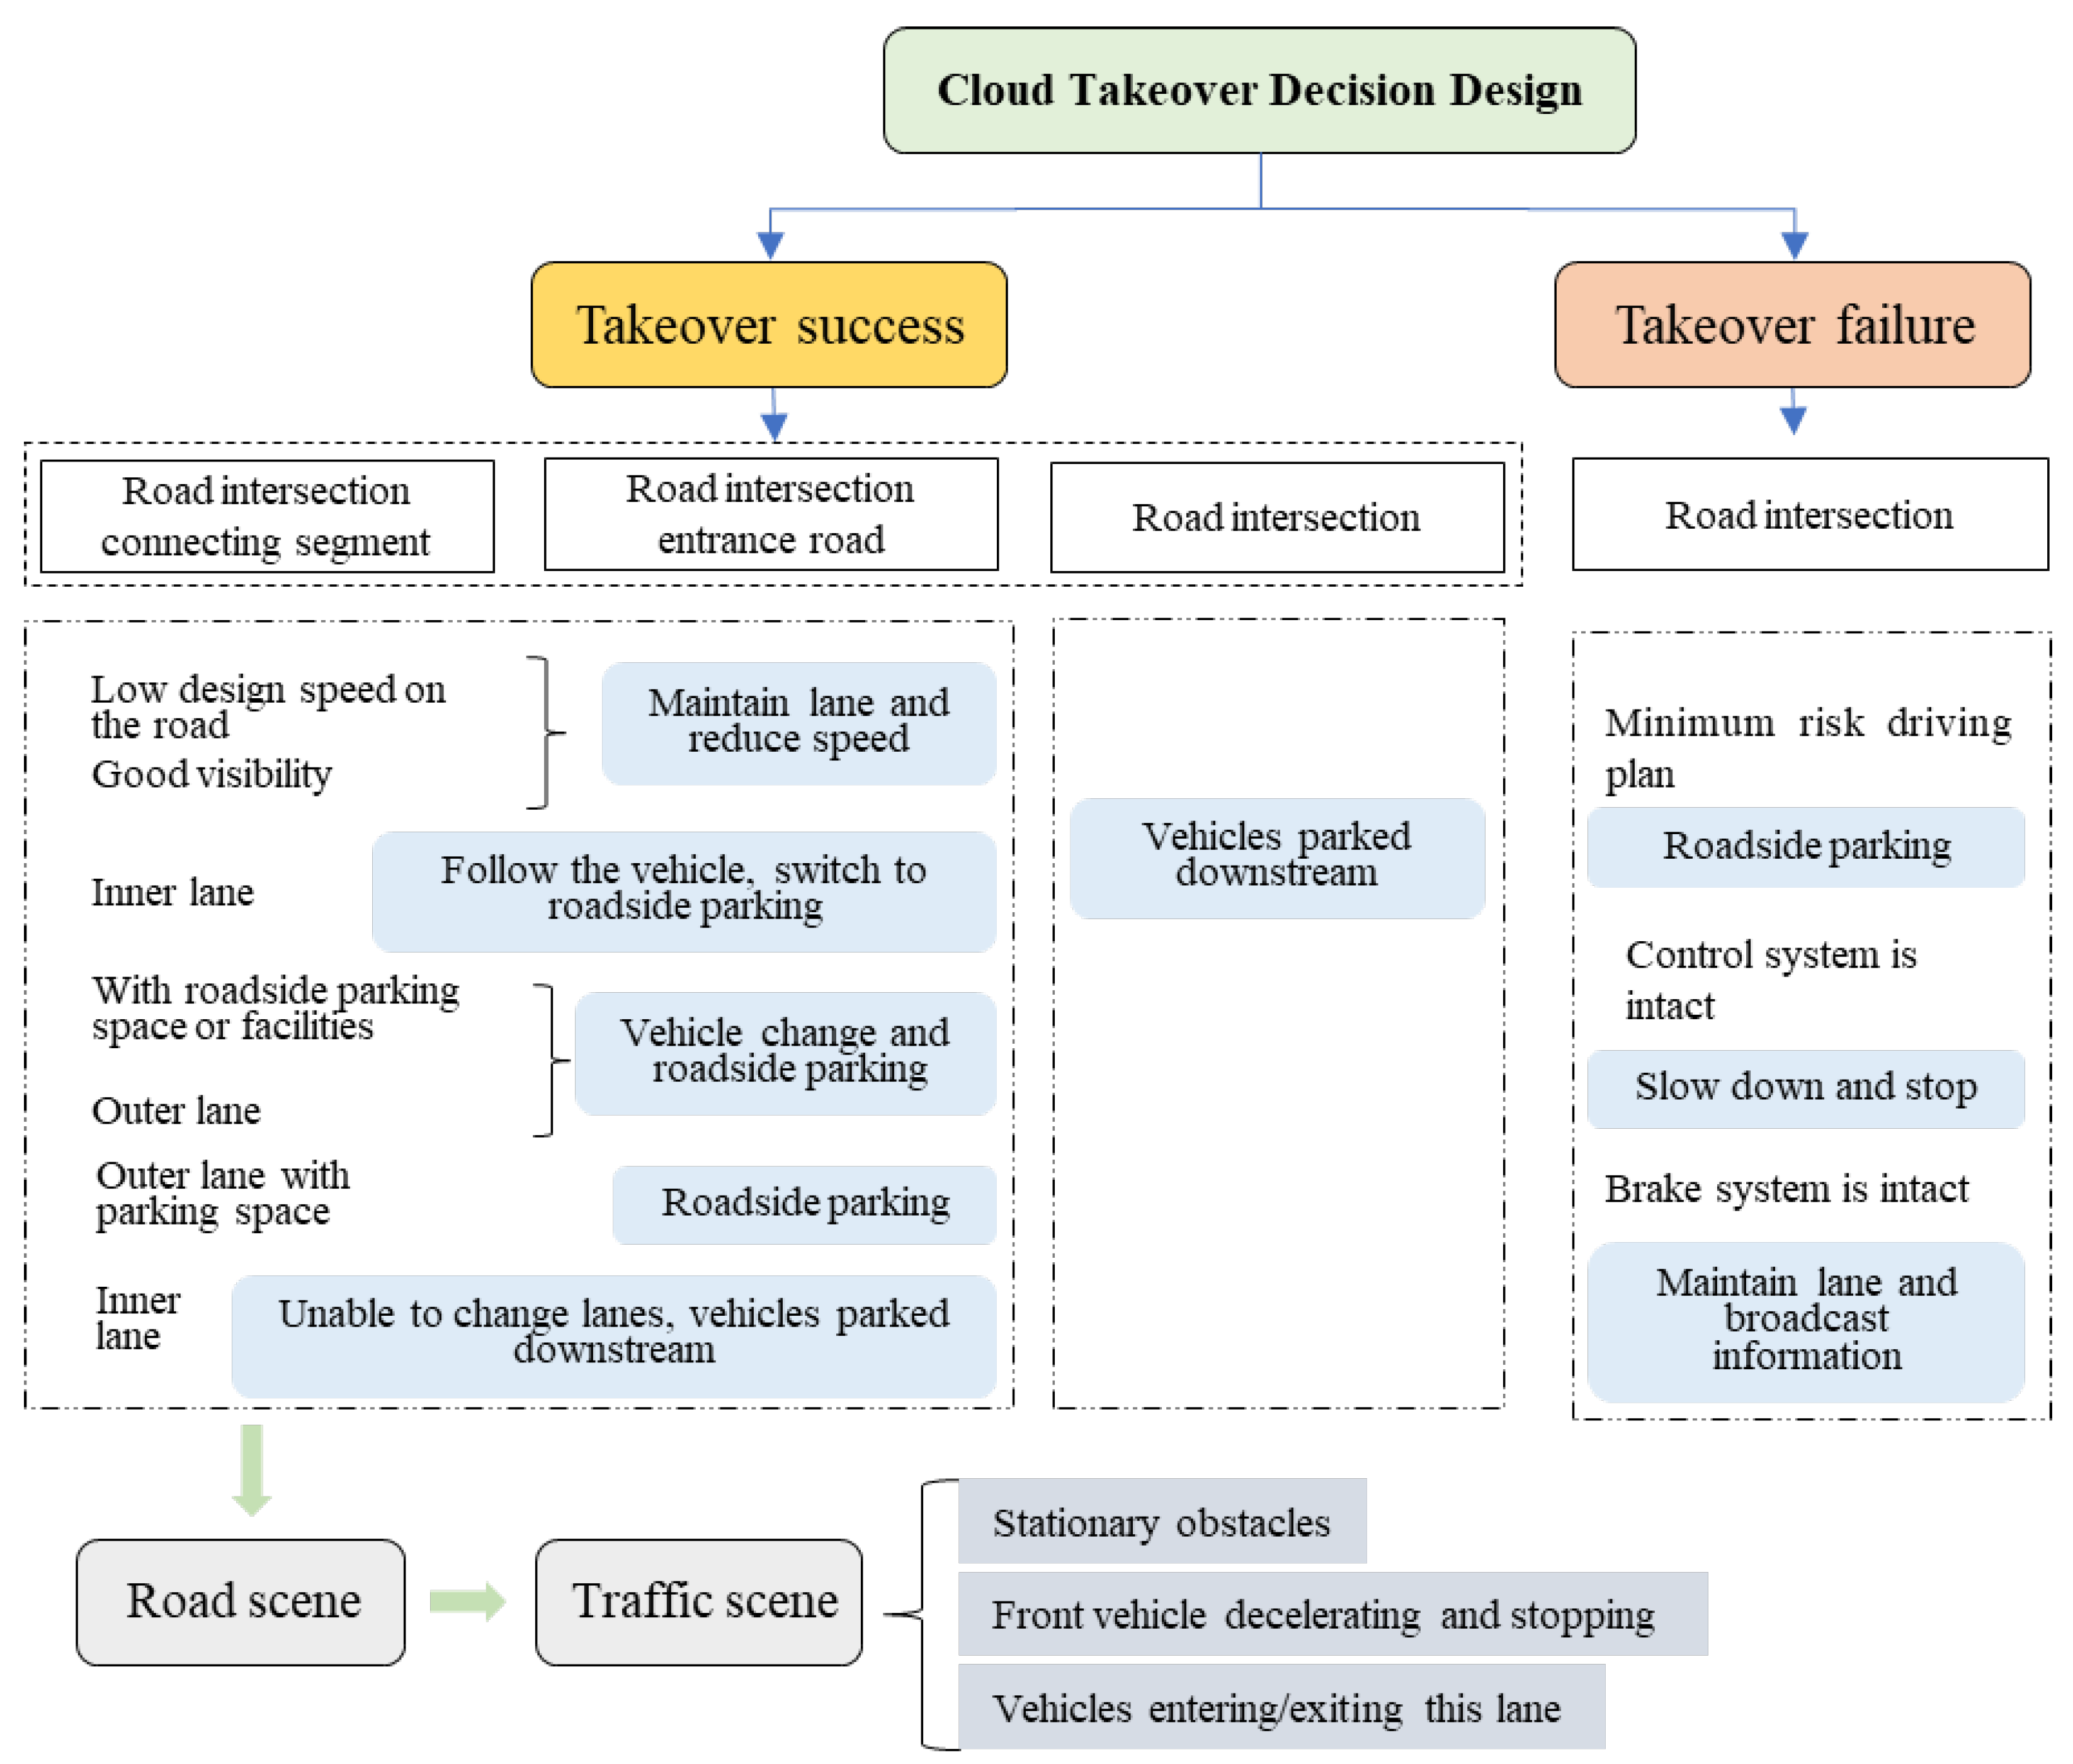
This paper categorizes driving environments into three types of road scenarios: intersection approach segments, intersection approaches, and internal intersection spaces. Vehicles exhibit different behavioral characteristics in these scenarios. For example, in the intersection approach segment scenario, vehicles typically operate in a free-flow state, allowing them to follow, change lanes, or overtake as expected. In the intersection approach, traffic density increases, leading to stronger coupling relationships between vehicles, with more frequent acceleration and deceleration. The typical behavior in this scenario is following another vehicle while maintaining a safe distance. In the internal intersection space, vehicles are in the process of traversing the intersection, and their behavior is influenced by the driving route (left turn, straight, right turn), the geometric topology of the intersection, and conflicts with vehicles from other approaches. As shown in Figure 2, it is necessary to design reasonable, safe, and feasible cloud takeover strategies based on the different scenarios and states of the vehicles.
In the intersection approach segment scenario, candidate cloud takeover strategies include the following: maintaining the lane while reducing speed, maintaining the lane while decelerating to a stop, and changing lanes to park on the roadside. Among these, the strategy of maintaining the lane while decelerating to a stop is suitable for conditions with good visibility and low road design speeds. The lane change to roadside parking strategy must consider the lane in which the vehicle is located; if the vehicle is in the inner lane, multiple lane changes may be required to achieve roadside parking, potentially increasing risks to other road users. Additionally, this strategy must also consider whether there are parking spaces or facilities available on the roadside.
In the intersection approach scenario, candidate cloud takeover strategies include roadside parking strategy and downstream segment parking strategy. The roadside parking strategy is suitable when the vehicle is in the outer lane and there are parking spaces or facilities available; the downstream segment parking strategy is applicable when the vehicle is in the inner lane and is unable to change lanes due to traffic regulations or the influence of other lateral vehicles. In this case, the vehicle can be guided to a suitable space downstream for parking.
In the internal intersection space scenario, the candidate cloud takeover strategy includes the downstream segment parking strategy. When a vehicle experiences an abnormal state in the internal intersection space, it should be promptly guided to exit the intersection to avoid collisions caused by the vehicle stopping or violating other traffic rules.
The aforementioned cloud takeover strategy is a passive takeover, meaning that the system issues a takeover request, and the cloud takeover system responds and completes the corresponding takeover actions. In certain special circumstances, the cloud takeover system can proactively take over based on integrated perception data and risk assessment results to reduce the risk of collision accidents. For example, if a vehicle deviates from its planned trajectory while passing through an intersection, it may lead to a collision with other vehicles entering the intersection at the same phase; other special events may also increase the risk of vehicle operation.
In the event of a failure in the cloud’s takeover of an autonomous vehicle, the autonomous driving system should implement a minimum-risk driving plan. Based on the vehicle’s operational risk and the analysis results of offline scenario data, the risks and feasibility of the currently available minimum-risk driving plans should be assessed, and an appropriate minimum-risk driving plan should be selected. Additionally, when the autonomous driving system experiences a fault or failure, the corresponding minimum-risk driving plan should be executed. The minimum-risk driving plans should be designed according to the different functional failures of the autonomous driving system. When the control system of the autonomous driving system is intact, it should pull over as soon as possible; if the autonomous steering system fails, it should decelerate and stop; and if the braking system of the autonomous driving system fails, it should maintain its current lane and promptly broadcast emergency information to surrounding vehicles.

4.2.2. Advantage Analysis

(1)
Driverless Takeover Mechanism
The core challenge for L3/L4 automated driving lies in how to handle sudden failures after the transfer of responsibility. Cloud-based takeover replaces human intervention through remote control, addressing the safety gap in scenarios without user backup. When sensors fail, the cloud directly plans an obstacle avoidance path, improving response speed by three times compared to traditional manual takeover. This mechanism is especially suitable for high-risk scenarios such as nighttime or adverse weather when drivers are prone to fatigue.
(2)
Scenario-Based Dynamic Decision-Making Capability
The cloud strategy achieves precise adaptation based on traffic characteristics at different segments of intersections: progressive speed reduction is applied at entrance segments to avoid abrupt braking and rear-end collisions; entrance lanes obtain traffic light phases via vehicle–road collaboration and intelligently select roadside or downstream parking points; and conflict zones prioritize guiding vehicles to exit safely. The system can also learn from historical accident data to continuously optimize decision thresholds under varying weather conditions.
(3)
Proactive Safety Defense System
Cloud-based prediction using fused perception identifies complex risks that traditional AEB systems cannot handle. When a vehicle trajectory deviation occurs, the cloud acquires surrounding vehicle motion status through V2X and triggers takeover 200–300 m in advance. This technology greatly helps eliminate hidden dangers in extreme cases like “phantom vehicles” (sudden random lane changes).
(4)
Multiple Redundant Safety Guarantees
A dual-layer protection combining “cloud takeover and onboard minimum risk maneuvers” is employed: in case of communication interruption, the vehicle automatically switches to a locally stored emergency plan library and executes roadside parking or emergency broadcasting according to the fault type.

5. Verification Experiment of Risk Quantification and Classification Method

5.1. Simulation Scenario Setup and Data Acquisition

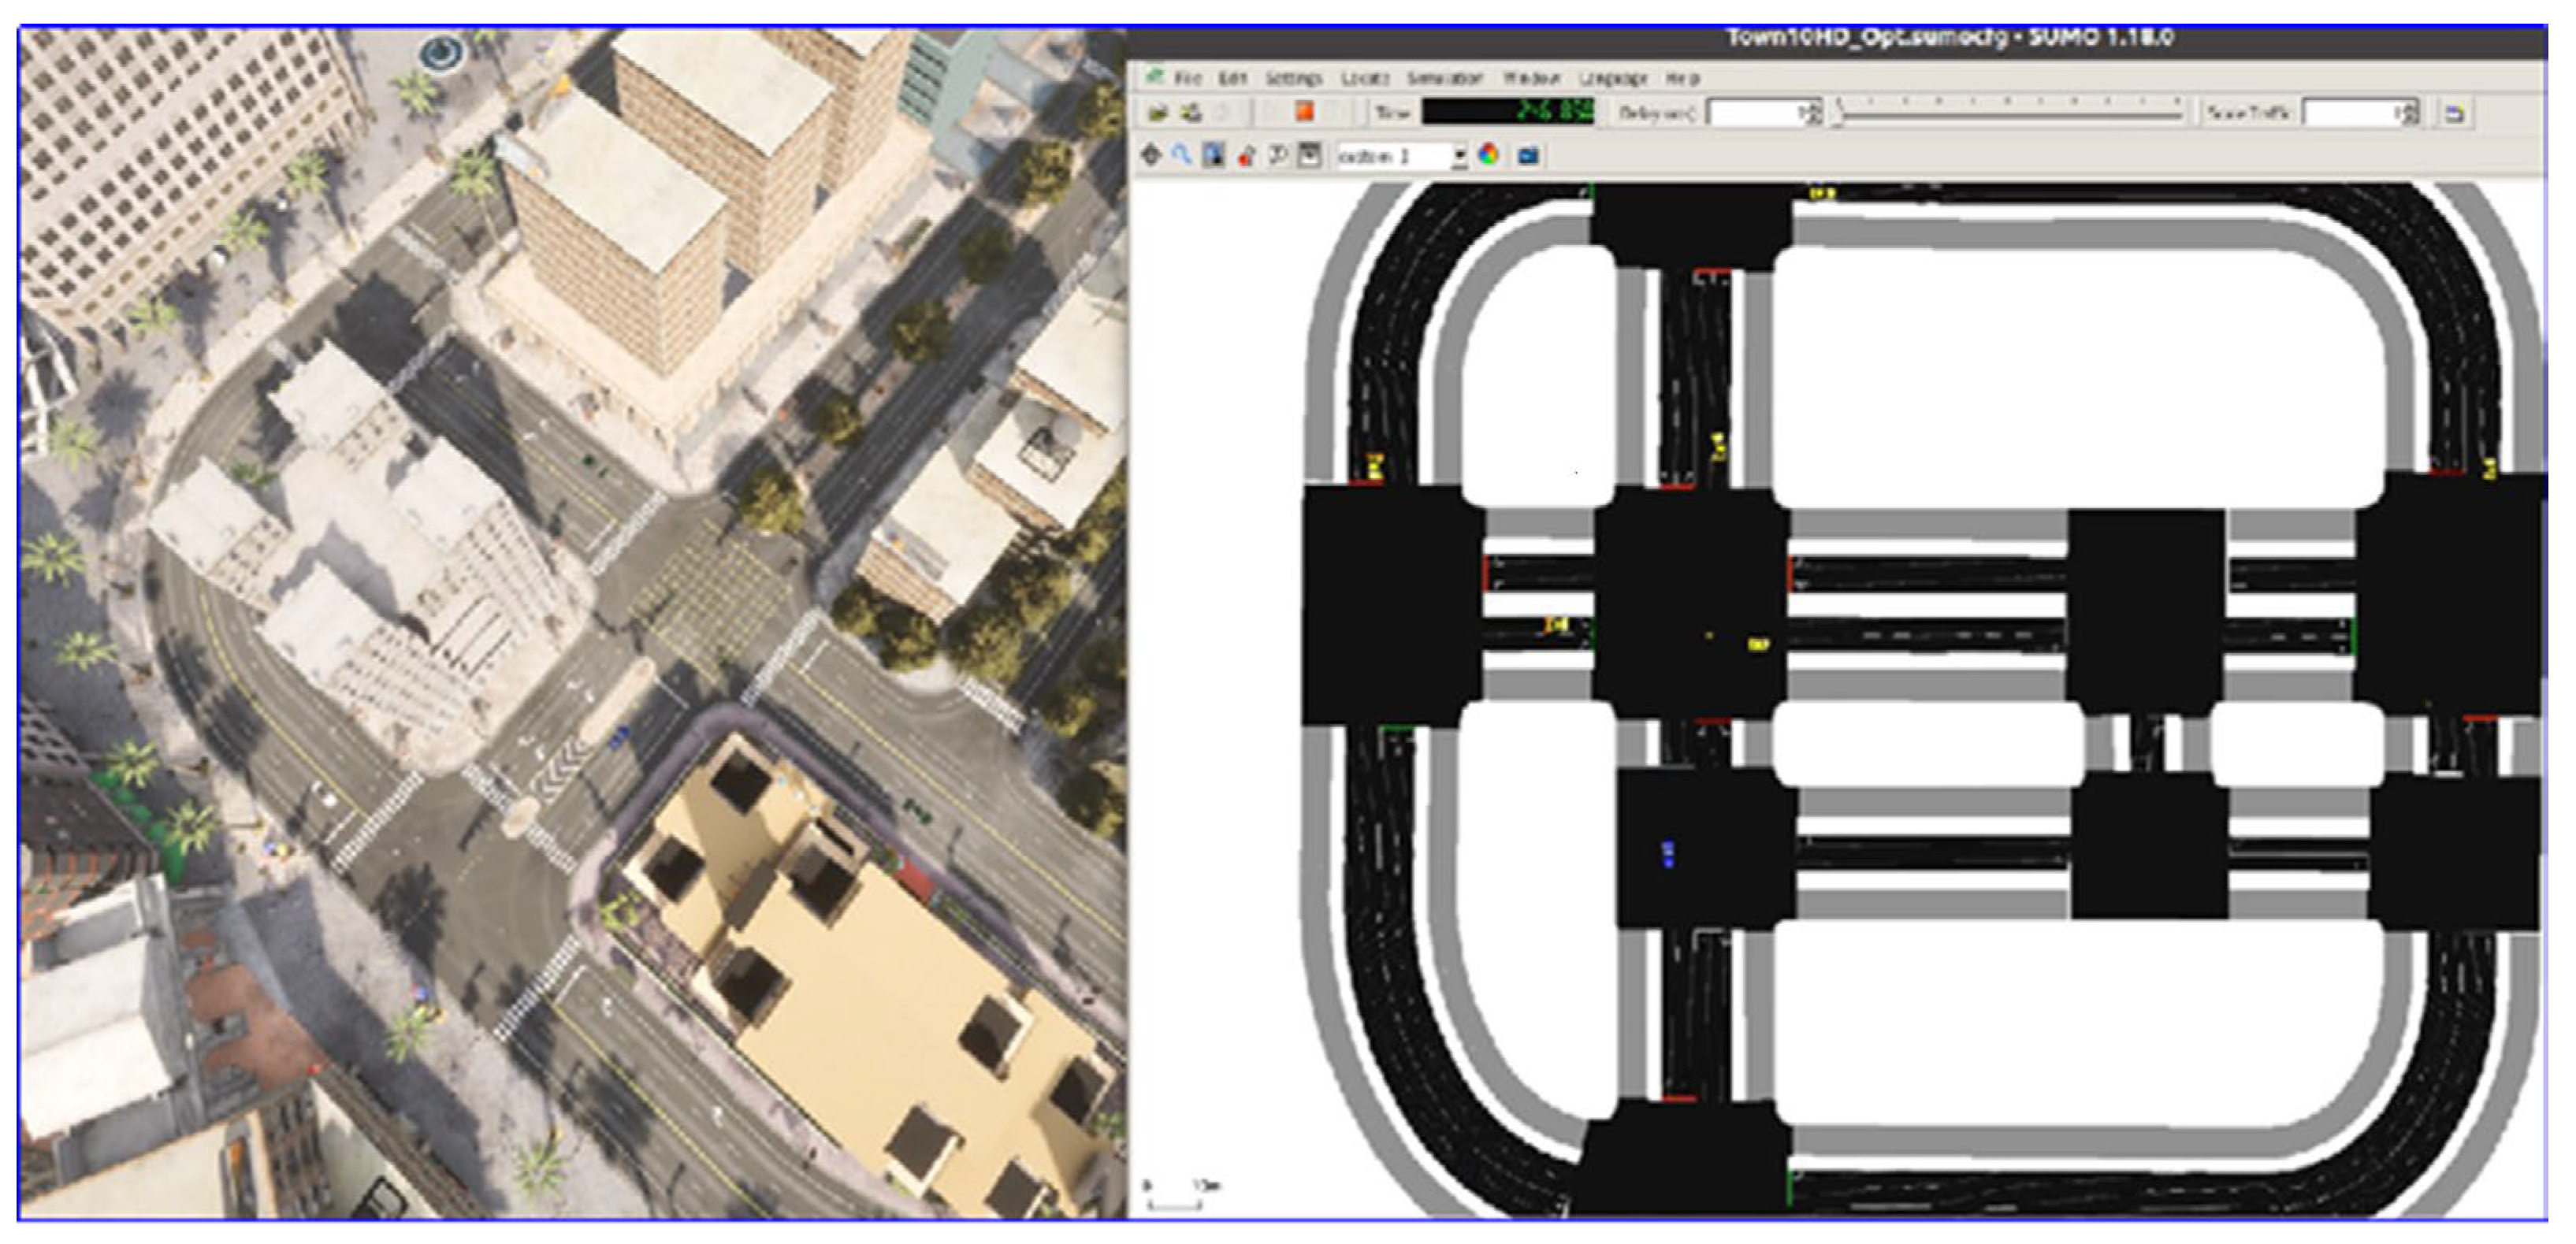
The abnormal behavior and risk assessment scenarios we are studying refer to the operational state and external environment of autonomous vehicles, including speed, road conditions, traffic, weather, lighting, and all other environmental factors that ensure the proper functioning of autonomous driving features. As shown in Figure 3, the construction of urban road environments for autonomous vehicles driving in simulation scenarios can be divided into two parts: urban traffic environment and dynamic traffic scenarios. Among these, the construction of the urban road environment includes five aspects: roads, transportation infrastructure, traffic participants, natural environment, data, and communication.
In autonomous driving, data and communication are core elements, including vehicle-to-vehicle (V2V), vehicle-to-infrastructure (V2I), vehicle-to-pedestrian (V2P), and vehicle-to-network (V2N) communication, collectively known as V2X (vehicle-to-everything) communication. V2X enables autonomous vehicles to obtain real-time information about their surrounding environment, including the position and speed of other vehicles, traffic light status, and even traffic conditions on upcoming road segments. In a simulation environment, this requires building an efficient data exchange and processing platform to simulate real-world communication delays, data loss, and interference. Through such simulations, it is possible to evaluate the performance of autonomous driving systems when faced with information transmission delays or inaccuracies, thereby improving algorithms and enhancing system stability and reliability.
In CARLA, vehicle data collection comes from the vehicle’s sensors, such as cameras, LiDAR, millimeter-wave radar, inertial measurement units (IMU), and global navigation satellite systems (GNSS). Sensors are participants that collect, retrieve, transmit, and update data from the surrounding environment and are crucial for creating a learning environment for autonomous driving agents.

5.2. Risk Level Verification

After feedback training, the system output a total of 56,117 risk data entries. During the risk level quantification process, a distribution fitting test method was used. The consistency verification between individual risk values and the distribution of traffic conflicts is completed in the detailed experimental result analysis below. Specifically, the random experimental data selected are also the abnormal data detected by the system, which are then analyzed according to the model requirements.
To evaluate the performance of the method proposed in this paper, four parameters were selected to measure different aspects of the experimental results. Recall refers to the ratio of the number of vehicle abnormal behaviors identified by the model to the number of vehicle abnormal behaviors existing in the sample. Accuracy is the proportion of all true vehicle abnormal behavior numerical results identified by the classification model to the total quantity. Precision is the ratio of the number of true vehicle abnormal behaviors identified by the model to the number of vehicle abnormal behaviors identified by the model (including false positives), which measures the targeting of the model. F1 is the weighted harmonic mean of accuracy and precision, which can better and more comprehensively measure the performance of the model. The four parameters are defined as follows:
Recall   = TP TP + FN
Accuracy = TP + TN TP + TN + FP + FN
  Precision = TP TP + FP
F 1 = 2 × Precision × Recall   Precision + Recall .
The confusion matrix of the evaluation metrics is shown in Table 4.
In this paper, the comprehensive risk measurement method (CRM) proposed and five algorithms, including KNN, SVM, Federated Partition Learning Architecture (FPLA), Improved Boids model, and Naive Bayes method, are compared regarding the identification of abnormal behavior data of autonomous vehicles. The results show that the accuracy, precision, recall, and F1 scores of the method proposed in this paper have good results. The comparison results are shown in Table 5.
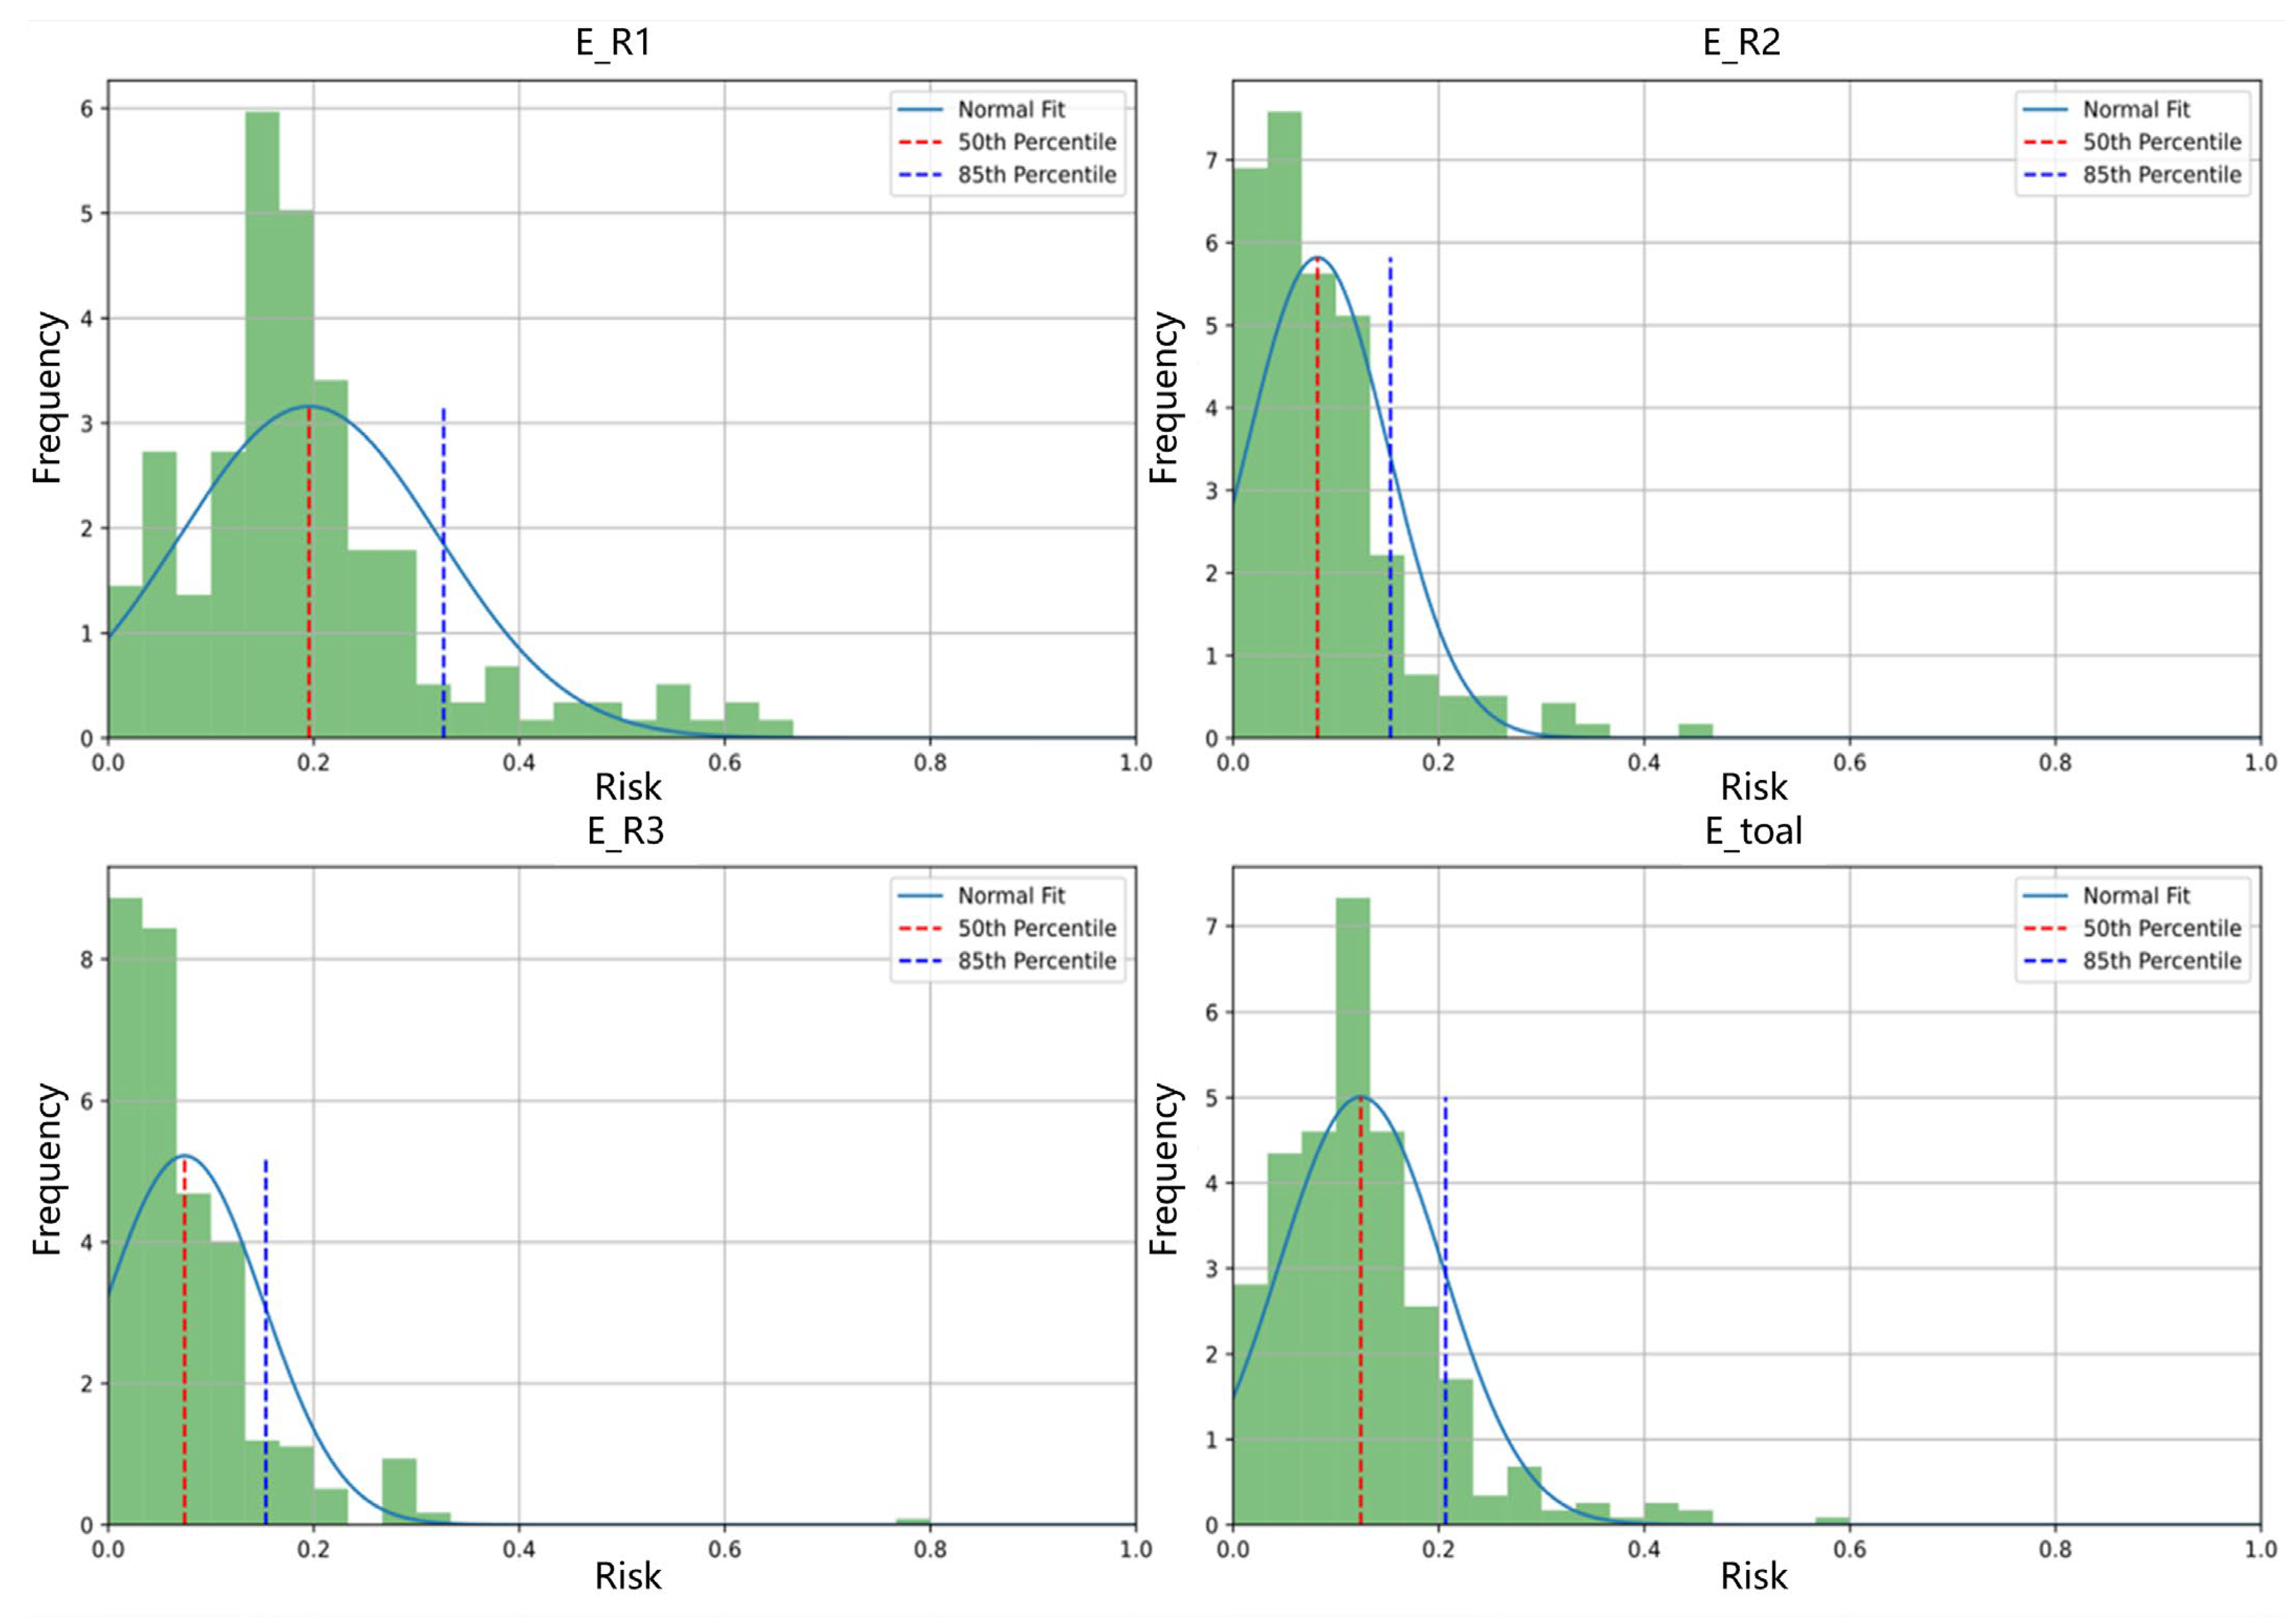
The extracted three types of valid risk value data are subjected to risk quantification and grading. If appropriate thresholds can be established to measure safety evaluation indicators, these thresholds can effectively be used for the safety assessment of driving risks in autonomous vehicles. If it is confirmed that the risk indicator values follow a normal distribution, we can utilize the 50th percentile and the 85th percentile of the normal distribution to determine suitable risk thresholds for classifying risk levels. The results of the normal distribution fitting for the data are shown in Table 6 and Figure 4.
In each graph, the green histogram represents the actual data distribution, while the blue curve represents the fitted normal distribution. The red dashed line indicates the 50th percentile, and the blue dashed line indicates the 85th percentile. From the graphs, we can observe the following: E _ R 1 (top left): the data distribution is relatively concentrated but exhibits some degree of skewness. The normal distribution fit captures the characteristics of the central region of the data well but may not fully align with the actual data distribution in the tails. The 50th and 85th percentiles mark the center and higher positions of the data. E _ R 2 (top right): The data distribution appears to deviate significantly, particularly with some extreme values present. Although the normal distribution fit attempts to capture the central trend, the actual data distribution is skewed. E _ R 3 (bottom left): Similarly to E _ R 2 , the data distribution shows some skewness, and the normal fit covers the main range of the data, but there are still some mismatches in capturing the extreme values in the tails. E _ t o t a l (bottom right): The data distribution for this variable is relatively closer to a normal distribution, although some slight skewness can still be observed. The normal distribution fit is relatively good, aligning more closely with the actual data distribution, especially in the central region. Therefore, risk levels can be classified based on risk indicator E _ t o t a l , while the other three risk indicators serve as references for validating the risk level classification. The results are shown in Table 7.

5.3. Risk Quantification and Classification Method Validation

Ten data points were randomly selected from the risk indicator dataset to verify whether the risk classification aligns with actual conditions, as shown in Table 8. To assess the reasonableness of the risk level classification, instances of risk levels “1, 2, and 3” were selected for analysis. To distinguish from risk level “1”, it is stipulated that the critical points at which risk begins and ends are classified as level “0”.

5.3.1. Randomized Trial 1

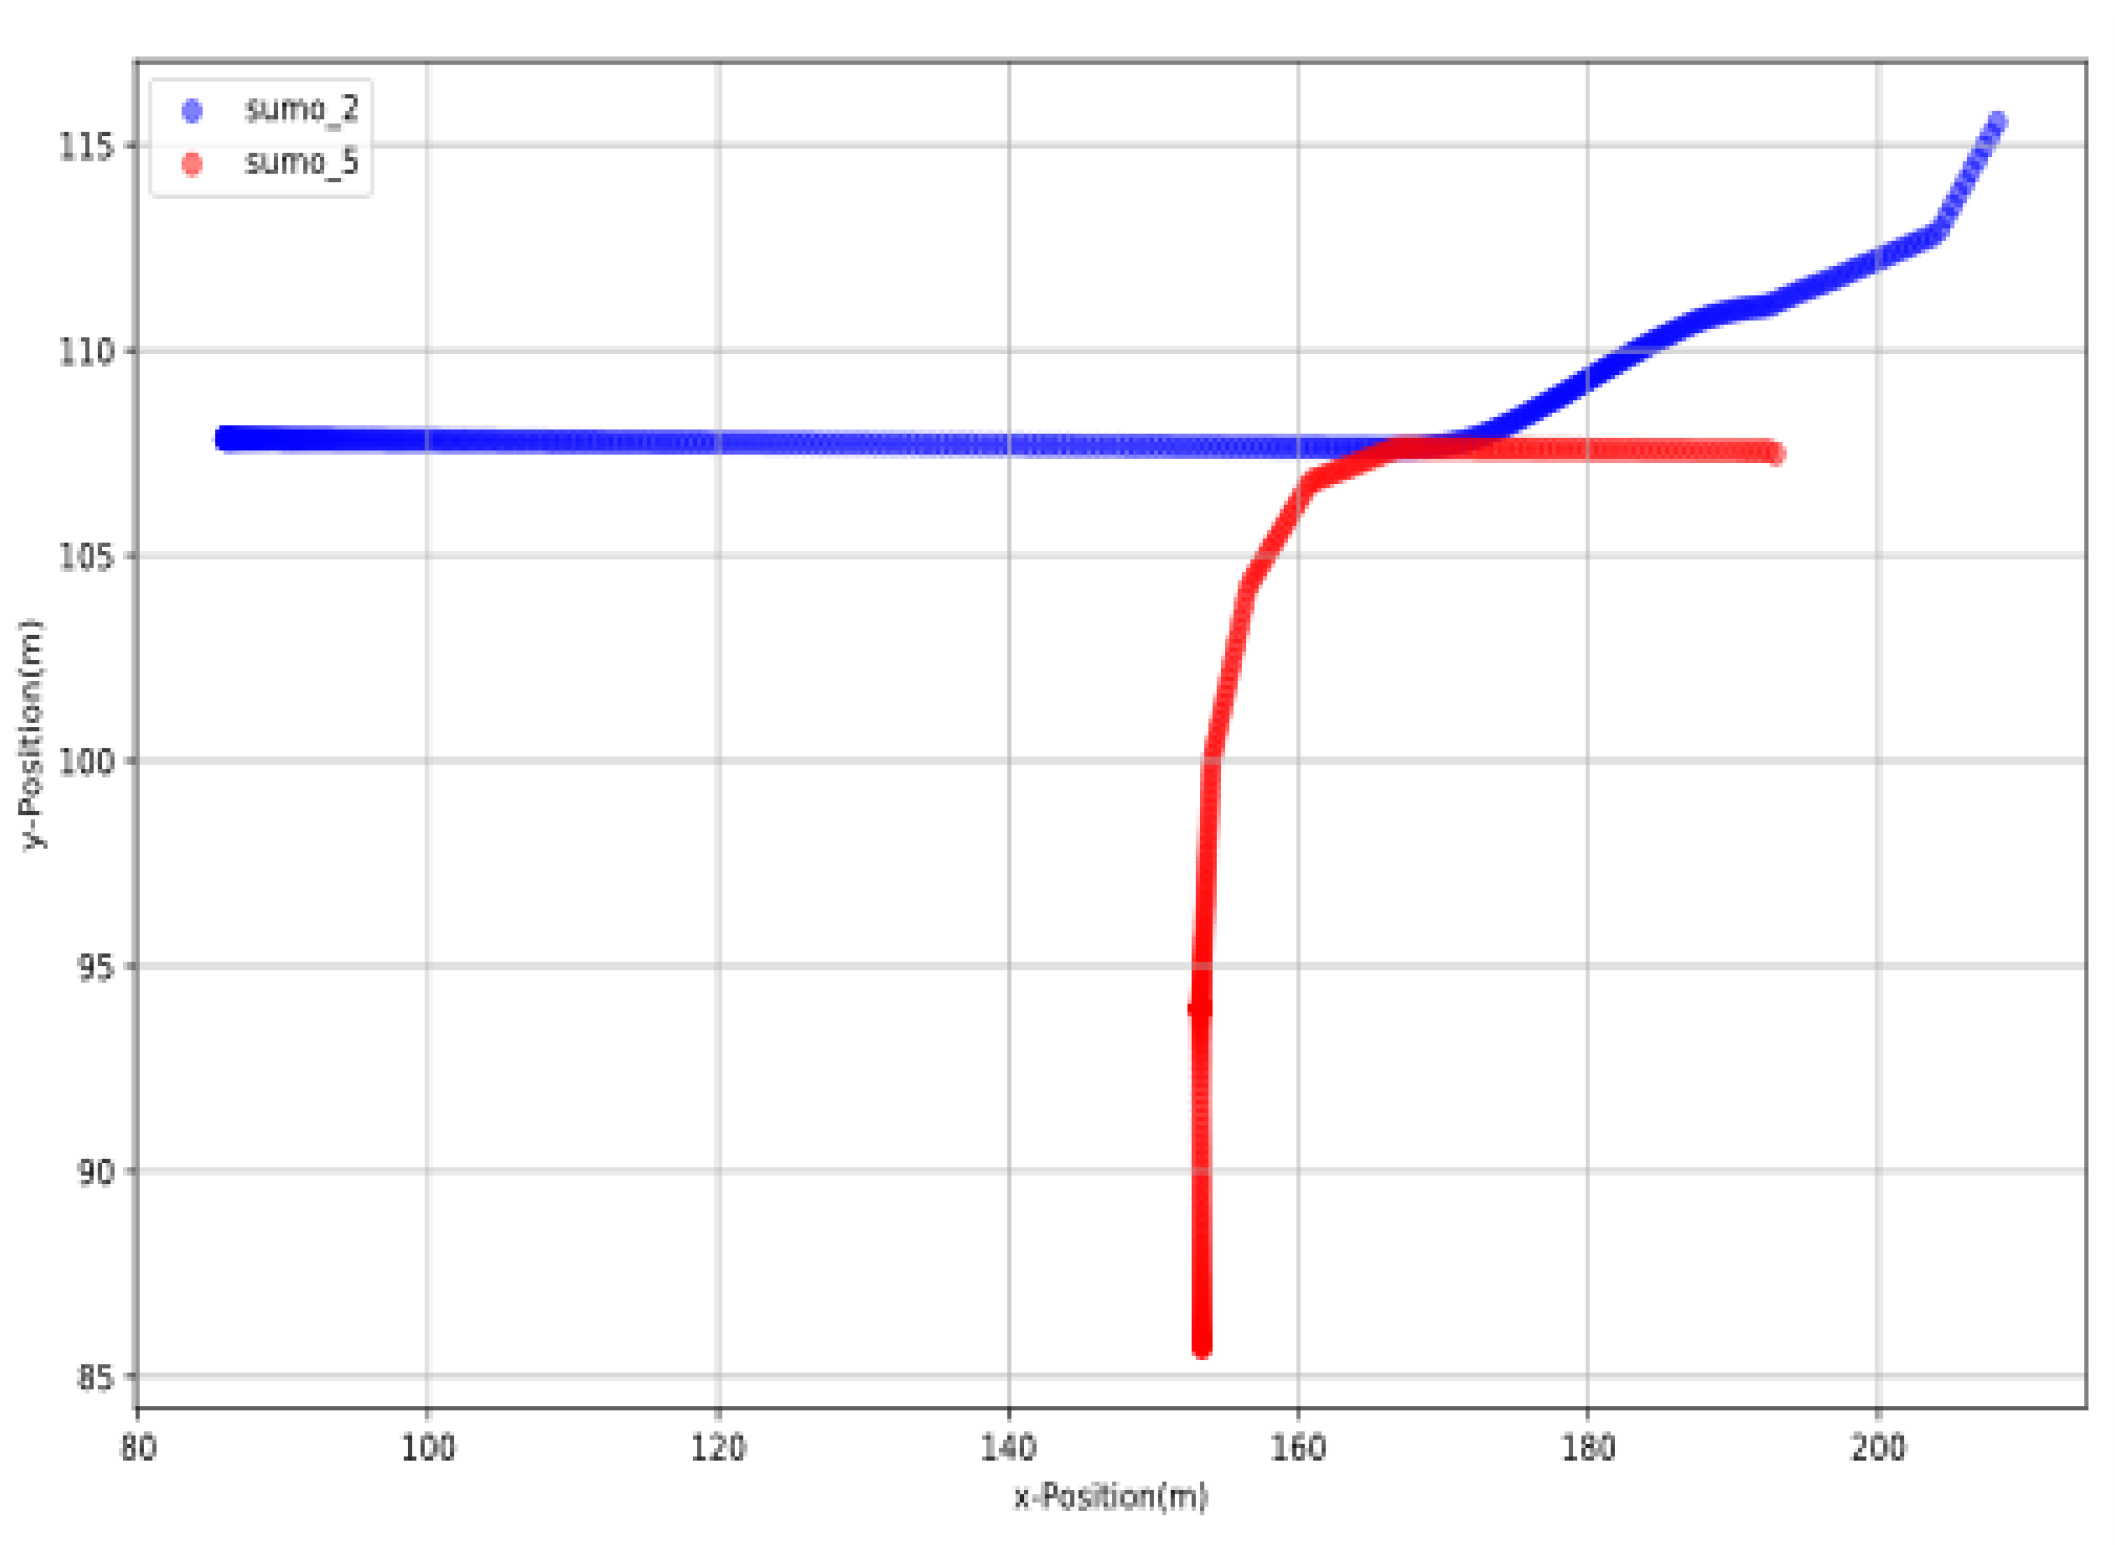
In the first data entry of Table 8, the risk occurs between 0.05 s and 16 s. From the data table, it can be seen that at 3.1 s, the values for minTTC, maxDRAC, and maxMDRAC reach their thresholds, resulting in a risk level of 3, indicating a high collision risk. At this time, vehicle sumo_2 is located at (86, 108) with a speed of 6.03 m/s, as shown in Table 9 and Figure 5. Vehicle sumo_5 is at (153, 86) with a speed of 2.16 m/s. At this point, vehicle sumo_2 is crossing the intersection from west to east (with north being the default upward direction), while vehicle sumo_5 is making a right turn from south to east at the intersection. The two vehicles are 67 m apart and are about to merge into the same lane. Vehicle sumo_5 then stops and decelerates at the intersection, while vehicle sumo_2 accelerates through the intersection, reducing the risk level. By the time it reaches 16 s, the risk is eliminated.
In Figure 5, we can see that the lines of different colors represent the motion trajectories of two vehicles with traffic conflicts at the intersection. After analysis, it was found that the blue line representing vehicle sumo_2 in the simulation environment is driving in a straight line from west to east, while the red line representing vehicle sumo_5 is turning right from south to east. As the relative positions of vehicles gradually approach, the level of risk between them is also increasing. However, as all vehicles enter the eastbound lane and drive slowly, the risk value gradually decreases. When sumo_2 is located at position (86, 108) with a speed of 6.03 m/s, and sumo_5 is located at position (153, 86) with a speed of 2.16 m/s, the system determines that the relative risk level of the two vehicles is “3”, indicating a relatively high collision risk.

5.3.2. Randomized Trial 2

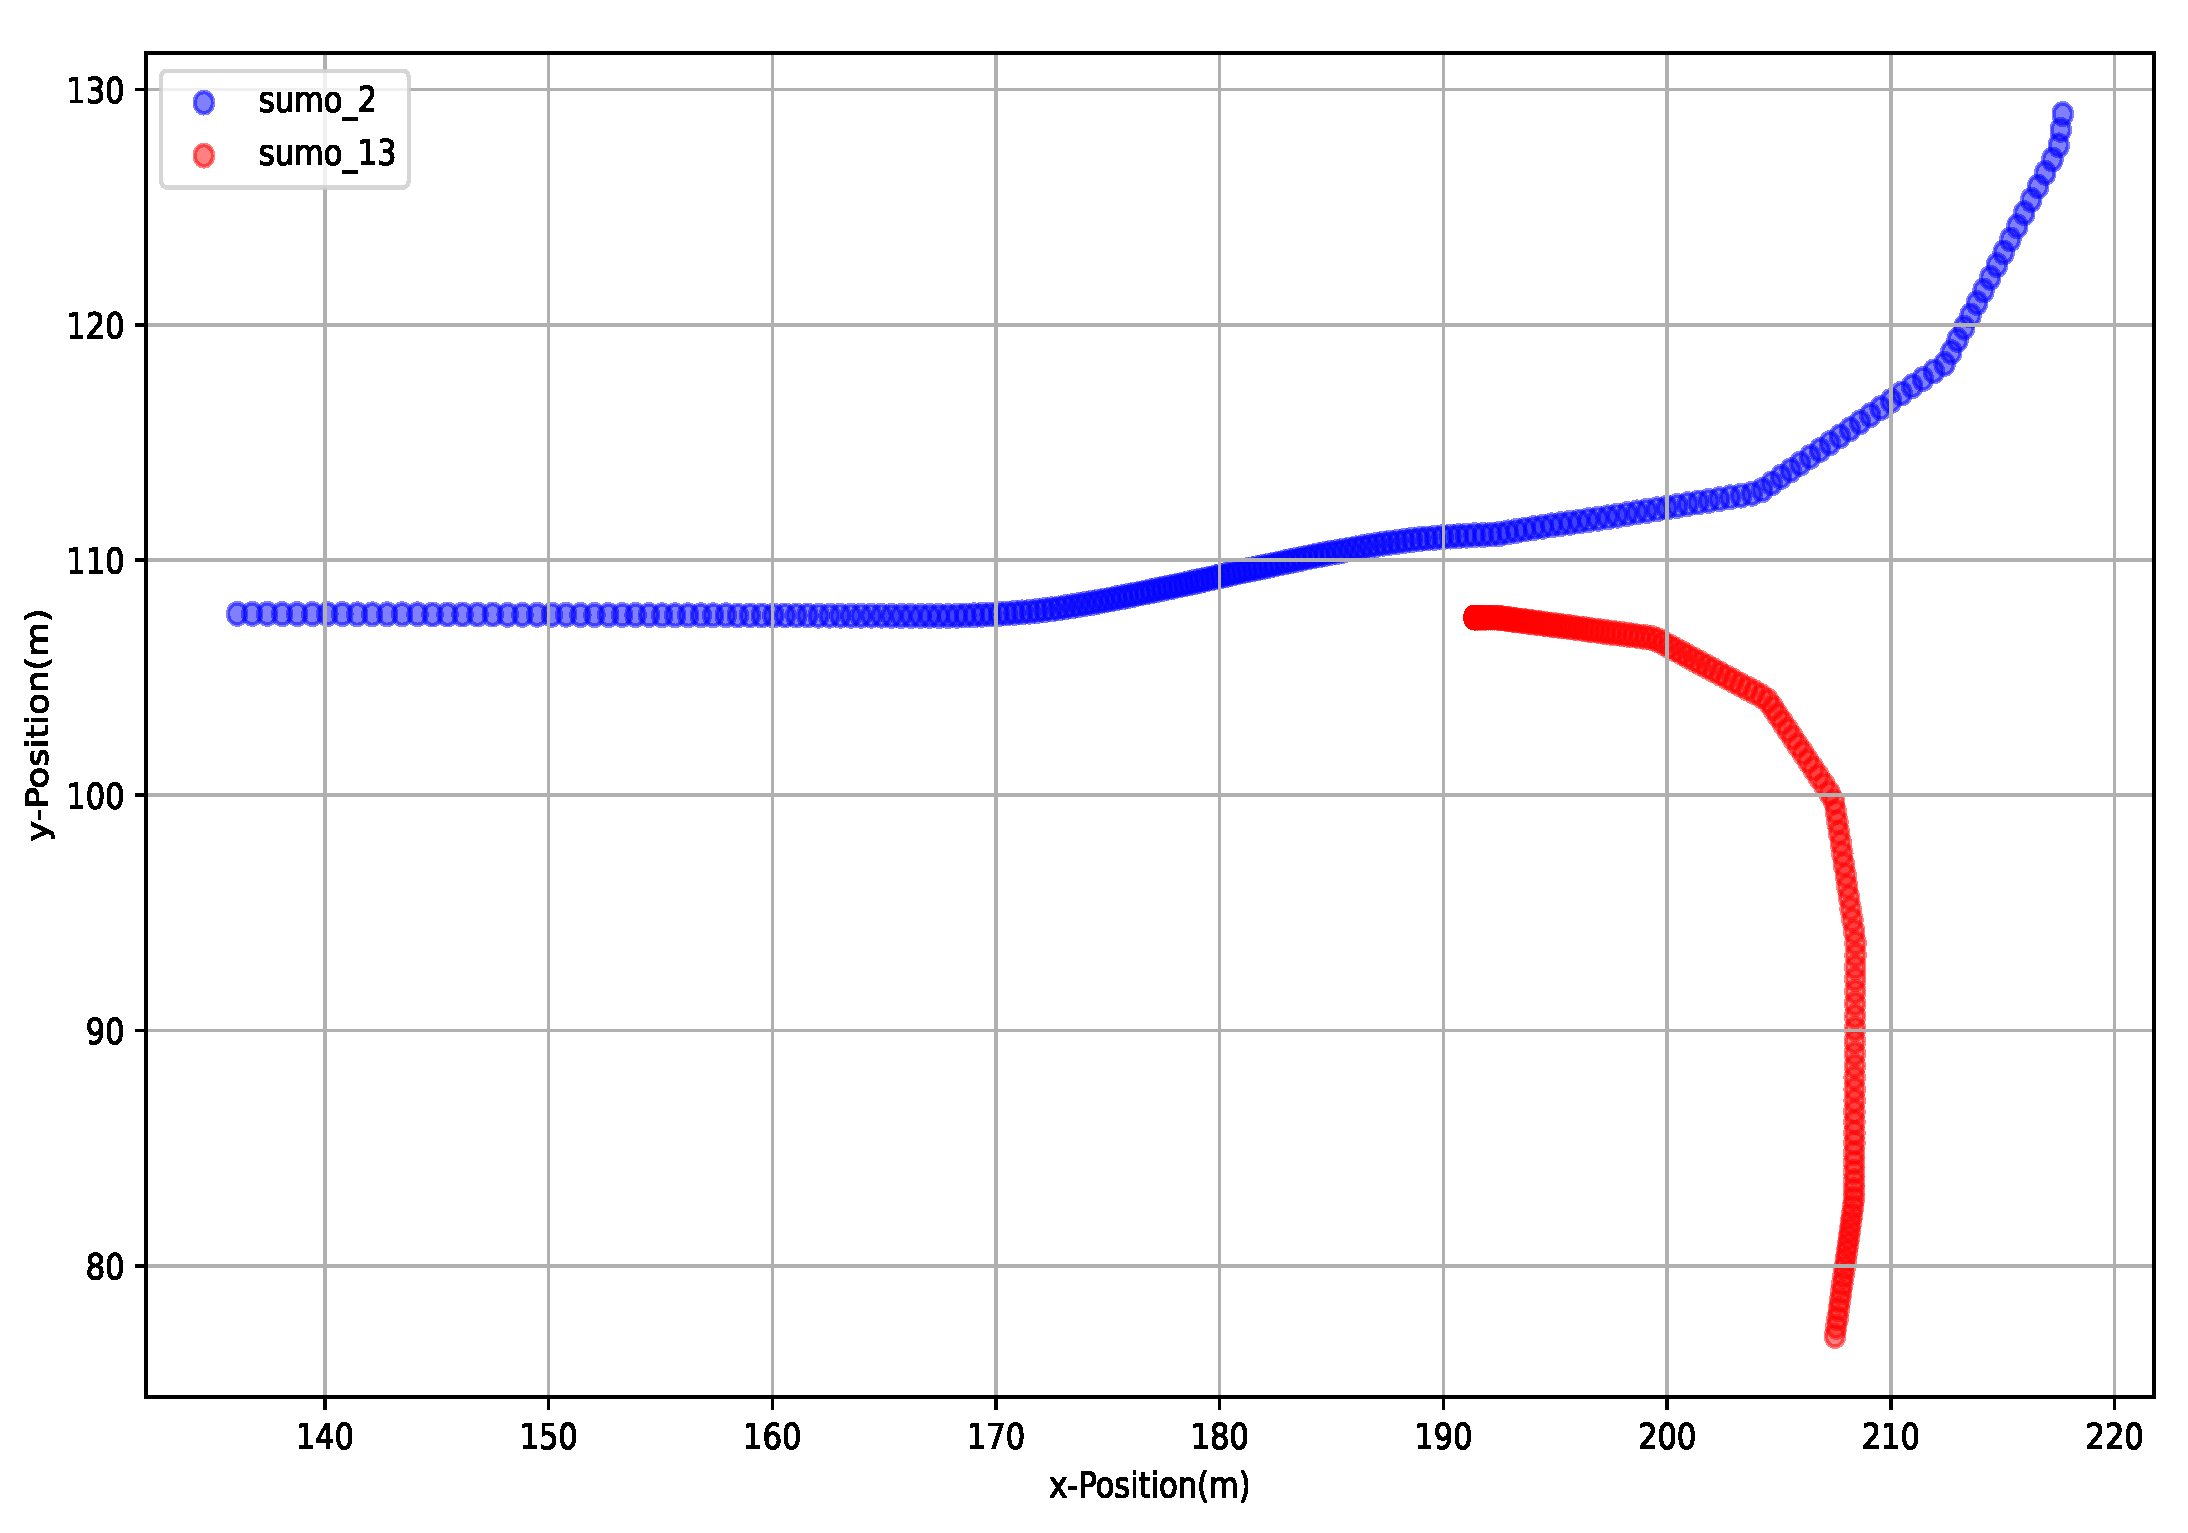
In the third data entry of Table 8, vehicle sumo_2 is traveling eastward at a speed of 13.44 m/s. At 7.2 s, it receives data from vehicle sumo_13, triggering a risk. At this moment, vehicle sumo_2 begins to decelerate, as shown in Table 10 and Figure 6. When the two vehicles are 20 m apart at 10.5 s, vehicle sumo_2 chooses to change lanes and turns from west to north to cross the intersection. At this time, sumo_2′s speed is 6.62 m/s, while vehicle sumo_13 is stationary, waiting at the intersection to proceed southward from the west. The risk values for both vehicles reach their maximum, resulting in a risk level of 1, indicating a low collision risk. By 17.4 s, both vehicles have left the intersection, and the risk has dissipated.
In Figure 6, we can see that the lines of different colors represent the motion trajectories of two vehicles with traffic conflicts at the intersection. After analysis, it was found that the blue line represents vehicle sumo_2 turning left from west to north in the simulation environment, while the red line represents vehicle sumo_13 turning left from south to west. As the relative position of the vehicle gradually approaches, the risk level gradually increases. However, as the vehicle travels normally on the target lane, the risk gradually decreases. When sumo_2 is located at position (171, 107) with a speed of 6.62 m/s and sumo_13 is located at position (191, 107), the vehicle is in a stationary state, and the relative risk level of the two vehicles is “1”, indicating a relatively low collision risk.

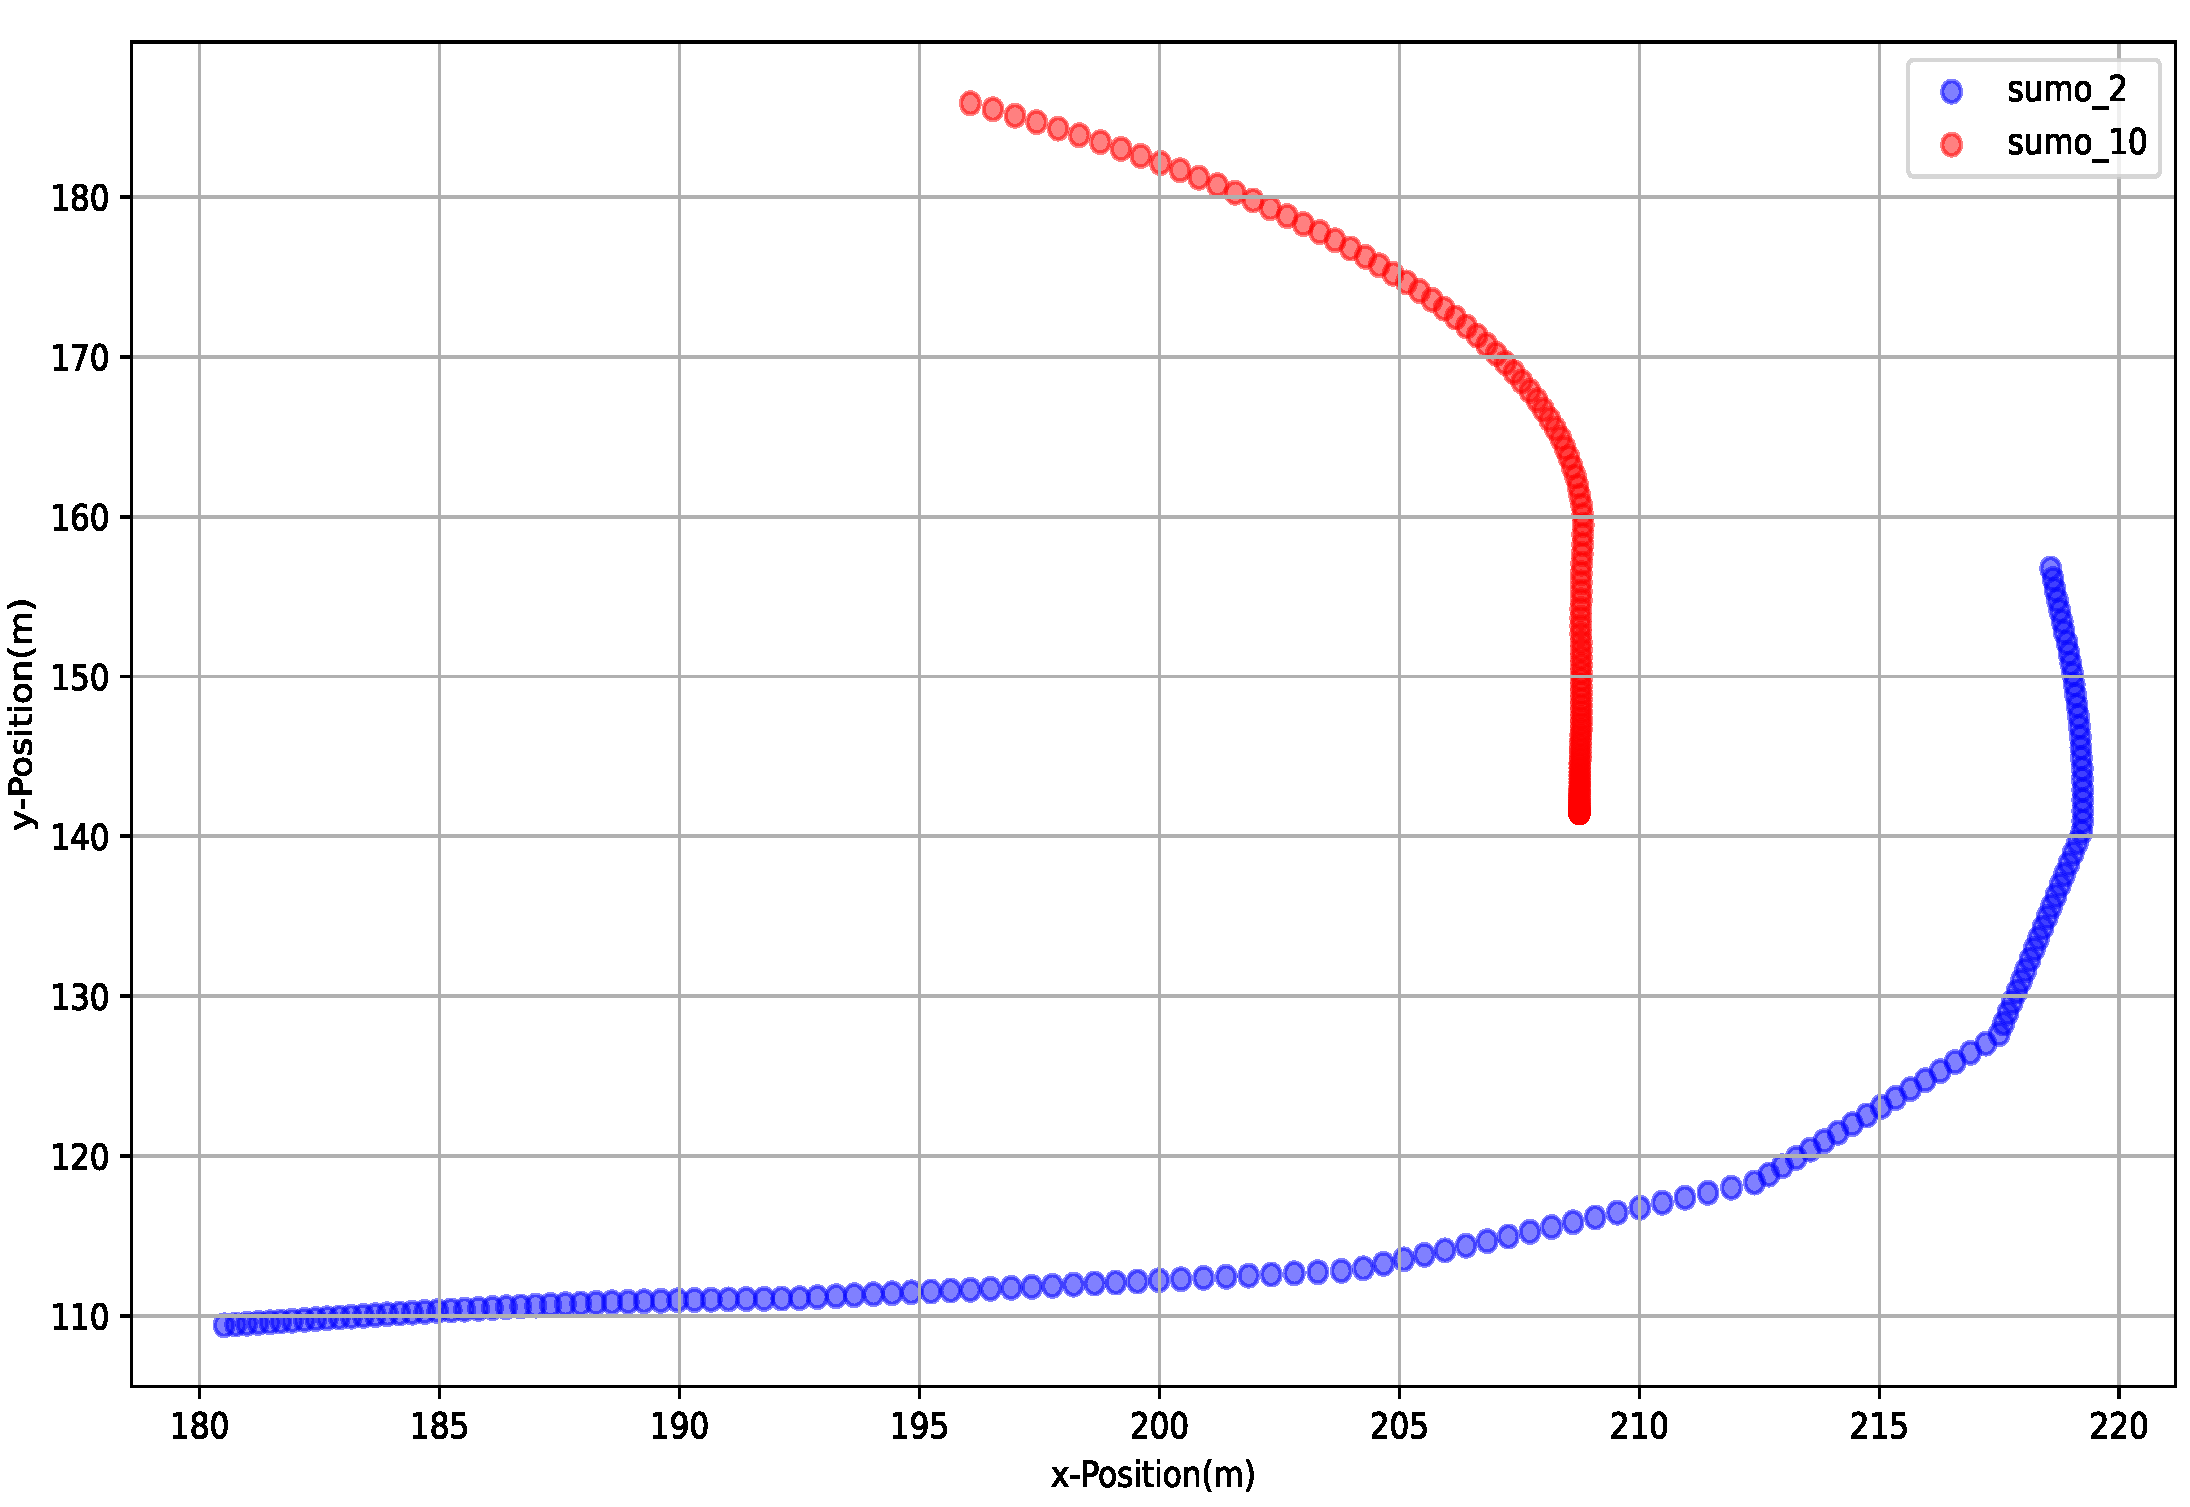
5.3.3. Randomized Trial 3

In the data of item five in Table 8, vehicle sumo_2 continues to travel from west to north through the intersection, while vehicle sumo_10 enters the intersection from west to south. As shown in Table 11 and Figure 7, the position and speed information are presented in the table. At 12.15 s, vehicle sumo_2 receives information from vehicle sumo_10, at which point a risk arises. The table indicates that vehicle sumo_2 is entering the intersection at a low speed, while vehicle sumo_10 is traveling at a higher speed. At 13.2 s, the two vehicles approach the intersection, and the risk reaches its maximum value. Risk quantification indicates a risk level of 2, representing a moderate collision risk. At 17.5 s, vehicle sumo_10 encounters a red light and slows down to 0, while vehicle sumo_2 passes through the intersection. At 19.65 s, both vehicles have cleared the intersection, and the risk dissipates.
In Figure 7, we can see that the lines of different colors represent the motion trajectories of two vehicles with traffic conflicts at the intersection. After analysis, it was found that the blue line represents vehicle sumo_2 turning left from west to north in the simulation environment, while the red line represents vehicle sumo_10 driving straight from north to south. However, as it approaches the intersection, it will change direction. As the relative position of the vehicle gradually approaches, the risk level gradually increases. But when the vehicle is driving normally on the target lane, the risk gradually decreases. When sumo_2 is located at position (185, 110) and sumo_10 is located at position (204, 176), the relative risk level of the two vehicles is “2”, indicating a medium low collision risk.
Through these three examples, the risk quantification and grading method proposed in this paper has been validated as accurate and effective, aligning with actual conditions. It can be used for risk quantification and grading of autonomous vehicles, guiding the training of autonomous driving systems to enhance safety and provide a better, more comfortable experience.

6. Conclusions

This study proposes an integrated risk assessment framework for autonomous driving on urban roads, innovatively integrating traditional indicators (TTC, DRAC, MDRAC), dynamic model prediction, and machine learning algorithms, and introducing a cloud-assisted takeover strategy. Through a decision-making mechanism designed by three-dimensional space analysis (entry road section/lane/intersection area), the effectiveness of the combined method of probability risk quantification and objective weighting was verified in both single-vehicle and fleet tests. Current limitations include the need to expand complex scenario verification (high-fidelity mixed reality testing), improve risk mitigation strategies under unstable communication, and dynamically optimize the risk assessment index system through federated learning.

Author Contributions

Conceptualization, K.L., M.L. and L.W.; methodology, K.L.; software, F.Z.; validation, K.L. and L.W.; formal analysis, K.L. and F.Z.; data curation, K.L. and M.L.; Writing—original draft preparation, K.L. and F.Z.; Writing—review and editing, L.W.; visualization, F.Z. and M.L.; supervision, L.W. All authors have read and agreed to the published version of the manuscript.

Funding

This research was funded by the Yuxiu Innovation Project of NCUT (grant number 2024NCUTYXCX108, 2024NCUTYXCX218 and 2024NCUTYXCX303), and the Youth Research Special Project of NCUT (grant number 2025NCUTYRSP001).

Data Availability Statement

The original contributions presented in this study are included in the article. Further inquiries can be directed to the corresponding authors.

Conflicts of Interest

Kailong Li also serves as the CTO of Beijing Jidao Technology Co., Ltd. This paper reflects the viewpoints of scientists, not those of the company.

Abbreviations

The following abbreviations are used in this manuscript:
TTCTime to Collision
DRACDeceleration Rate to Avoid a Crash
MDRACModified Deceleration Rate to Avoid a Crash
PRTPerception–reaction time
PETPost Encroachment Time
MSDMinimum Safety Distance
CPCollision Probability
ETAEvent Tree Analysis
FTAFault Tree Analysis
RMRisk Matrix
PRAProbabilistic Risk Assessment
DMDynamic Modeling
LCRLow Collision Risk
MCRMedium Collision Risk
HCRHigh Collision Risk

References

  1. California DMV. California Department of Motor Vehicles. Autonomous Vehicle Collision Reports. 2024. Available online: https://www.dmv.ca.gov/portal/vehicle-industry-services/autonomous-vehicles/autonomous-vehicle-collision-reports/ (accessed on 4 May 2025).
  2. Noh, S.; An, K. Reliable, robust, and comprehensive risk assessment framework for urban autonomous driving. J. Comput. Des. Eng. 2022, 9, 1680–1698. [Google Scholar] [CrossRef]
  3. Pang, Z.; Chen, Z.; Lu, J.; Sun, B.; Gong, T.; Feng, X.; Wang, Y.; Yang, S.; Cao, Y. Risk Assessment Method for Autonomous Vehicles Violating Safety Common Sense Based on Driving Behavior. IEEE Access 2025, 13, 63076–63092. [Google Scholar] [CrossRef]
  4. Tu, H.; Wang, M.; Li, H.; Sun, L. Safety risk assessment for autonomous vehicle road testing. Traffic Inj. Prev. 2023, 8, 324–331. [Google Scholar] [CrossRef]
  5. Liu, Q.; Yu, R.; Cai, Y.; Chen, L. Studying the predictability of crash risk caused by manual takeover of autonomous vehicles in mixed traffic flow. Transp. Lett. 2023, 16, 1205–1223. [Google Scholar] [CrossRef]
  6. Patel, A.; Liggesmeyer, P. Machine Learning based Dynamic Risk Assessment for Autonomous Vehicles. In Proceedings of the 2021 International Symposium on Connected and Autonomous Vehicles, Singapore, 15–17 January 2021. [Google Scholar]
  7. Shetty, A.; Tavafoghi, H.; Kurzhanskiy, A.; Poolla, K.; Varaiya, P. Risk Assessment of Autonomous Vehicles across Diverse Driving Contexts. In Proceedings of the 2021 IEEE ITSC, Edmonton, AB, Canada, 24–27 September 2024. [Google Scholar]
  8. Guo, C.; Wu, J.; Luo, P.; Wang, Z.; Zhang, K.; Yang, Z.; Dou, Z.; Song, K. Hybrid Reinforcement Learning-Based Collision Avoidance Algorithm for Autonomous Vehicle Clusters. IEEE Access 2025, 13, 61564–61577. [Google Scholar] [CrossRef]
  9. Wang, Y.; Xu, Y.; Su, Q.; Li, Q.; You, X. A Comprehensive Evaluation Model of Lane-based Risk for Urban Intersections Based on Bayesian Inference and XGBoost. J. Transp. Inf. Saf. 2024, 42, 12–20. [Google Scholar]
  10. Fei, M.; Xu, W.; Wei, H.Y. Real-time accident risk identification for freeway weaving segments based on video analytics. Measurement 2025, 242, 115783. [Google Scholar]
  11. Parsa, A.B.; Shabanpour, R.; Mohammadian, A.; Auld, J.; Stephens, T. A data-driven approach to characterize the impact of connected and autonomous vehicles on traffic flow. Transp. Lett. 2020, 13, 687–695. [Google Scholar] [CrossRef]
  12. Li, Z.B.; Liu, P.; Jin, M.J.; Xu, C. Real-time prediction of rear-end collision risks in frequently congested highway sections. J. Jilin Univ. (Eng. Ed.) 2013, 43, 1482–1487. [Google Scholar]
  13. Hossain, M.; Muromachi, Y. A Bayesian Network Based Framework for Real-Time Crash Prediction on the Basic Freeway Segments of Urban Expressways. Accid. Anal. Prev. 2023, 45, 373–381. [Google Scholar] [CrossRef]
  14. Wang, T.; Qu, D.; Wang, K.; Wei, C.; Li, A. Risk-Aware Lane Change and Trajectory Planning for Connected Autonomous Vehicles Based on a Potential Field Model. World Electr. Veh. J. 2024, 15, 489. [Google Scholar] [CrossRef]
  15. Wei, C.; Qu, D.; Kang, A.; Li, A.; Ji, L. Modeling of Lane Change Behavior of Connected Autonomous Vehicles Based on Risk Potential Field. Sci. Technol. Eng. 2024, 24, 8754–8760. [Google Scholar]
  16. Wang, Q.B.; Wang, W.L.; Zhao, R. Prediction of ship accident risks and types based on an improved XGBoost algorithm. J. Saf. Environ. 2022, 22, 3227–3234. [Google Scholar]
  17. Xie, G.; Qin, H.; Hu, M. Modeling Discretionary Cut-in Risks Using Naturalistic Driving Data. Transp. Res. Part F Traffic Psychol. Behav. 2019, 65, 685–698. [Google Scholar] [CrossRef]
  18. Pawar, N.M.; Arkatkar, S. Modeling drivers’ dilemma at unsignalized T-intersections under mixed traffic conditions: A case study from India. Traffic Inj. Prev. 2025, 25, 1107–1114. [Google Scholar] [CrossRef] [PubMed]
  19. Pessach, D.; Shmueli, E. A Review on Fairness in Machine Learning. ACM Comput. Surv. 2022, 55, 51. [Google Scholar] [CrossRef]
  20. Zhu, L.; Lu, L.; Wang, X.; Jiang, C.; Ye, N. Operational Characteristics of Mixed-Autonomy Traffic Flow on the Freeway with On-and Off-Ramps and Weaving Sections: An RL-Based Approach. IEEE Trans. Intell. Transp. Syst. 2021, 23, 13512–13525. [Google Scholar] [CrossRef]
  21. Jiang, C.; Yin, S.; Yao, Z.; He, J.; Jiang, R.; Jiang, Y. Safety evaluation of mixed traffic flow with truck platoons equipped with (cooperative) adaptive cruise control, stochastic human-driven cars and trucks on port freeways. Phys. A Stat. Mech. Its Appl. 2024, 643, 129802. [Google Scholar] [CrossRef]
  22. Lee, E.H.; Lee, E.T. Congestion boundary approach for phase transitions in traffic flow. Transp. B-Transp. Dyn. 2024, 31, 2379377. [Google Scholar] [CrossRef]
  23. Huang, L.; Zhang, S.N.; Li, S.-B.; Cui, F.-Y.; Zhang, J.; Wang, T. Phase transition of traffic congestion in lattice hydrodynamic model: Modeling, calibration and validation. Mod. Phys. Lett. B 2024, 38, 2450012. [Google Scholar] [CrossRef]
  24. Yue, M.; Fang, C.; Zhang, H. Adaptive Authority Allocation-Based Driver-Automation Shared Control for Autonomous Vehicles. Accid. Anal. Prev. 2021, 160, 106301. [Google Scholar] [CrossRef] [PubMed]
  25. Xiong, L.; Wu, J.F.; Xing, X.Y. A review of risk assessment methods for autonomous vehicle operation. J. Automot. Eng. 2023, 91, 156–162. [Google Scholar]
  26. Ding, H.T.; Guo, K.H.; Chen, H. LQR method for yaw moment decision in vehicle stability control. J. Jilin Univ. (Eng. Ed.) 2021, 40, 597–601. [Google Scholar]
  27. Wu, J. Research on Driving Risk Assessment Methods Considering Human-Vehicle-Road Factors. Master’s Thesis, Tsinghua University, Beijing, China, 2015. [Google Scholar]
  28. Wang, T.; Qu, D.; Song, H.; Dai, S. A hierarchical framework of decision making and trajectory tracking control for autonomous vehicles. Sustainability 2023, 15, 6375. [Google Scholar] [CrossRef]
  29. Charly, A.; Mathew, T.V. Identifying risky driving behavior: A field study using instrumented vehicles. Transp. Lett. 2023, 16, 688–702. [Google Scholar] [CrossRef]
  30. Wang, J.; Wu, J.; Li, Y. The Driving Safety Field Based on Driver-Vehicle-Road Interactions. IEEE Trans. Intell. Transp. Syst. 2013, 16, 2203–2214. [Google Scholar] [CrossRef]
  31. Wang, J.Q.; Wu, J.J.; Li, Y. Concept, principles, and modeling of driving risk fields based on human-vehicle-road collaboration. J. China Highw. 2019, 1, 105–114. [Google Scholar]
  32. Wang, Y.; Wang, C.; Zhao, W. Decision-Making and Planning Method for Autonomous Vehicles Based on Motivation and Risk Assessment. IEEE Trans. Veh. Technol. 2019, 70, 107–120. [Google Scholar] [CrossRef]
  33. Wang, Y.Y. Research on Trajectory Planning Algorithms for Autonomous Vehicles Considering Uncertainty. Ph.D. Thesis, Jilin University, Changchun, China, 2021. [Google Scholar]
  34. Florian, K.; Li, Y.H.; Tao, J.B. Summary of an empirical comparison of combinatorial testing and search-based testing in the context of automated and autonomous driving systems. In Proceedings of the 2024 IEEE ICSTW, Toronto, ON, Canada, 27–31 May 2024. [Google Scholar]
  35. Zhang, C.; He, Y.; Huang, X.; Gong, Q.; Hou, Y. A Study on Speed Limit of Different Visibility on Expressways under Foggy Weather. Transp. Inf. Saf. 2023, 36, 25–33. [Google Scholar]
  36. Xu, J.; Chen, Y.; Zhang, X.B.; Chen, H.; Zhang, K. Track Curvature Characteristics and Vehicle Cornering Patterns on Hairpin Curves. J. Southwest Jiaotong Univ. 2021, 56, 1143–1152. [Google Scholar]
  37. Wang, X.; We, X.; Wang, X. Investigating Micro-Driving Behavior of Combined Horizontal and Vertical Curves Using an RF Model and SHAP Analysis. Appl. Sci. 2024, 14, 2369. [Google Scholar] [CrossRef]
  38. Hu, C.F.; Li, X.D.; Pang, J.X. Trustworthy Driver State Perception via Contextual Interaction-Driven Evidential Vision-Language Fusion in Vehicular Cyber-Physical Systems. IEEE Trans. Intell. Transp. Syst. 2025, 26, 2202–2211. [Google Scholar] [CrossRef]
  39. Qing, C.L.; Ruo, H.Y.; Ying, F.C. Collision risk prediction and takeover requirements assessment based on radar-video integrated sensors data: A system framework based on LLM. Accid. Anal. Prev. 2025, 218, 108041. [Google Scholar] [CrossRef]
  40. Cafiso, S.; Cava, G.L. Driving Performance, Alignment Consistency, and Road Safety. Transp. Res. Rec. J. Transp. Res. Board 2009, 2102, 1–8. [Google Scholar] [CrossRef]
Figure 1. Risk assessment method system.
Wevj 16 00465 g001
Figure 2. Cloud takeover decision design.
Wevj 16 00465 g002
Figure 3. CARLA-SUMO joint simulation diagram.
Wevj 16 00465 g003
Figure 4. Various risk indicators fitted to normal distribution graphs.
Wevj 16 00465 g004
Figure 5. Running state of sumo_2 and sumo_5 vehicles.
Wevj 16 00465 g005
Figure 6. Running state of sumo_2 and sumo_13 vehicles.
Wevj 16 00465 g006
Figure 7. Running state of sumo_2 and sumo_10 vehicles.
Wevj 16 00465 g007
Table 1. Effect comparison and suggestions.
Method TypeApplicable ScenariosLimitationsImprovement Directions
Risk measurement indicator methodReal-time early warning, simple scenario risk assessment, standardized applicationAssuming that the locality is strong, data dependencies are numerous, and the uncertainty risks are difficult to quantify.Multi-index fusion, dynamic parameter calibration
Dynamic model prediction methodDynamic complex interaction, global path planning, strong theoretical supportThe computing power demand is high, and the model error is high.Lightweight model, edge computing optimization
Other methodsNonlinear data, unknown environmentThe data dependency is significant, interpretability is poor, and the cost of rule maintenance is high.Small sample learning, interpretability enhancement, dynamic rule update
Table 2. Comparison of various risk quantification methods.
MethodAdvantagesDisadvantagesApplication Examples
ETA
  • Visually displays the development path of events from start to finish
  • Easy to understand and construct
  • Suitable for identifying risks with multiple outcomes
  • Complex dependencies and interactions
  • Sensitivity to the choice of initial events
  • Potential to overlook unforeseen paths
Analyzing the range of consequences that may result from specific failures (e.g., sensor failures)
FTA
  • Identifies key causes of system failures
  • Easy to identify weaknesses in the system
  • Can quantitatively calculate the probability of failure
  • High costs of constructing and maintaining fault trees for large complex systems
  • Difficulty in representing interactions and dependencies
Analyzing the causes of failure in critical components (e.g., automatic emergency braking systems)
RM
  • Simple and intuitive, easy to communicate and understand
  • Quickly identifies and classifies risk levels
  • Suitable for preliminary risk assessment
  • Strong subjectivity, reliant on the evaluator’s experience
  • Inability to provide in-depth risk analysis
Used to assess and classify the severity and likelihood of various potential risks (e.g., hardware and software failures)
PRA
  • Provides estimates of the probability of risk occurrence
  • Capable of handling complex systems and uncertainty
  • Suitable for in-depth analysis
  • High data and computational requirements
  • Complex methodology
Assessing the probability of accidents under different traffic and weather conditions
DM
  • Able to simulate and understand the dynamic behavior of complex systems
  • Can consider changes in system states over time
  • Suitable for complex interactions and feedback loops
  • Time-consuming and complicated model building and validation processes
  • High demands on computational resources
Simulating and evaluating the impact of traffic flow changes on system performance
Table 3. Comparison of various risk quantification methods.
Risk FactorsEvaluation IndicatorsUnitQuantitative Value
123
TTCSpeed (v)km/h<40[40, 60]>60
DRACAcceleration (+a)m/s2<3[3, 6]>6
Deceleration (−a)m/s2<3[3, 7]<7
MDRACTime Headway (s)s>5[3, 5]<3
Head Distance (m)m>100[50, 100]<50
Table 4. Evaluation metric confusion matrix.
Confusion MatrixPredicted Value
ViolationNon-Violation
True valueViolationTPFN
Non-violationFPTN
Table 5. Comparison table of results from different methods.
ModeAccuracyPrecisionRecallF1
KNN0.930.980.980.98
SVM0.940.980.980.98
FPLA0.940.870.880.86
IBM0.980.980.980.98
Naive Bayes0.890.890.860.87
CRM10.990.980.98
Table 6. Key values for fitting various risk indicators to a normal distribution.
Risk IndicatorsMeanStandard Deviation50th Percentile85th Percentile
E _ R 1 0.1950.1260.1950.326
E _ R 2 0.0810.0680.0810.153
E _ R 3 0.0740.0760.0740.153
E _ t o t a l 0.1240.0790.1240.206
Table 7. Risk Quantification Levels.
E _ t o t a l E _ R 1 E _ R 2 E _ R 3 Risk LevelRisk Rating
0~0.1240~0.1950~0.0810~0.074LCR1
0.124~0.2060.195~0.3260.081~0.1530.074~0.206MCR2
0.206~10.326~10.153~10.206~1HCR3
0~0.1240~0.1950~0.0810~0.074LCR1
Table 8. Risk level verification.
No.begin(s)egoend(s)foeminTTCmaxDRACmaxMDRACEtotalRisk Level
10.05sumo_216sumo_511.550.160.180.331433
212.05sumo_1020.4sumo_138.070.740.840.231743
37.2sumo_217.4sumo_132.142.383.730.062201
42.6sumo_426.55sumo_92.011.913.570.058391
512.15sumo_219.65sumo_104.970.461.50.142852
614.95sumo_1125.8sumo_106.320.110.130.181352
72.6sumo_928.9sumo_42.011.913.570.058391
813.25sumo_924sumo_205.891.091.310.169302
932.6sumo_241.85sumo_292.532.123.240.073291
1012.15sumo_1023.3sumo_24.970.461.50.142852
Table 9. Description of risk status of vehicles sumo_2 and sumo_5.
Time (s)sumo_2sumo_5Risk Level
Location (x, y)Speed (m/s)Location (x, y)Speed (m/s)
0.05(85, 107)0.12(153, 85)0.05(85, 107)
3.1(86, 108)6.03(153, 86)3.1(86, 108)
16(208, 115)10.79(192, 107)16(208, 115)
Table 10. Description of risk status of vehicles sumo_2 and sumo_13.
Time (s)sumo_2sumo_13Risk Level
Location (x, y)Speed (m/s)Location (x, y)Speed (m/s)
7.2(136, 107)13.44(191, 107)00
10.5(171, 107)6.62(191, 107)01
17.4(217, 128)13.41(207, 77)7.780
Table 11. Description of risk status of vehicles sumo_2 and sumo_10.
Time (s)sumo_2sumo_10Risk Level
Location (x, y)Speed (m/s)Location (x, y)Speed (m/s)
12.15(180, 109)4.67(196, 185)11.860
13.2(185, 110)5.71(204, 176)11.92
19.65(218, 158)13.45(208, 141)00
Disclaimer/Publisher’s Note: The statements, opinions and data contained in all publications are solely those of the individual author(s) and contributor(s) and not of MDPI and/or the editor(s). MDPI and/or the editor(s) disclaim responsibility for any injury to people or property resulting from any ideas, methods, instructions or products referred to in the content.