Article

Scalable Energy Management Model for Integrating V2G Capabilities into Renewable Energy Communities

Department of Industrial Engineering, University of Florence, Via di S. Marta 3, 50139 Florence, Italy
*
Author to whom correspondence should be addressed.
World Electr. Veh. J. 2025, 16(8), 450; https://doi.org/10.3390/wevj16080450
Submission received: 3 July 2025 / Revised: 31 July 2025 / Accepted: 5 August 2025 / Published: 7 August 2025
(This article belongs to the Special Issue Power and Energy Systems for E-Mobility, 2nd Edition)

Abstract

To promote a more decentralized energy system, the European Commission introduced the concept of Renewable Energy Communities (RECs). Meanwhile, the increasing penetration of Electric Vehicles (EVs) may significantly increase peak power demand and consumption ramps when charging sessions are left uncontrolled. However, by integrating smart charging strategies, such as Vehicle-to-Grid (V2G), EV storage can actively support the energy balance within RECs. In this context, this work proposes a comprehensive and scalable model for leveraging smart charging capabilities in RECs. This approach focuses on an external cooperative framework to optimize incentive acquisition and reduce dependence on Medium Voltage (MV) grid substations. It adopts a hybrid strategy, combining Mixed-Integer Linear Programming (MILP) to solve the day-ahead global optimization problem with local rule-based controllers to manage power deviations. Simulation results for a six-month case study, using historical demand data and synthetic charging sessions generated from real-world events, demonstrate that V2G integration leads to a better alignment of overall power consumption with zonal pricing, smoother load curves with a 15.5% reduction in consumption ramps, and enhanced cooperation with a 90% increase in shared power redistributed inside the REC.

Graphical Abstract

1. Introduction

Road transport, energy industries, and the residential sector are among the leading contributors to greenhouse gas emissions [1,2]. With the increasing penetration of electric vehicles (EVs) [3], these sectors are becoming even more interconnected as charging stations are deployed in residential neighborhoods and industrial parking areas.
The electrification of mobility raises new challenges for grid services regarding energy management and investment in infrastructure capacity and reliability. Uncontrolled EV charging sessions can significantly increase the peak electricity demand [4] and steepen the load ramps. In a future scenario with widespread EV adoption, energy distribution grids may face overload risks and capacity limitations [5]. Recent literature has frequently focused on the issues of grid congestion, which is described as a demanding and growing issue in general [6] and even staggering in the case study of the Netherlands [7]. A point arising from the literature analysis is that the issue cannot be solved by focusing on automotive technology per se, but that solutions imply the interaction of different stakeholders [8]. Efforts in this direction are also highlighted by the evolution of standards for smart vehicle charging solutions and renewable integration, which have recently evolved in order to regulate and enable such practices [9]. Therefore, this trend also presents an opportunity to leverage EVs as flexible energy storage solutions, considering that they generally spend 96% of their time parked and unused [10]. By applying intelligent charging techniques, such as unidirectional smart charging (V1G) and Vehicle-to-Grid (V2G), EVs can help reduce peak-valley differences [11] and mitigate consumption ramps [12], thereby enhancing overall system flexibility compared with that of uncontrolled charging scenarios. V1G operates by modulating the power delivered to the vehicle, enabling charging to be shifted away from peak periods or smoothed over time to reduce sudden demand changes. V2G further extends these benefits by allowing vehicles to discharge power back to the grid when needed, in accordance with users’ acceptance and their charging requirements. This would mitigate local supply-demand imbalances, improve the efficiency of large thermal power generation through a more stable load request [13], and support the integration of intermittent renewable energy sources (RESs) [14].
A general decrease in road transport emissions is expected over the next few decades [15], and intelligent charging methods could not only respond to this trend but also foster greater synergy between the road transport and energy sectors, as charging infrastructure is increasingly integrated into both residential and workplace environments.

1.1. Energy Communities and Smart Charging Integration

To address environmental challenges and ensure the reliability and stability of the electrical grid, it is essential to develop a decentralized energy system capable of efficiently satisfying local power demand, sharing the surplus of RES energy production, and reducing its impact on the grid. For decades, the electrical grid has been built around a centralized energy system, which poses challenges in integrating the non-programmability of RESs’ energy production and managing grid integration complexity [16]. In this regard, the decentralized concept of Renewable Energy Communities (RECs) aims to overcome these issues by promoting self-consumption from RES, increasing citizen engagement, and enhancing local control [17]. RECs were introduced by the European Commission in 2018 through the Renewable Energy Directive 2018/2001 (RED II) [18]. They are legal entities that allow citizens, small businesses, and local authorities to produce, consume, and sell renewable energy, thereby generating environmental, social, and economic benefits. In practice, REC members must be connected to the same medium voltage (MV) substation, and energy is shared through a point-of-delivery (POD), either virtually or with actual self-consumption. Each member can be a consumer, producer (with a 1 MWh RES plant limit), or both, and is referred to as a prosumer [19].
The implementation of incentive mechanisms for RECs may vary across EU member states. In Italy, the amount of shared power ( P s ) is determined hourly by the Gestore dei Servizi Energetici (GSE), based on the minimum between the energy fed into the Low Voltage grid (LV) by the community’s producers (or prosumers) ( P L O C j ) and the energy consumed by the REC’s members ( P L O C j + ) (see Equation (1)).
P s = min   ( j = 1 N L O C P L O C j ,   j = 1 N L O C P L O C j + )
Commercially, the economic benefit of the entire REC is provided by the GSE, which includes the energy surplus sold into the grid market and shared energy incentives [20]. The shared energy incentives are calculated based on predetermined tariffs (see Table 1) and distributed among RECs members through private agreements [21]. This incentive mechanism encourages the adoption of flexible consumption strategies, allowing members to adjust their energy demand to maximize the use of intermittent RES and minimize energy exchanges with the grid.
According to a survey conducted by Paromboli et al. [22], clear differences emerged in the mechanisms adopted in Europe. Similar to the Italian framework, the REC members in Portugal and Spain benefit from incentive schemes based on the amount of energy shared by the community. The redistribution of shared energy is governed by allocation coefficients that directly influence the individual electricity bills. In Germany, the Tenant Electricity model facilitates energy sharing within a single building, whereby members receive a substantial tariff discount on the total energy consumed. Furthermore, tenants are granted a direct subsidy on the internally shared energy, which is subsequently redistributed among community members. In contrast to these approaches, the Netherlands implements a different incentive model that remunerates the energy produced by REC prosumers. The Dutch incentive scheme includes both fixed and variable components that fluctuate according to the energy market prices. Despite the heterogeneity of national regulatory frameworks, they share the common goal of reducing the impact of RECs on the distribution grid and fostering decentralized energy systems. The model proposed in this work explicitly adopts the Italian incentive method and evaluates its effect on variable costs; however, economic advantages can be achieved in other regulatory contexts. Moreover, the technical and operational benefits discussed in this study are generally valid across different national frameworks.
In addition to a cooperative governing framework, internal rules are established to regulate the distribution of benefits among members [23], and various methodologies have been proposed [24,25,26]. However, our work focuses solely on the external governance framework. In contrast to cooperative governance schemes, competitive approaches can be envisioned. Although these methods may yield more favorable outcomes for an individual member, they often result in suboptimal performance at the community level.
In this context, EVs and smart charging technologies are crucial as flexible storage solutions [27]. Through V1G and V2G technologies, RECs members can align vehicle charging with periods of high renewable generation. Moreover, EVs can act as distributed energy storage units, maximizing the self-consumption of renewable energy [28]. The integration of electric mobility and RECs has been the focus of numerous case studies analyzing technical optimization, economic benefits, and environmental impact reduction [27]. Most of these studies concentrate on specific optimization approaches or explicit real-world applications, highlighting the lack of scalable approaches capable of evaluating different technological scenarios [29].

1.2. Energy Management Algorithms

A management strategy is required to enhance the integration between RECs and charging units, which is typically implemented using a dedicated controller unit. The energy management system (EMS) proposed in this paper is based on a rule-based algorithm and Mixed-Integer Linear Programming (MILP) optimization method. Both approaches offer significant advantages and perform well in various aspects.
Rule-based systems operate in real-time and can balance the total loads based on the availability of flexible appliances. In contrast, optimization-based methods schedule flexible power flows based on forecast data, which are typically used for day-ahead or intra-day optimizations [30]. Complementary to rule-based algorithms that act in real time, optimization-based methods operate at a discrete level; they generate an optimal power schedule only when triggered with updated data. Both are discussed in the next section.

1.2.1. Rule-Based Methods

Rule-based methods operate through a sequence of conditional branches that process the input data and return an output action. A proposal for using this approach in energy management for smart buildings has been presented by Alirezaei et al. [31]. This method follows a straightforward set of conditional rules: if the power demand exceeds photovoltaic (PV) power production, the EMS draws energy first from a Battery Energy Storage System (BESS) and then from the EV battery; conversely, if there is an excess of PV production, the EMS first charges any connected vehicle and then the BESS. The system is designed to maximize the self-consumption of PV energy; however, adding additional functionalities would require a deep structural modification of the decision tree. For instance, adding a cost-saving objective would necessitate a peak-period check upstream, as proposed by Zhou et al. [32].
There are three limitations to the implementation of rule-based methods.
  • Rule-based methods become increasingly complex as more objectives are added since each new objective can double the size of the decision tree [30]. To manage this, objectives can be prioritized and structured hierarchically. Alternatively, decision trees can be generated using more advanced automated methods. For instance, Huo et al. [33] developed a technique to derive decision trees from MILP models, while Ruddick et al. [34] proposed a machine learning-based approach for constructing interpretable decision trees.
  • Need for qualitative decisions and actions, based on differences in input data and variable states. Referring to the example provided by Alirezaei et al. [31], it could be considered to distribute the PV energy surplus between the BESS and the EV rather than charging only the EV. Van der Kam et al. [35] proposed distributing the load between two EVs connected to the same POD, assigning priority values based on estimated parking time and residual Depth of Discharge. Alternatively, fuzzy logic controllers can manage uncertainties by making adaptive decisions based on external factors, thereby enhancing flexibility and decision-making under fluctuating conditions [36].
  • Dependence on real-time data and limited forecasting capabilities. Rule-based methods usually rely on actual data, and decision-making based on short-term forecasts is generally not implemented [30]. Consequently, they are typically less effective than optimization-based methods but can still be useful when forecast data are unavailable.

1.2.2. Optimization-Based Methods

Numerous approaches have been adopted to solve the Economic Dispatch Problem using a mathematical problem formulation [37,38,39]. Many methods rely on particle swarm optimization or genetic algorithms [36,40,41,42,43], providing formulations of highly complex and articulated optimization problems. Nonetheless, the most common method is an MILP formulation, which is implemented in our proposal and widely employed in the literature [26,44,45,46,47]. Keeping the problem linear reduces the computational effort compared to other optimization techniques while guaranteeing a global optimum solution [48]. However, more complex physical models, such as those describing battery aging dynamics, cannot be directly implemented. However, MILP allows for the approximation of complex cost functions using piecewise linear formulations with continuous auxiliary variables. Within the context of this work, a novel custom piecewise linear cost function has been developed to limit excessive battery usage.
The MILP approach allows the definition of discrete integer variables, which are often used in the literature to impose specific logical constraints. For instance, Khezri et al. [47] used binary variables to define semi-continuous charging and discharging states, preventing their simultaneous activation, while also enforcing a minimum power threshold deliverable by the on-board charger. Similarly, Saber et al. [46] employed discrete variables to determine whether a vehicle is connected and to differentiate between multiple charging modes. Although these formulations allow for more accurate modeling, the computational cost of obtaining feasible solutions in the mixed continuous-discrete domain increases exponentially with the number of integer variables. This may render the method unsuitable for complex case studies that require real-time processing. Therefore, our approach limits the number of integer variables to a set of global key variables, ensuring scalability at small to medium scales and preventing the overall complexity from growing uncontrollably with the number of REC locations or available vehicles. Additionally, the frequency of optimization solver calls is reduced by integrating rule-based methods to handle minor power-imbalance corrections between optimization steps. To improve model scalability, Zanvettor et al. [26] proposed a MILP-based strategy for the day-ahead management of an electric vehicle rental fleet within an REC. In their framework, a heuristic algorithm is first used to assign each vehicle to a rental request, which simplifies the MILP and reduces the computational effort, yielding near-optimal solutions even for large-scale problems. However, their model assumes perfect accuracy in day-ahead forecasts for energy demand and vehicle availability and does not consider potential intra-day deviations.
Other approaches are based on game-theoretic models, which are particularly suited for competitive interactions among flexible EV charging sessions [49,50]. However, these strategies do not always converge to a global optimum [48]. Given the cooperative nature of RECs and the need for robust, fast, and easily reconfigurable methods, MILP is a highly suitable solution.
Optimization-based methods rely heavily on the accuracy of forecast data to schedule optimal charging events, playing a key role in developing effective energy management algorithms [51]. In our case study, the following forecast data are essential for day-ahead planning:
  • PV power production throughout the day. Forecasts of PV generation can be obtained using Artificial Neural Networks (ANNs) or specialized APIs. The latter is particularly suitable for scalable models that must be applied across various contexts and geographic locations.
  • Building and residential energy consumption. This is a critical factor in a robust optimization algorithm. To obtain reliable forecasts, historical consumption and weather data can be used to train an ANN. Luo et al. [52] proposed a multi-ANN framework, training a distinct network with each historical data cluster. In addition, Long Short-Term Memory networks are widely used due to their proven performance in time series forecasting, as shown by Kim et al. [53] in their proposed hybrid framework.
  • User behavior in predicting EV charging events. The integration of EVs within an energy community is key and represents an additional opportunity for optimization. Therefore, it is necessary to forecast likely charging events during the day, in addition to user constraints that must be respected to ensure satisfactory charging conditions [54]. Extensive research based on dataset analysis has been conducted to identify and forecast clustered EV charging patterns [55,56]. For simulation purposes, Monte Carlo random sampling can be used to generate EV power demand throughout the day [43,57].

1.3. Contributions

The Introduction section briefly outlines the key topics and contributions related to the development and challenges of management methods within the context of RECs with V2G integration.
The remainder of this paper is structured as follows: Section 2 provides a comprehensive description of the proposed energy management model and the simulation data employed; Section 3 presents the simulation results for a representative case study selected within the framework of a real-life implementation planned within the Horizon Europe XL-Connect project [58]. The analysis compares different optimization scenarios based on Key Performance Indicators (KPIs), with a particular focus on user flexibility and the adopted charging technologies. Two brief sections are also dedicated to assessing the impact of EV battery aging and model scalability. Finally, the Conclusions section summarizes the main outcomes of this research and outlines possible future developments.
The main gaps identified in the literature are as follows:
  • Lack of comprehensive and scalable models for integrating EV charging flexibility into RECs. Most current approaches do not scale with the number of locations or account for diverse internal characteristics. Our model offers a modular and scalable framework at a small scale for different REC configurations.
  • Focus primarily on economic benefits and cost savings. In addition, the proposed model emphasizes technical objectives, such as reducing the REC’s dependency on the MV grid, avoiding unconventional battery usage, and respecting user-specific charging requirements.
  • Reliance on single-method approaches in most current literature. In contrast, our solution introduces a hybrid control framework that combines global optimization-based scheduling with local rule-based balancing strategies. This hybrid structure ensures both robustness and feasibility for real-time operations.

2. Materials and Methods

The proposed model aims to study optimal energy dispatching methods within RECs by actively integrating EV charging events and smart charging capabilities. It is highly configurable and designed to adapt to various case studies.
The model is developed in the MATLAB R2024b and Simulink environment and is structured into two main units, as illustrated schematically in Figure 1.
  • Cloud Scheduler—Based on a MILP formulation, the scheduler, once triggered by one of the REC’s locations, computes globally optimal EV and BESS charging schedules according to user needs, flexibility, and battery aging penalties. It also incorporates PV power forecasts from the Forecast.Solar API [59], day-ahead electricity prices from the ENTSO-E API [60] to evaluate grid energy costs for the community and potential incentives, and computes building power forecasts for the next 24 h, as discussed in Section 2.3.
  • Local Controller—Each location is equipped with a local controller, which is responsible for monitoring local assets, handling user requests, and triggering an optimization process when one of the criteria discussed in Section 2.3 is met. For real-world applications, a user interface can be integrated to provide feedback on the EV charging status. Once a new optimization is triggered, the Local Controller sends current data to the Cloud Scheduler, including asset characteristics, current SOC values, and user preferences, and receives back the optimized charging schedule. It also ensures adherence to the planned power flows and handles forecast errors using real-time corrections. It communicates with the inverter, BESS, and charging stations to effectively manage energy flow. A Comprehensive description is provided in Section 2.4.
The proposed hybrid method offers greater robustness than purely optimization-based approaches. Rule-based strategies are lightweight and responsive to unexpected events, such as PV deviations or sudden load peaks. Thus, it acts as a fallback mechanism to manage deviations from the planned optimal power flows. In simple and predictable scenarios, a purely MILP-based approach may be effective. However, the main goal of this work is to provide a highly adaptable and robust model design: REC locations and configurations can be integrated and updated, requiring only a load forecasting neural network, the methodology of which is presented in Section 2.2. Compared to reinforcement learning approaches, which typically require training in a specific environment, this hybrid framework offers a more practical solution for real-world applications.
Despite its optimization capabilities, the model faces practical challenges in implementation due to the need for data that are not yet widely implemented in communication with chargers and EVs. Ideally, data such as available vehicle storage, SOC, current charging limits, and user preferences for charging schedules are essential to fully exploit EV flexibility while maintaining user satisfaction. Assuming the full implementation of user data, a custom routine has been developed to generate timeframes of potential charging events, incorporating both vehicle parameters and user preferences. This aspect is discussed in more detail in Section 2.1.

2.1. Simulated Timeframe of Charging Events

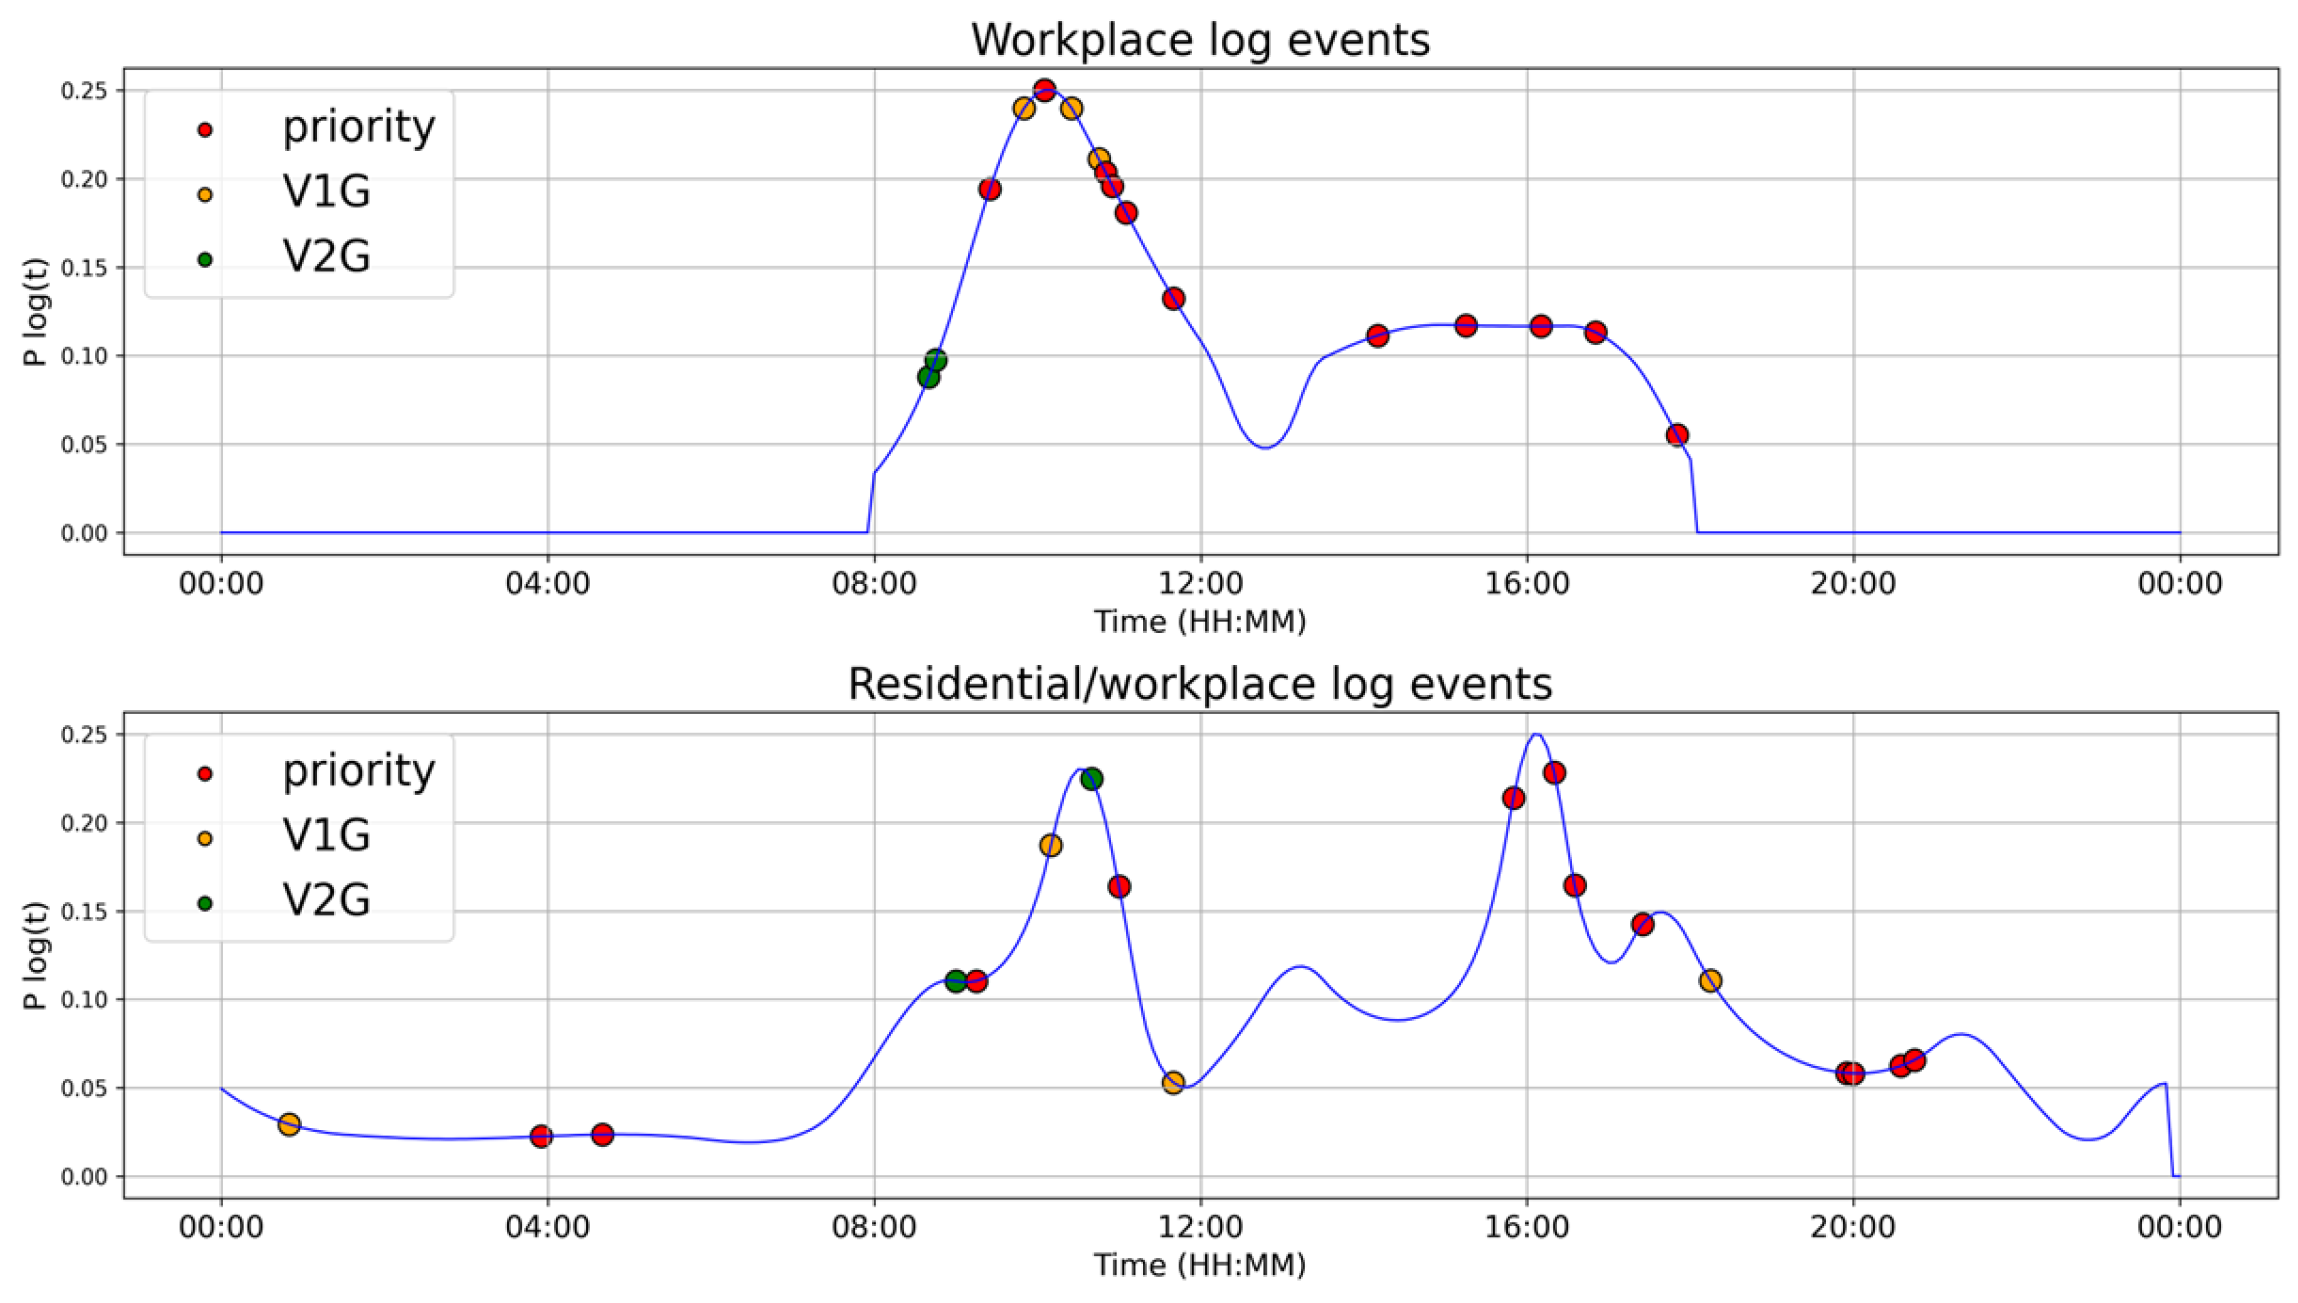
As input for the simulation, a timeframe of potential charging events is generated according to the expected arrival patterns for a specific parking area. Two distinct probabilistic arrival curves are defined based on the type of location:
  • Workplace area: characterized by defined opening and closing hours, with a high probability peak in the early morning and a second relaxed peak after the lunch break. No charging events are expected during weekends or on public holidays.
  • Mixed residential/workplace area: characterized by a more evenly distributed probability throughout the day, with higher arrival rates in the evening.
These curves are derived from the analysis proposed by Innocenti et al. [61], who identified two typical charging profiles, residential and workplace, using historical data from 64 charging points in Tuscany (Italy). Our probabilistic arrival profiles were obtained by assuming that the derivative of the aggregated load profile is proportional to the variation in the number of active charging stations.
For each simulation day, a set of user and vehicle characteristics is generated. As a result, each day features different charging events based on the same underlying probability distribution. Assuming greater flexibility in scheduling the charger event, users may specify their desired final SOC, estimated parking duration, and whether they are open to V1G or V2G charging methods. Users are categorized into three main types: Priority, V1G, and V2G, as shown in Table 2.
The arrival and desired final SOC were generated for each user using a Poisson distribution (see Figure 2), while a set of parking logs generated in accordance with the selected probability curves is illustrated in Figure 3 Stochastic parking logs tend to concentrate on the peaks of the probability density functions, particularly during morning hours for the workplace area and evening hours for the residential area. Although the current method does not explicitly model full activity chains, future improvements may involve linking Poisson-based event generation to large local datasets and incorporating empirical clustering approaches, as suggested in EV user behavior modeling literature [55,56].

2.2. Building Power Forecast

To compute the optimal charging sessions throughout the day, the Scheduler requires forecasts of power demand from REC members. For this purpose, a Multilayer Perceptron with a regression output layer is proposed to provide quarter-hourly day-ahead power demand predictions. As input for the training process, the network uses a combination of time-signature features and short-term historical power data. Time signatures typically show a strong correlation with the average power consumption trends across different periods of the day, month, and year. Therefore, the model includes time-related features at multiple scales, such as Minute of the day ( m ), two Boolean variables indicating whether the current and following day are holidays ( i s H , i s H n e x t ) , and day of the week ( d w ), encoded on a scale from 0 to 1 (with Monday as 0/8, Sunday as 7/8, and holidays set to 8/8). Additionally, trigonometric features are included to represent the cyclical nature of time, including the cosine of the day of the year ( d c ) and cosine of the minute of the day ( m c ), which have shown stronger correlation with power consumption than their sine counterparts. These are computed as follows:
d c = cos 2 π d 365  
m c = cos 2 π m 1440  
In addition, the model incorporates 12 h of historical power consumption data ( P p r e v ), divided quarter-hourly, to adapt the forecast to recent consumption patterns. All input and output variables are normalized with zero mean and unit standard deviation to improve the efficiency of the training process. The full list of features and variables used in the model is presented in Table 3.

Training and Evaluation

The proposed model has been trained and evaluated using a real-world dataset of power consumption collected at the laboratory site of the University of Florence. This facility has an average power demand of approximately 50 kW, and its energy management was included in the case study analyzed in this work. The dataset was split chronologically: data from January 2022 to June 2023 were used for training, and data from July 2023 to December 2023 were reserved for model evaluation. Additionally, a randomly selected 10% subset of the training data was used for hyperparameter tuning and architecture exploration. The final model architecture includes fully connected hidden layers composed of 64 nodes each. Model parameters and configurations are summarized in Table 4.
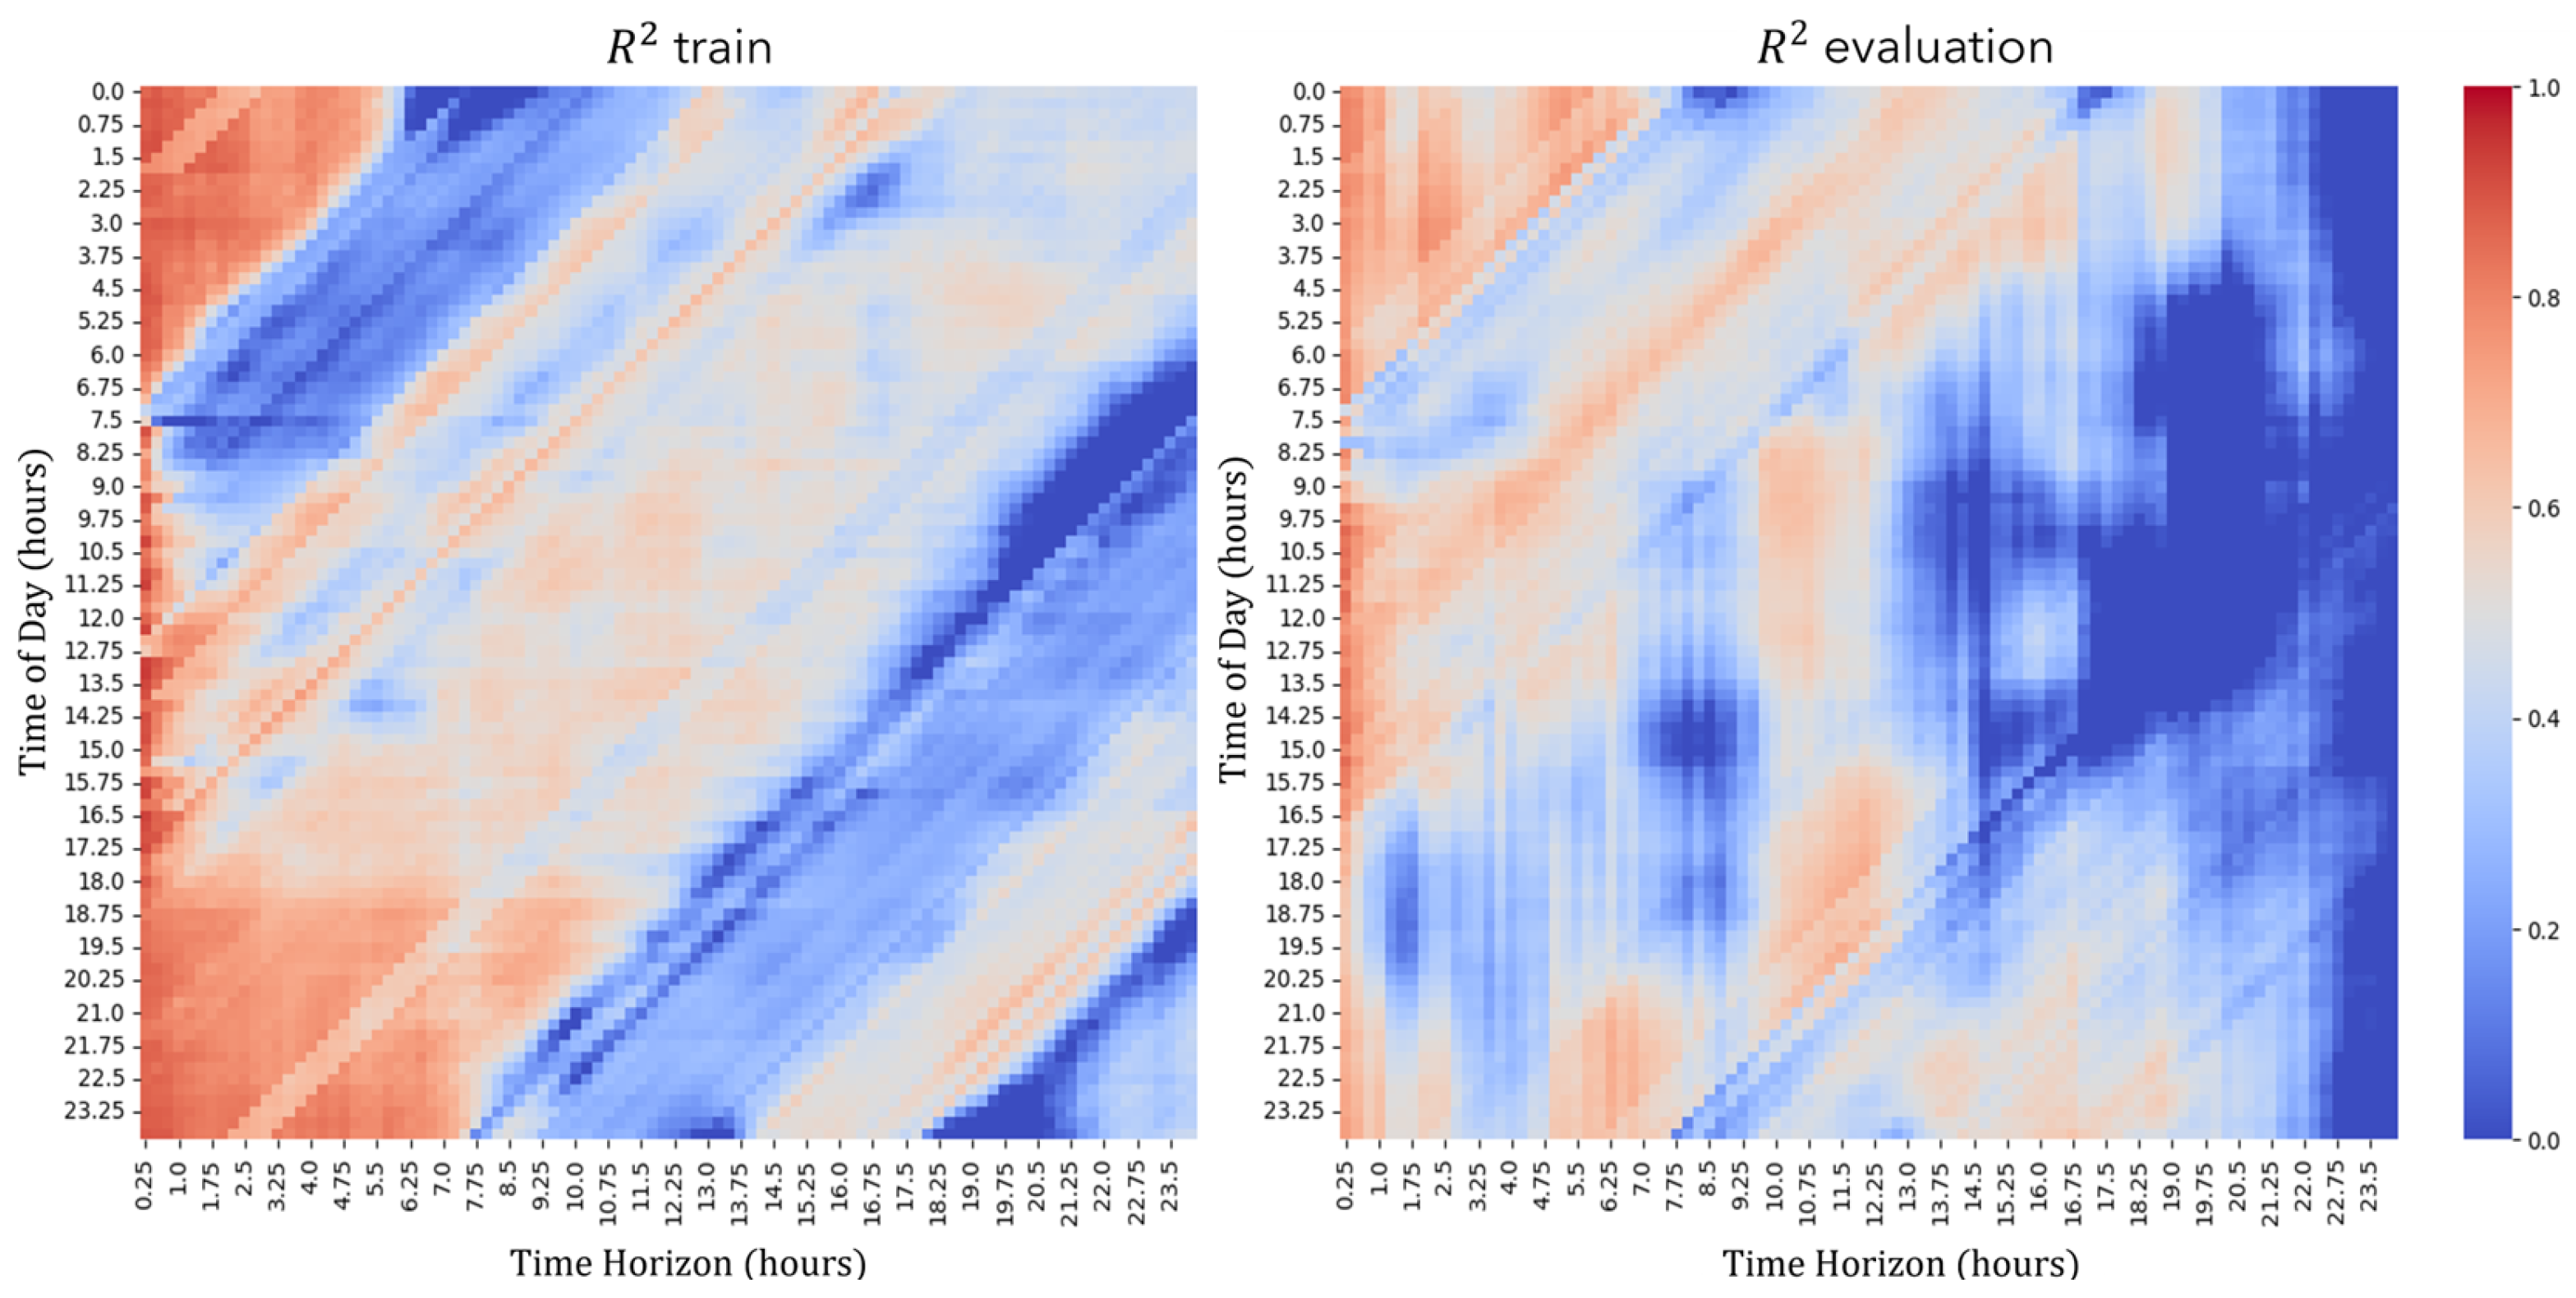
The building presents the specific characteristic of having unpredictable power peaks due to the use of laboratory equipment. For this reason, data points with power consumption exceeding 180 kW were excluded from the evaluation phase. Figure 4 illustrates the R 2 score of the forecasted power compared with the historical data for both the training and evaluation datasets. The R 2 score is used to evaluate the model’s prediction performance and is computed as:
R 2 = 1 i = 1 n P i P i ^ 2 i = 1 n P i P i ¯ 2
where P i is the actual power, P i ^ is the predicted power, and P i ¯ is the mean of the actual power values. The score is computed across different data clusters based on the time of day and forecast time horizon. The prediction accuracy is higher over shorter time horizons and gradually declines for longer-term forecasts. The model also shows reduced performance during the time slots preceding and following the lunch break, reflecting the unpredictability of high-power sessions often occurring during those time periods. The highest prediction accuracy is observed for predictable and steady night hours and during lunch breaks.

2.3. Day-Ahead Optimization Problem

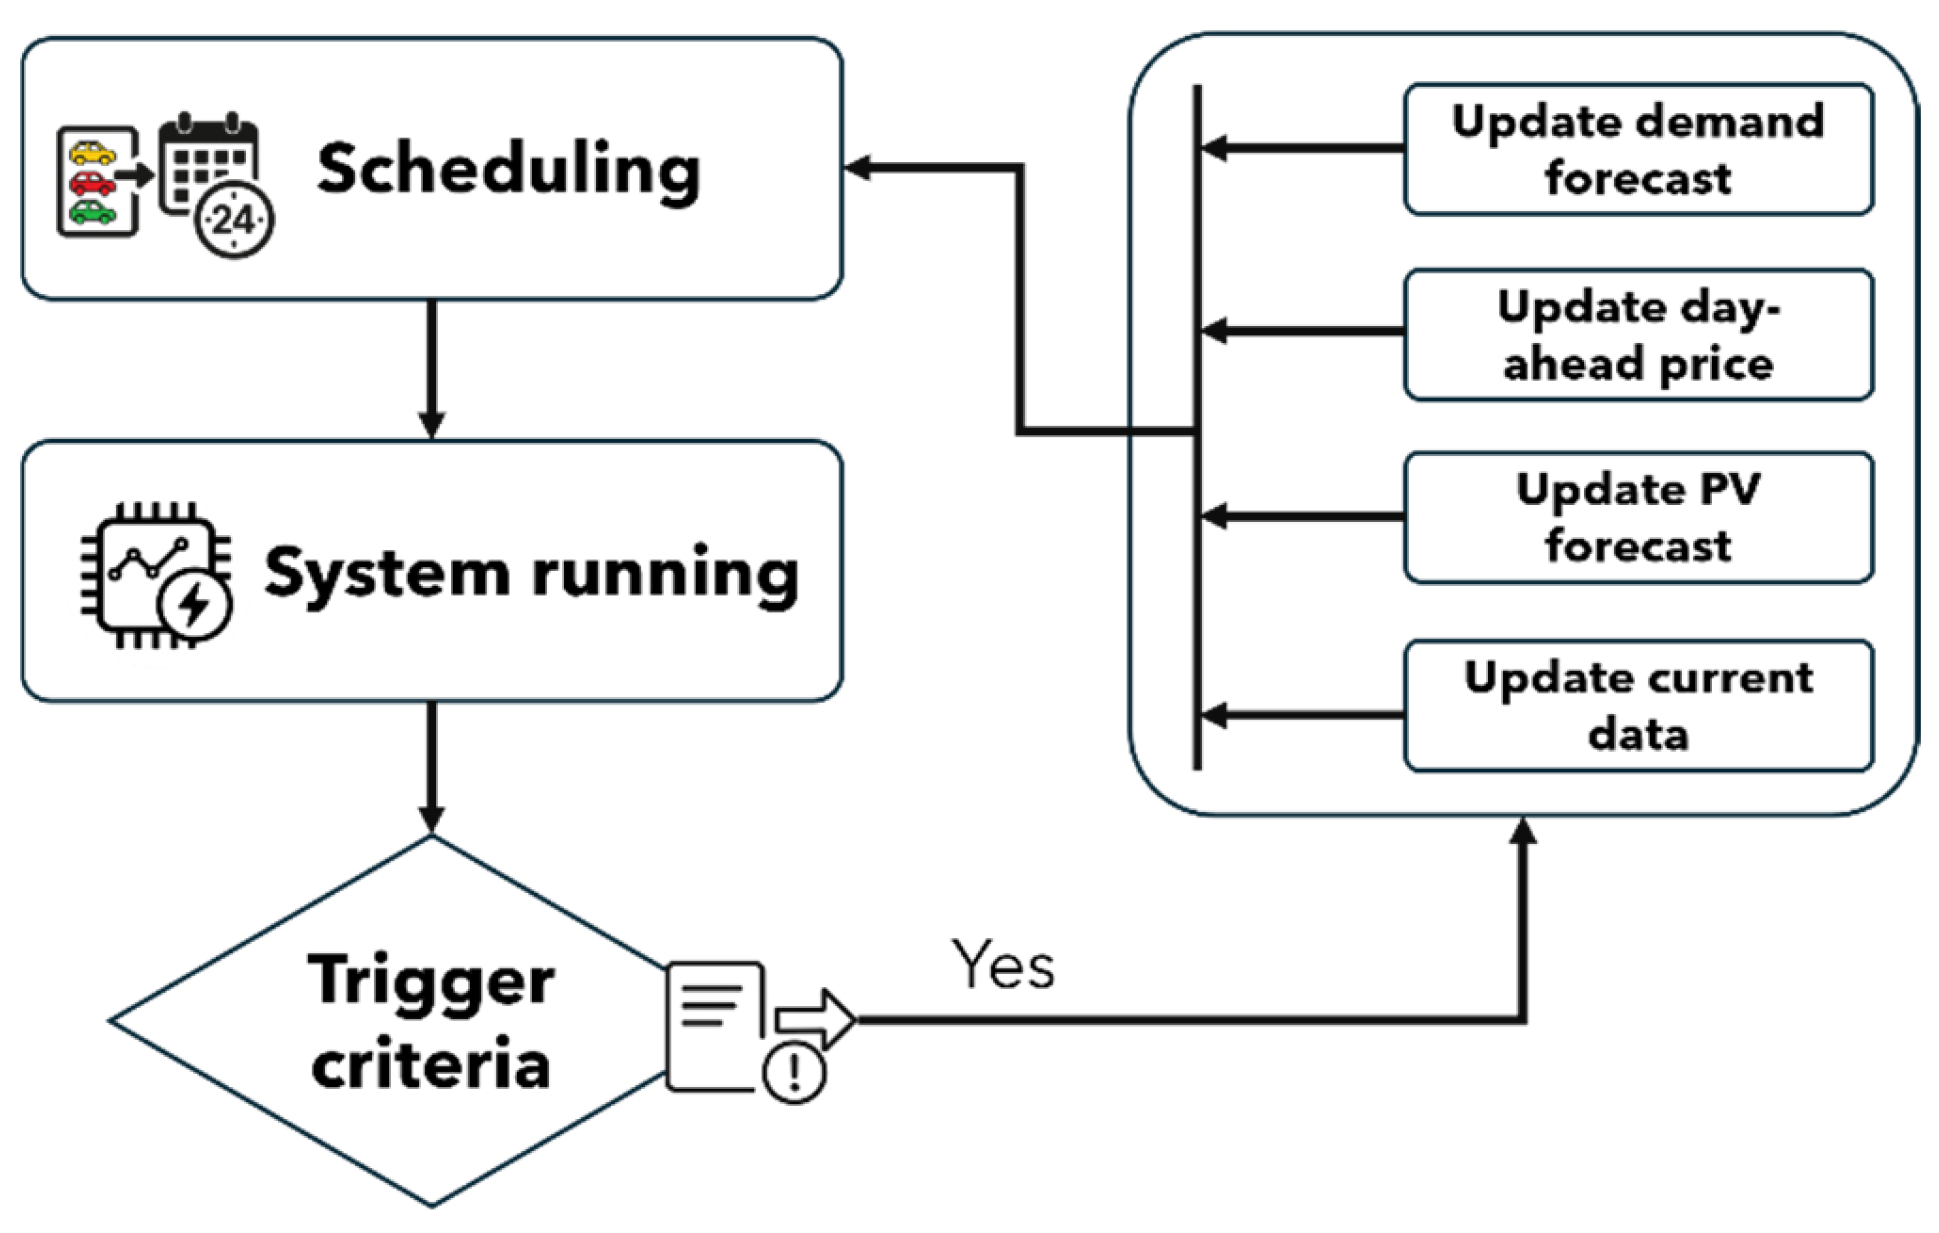
The day-ahead optimization process determines the charging schedules for EVs and local BESSs, taking into account current charging sessions, forecasted energy consumption of REC buildings, expected PV production, and day-ahead electricity prices. Following the approach proposed by De Angelis et al. [62], which suggests triggering the optimization whenever a critical change in system conditions occurs, this work defines specific event-driven interruption criteria as follows:
  • A new EV charging session begins.
  • An EV charging session ends earlier than the estimated departure time.
  • The integral of power prediction error over time exceeds a defined threshold from the last optimization process (30 kWh in the analyzed case study).
  • Every 7 h, a regular update is performed to maintain scheduling accuracy.
The execution flow of this scheduling routine is depicted in Figure 5, which illustrates the model workflow and the updating of real-time data and forecasts used to construct the MILP problem.
The optimization problem is structured by defining the optimization variables, problem constraints, and cost function to be minimized. For better clarity, Table 5 briefly summarizes the structure of the constraints and the cost function components used in this study.

2.3.1. Optimization Variables

A set of variables is defined for each time step within the optimization horizon. Specifically, for EV-related variables, the horizon is limited to T E V i < T , where T E V i represents the number of time steps from the simulation start until the vehicle’s estimated departure time. All other variables are defined over the full horizon T, corresponding to a 24-h period. They include:
  • Power exchange with EVs { P E V } , with local BESS { P B E S S } and with a local low voltage grid for a location { P L O C } .
  • SOC evolution over time for EVs { S O C E V } and for BESSs { S O C B E S S } .
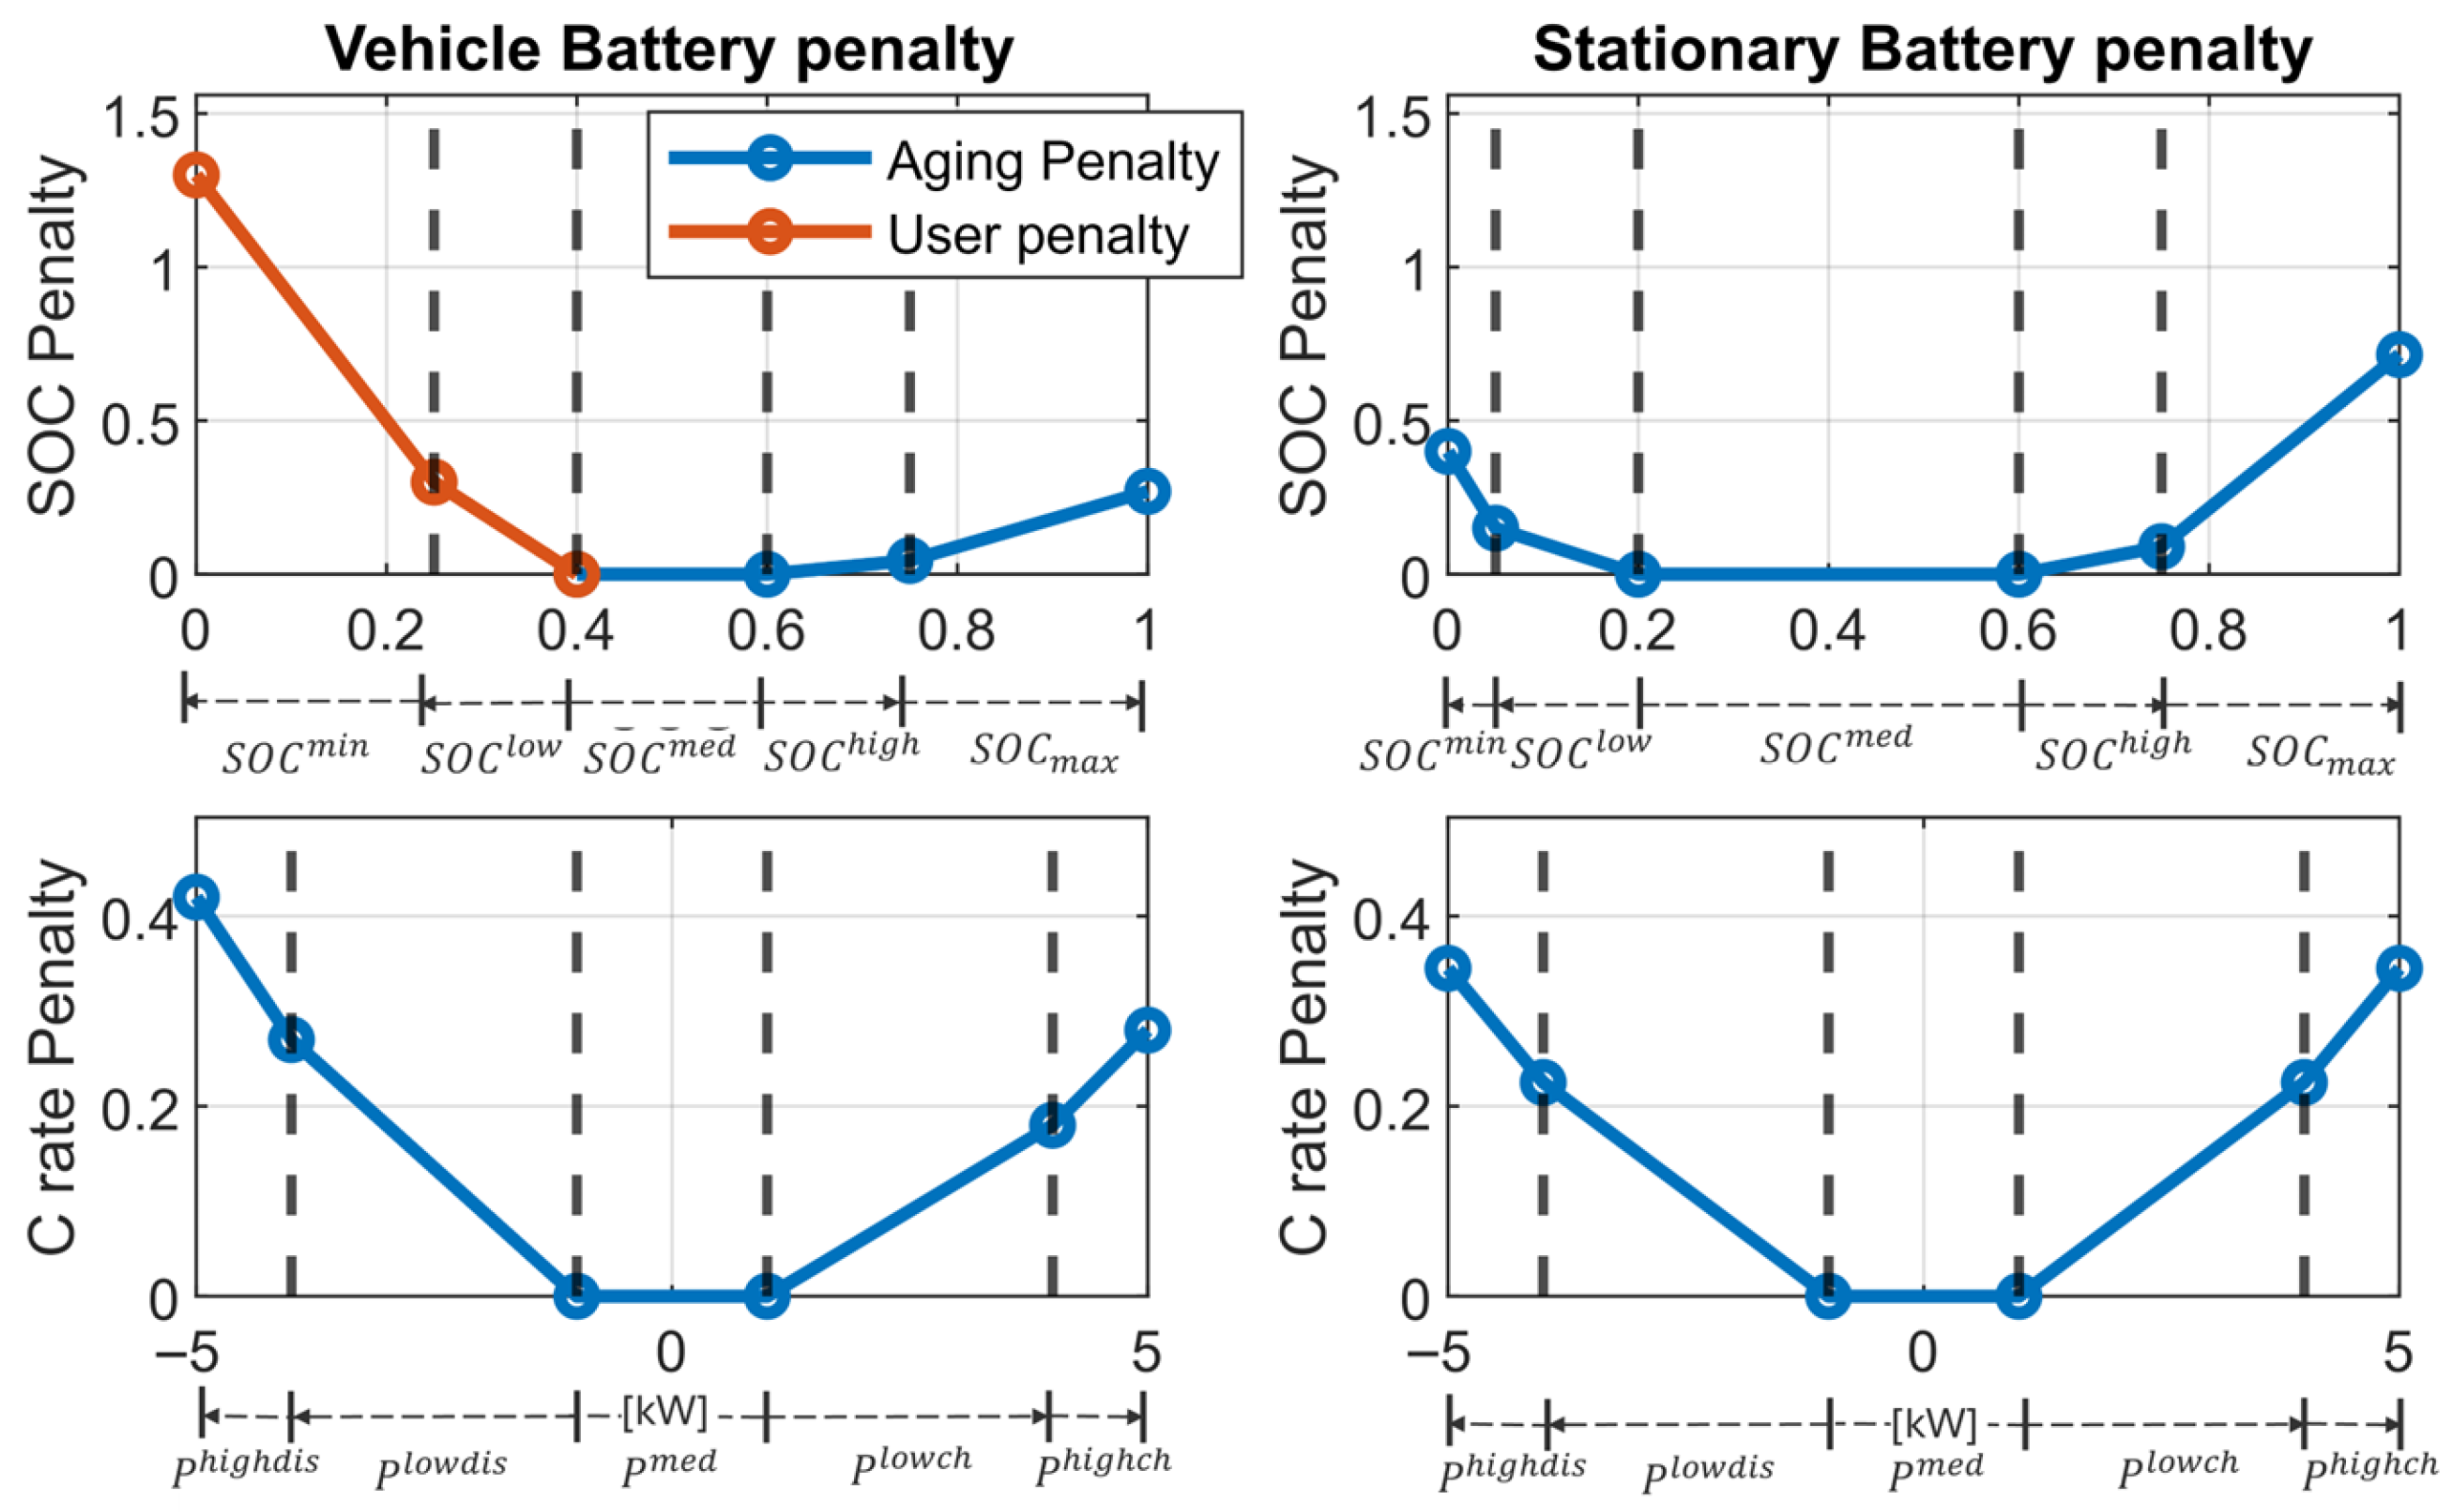
  • Sub-optimization variables are defined to enable custom piecewise linear cost functions for aging penalties, which ensure that the optimization problem remains linear, avoiding the need for non-linear optimization methods. Specifically, for each EV and BESS, a set of five variables is defined for Power ( P h i g h d i s ; P l o w d i s ; P m e d ; { P l o w c h } ; { P h i g h c h } ) and SOC ( { S O C m i n } ; { S O C l o w } ; { S O C m e d } ; S O C h i g h ;   { S O C m a x } ). These sub-variables are restricted to a limited range within the domain of the main variables and are designed to penalize the extreme values of power and SOC. The constraints linking each auxiliary variable to its respective main counterpart are described in Section 2.3.2 (see Equation (12)). The structure of the custom cost function and the range definitions for each auxiliary variable are illustrated in Section 2.3.3.
  • Global power exchanged between the community and MV grid { P G R I D } , as well as its positive and negative components, { P G R I D + } and { P G R I D } , respectively.
  • Power derivative variables for EVs { d P E V } , BESSs { d P B E S S } , and grid { d P G R I D } defined in positive semi-continuous space.

2.3.2. Problem Constraints

Constraints define the rules and limits of the optimization. In addition to limiting variables within their physical bounds, such as SOC variables in the range [0, 1] and power variables between minimum and maximum technical limits, the constraints also include:
  • Power balance constraint for ensuring that energy supply equals demand at each time step for every location:
    P P V ^ ( t ) + P L O C j ( t ) = P B ^ ( t ) + i N E V ( P E V i ( t ) ) + P B E S S ( t ) j = 1,2 N l o c ,   t = 1 , 2 , T
where P P V ^ ( t ) is the forecasted PV production, and P B ^ ( t ) the predicted building load. In addition, a global power balance constraint involving all location powers is defined as
P G R I D ( t ) = j N L O C P L O C j ( t ) t = 1 ,   2 ,   T
  • SOC evolution constraint to ensure physical consistency between the power and corresponding SOC values. It is defined as:
S O C E V i 0 = S O C 0 E V i S O C E V i t S O C E V i t 1 = P E V i ( t ) C E V i , t = 1 ,   2 ,   T E V i
where S O C 0 E V i represents the initial SOC value of the vehicle, and C E V i its battery’s available capacity. An analogous formulation is applied to the BESS units installed in the community.
  • Inverter maximum power constraints. When transferring power between the DC and AC lines via an inverter, the maximum deliverable power must be accounted for. Accordingly, DC-side power flows at each location are constrained within technically feasible limits, defined by the inverter’s rated capacities ( P A C / D C m a x ; P D C / A C m a x ):
    P A C / D C m a x P B E S S t + P P V ^ t P D C / A C m a x t = 1 ,   2 ,   T
  • User flexibility constraints applied to the vehicle charging processes. These constraints reflect the user’s preference for the desired charging behavior. For a vehicle i , it may include V1G user constraint,
    P E V i ( t ) 0 t = 1 ,   2 ,   T E V i
priority user constraint,
P E V i t = P i k   m a x P i k m a x = m i n ( P c h k m a x ,   P E V i m a x ) , t = 1 ,   2 ,   T E V i
where P i k m a x is defined as the minimum between the maximum deliverable power by the charger k ( P c h k m a x ) and the maximum charging power accepted by the vehicle ( P E V i m a x ), and the target SOC constraint,
S O C E V i ( T E V i ) = S O C E V i
where T E V i is the estimated departure time and S O C E V i is the SOC imposed by the user at the end of the charging session. Note that the constraint in Equation (10) is applied only for priority user, thereby fixing the value of P E V i (t) throughout the optimization for this user category. Conversely, the constraint in Equation (11) applies only to V1G users who do not allow their vehicle batteries to discharge. For V2G users, neither of these two constraints is imposed, allowing the optimization greater flexibility in managing charging and discharging power flows.
  • Sub-Constraints applied to sub-optimization variables. These constraints ensure that the sum of the sub-variables equals the corresponding main variable. For an EV, they are defined as:
P E V i ( t ) = P E V i m e d ( t ) P E V i h i g h d i s ( t ) P E V i l o w d i s ( t ) + P E V i l o w c h ( t ) + P E V i h i g h c h ( t )   S O C E V i ( t ) = S O C E V i m e d ( t ) S O C E V i m i n ( t ) S O C E V i l o w ( t ) + S O C E V i h i g h ( t ) + S O C E V i m a x ( t ) t = 1 ,   2 ,   T E V i
The same notation is used for BESS sub-optimization variables.
  • Positive constraint formulation for power derivative variables. For the grid power is defined as
P G R I D t + 1 P G R I D t d P G R I D ( t )   ( P G R I D t + 1 P G R I D t ) d P G R I D ( t ) t = 1 ,   2 ,   T 1
ensuring that d P g r i d ( t ) is defined in the positive domain while maintaining the physical meaning of the power time derivative over a fixed time step. This constraint enables the incorporation of a ramping cost of power without requiring additional binary variables to separate the positive and negative parts of the variable. The same approach is adopted for derivative variables of BESSs and EVs.
  • Power-sign constraint. Finally, for the entire community, a global constraint is imposed to ensure that the positive and negative components are mutually exclusive. The following constraint is therefore introduced:
P G R I D + ( t ) b G ( t ) P G R I D m a x P G R I D t 1 b g t P G R I D m i n P G R I D + ( t ) P G R I D ( t ) = P G R I D ( t ) , b G t { 0,1 } ,   t = 1 ,   2 ,   T
where b G is a binary variable used to ensure the mutual exclusivity of positive and negative grid power exchanges.

2.3.3. Cost Function

To solve a MILP problem, a weighted sum of cost functions over the time horizon T has to be minimized while respecting constraint boundaries. The objective cost function is defined as:
min x t = 1 T j = 1 J L j ( x j t , k j )
where L j represents one of the adopted loss functions, x j denotes the corresponding optimization variables, and k j indicates the associated weight coefficients, whose values are listed in Table A1. Cost functions include:
  • Energy cost function ( C e n ) for minimizing energy costs based on day-ahead energy prices ( k P z ( t ) ) established by the Transmission System Operator. Using an energy price profile for a specific market zone not only results in cost savings but also contributes to achieving an hourly demand-supply balance within the REC price zone [63,64]. Energy cost function is defined as:
    C e n t = k P z t P G R I D ( t ) t = 1 ,   2 ,   T
  • Incentive cost penalties for reducing energy exchanges with the MV grid while high incentives for shared energy within RECs are available. It also contributes to enhancing the energy community’s independence from centralized generation, as well as active energy exchange between producers and consumers within the LV local grid. Incentives price profile ( k i n ( t ) ) is computed in function of day-ahead price market as illustrated in Table 1. The penalty term C i n ( t ) is computed using the following relation:
    C i n t = k i n ( t ) ( P G R I D + t + P G R I D t )   t = 1 ,   2 ,   T
    where the second term clearly identifies the absolute value of the grid load. Since the definition of shared power P s involves several non-linear terms that scale with the number of locations (see Equation (1)), the incentive cost formulation does not directly include it, but implicitly encourages its use by penalizing MV grid exchanges when high sharing incentives are available.
  • Aging penalty functions to limit critical battery usage. These functions aim to limit both excessive power levels and extreme SOC values, thereby reducing cycle and calendar aging effects for both EVs and BESSs. Aging penalties are applied through sub-variable weighting, resulting in a global piecewise linear cost profile. Cycle and calendar penalties for EVs are defined as
C E V i c y c t = k E V h i g h d i s P E V i h i g h d i s t + k E V l o w d i s P E V i l o w d i s t + k E V l o w c h P E V i l o w c h ( t ) + k E V h i g h c h P E V i h i g h c h ( t ) C E V i c a l t = k E V m i n   S O C E V i m i n t + k E V l o w S O C E V i l o w t + k E V h i g h S O C E V h i g h t + k E V m a x S O C E V i m a x ( t ) t = 1 ,   2 ,   T E V i
Figure 6 illustrates the calendar and cycle aging penalties of the EVs and BESSs. For electric vehicles, the medium SOC target range S O C E V i m e d is set within [0.4, 0.6]. SOC values above 0.6 are penalized to reflect the ramping increase in calendar aging reported in the literature [47,65,66]. More specifically, Keil et al. [66] observed steady degradation plateaus across SOC levels, with a significant increase in capacity fade for NCA and NMC cells above 60% SOC and for LFP cells above 70% SOC. Additionally, Khezri et al. [47] proposed a linearized damage function for calendar aging using SOC thresholds of 50% and 70% to define the penalty slopes. Based on these studies, a threshold of 0.6 was deemed to be a conservative and technically justified upper limit for the medium SOC range.
On the other hand, SOC values below 0.4 are discouraged to preserve user needs and expectations. In contrast, for BESSs, the medium SOC threshold is set to 0.2, reflecting their stationary and more flexible operating conditions. Boundaries for the power sub-variables are scaled proportionally to their respective capacities, resulting in a custom cycle penalty that depends on the specific Capacity rate value.
  • Power ramp penalty to avoid excessive and rapid variations in the optimized power profile over time. This formulation is applied to both the charging/discharging power of EVs and BESSs, ensuring smooth and stable solutions. Additionally, it is applied to the global power exchanged with the MV grid, thereby reducing sudden fluctuations in the REC grid power exchange. This approach enhances the REC’s ramping flexibility with respect to centralized and external load generation, leveraging the dynamic capabilities provided by V2G and storage systems [49,67] and contributing to a more stable power demand over time.
For the global power exchange, the power ramp penalty ( C G R I D d P ) grid is formulated as:
C G R I D d P t = k G R I D d P d P G R I D ( t ) t = 1 ,   2 ,   T 1
An analogous formulation is applied to the EVs and BESSs using lower penalty coefficients.
The optimization problem is solved using MATLAB’s intlinprog solver. Using this method, the problem is first relaxed by excluding constraints that involve integer variables. Subsequently, a feasible solution is sought within the restricted domain using the branch-and-bound method [68]. The computational cost of this phase increases exponentially, in the worst case, with the number of integer variables, as the algorithm must explore a tree of potential sub-solutions [69]. To manage this complexity, our approach restricts binary variables to the optimization of global decision-making, avoiding their use at the individual locations. Binary variables have been applied exclusively to penalize excessive power exchanges with the grid as a function of shared energy incentives, which has significant implications for promoting self-consumption. As a result, the problem complexity does not scale exponentially with the number of locations.

2.4. Rule-Based Decision Algorithm

Handling forecast deviations and ensuring a robust system response are key features of the proposed hybrid framework. To achieve this, a power redistribution strategy has been implemented within the local controller to manage deviations from forecasted values. Figure 7 illustrates the scheme of the proposed rule-based method. The first decision branch determines whether there is a power surplus or shortage with respect to the forecast. The power deviation P d is calculated as
P d = ( P P V ^ P P V ) + ( P B P B ^ )
considering forecast errors of PV production and building demand from the actual values. PV prediction errors are simulated by introducing Gaussian noise around the forecasted value. For demand forecasting errors, the historical consumption data used in the simulation were not included in the training set of the neural network, following the methodology presented in Section 2.2. Consequently, the resulting deviation is representative of the prediction error of the regression neural network.
In the event of a lack of power ( P d > 0), the system first checks whether the current energy price corresponds to a valley period. In this case, the deficit is compensated directly from the grid. Otherwise, the required power is redistributed among the available flexible resources based on weight coefficients. Conversely, in the case of excess power ( P d < 0), if the system detects peak price period, the surplus is entirely exported to the grid. If not, the excess is distributed among the resources proportionally to their respective weights.
Weight coefficients are computed differently for the EVs that are actually connected, the eventually available BESS, and the grid:
  • EVs’ availability to compensate for power fluctuations is based on a priority function ( f E V i ), following the approach proposed by Van der Kam et al. [35]. This function correlates the urgency of charging with the estimated remaining charging time ( t E V i e s ) and the expected parking duration (see Equation (21)). t E V i e s is computed (see Equation (22)) as the ratio between the remaining energy required by the user and the exponentially weighted average of the mean charging power ( P E V i m e a n ) (see Equation (23)).
    f E V i = t E V i e s t E V i t 0
    t E V i e s = S O C E V i S O C E V i C E V i P E V i   m e a n
    P E V i m e a n = t = t 0 90 t 0 α ( t 0 t ) P E V i ( t )
The mean power is computed over the minimum between 90 min and the actual charging session duration using a fixed time step of 1 min. The priority factor is bounded in the range [0.05, 10] to avoid excessive variability in its value. The weight coefficient is computed based on the priority factor ( f E V i ) and the maximum power variation achievable ( P E V i m a x ). Its calculation differs depending on whether there is an excess or a deficit of power:
P E V i m a x = P i k m a x P E V i w E V i = P E V i m a x f E V i                 i f   P d > 0 P E V i m a x = P E V i P i k m i n w E V i = f E V i P E V i m a x                      e l s e
  • BESS weight coefficient is instead computed based on its SOC and the maximum exploitable charging or discharging power ( P B E S S m a x , P B E S S m i n ). According to the two described scenarios, it is defined as follows:
    P B E S S m a x = P B E S S m a x P B E S S   w B E S S = P B E S S m a x S O C B E S S   i f                   P d > 0 P B E S S m a x = P B E S S P B E S S m i n w B E S S = P B E S S m a x m i n ( 0.05 , S O C B E S S )                        e l s e
  • Grid weight coefficient is computed based on the comparison between the current electricity price ( p t 0 ) and the average price ( p m ) over a centered 48 h window. Depending on the scenario, it is defined as
    W G R I D = p m [ 24 h ÷ 24 h ] p ( t 0 )                    i f   P d > 0 W G R I D = p t 0 p m [ 24 h ÷ 24 h ]                        e l s e
Power difference ( P d ) is then distributed proportionally to the computed weights for EVs (see Equation (28)) and BESS (see Equation (29)). These values are clipped within their minimum and maximum feasible limits, while the remaining portion is allocated to the grid (see Equation (30)), accounting for possible deviations from the optimal value due to EV and BESS power constraints. The parameter δ indicates whether a flexible resource is currently available or not.
W = E V i N E V w E V i δ E V i + w B E S S δ B E S S + W G R I D
P E V i = min ( 0 , max ( P d w E V i W , P E V i m a x ) )
P B E S S = min ( 0 , max ( P d W B E S S W , P B E S S m a x ) )
P G R I D = | P d | E V i N E V P E V i + P B E S S
By applying this rule-based strategy, the local controller operates as a contingency layer to mitigate the impact of forecast uncertainty on PV generation and building demand through dynamic power redistribution.

3. Results

3.1. Analyzed Case Study

For the model evaluation, a realistic scenario of a small REC is proposed as an illustrative case study, implemented within the Horizon Europe XL-Connect project [58]. It involves two main sites located in the Municipality of Calenzano (Florence, Italy), referred to as the same MV substation (see Figure 8):
  • MOVING LAB—A facility accessible exclusively to University of Florence members. It features three charging points, a PV power system, and a battery storage system. Additionally, it hosts the building of the Department of Industrial Engineering laboratories, which is characterized by high energy consumption and peak periods, making it an ideal setting for testing energy management models.
  • CAMPUS DESIGN AREA—Situated on public land near the University’s Faculty of Design, it involves six public charging points located in a mixed residential and workplace area.
Table 6 summarizes the main system parameters used in this analysis.
To evaluate the impact of a hybrid modulation strategy with charging points and BESS, a reduced PV-to-BESS sizing ratio compared to the conventional one was adopted (0.5 kWh: 1 kWp). Some ideal scenarios were defined to assess the impact of the user’s acceptance of the smart charging concept while maintaining the same EMS architecture.
  • V1G scenario: All users allow unidirectional charging flexibility.
  • V2G scenario: All users allow bidirectional charging flexibility.
  • Uncontrolled charging scenario: All users belong to the priority class (see Table 2); EVs are charged at the maximum available power as soon as they are plugged in, without offering any form of flexibility in the charging process.
All three scenarios share the same charging events, with the same starting and target charging SOC and expected parking duration, while the actual parking duration is generated through a normal distribution centered on the expected parking duration.

3.2. MILP Optimization Results

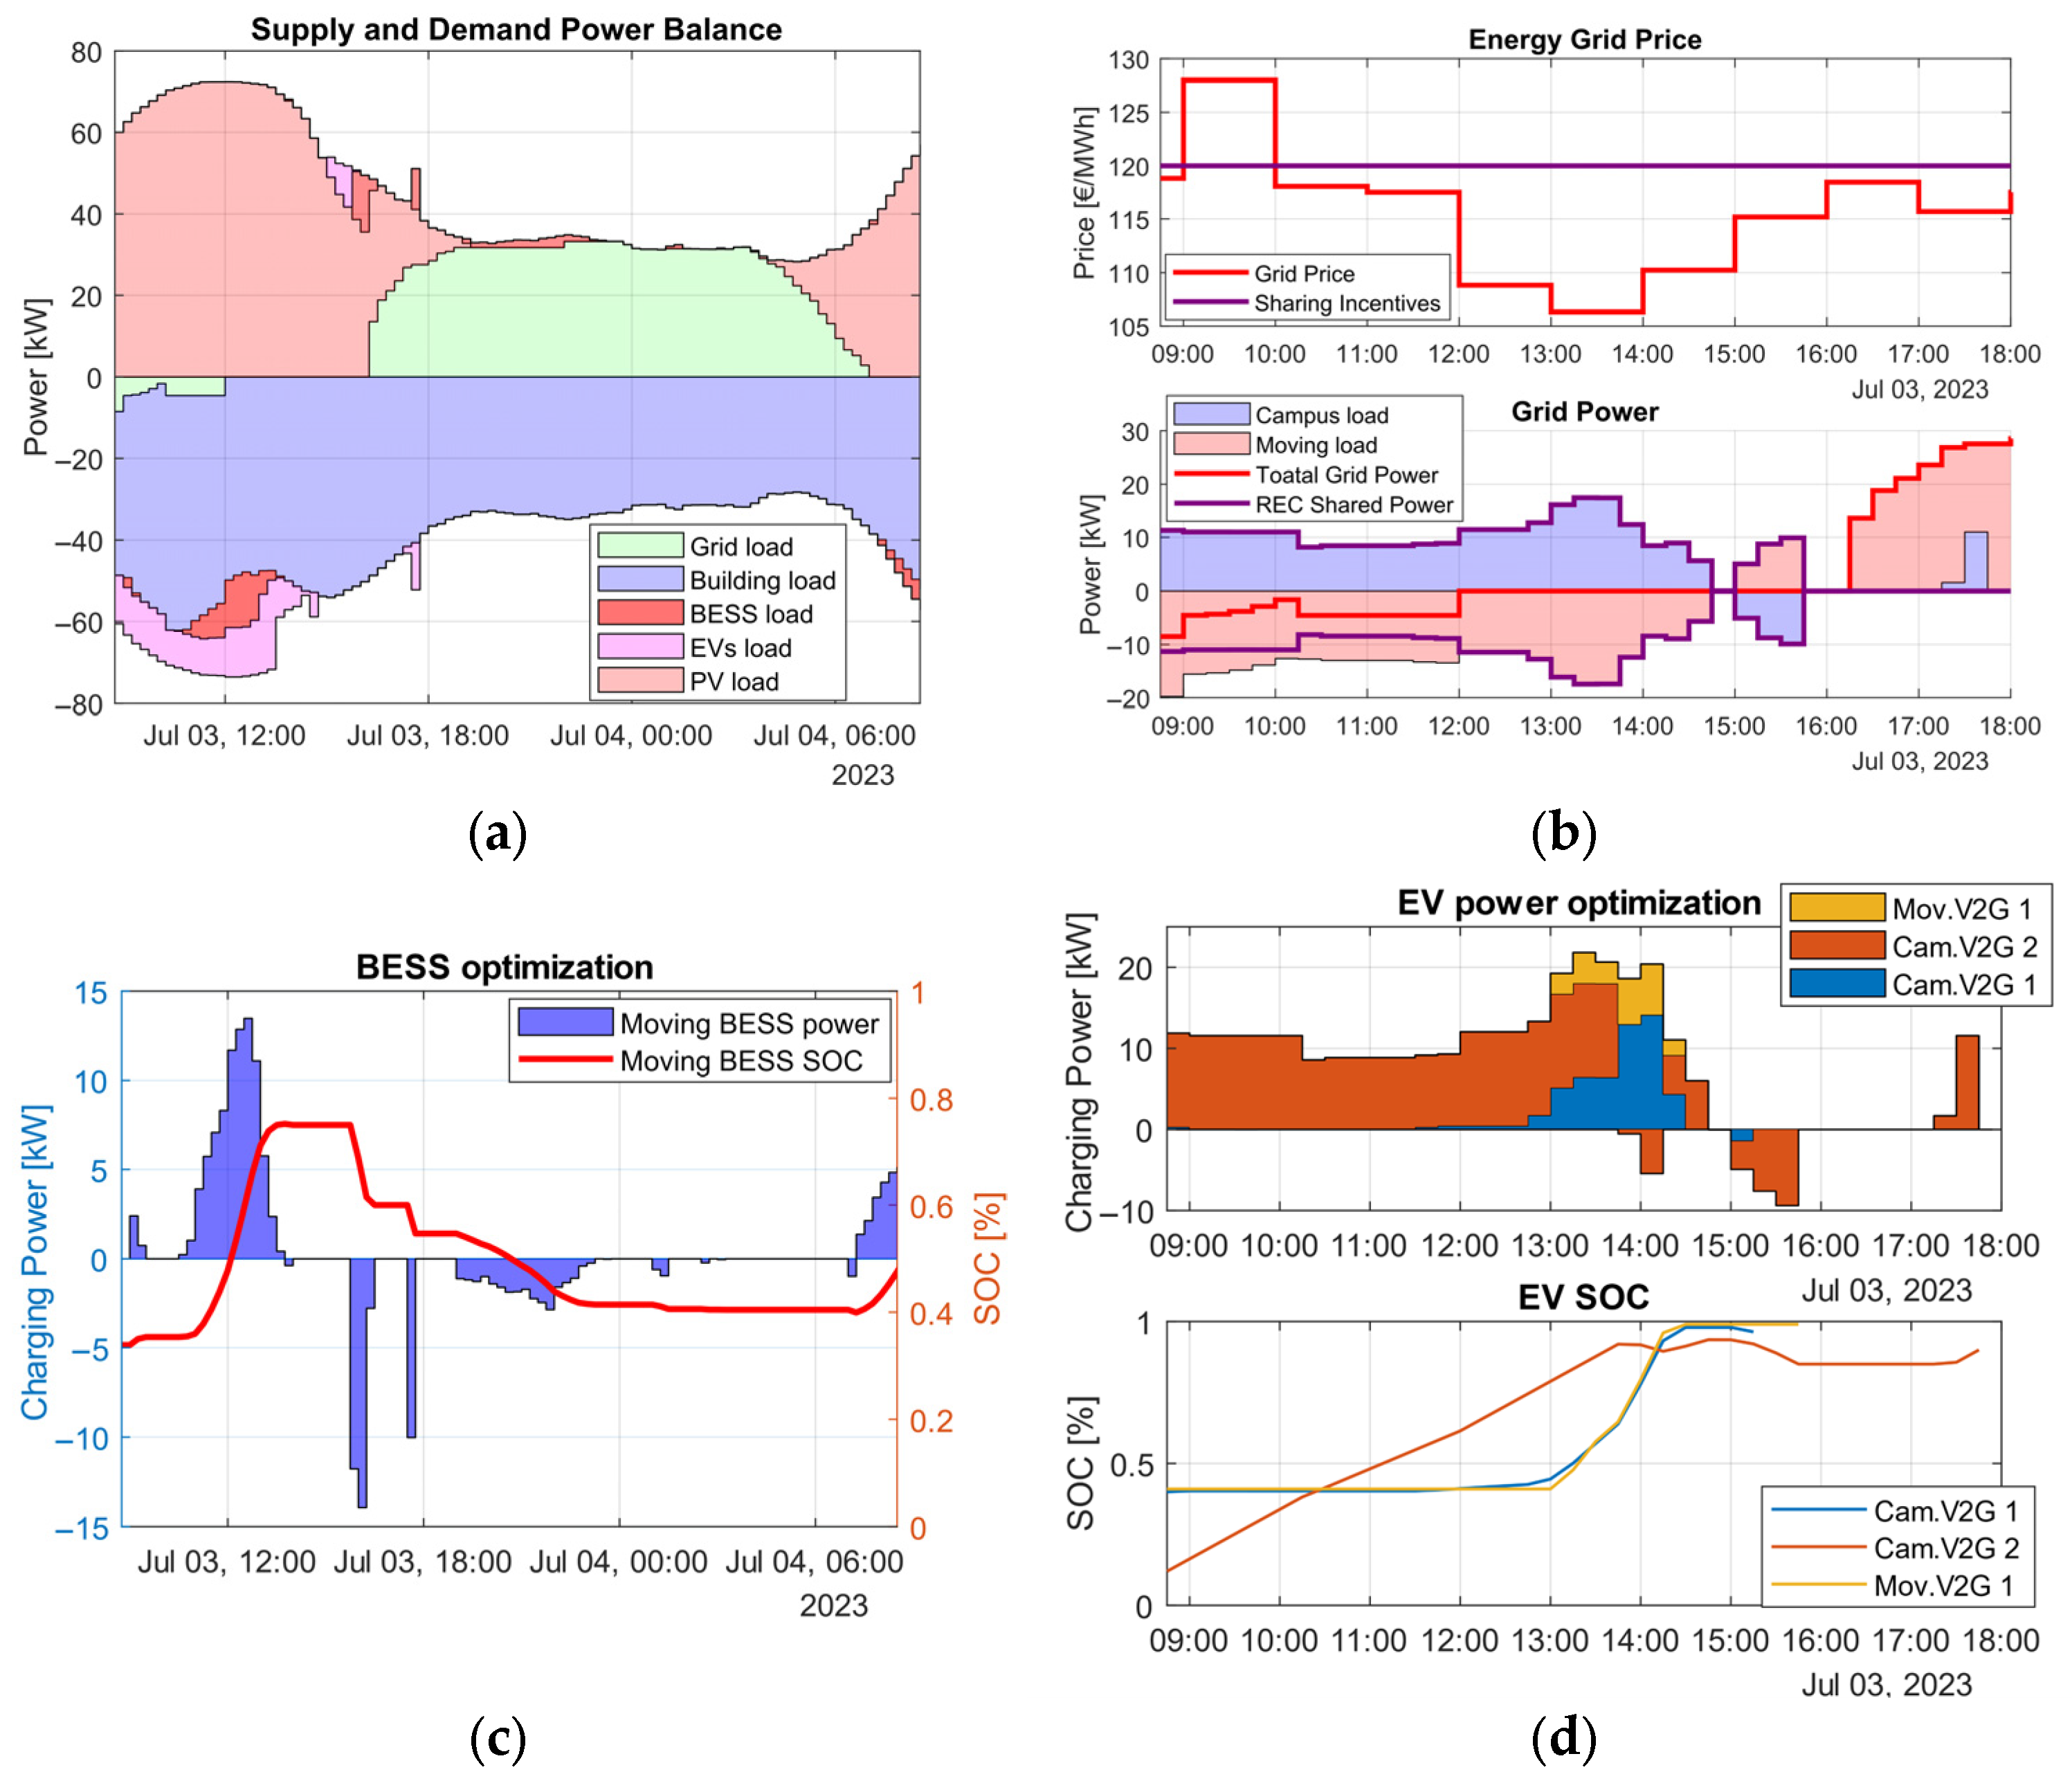
To gain insight into the behavior of the MILP optimization framework, Figure 9 depicts a case study based on the V2G scenario, as modeled according to the methodology outlined in Section 2.3.
In this case, the Cloud Scheduler is triggered once a new charging session begins. The optimized power flows enable alignment between expected PV generation and local consumption (see Figure 9a). In particular, EV charging sessions are modulated, with some sessions shifted to the lunch break to cover the building’s reduced load (see Figure 9d). A short discharging event is also scheduled to compensate for a forecasted PV production drop around 5:00 PM. BESS contributes to meeting local demand and mitigating fluctuations in grid power exchange, while also maintaining a minimum SOC at the end of the time horizon (see Figure 9c). Excess PV production from the Moving Lab is used to supply charging sessions at the Campus faculty and to feed energy back into the LV grid during peak price periods, thus maximizing shared energy use and generating revenues through incentives (see Figure 9b).
For this case study, the optimization process requires, on average, 1.5 s for problem construction and 0.25 s for solving, ensuring feasibility for real-time applications. Scalability implications are further discussed in Section 3.5.

3.3. Rule-Based Algorithm Results

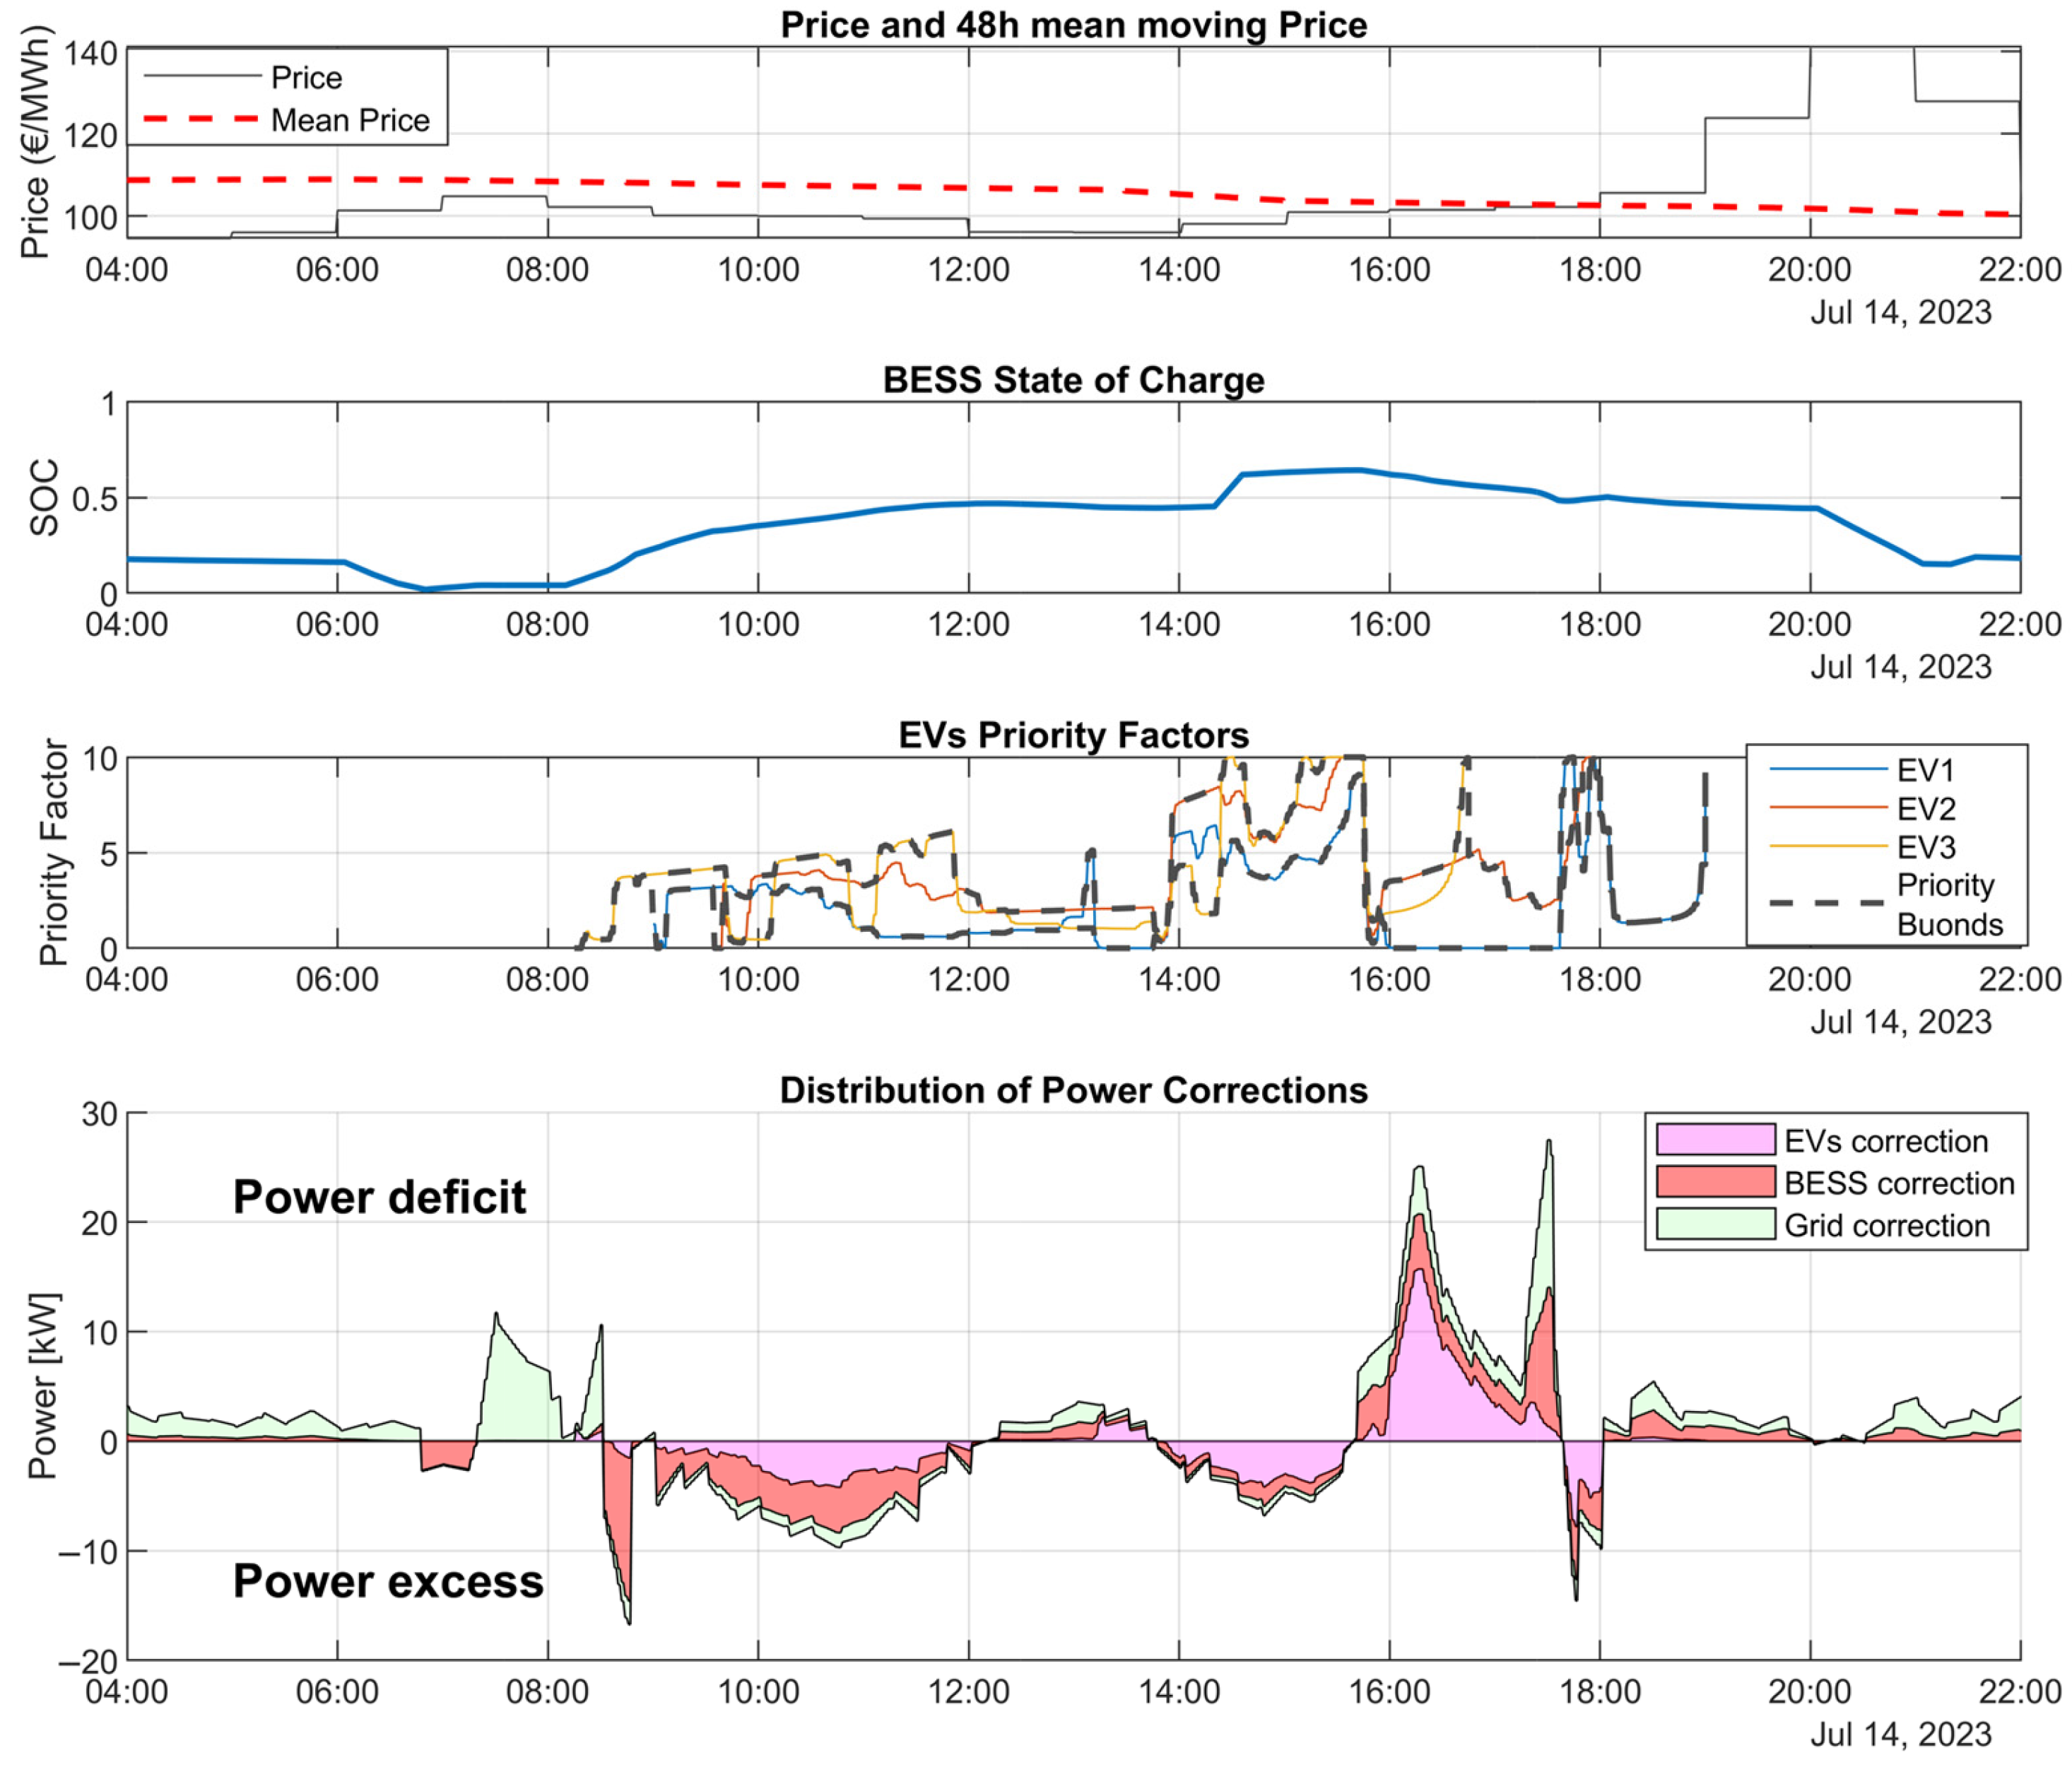
This section presents the outcomes of the rule-based control strategy described in Section 2.4, which handles real-time deviations using a fixed time step of 1 min. Figure 10 shows a typical instance of rule-based control at the Moving Lab site, highlighting its role in managing local load balancing.
Power deficits during nighttime are typically compensated by the grid, taking advantage of low electricity prices, while the BESS is primarily used during high-price periods to address power imbalances (e.g., around 7:00 PM). When at least one EV is connected, it actively contributes to power balancing based on the charging urgency. For instance, EVs played a significant role in mitigating power imbalances in the early afternoon (around 5:00 PM) and in absorbing excess PV production. In the late afternoon (around 7:00 PM), although an EV was connected, it did not support grid balancing due to its high charging priority.

3.4. Comprehensive Results and KPI Analysis

The optimization of the case study described in Section 3.1 was performed using historical data of estimated PV generation and energy consumption from the laboratories at the Moving site, covering a six-month period (from 1 July 2023 to 31 December 2023). This time frame includes a wide range of PV generation conditions, seasonal variations in electricity prices, and fluctuating building demand patterns. Realistic EV charging events were generated for both locations, following the methodology presented in Section 2.1. For each simulation day, events were randomly assigned according to a probabilistic arrival curve, allowing day-to-day variability.
The objective of this section is to present a sensitivity analysis on the level of user participation in smart charging strategies, comparing the three scenarios introduced in Section 3.1.

3.4.1. Impact on Grid Peak Mitigation and Energy Cooperation

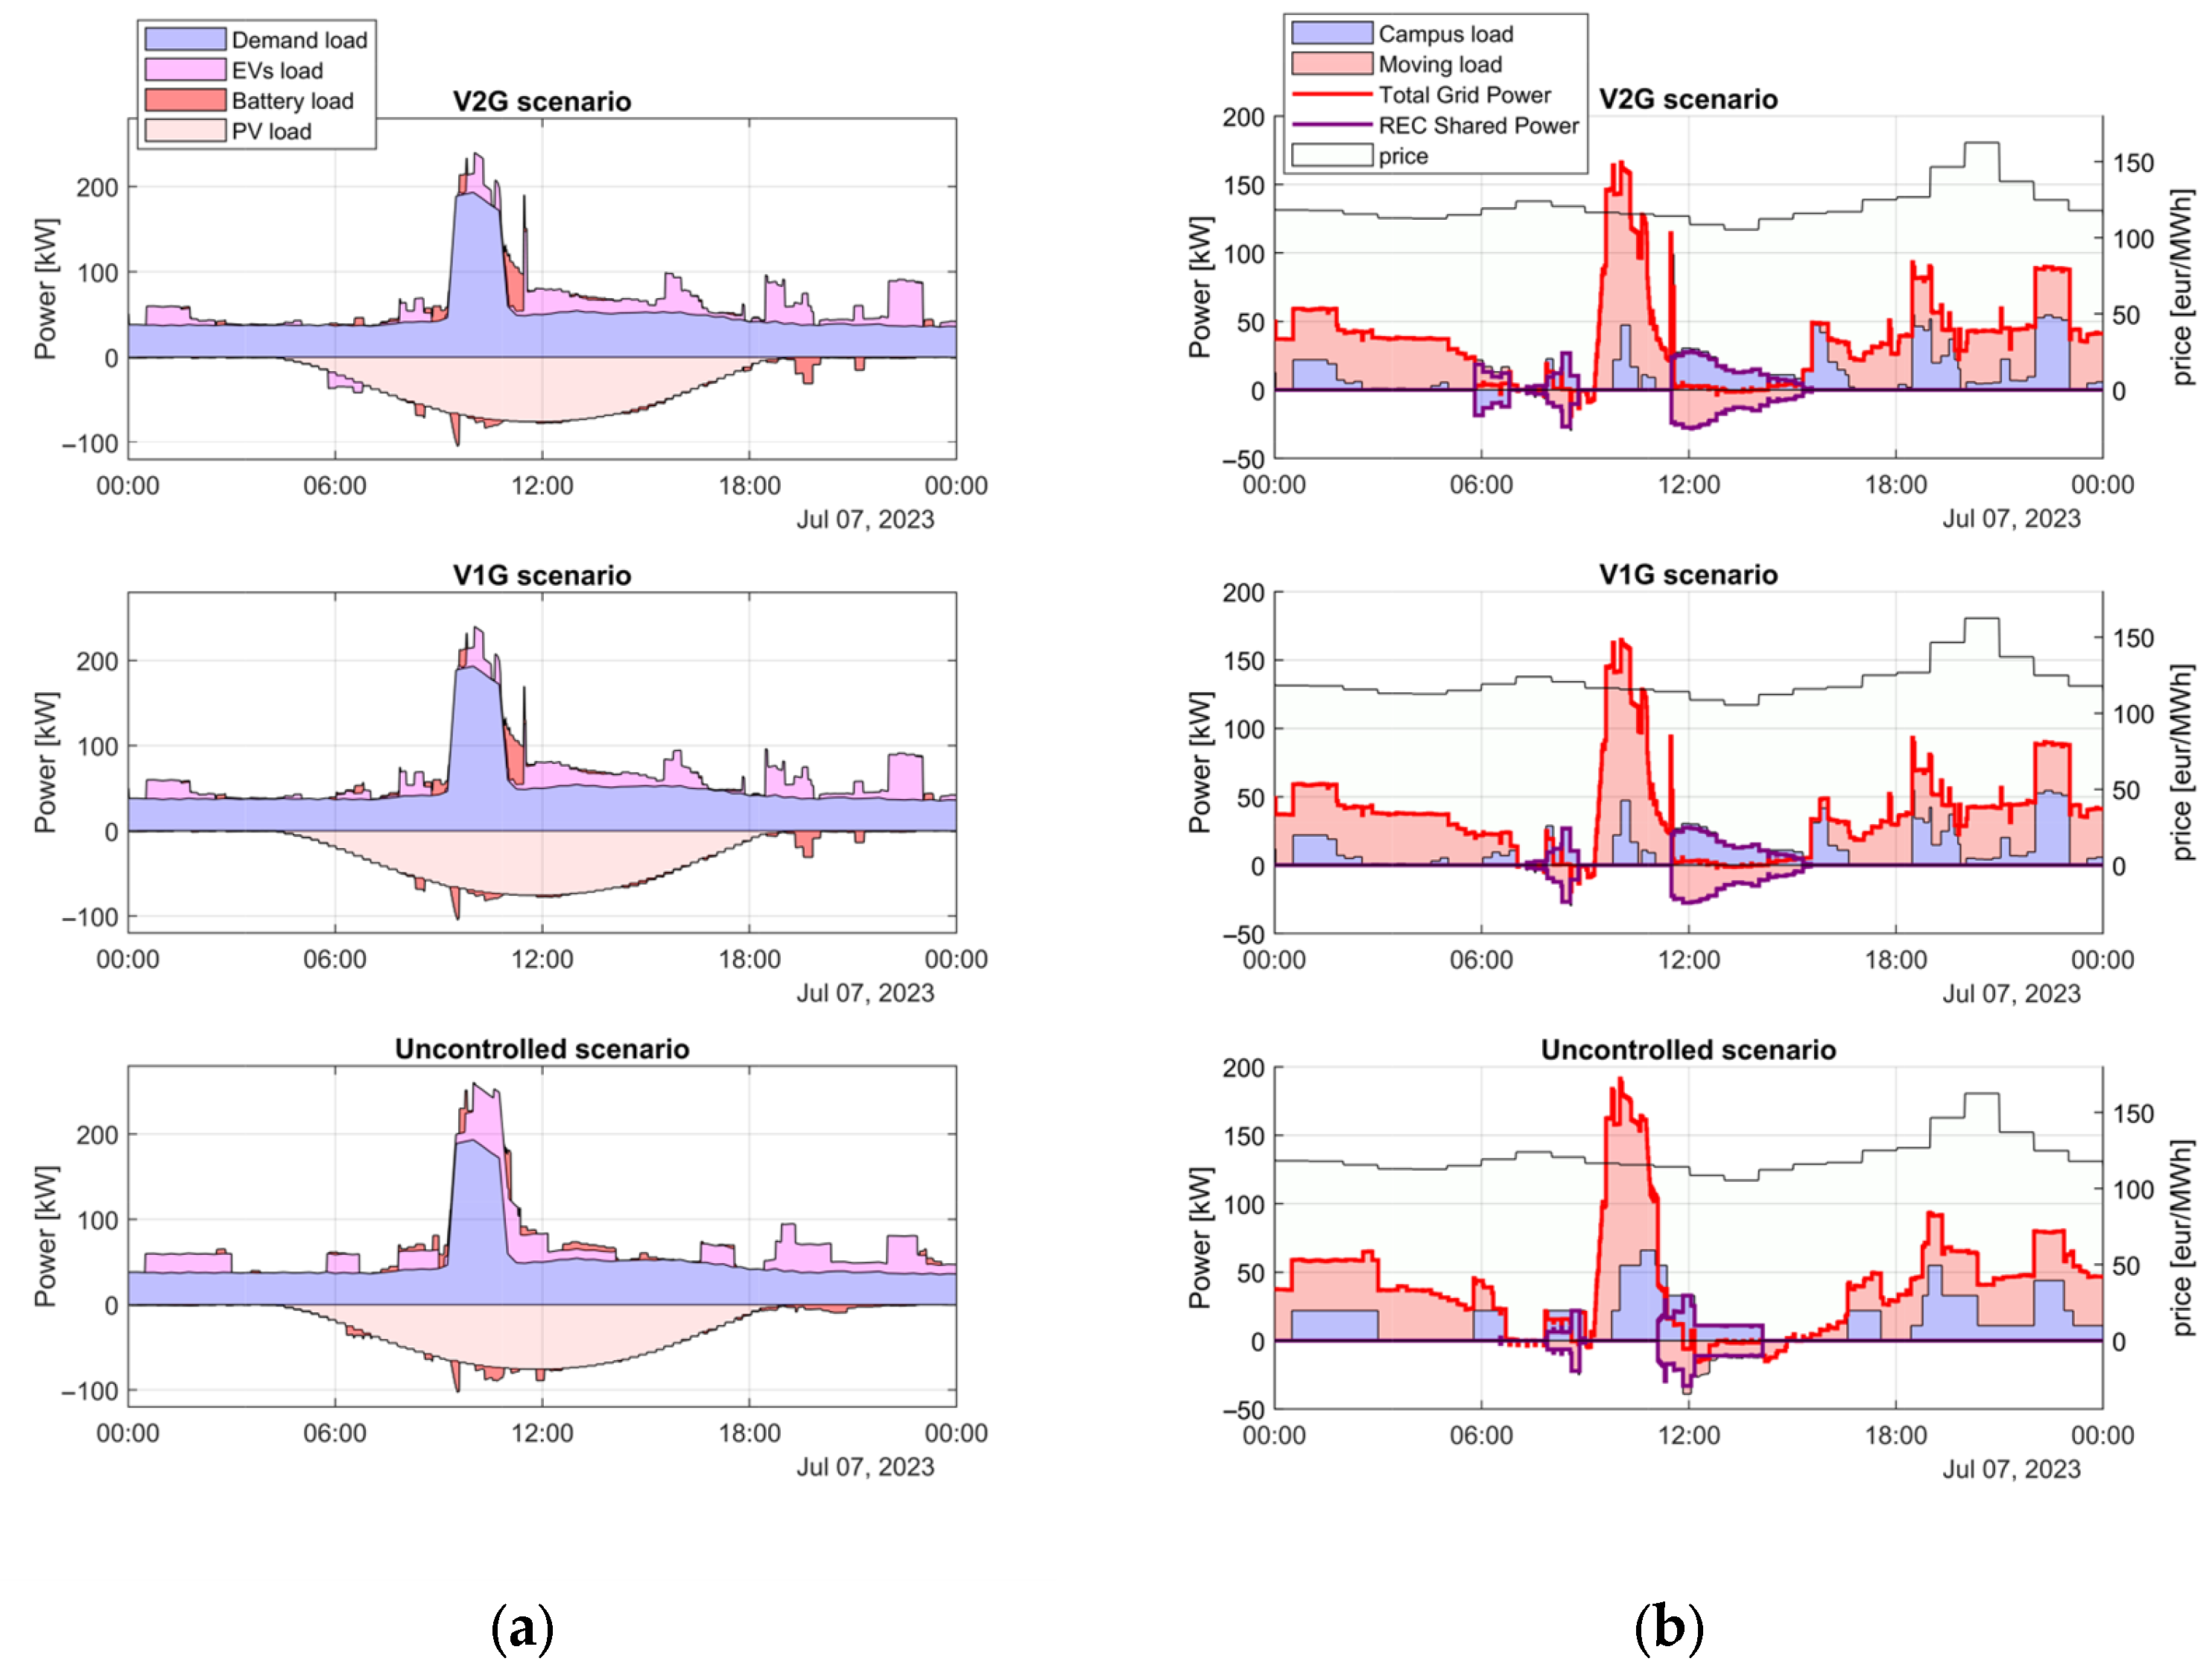
This subsection presents an evaluation of the operational and economic benefits of integrating smart charging within the model. It begins with a detailed analysis of the model’s behavior for a representative day across the three main scenarios, followed by a presentation of results aggregated over the full six-month simulation period. Key global trends and relevant KPIs are analyzed to provide a comprehensive overview. Figure 11 shows an example of how a power peak was handled in the V2G and V1G scenarios compared to the uncontrolled charging scenario. The EV charging power was limited during the peak period, while the BESS supported peak reduction through pre-peak discharge and post-peak recharge (see Figure 11a). This strategy results in a smoother grid power profile and a significantly reduced peak (see Figure 11b). Moreover, some afternoon charging sessions were extended to absorb excess PV production and increase the energy shared. A subtle but relevant difference emerges between the V2G and V1G scenarios: in the V2G case, an early morning charging session at 6:00 AM helps cover building demand and reduces overall power exchange with the grid.
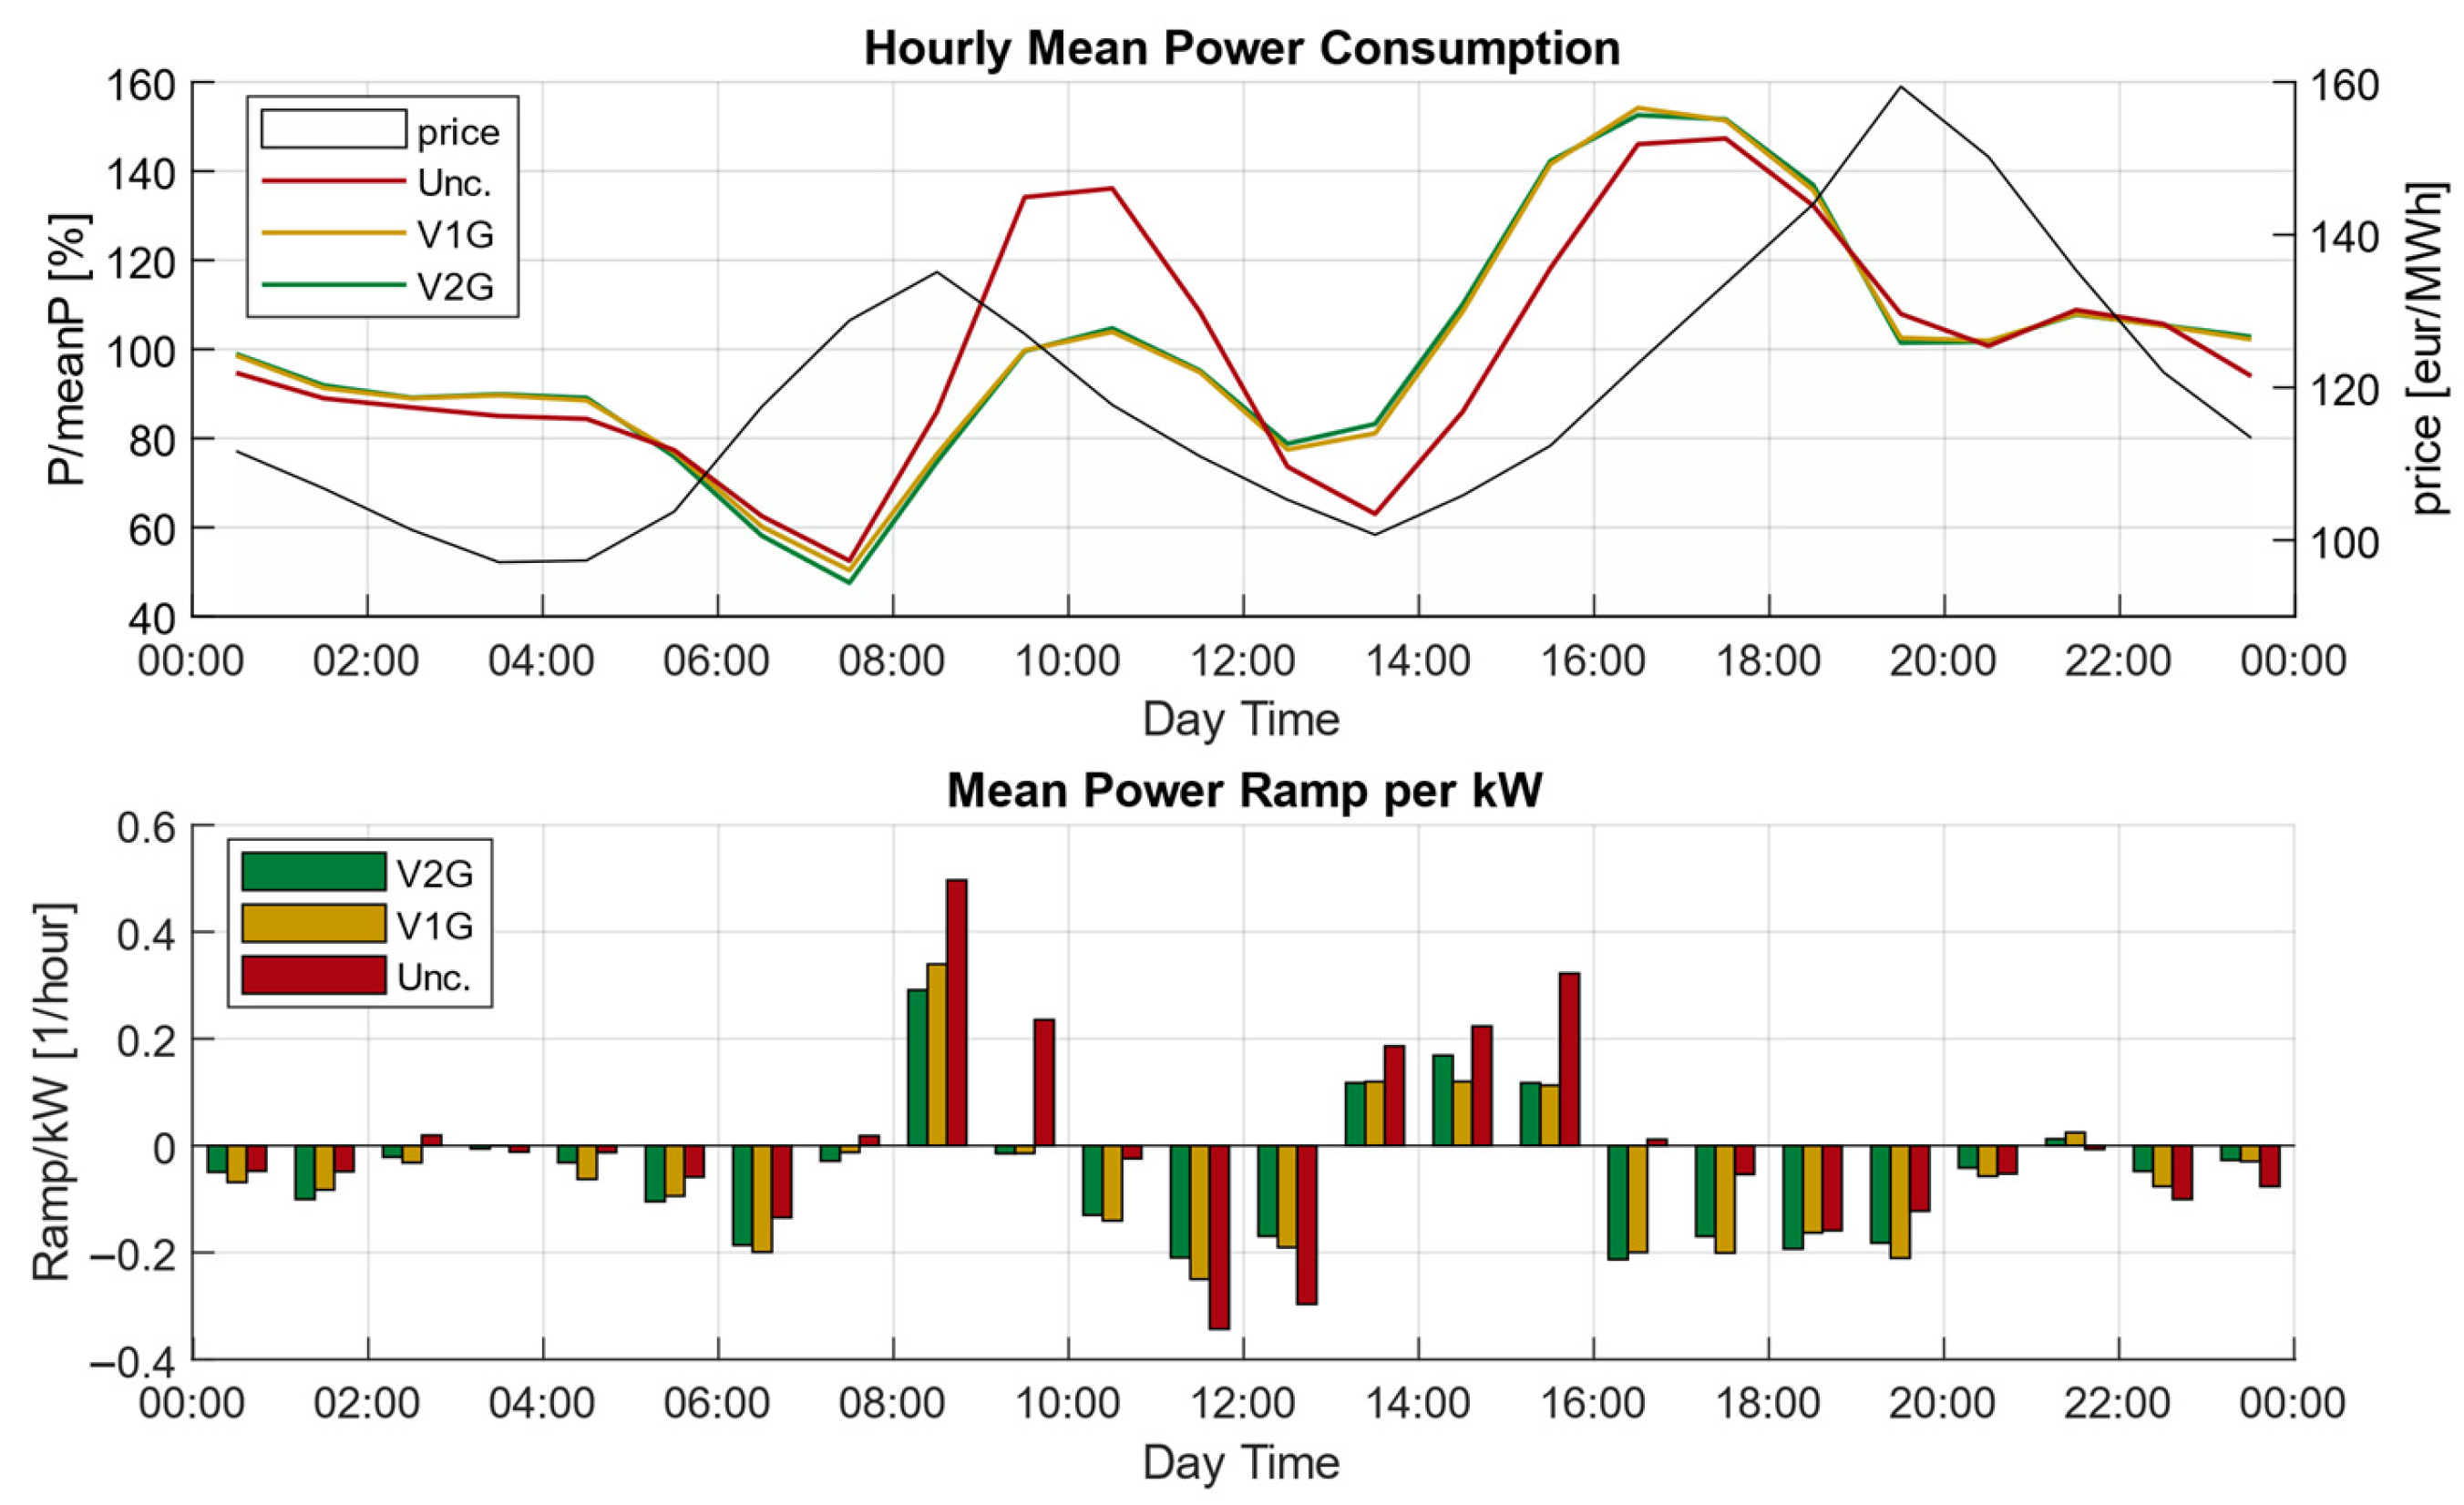
Figure 12 presents the overall results for the three analyzed scenarios, showing the average power consumption trends compared to the zonal electricity price curve and the average load ramp over time, normalized to each scenario’s mean power.
Results highlight a smoother power profile across the day in the V2G and V1G scenarios. Specifically, the peak power at 10:00 AM is reduced by 35% compared to the uncontrolled charging scenario, owing to the ability to shift charging operations to the midday period. Moreover, the V2G and V1G scenarios exhibit lower ramp rates during critical transitions. For example, the power ramp at 8:30 AM in the V2G case is reduced by 59% compared to the uncontrolled case, corresponding to a variation of 0.29 times the mean power within one hour. Sustaining a higher power level around midday also contributes to reducing the ramp required to meet the second daily peak at approximately 5:00 PM.
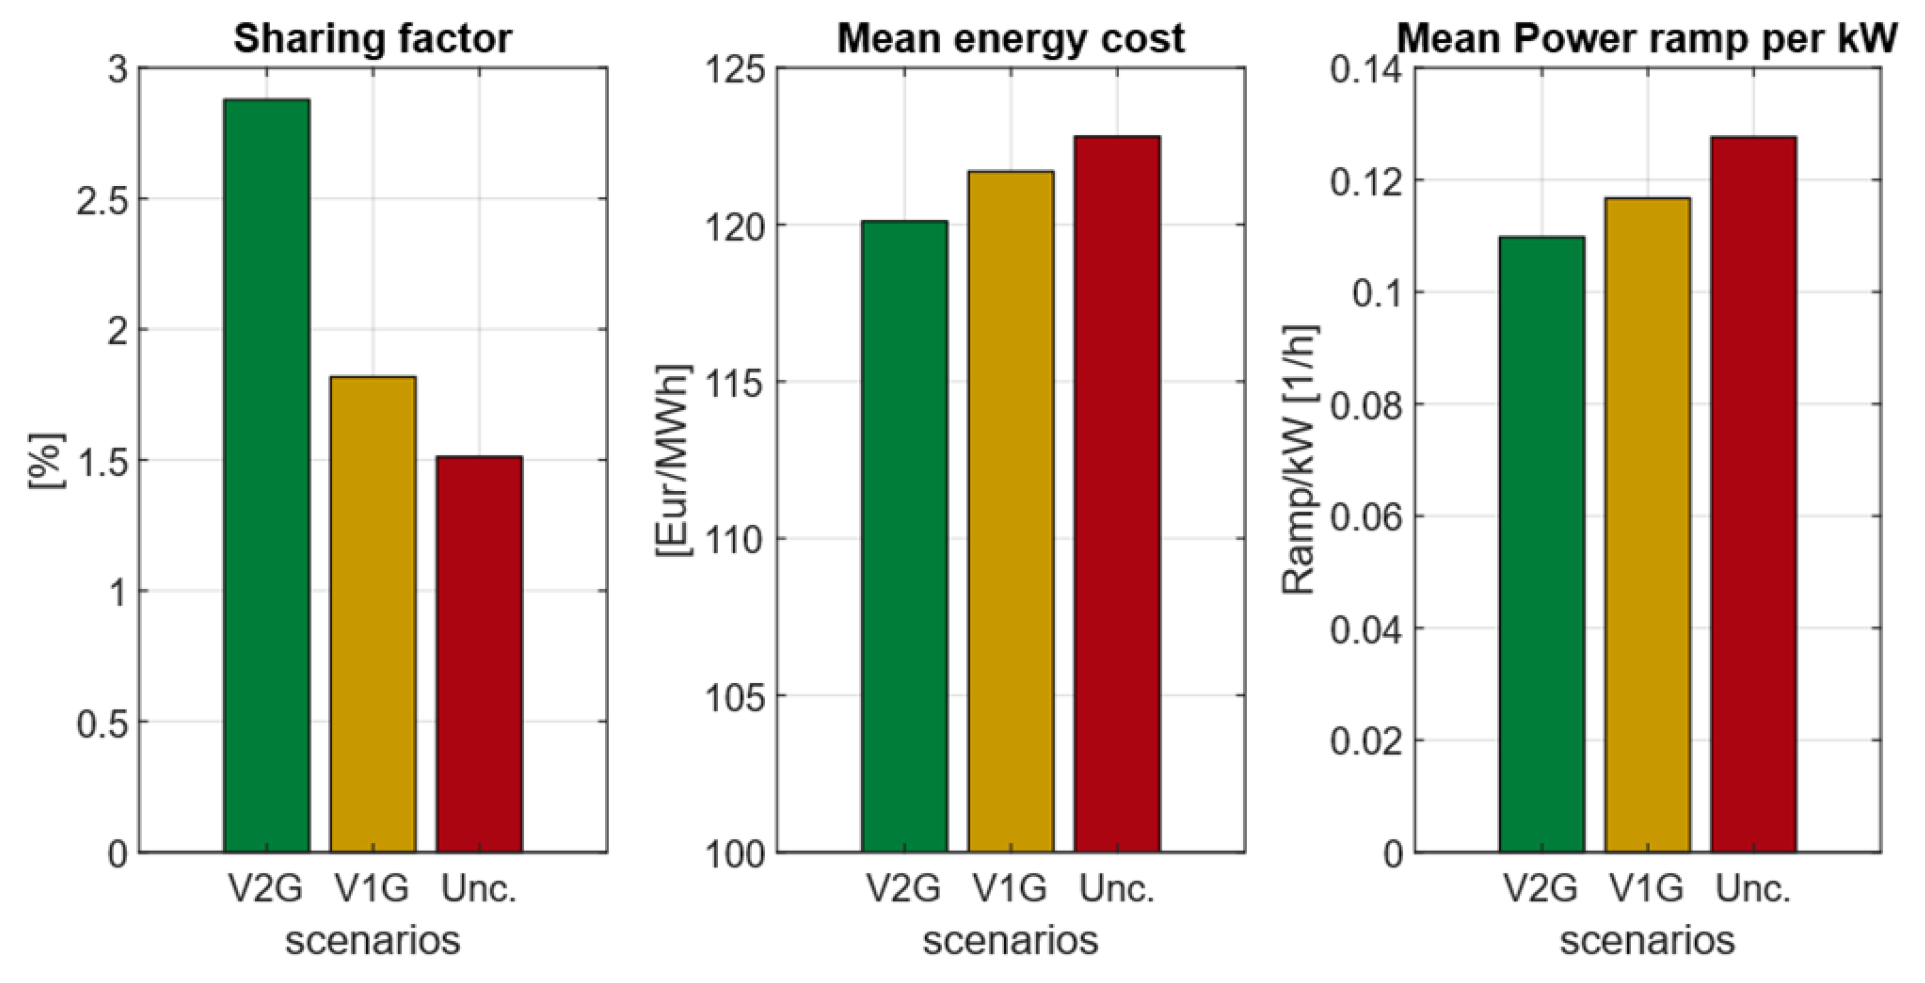
To quantify the grid impact, three KPIs are introduced and compared in Figure 13: Sharing Factor ( S f ) (see Equation (31)), Mean energy cost ( C ) comprehensive of sharing incentives (see Equation (32)), and mean power ramp ( R p ) of the REC (see Equation (33)).
S f = t 0 t f P S ( t ) d t t 0 t f P G R I D ( t ) d t
C = t 0 t f [ k P z t P G R I D t P S t k i n ( t ) ] d t t 0 t f P G R I D ( t ) d t
R p = t 0 t f d P g r i d ( t ) / d t d t t 0 t f P G R I D ( t ) d t
V2G capabilities demonstrate significant potential for coordination and cooperative energy management between the two sites, with a substantial 90% increase in the ratio of shared energy to total exchanged energy compared to the uncontrolled scenario. This enhanced sharing leads to higher incentive revenues, in addition to better alignment with the zonal price, resulting in a 2.2% reduction in the average energy cost. Finally, smart charging strategies contribute to an overall 15.5% reduction in daily power ramping across the day.

3.4.2. EV Batteries Degradation Impact

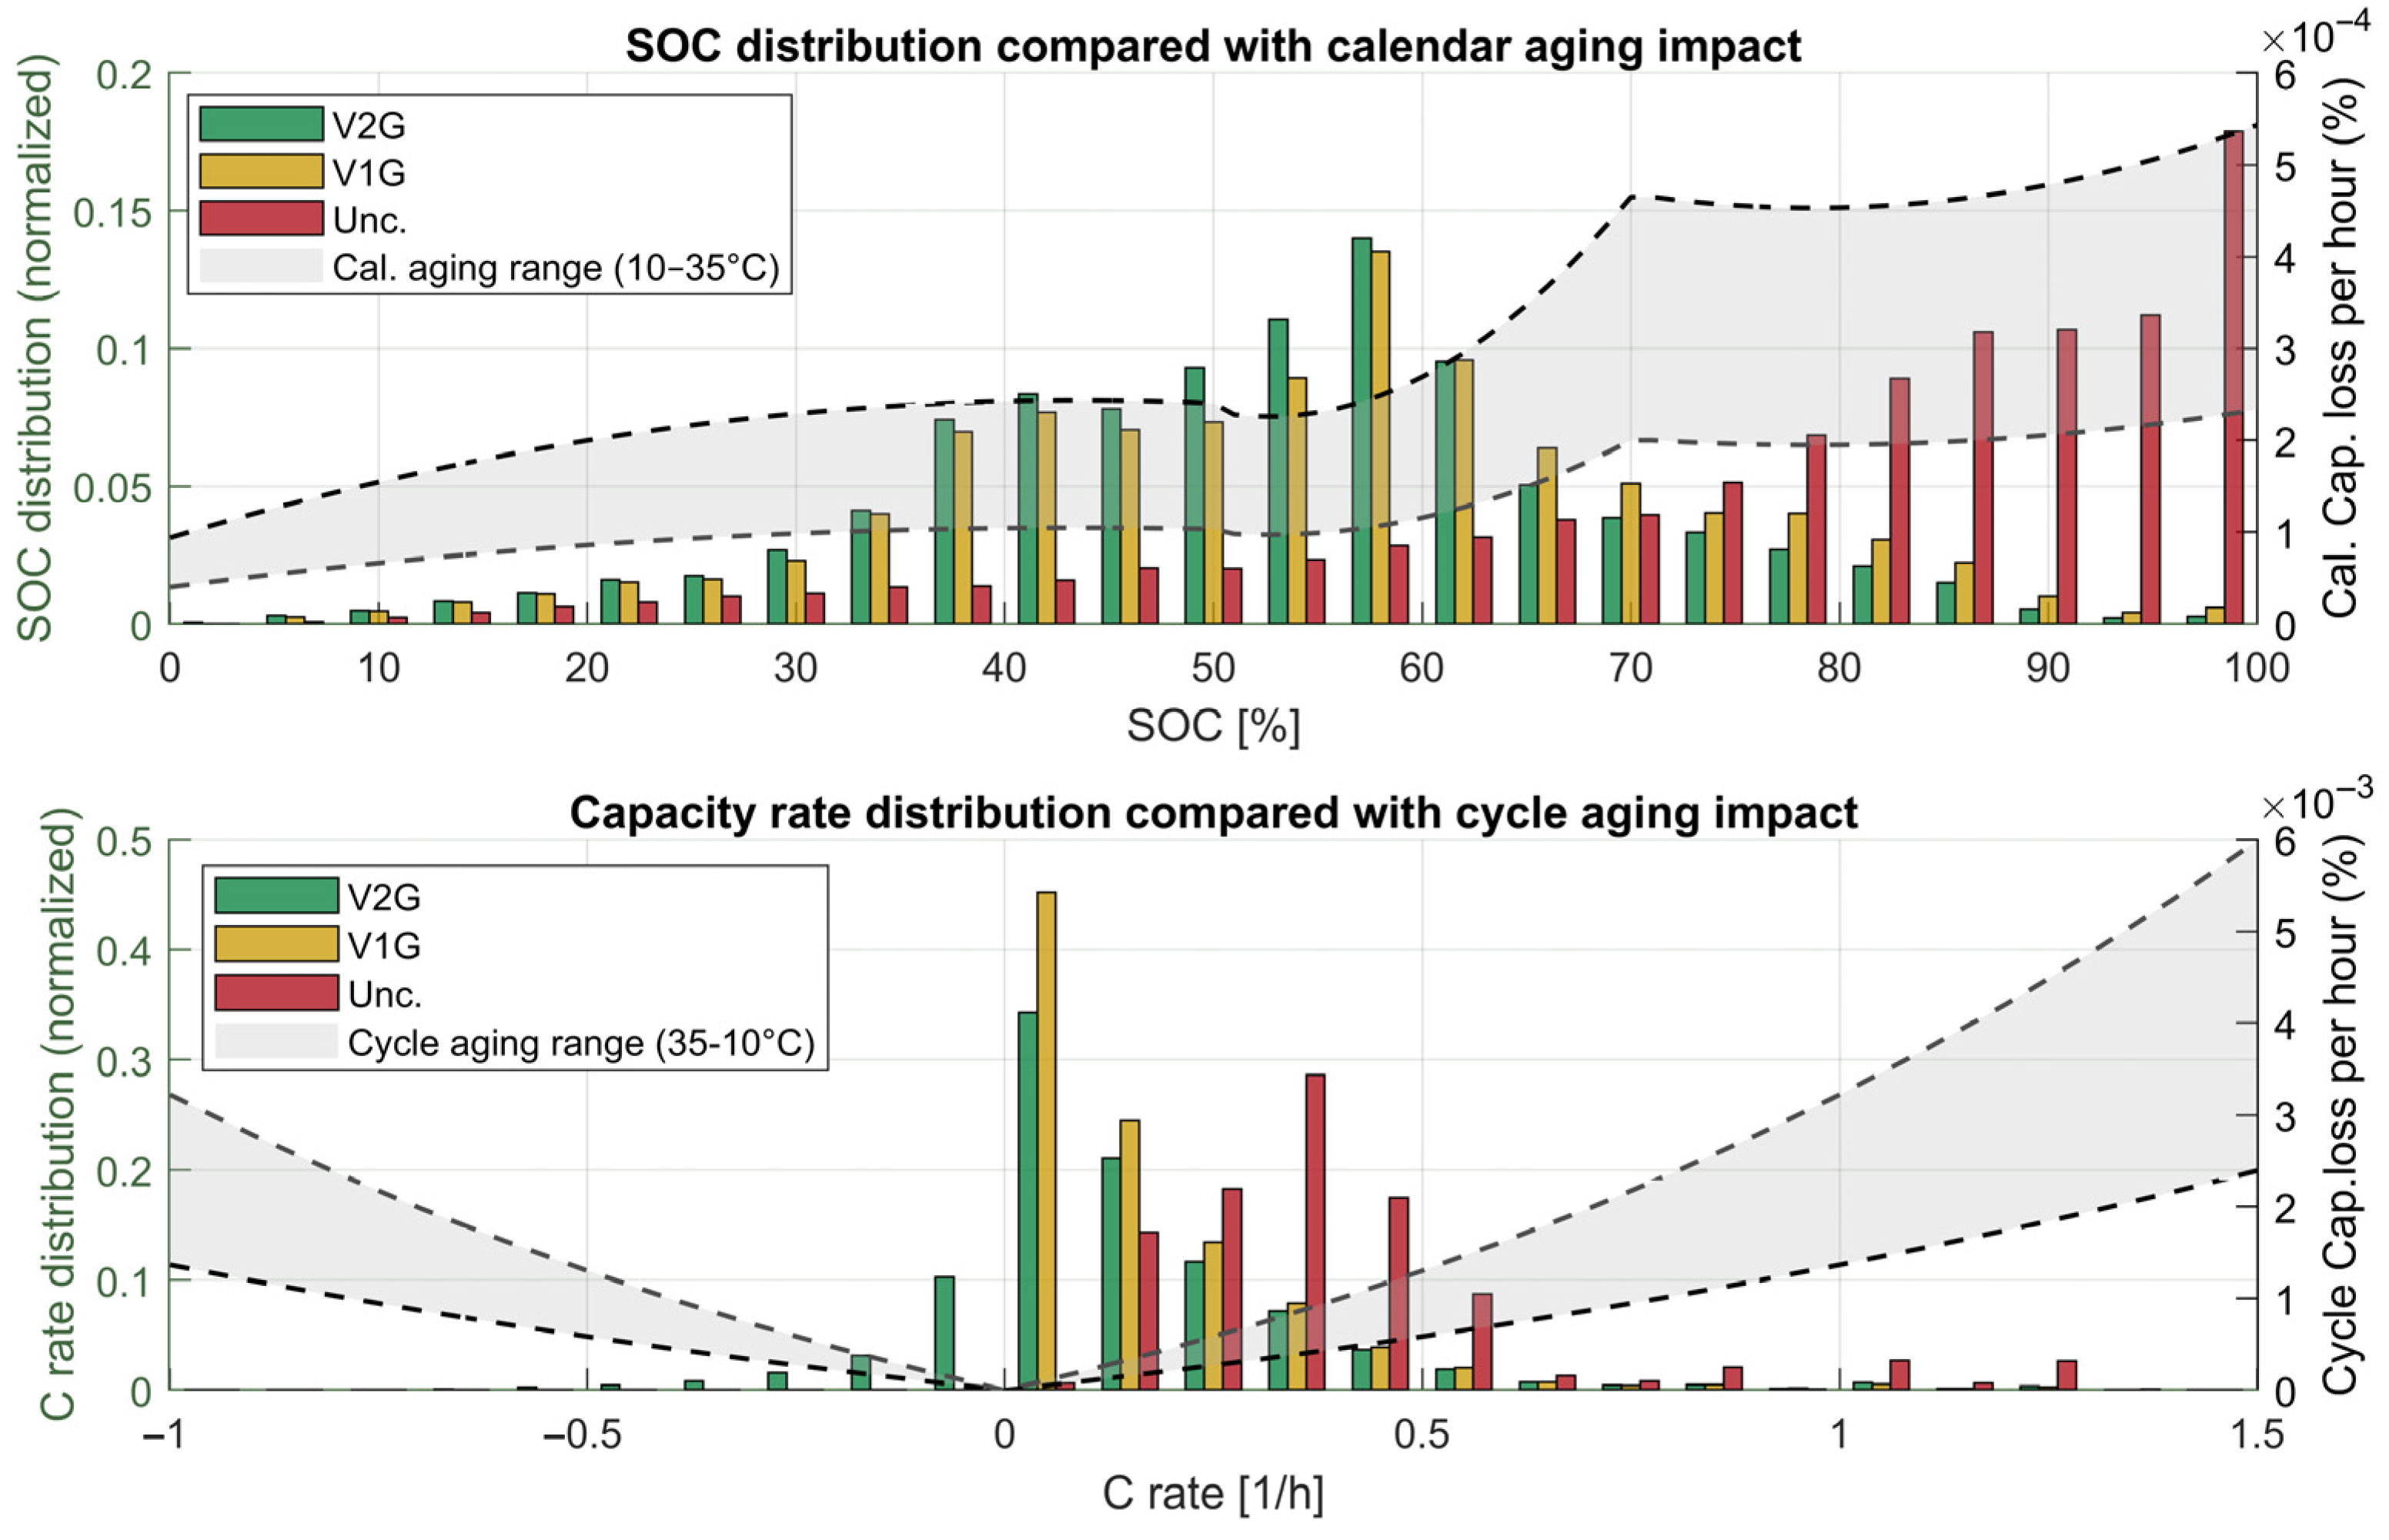
To evaluate the impact of smart charging strategies on vehicle battery degradation, the average distribution of SOC and Capacity rate over the simulation period has been analyzed. Figure 14 presents the aggregated SOC and Capacity rate distributions, along with the corresponding capacity fade estimated via the calendar and cycle aging models.
Calendar aging is assessed using the piecewise non-linear model proposed in [47], which shows a significant increase in degradation for SOC values above 0.6, while remaining relatively stable below this threshold. Cycle aging is evaluated using the model in [70], which relates capacity fade to the battery’s Capacity-rate and total energy throughput. It is important to note that both models are highly sensitive to temperature, which is not considered in this work. The associated uncertainty within the typical operating range of [10–35 °C], is represented by the shaded region in Figure 14.
Thanks to the custom aging penalty function described in Section 2.3.3, the EMS encourages maintaining EV battery SOC within the optimal [0.4–0.6] range for users, allowing V1G and V2G flexibility. This contributes to a reduced degradation impact compared to immediate full-power charging upon arrival. Furthermore, the Capacity-rate remains relatively limited throughout the process. Given that the maximum charging power of the chargers considered is relatively low compared to typical EV battery capacities, the degradation impact is modest. However, this aspect may become significantly more relevant in configurations involving DC fast chargers, which is an avenue suggested for future research.
The degradation cost associated with battery aging is calculated using the following expression:
C d e g = C B E S S D t o t 100 S O C t h D t o t = D c a l + D c y c
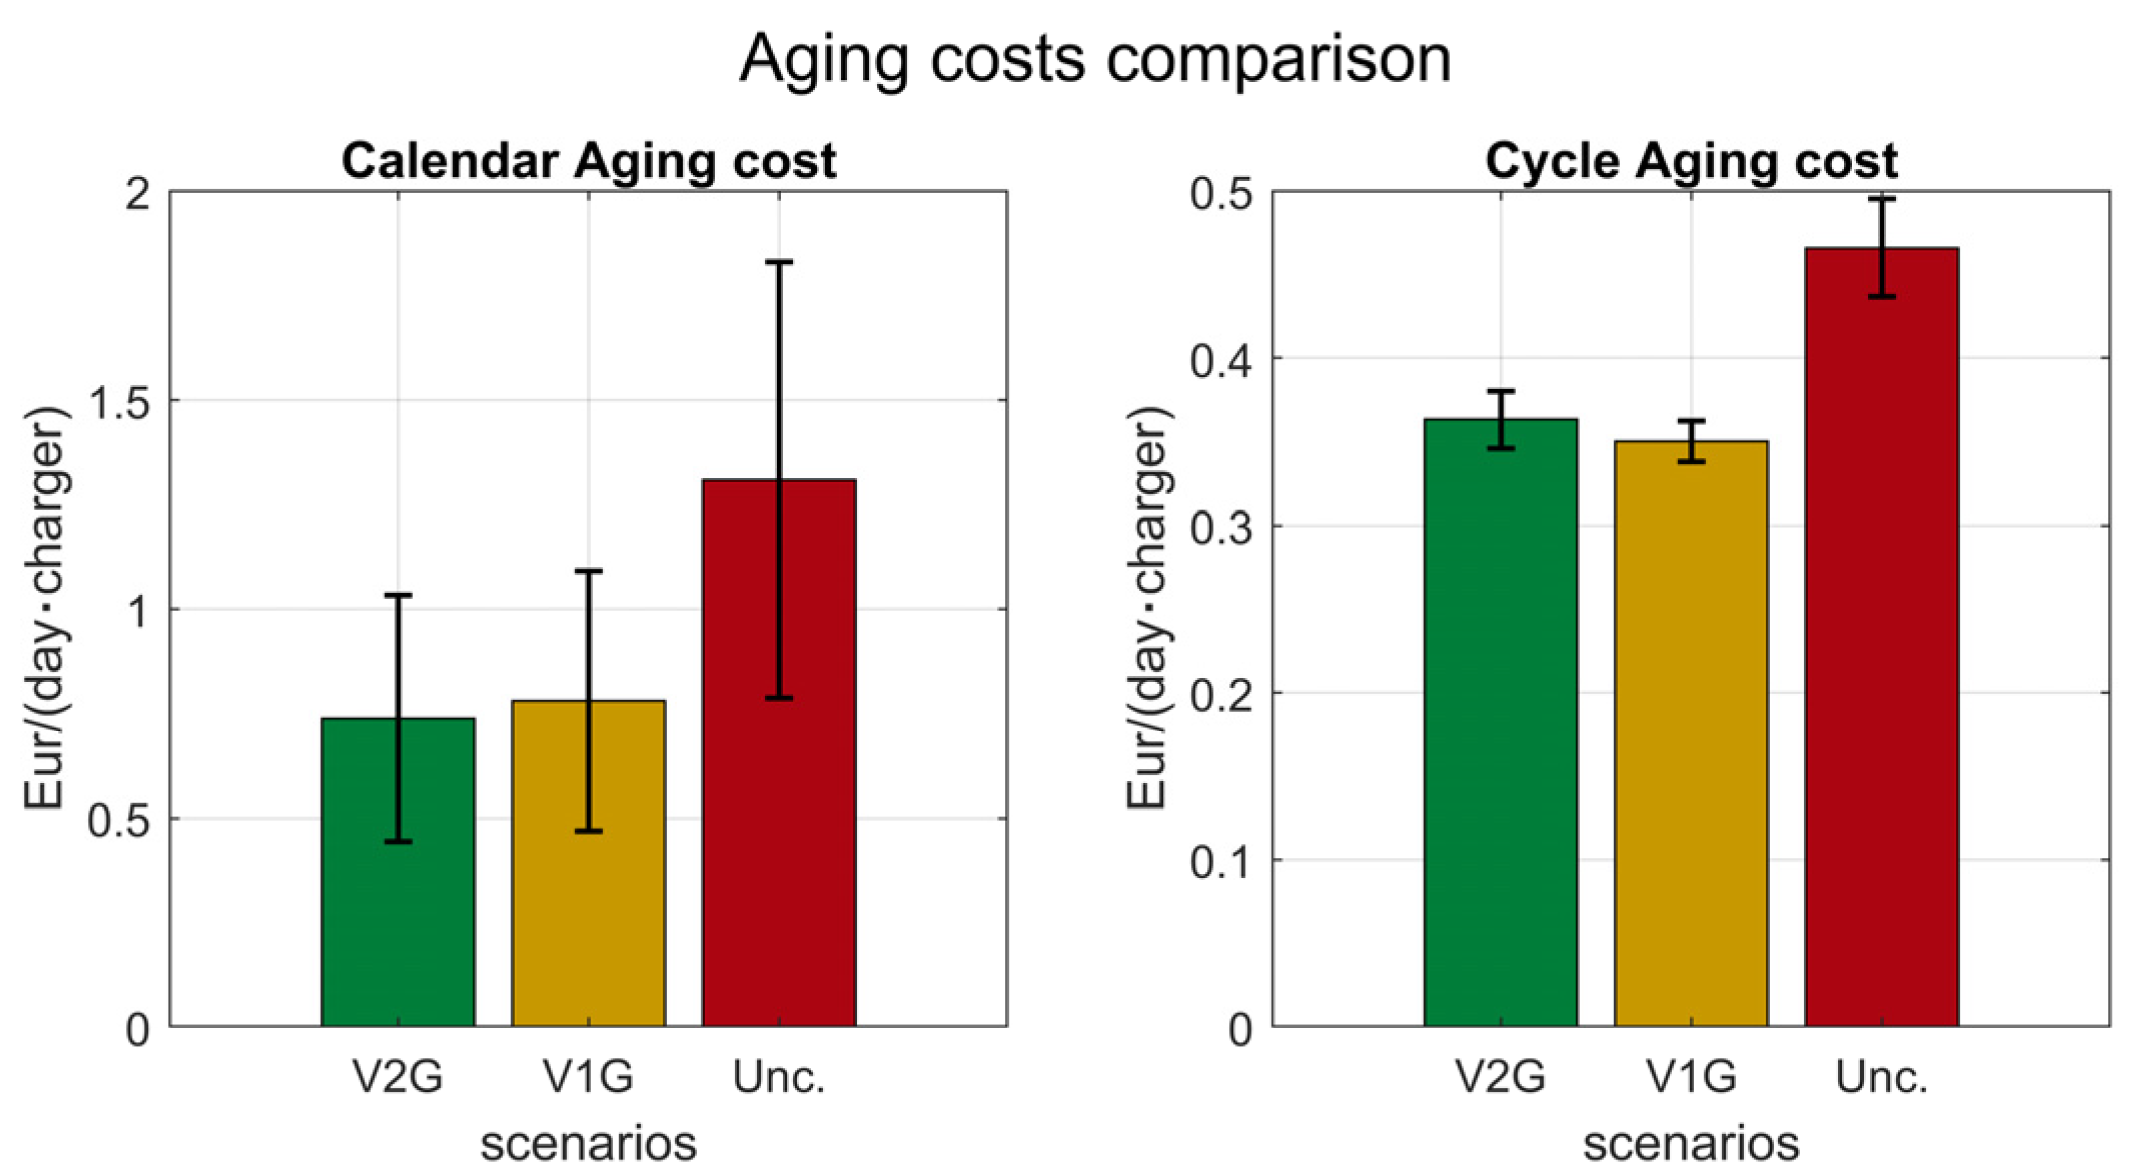
where C B E S S is the total battery replacement cost and S O C t h is the threshold below which battery replacement is typically recommended in automotive applications. For this analysis, a medium battery capacity value of 64 kWh, replacement cost of 137 €/kWh, and replacement threshold of 80% SOC were assumed. By aggregating the total degradation D t o t over all time steps and charging sessions, the mean total battery aging cost was estimated. Figure 15 shows the average degradation cost, distinguishing calendar and cycle contributions, normalized per charger and vehicle. Error bars reflect temperature-related uncertainties.
Overall, the results suggest that smart charging strategies can effectively reduce the degradation impact on EV batteries. This is primarily due to maintaining SOC within less harmful ranges during the event. A slight increase in cycle aging is observed in the V2G scenario compared to V1G, attributable to the additional energy throughput from vehicle discharging. In future real-world implementations, the degradation impact should be closely monitored, particularly under varying temperature conditions and setups involving high-power charging infrastructure.

3.5. Scalability Analysis

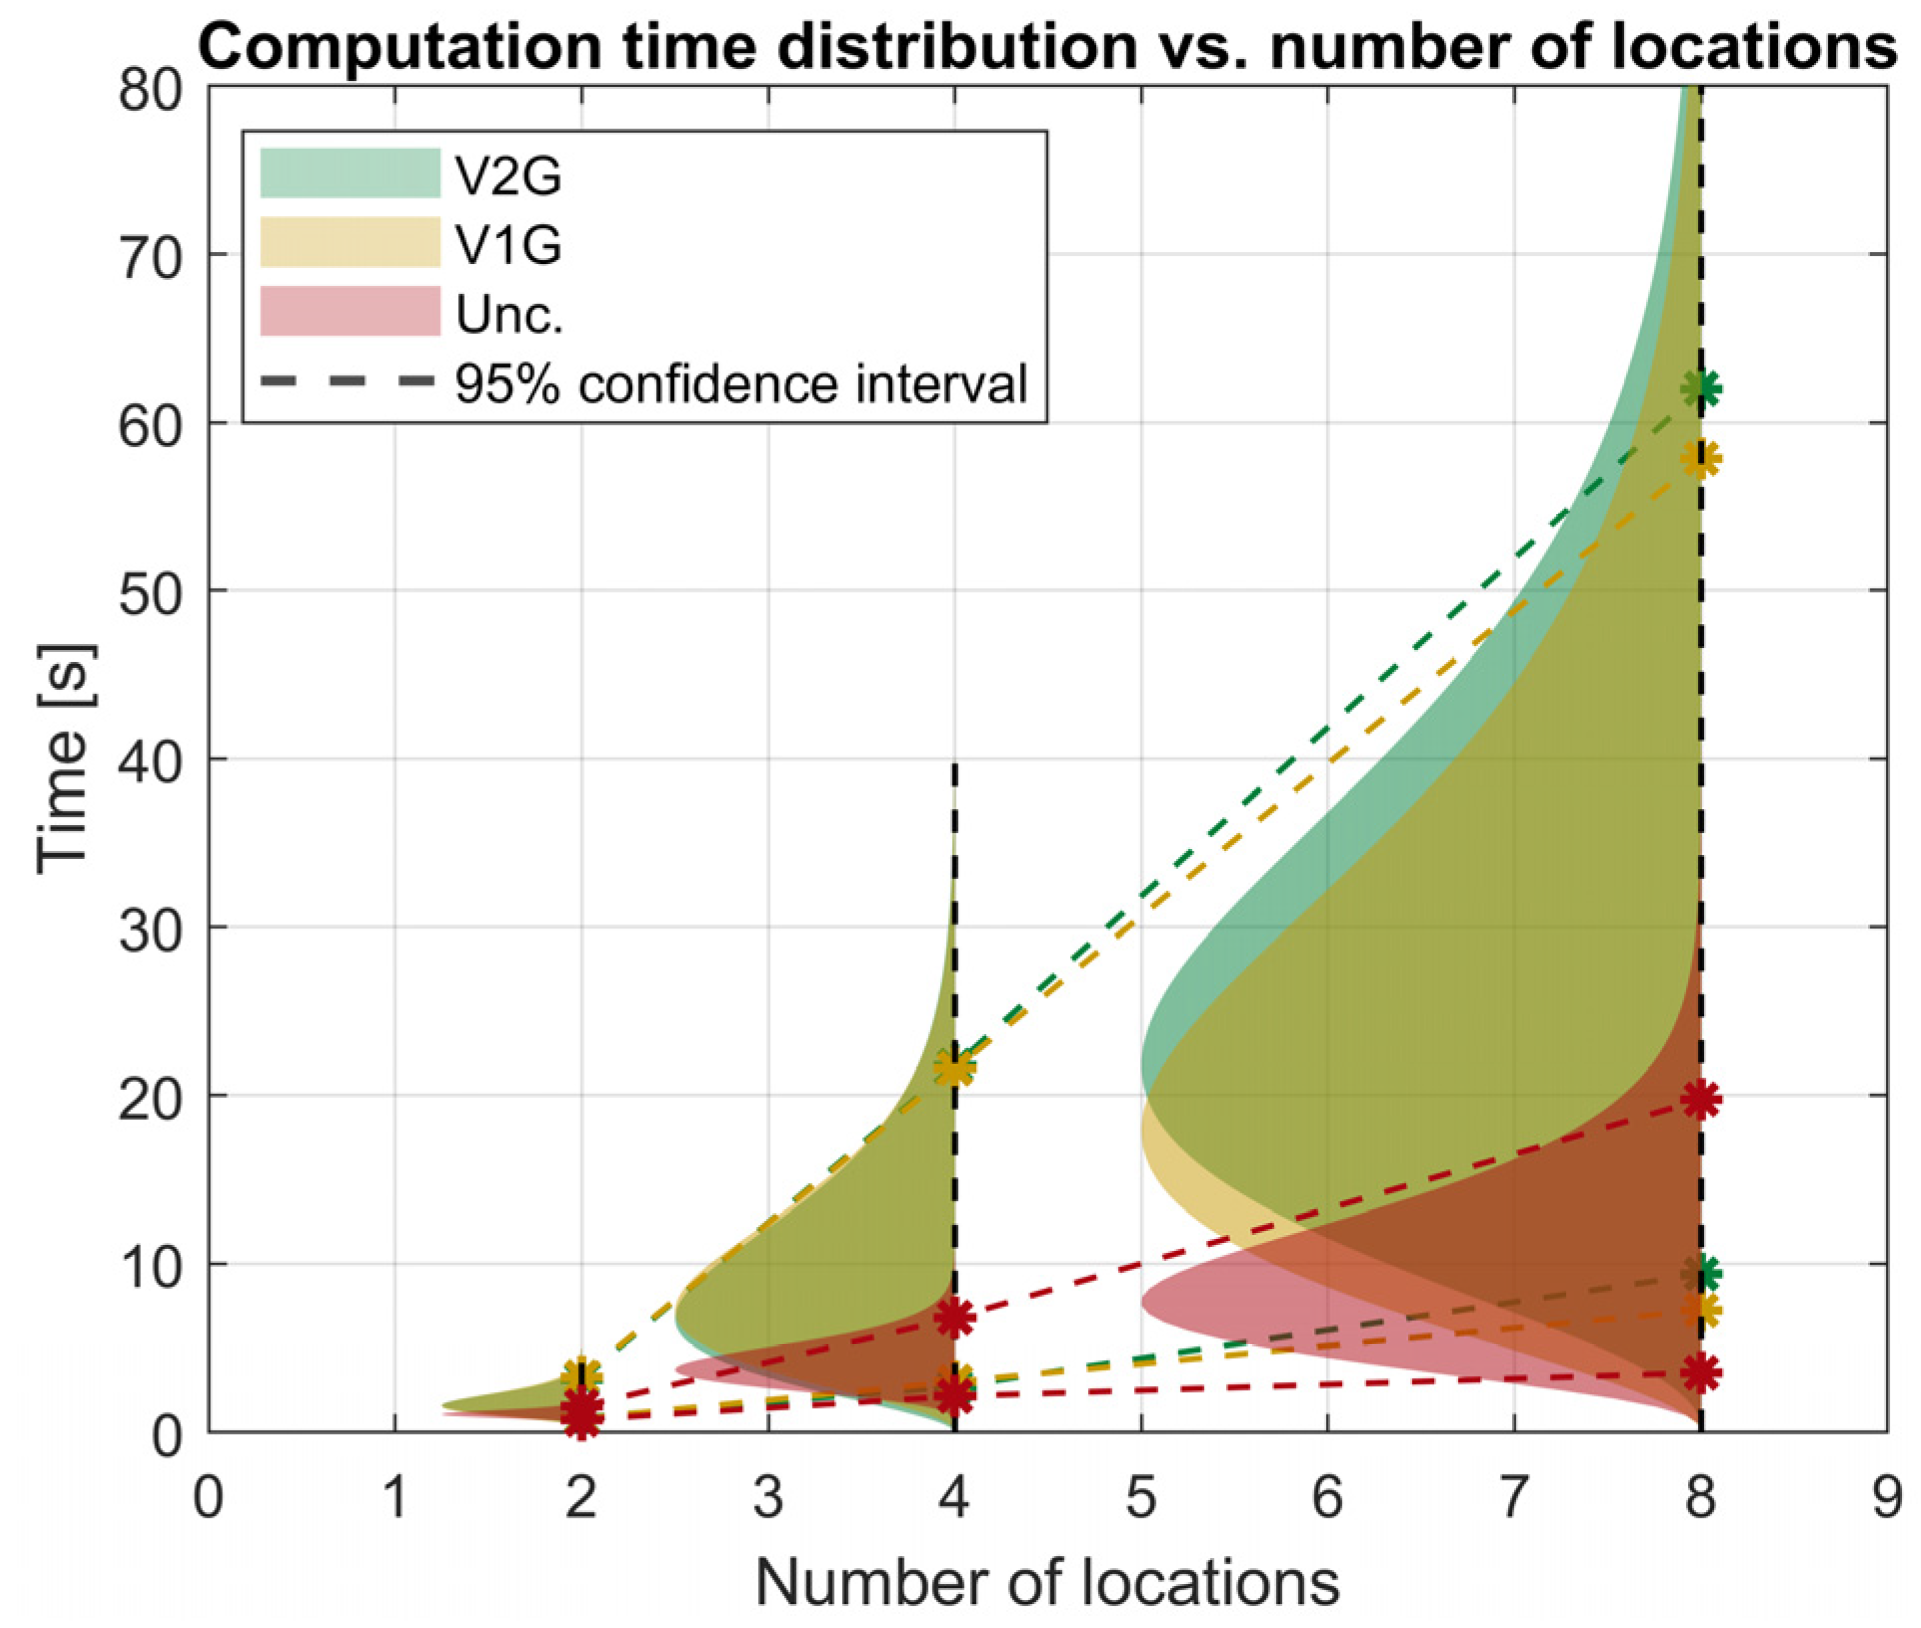
Assessing the scalability of the proposed MILP model in multi-site REC scenarios is crucial for understanding its applicability in real-world, increasingly complex systems. This section presents a detailed analysis of the computation time required to solve the optimization problem under the V2G, V1G, and Uncontrolled charging scenarios as the system size increases. Three configurations comprising two, four, and eight locations are considered by replicating the base case study layout. Table 7 summarizes the corresponding number of buildings and chargers, and Figure 16 illustrates the distribution of computation times for each scenario. Optimization processes are executed in MATLAB on a portable PC equipped with an Intel i7 processor, 32 GB RAM, and 64-bit Windows architecture.
As highlighted in Figure 16, the average and confidence interval scale approximately linearly with the number of locations, owing to the controlled use of binary variables in the optimization model.
Nonetheless, in the most complex configurations, comprising 36 chargers, solving the optimization problem for power flow scheduling begins to demand considerable computational effort for real-time application, with peaks reaching up to 100 s during fully occupied periods. To improve scalability in large-scale implementations, hierarchical decomposition techniques [26,71] and decentralized coordination models based on multi-agent systems [72,73,74] can be adopted to enhance the robustness and computational efficiency of the optimization framework.

4. Discussion

In this paper, a comprehensive and scalable model for integrating smart EV charging events into a REC has been developed. The model adopts a hybrid framework, consisting of a centralized Cloud Scheduler, shared across all internal REC sites, for the optimal scheduling of charging events, and multiple Local Controllers to handle real-time power deviations. Key data, such as EV battery capacity, current charging limits, and user preferences, are essential to fully leverage EV flexibility for grid balancing strategies while avoiding excessive battery usage.
The proposed strategy has been evaluated through a scaled case study involving two asymmetric sites. Simulation results highlight the strong potential for cooperation between the two sites in terms of energy sharing and reduced dependence on the MV grid, exploiting the potential of smart charging. V1G enables shifting charging sessions to periods forecasted to show an imbalance between PV production and building demand, while V2G additionally allows EVs to actively support building loads. These mechanisms contribute to a moderate reduction in average energy costs, due to lower power consumption during peak price periods and access to sharing incentives. Moreover, a general decrease in power ramps has been achieved by introducing a cost function proportional to the global grid power derivative. With respect to battery health, a preliminary analysis of battery degradation shows that the EMS strategy positively impacts calendar aging by maintaining the EV battery SOC within less critical levels during charging events. Finally, a scalability assessment reveals a linear relationship between the computational effort and model complexity, making the proposed framework suitable for small-to medium-sized RECs.
Future directions include the following:
  • Adoption of decentralized coordination models to improve model computation efficiency in a large-scale configuration.
  • Comprehensive evaluation of optimization performance, considering both the impact of data quality across different REC configurations and EV usage patterns, and the influence of key model parameters, such as SOC and Capacity rate thresholds.
  • Deployment on a real-world demonstrator, which implies managing the lack of data regarding vehicle and user preferences as well as real-time API communication.
  • Environmental assessment of the proposed model. By enhancing grid performance and preventing excessive battery usage, the model significantly affects local generation needs, renewable self-consumption, and battery lifespan, which are key factors for environmental sustainability. Future iterations may integrate custom cost functions that explicitly address the environmental targets.

Author Contributions

Conceptualization, N.P. and E.I.; methodology, N.P.; software, N.P.; validation, N.P., E.I. and L.B.; formal analysis, N.P. and E.I.; investigation, N.P. and E.I.; resources, N.P.; data curation, N.P.; writing—original draft preparation, N.P. and E.I.; writing—review and editing, N.P. and E.I.; visualization, N.P.; supervision, L.B. and M.D.; project administration, M.D.; funding acquisition, M.D. All authors have read and agreed to the published version of the manuscript.

Funding

This research was funded by the European Union within the project XL-Connect Horizon Europe (Grant agreement ID: 101056756, https://xlconnect.eu/).

Data Availability Statement

The raw data supporting the conclusions of this article will be made available by the authors upon request.

Acknowledgments

The authors wish to thank all colleagues—and friends—at the department, including Maurizio Guadagno, Aljon Kociu, Viola Arena, and Giulia Cortina, for their valuable support. We also thank all XL-Connect partners for their proposals and fruitful exchange of ideas.

Conflicts of Interest

The authors declare no conflicts of interest.

Abbreviations

The following abbreviations are used in this manuscript:
EVElectric Vehicle
RESRenewable Energy Source
V1GVehicle-one-Grid or Unidirectional Smart Charging
V2GVehicle-to-Grid or Bidirectional Smart Charging
RECRenewable Energy Community
REDRenewable Energy Directive
LVLow Voltage
MVMedium Voltage
PODPoint-of-Delivery
GSEGestore dei Servizi Energetici
MILPMixed-Integer Linear Programming
PVPhotovoltaic
EMSEnergy Management System
BESSBattery Energy Storage System
SOCState of Charge
ANNArtificial Neural Network
KPIKey Performance Indicator
The following nomenclatures are used in this manuscript:
P s Shared power [kW].
P L O C / P L O C + Power fed/consumed by a community’s member [kW].
T / T E V Full/(EV event) time optimization horizon.
tTime step within optimization horizon.
P E V / P B E S S Power exchanged with EV/BESS [kW].
S O C E V / S O C B E S S SOC value of EV/BESS.
P E V h i g h d i s / P B E S S h i g h d i s Power value defined below a −4 Capacity rate threshold of EV/BESS [kW].
P E V l o w d i s / P B E S S l o w d i s Power value defined within [−4:−1] Capacity rate range of EV/BESS [kW].
P E V m e d / P B E S S m e d Power value defined within [−1: 1] Capacity rate range of EV/BESS [kW].
P E V l o w c h / P B E S S l o w c h Power value defined within [1: 4] Capacity rate range of EV/BESS [kW].
P E V h i g h c h / P B E S S h i g h v h Power value defined over a 4 Capacity rate threshold of EV/BESS [kW].
S O C E V m i n / S O C B E S S m i n SOC value defined below 0.2/0.05 threshold of EV/BESS.
S O C E V l o w / S O C B E S S l o w SOC value defined within [0.2:0.4]/[0.05:0.2] range of EV/BESS.
S O C E V m e d / S O C B E S S m e d SOC value defined within [0.4:0.6]/[0.2:0.6] range of EV/BESS.
S O C E V h i g h / S O C B E S S h i g h SOC value defined within [0.6:0.8] range of EV/BESS.
S O C E V m a x / S O C B E S S m a x SOC value defined over 0.8 threshold of EV/BESS.
S O C E V / t E V i Target SOC/departure time for an EV.
C E V / C B E S S Battery available capacity for an EV/BESS [kWh].
P G R I D / P G R I D + Power fed/consumed by the REC [kW]
d P E V / d P B E S S / d P G R I D Abs. value of the time derivative of power for EV/BESS/REC [kW/h].
P P V ^ / P B ^ Forecasted PV/Building load [kW].
P c h m a x / P E V m a x Maximum charging power of the charger/EV [kW].
b G Binary variable representing power direction with MV grid substation.
C e n / k p z Energy cost function and associated coefficient (grid price) [€/h]/[€/kWh].
C i n / k i n Incentive penalty and associated coefficient (sharing incentives) [€/h]/[€/kWh].
C E V c y c / C E V c a l Cycle and calendar penalties for an EV [€/h].
C G R I D d P / k G R I D d P Power ramp penalty and associated coefficient [€/h]/[€/kWh].
f E V Priority function of an EV.
P E V m e a n Exponential weighted average of EV charging power [kW].
w E V / w B E S S / w g r i d Correction weight coefficients for EV/BESS/LV Grid.
P E V / P B E S S / P G R I D Power adjustment applied to EV/BESS/LV Grid [kW].
S f Sharing factor: ratio between LV energy shared and MV energy exchanged.
C Comprehensive mean energy cost including incentives [€/kWh].
R p Mean power ramp normalized over MV grid exchange [1/h].
D c a l / D c y c Capacity fade caused by Calendar/Cycle Aging.
C d e g Cost associated with EV battery degradation.

Appendix A

Coefficient parameters for the weighted sum of cost functions described in Section 2.3.3 are given in the following table:
Table A1. Parameter values used for the weighted sum of cost functions.
Weighted Cost ComponentParameterValue [€/MWh]
GRIDEVBESS
Energy cost k P z [0; 0.265]
Incentive cost k i n [0.08; 0.12]
Power ramp k d p 0.0250.0050.005
Cycle aging k h i g h d i s 0.15 / C E V 0.12 / C B E S S
k l o w d i s 0.09 / C E V 0.075 / C B E S S
k l o w c h 0.06 / C E V 0.075 / C B E S S
k h i g h c h 0.1 / C E V 0.12 / C B E S S
Calendar aging k m i n 0.40.5
k l o w 0.20.1
k h i g h 0.030.04
k m a x 0.090.18

References

  1. Ritchie, H.; Rosado, P.; Roser, M. Breakdown of Carbon Dioxide, Methane and Nitrous Oxide Emissions by Sector. Our World Data 2020. Available online: https://ourworldindata.org/emissions-by-sector (accessed on 15 March 2025).
  2. Ritchie, H. Sector by Sector: Where Do Global Greenhouse Gas Emissions Come From? Our World Data 2020. Available online: https://ourworldindata.org/ghg-emissions-by-sector (accessed on 15 March 2025).
  3. Trends in Electric Light-Duty Vehicles—Global EV Outlook 2023—Analysis. Available online: https://www.iea.org/reports/global-ev-outlook-2023/trends-in-electric-light-duty-vehicles (accessed on 15 March 2025).
  4. Jones, C.B.; Lave, M.; Vining, W.; Garcia, B.M. Uncontrolled Electric Vehicle Charging Impacts on Distribution Electric Power Systems with Primarily Residential, Commercial or Industrial Loads. Energies 2021, 14, 1688. [Google Scholar] [CrossRef]
  5. Li, Y.; Jenn, A. Impact of Electric Vehicle Charging Demand on Power Distribution Grid Congestion. Proc. Natl. Acad. Sci. USA 2024, 121, e2317599121. [Google Scholar] [CrossRef] [PubMed]
  6. Kazemtarghi, A.; Mallik, A.; Chen, Y. Dynamic Pricing Strategy for Electric Vehicle Charging Stations to Distribute the Congestion and Maximize the Revenue. Int. J. Electr. Power Energy Syst. 2024, 158, 109946. [Google Scholar] [CrossRef]
  7. Ahmad, A.; Meyboom, J.; Bauer, P.; Qin, Z. Techno-Economic Analysis of Energy Storage Systems Integrated with Ultra-Fast Charging Stations: A Dutch Case Study. eTransportation 2025, 24, 100411. [Google Scholar] [CrossRef]
  8. González-Garrido, A.; González-Pérez, M.; Asensio, F.J.; Cortes-Borray, A.F.; Santos-Mugica, M.; Vicente-Figueirido, I. Hierarchical Control for Collaborative Electric Vehicle Charging to Alleviate Network Congestion and Enhance EV Hosting in Constrained Distribution Networks. Renew. Energy 2024, 230, 120823. [Google Scholar] [CrossRef]
  9. Poyyamani Sunddararaj, S.; Rangarajan, S.S.; Nallusamy, S.; Collins, E.R.; Senjyu, T. A Brief Survey on Important Interconnection Standards for Photovoltaic Systems and Electric Vehicles. World Electr. Veh. J. 2021, 12, 117. [Google Scholar] [CrossRef]
  10. Kempton, W.; Tomić, J. Vehicle-to-Grid Power Fundamentals: Calculating Capacity and Net Revenue. J. Power Sources 2005, 144, 268–279. [Google Scholar] [CrossRef]
  11. Zhang, C.; Greenblatt, J.B.; MacDougall, P.; Saxena, S.; Jayam Prabhakar, A. Quantifying the Benefits of Electric Vehicles on the Future Electricity Grid in the Midwestern United States. Appl. Energy 2020, 270, 115174. [Google Scholar] [CrossRef]
  12. Rashgi Shishvan, N.; Qin, J.; Guo, Z. Electric Vehicles’ Potential for Smoothing Daily Load Profile Considering Mobility Needs and Solar Output. Sustain. Energy Grids Netw. 2025, 43, 101761. [Google Scholar] [CrossRef]
  13. Zhou, C.; Qi, S.; Zhang, J.; Tang, S. Potential Co-Benefit Effect Analysis of Orderly Charging and Discharging of Electric Vehicles in China. Energy 2021, 226, 120352. [Google Scholar] [CrossRef]
  14. Amertet, S.; Gebresenbet, G. Hybridized Renewable Energy for Smart Vehicle-to-Grid (V2G) Systems. Energy Explor. Exploit. 2024, 42, 292–308. [Google Scholar] [CrossRef]
  15. Greenhouse Gas Emissions from Transport in Europe. Available online: https://www.eea.europa.eu/en/analysis/indicators/greenhouse-gas-emissions-from-transport (accessed on 15 March 2025).
  16. Ahmed, S.; Ali, A.; Ciocia, A.; D’Angola, A. Technological Elements behind the Renewable Energy Community: Current Status, Existing Gap, Necessity, and Future Perspective—Overview. Energies 2024, 17, 3100. [Google Scholar] [CrossRef]
  17. Ahmed, S.; Ali, A.; D’Angola, A. A Review of Renewable Energy Communities: Concepts, Scope, Progress, Challenges, and Recommendations. Sustainability 2024, 16, 1749. [Google Scholar] [CrossRef]
  18. European Commission. Directive (EU) 2018/2001 of the European Parliament and of the Council of 11 December 2018 on the Promotion of the Use of Energy from Renewable Sources (Recast) (Text with EEA Relevance); Official Journal of the European Union: Luxembourg, 2018; Volume 328. [Google Scholar]
  19. Gianaroli, F.; Preziosi, M.; Ricci, M.; Sdringola, P.; Ancona, M.A.; Melino, F. Exploring the Academic Landscape of Energy Communities in Europe: A Systematic Literature Review. J. Clean. Prod. 2024, 451, 141932. [Google Scholar] [CrossRef]
  20. Zatti, M.; Moncecchi, M.; Gabba, M.; Chiesa, A.; Bovera, F.; Merlo, M. Energy Communities Design Optimization in the Italian Framework. Appl. Sci. 2021, 11, 5218. [Google Scholar] [CrossRef]
  21. Comunità Energetiche Rinnovabili. Available online: https://www.gse.it/servizi-per-te/autoconsumo/gruppi-di-autoconsumatori-e-comunita-di-energia-rinnovabile/comunit%C3%A0-energetiche-rinnovabili (accessed on 19 March 2025).
  22. Taromboli, G.; Campagna, L.; Bergonzi, C.; Bovera, F.; Trovato, V.; Merlo, M.; Rancilio, G. Renewable Energy Communities: Frameworks and Implementation of Regulatory, Technical, and Social Aspects Across EU Member States. Sustainability 2025, 17, 4195. [Google Scholar] [CrossRef]
  23. Velkovski, B.; Gjorgievski, V.Z.; Markovski, B.; Cundeva, S.; Markovska, N. A Framework for Shared EV Charging in Residential Renewable Energy Communities. Renew. Energy 2024, 231, 120897. [Google Scholar] [CrossRef]
  24. Moncecchi, M.; Meneghello, S.; Merlo, M. A Game Theoretic Approach for Energy Sharing in the Italian Renewable Energy Communities. Appl. Sci. 2020, 10, 8166. [Google Scholar] [CrossRef]
  25. Fernandez, E.; Hossain, M.J.; Nawazish Ali, S.M.; Sharma, V. An Efficient P2P Energy Trading Platform Based on Evolutionary Games for Prosumers in a Community. Sustain. Energy Grids Netw. 2023, 34, 101074. [Google Scholar] [CrossRef]
  26. Zanvettor, G.G.; Casini, M.; Giannitrapani, A.; Paoletti, S.; Vicino, A. Optimal Management of Energy Communities Hosting a Fleet of Electric Vehicles. Energies 2022, 15, 8697. [Google Scholar] [CrossRef]
  27. Martins, J.C.; Pinheiro, M.D. Energy Communities and Electric Mobility as a Win–Win Solution in Built Environment. Energies 2024, 17, 3011. [Google Scholar] [CrossRef]
  28. Barone, G.; Brusco, G.; Menniti, D.; Pinnarelli, A.; Polizzi, G.; Sorrentino, N.; Vizza, P.; Burgio, A. How Smart Metering and Smart Charging May Help a Local Energy Community in Collective Self-Consumption in Presence of Electric Vehicles. Energies 2020, 13, 4163. [Google Scholar] [CrossRef]
  29. Eckhoff, S.; Wagner, H.; Werth, O.; Gerlach, J.; Breitner, M.H.; Engel, B. Electric Mobility Integration in Energy Communities: Trending Topics and Future Research Directions. In Proceedings of the 5th E-Mobility Power System Integration Symposium (EMOB 2021), Berlin, Germany, 27 September 2021; Volume 2021, pp. 196–204. [Google Scholar]
  30. Nazari, S.; Borrelli, F.; Stefanopoulou, A. Electric Vehicles for Smart Buildings: A Survey on Applications, Energy Management Methods, and Battery Degradation. Proc. IEEE 2021, 109, 1128–1144. [Google Scholar] [CrossRef]
  31. Alirezaei, M.; Noori, M.; Tatari, O. Getting to Net Zero Energy Building: Investigating the Role of Vehicle to Home Technology. Energy Build. 2016, 130, 465–476. [Google Scholar] [CrossRef]
  32. Zhou, Y.; Cao, S. Energy Flexibility Investigation of Advanced Grid-Responsive Energy Control Strategies with the Static Battery and Electric Vehicles: A Case Study of a High-Rise Office Building in Hong Kong. Energy Convers. Manag. 2019, 199, 111888. [Google Scholar] [CrossRef]
  33. Huo, Y.; Bouffard, F.; Joós, G. Decision Tree-Based Optimization for Flexibility Management for Sustainable Energy Microgrids. Appl. Energy 2021, 290, 116772. [Google Scholar] [CrossRef]
  34. Ruddick, J.; Ramirez Camargo, L.; Putratama, M.A.; Messagie, M.; Coosemans, T. TreeC: A Method to Generate Interpretable Energy Management Systems Using a Metaheuristic Algorithm. Knowl.-Based Syst. 2025, 309, 112756. [Google Scholar] [CrossRef]
  35. van der Kam, M.; van Sark, W. Smart Charging of Electric Vehicles with Photovoltaic Power and Vehicle-to-Grid Technology in a Microgrid; A Case Study. Appl. Energy 2015, 152, 20–30. [Google Scholar] [CrossRef]
  36. Nouri, A.; Lachheb, A.; El Amraoui, L. Optimizing Efficiency of Vehicle-to-Grid System with Intelligent Management and ANN-PSO Algorithm for Battery Electric Vehicles. Electr. Power Syst. Res. 2024, 226, 109936. [Google Scholar] [CrossRef]
  37. Habib, H.U.R.; Subramaniam, U.; Waqar, A.; Farhan, B.S.; Kotb, K.M.; Wang, S. Energy Cost Optimization of Hybrid Renewables Based V2G Microgrid Considering Multi Objective Function by Using Artificial Bee Colony Optimization. IEEE Access 2020, 8, 62076–62093. [Google Scholar] [CrossRef]
  38. Shobana, S.; Praghash, K.; Ramya, G.; Rajakumar, B.R.; Binu, D. Integrating Renewable Energy in Electric V2G: Improved Optimization Assisting Dispatch Model. Int. J. Energy Res. 2022, 46, 7917–7934. [Google Scholar] [CrossRef]
  39. Eltamaly, A.M. Optimal Dispatch Strategy for Electric Vehicles in V2G Applications. Smart Cities 2023, 6, 3161–3191. [Google Scholar] [CrossRef]
  40. Mulla, A.; Jadhav, H.T. Optimal Scheduling of Vehicle-to-Grid Power Exchange Using Particle Swarm Optimization Technique. Int. J. Comput. Appl. 2022, 44, 687–704. [Google Scholar] [CrossRef]
  41. Shaheen, H.I.; Rashed, G.I.; Yang, B.; Yang, J. Optimal Electric Vehicle Charging and Discharging Scheduling Using Metaheuristic Algorithms: V2G Approach for Cost Reduction and Grid Support. J. Energy Storage 2024, 90, 111816. [Google Scholar] [CrossRef]
  42. Fahad, M.; Beenish, H. Efficient V2G Model on Smart Grid Power Systems Using Genetic Algorithm. In Proceedings of the 2019 1st Global Power, Energy and Communication Conference (GPECOM), Nevsehir, Turkey, 12–15 June 2019; pp. 445–450. [Google Scholar]
  43. Huang, Z.; Fang, B.; Deng, J. Multi-Objective Optimization Strategy for Distribution Network Considering V2G-Enabled Electric Vehicles in Building Integrated Energy System. Prot. Control Mod. Power Syst. 2020, 5, 7. [Google Scholar] [CrossRef]
  44. Ahsan, S.M.; Khan, H.A.; Sohaib, S.; Hashmi, A.M. Optimized Power Dispatch for Smart Building and Electric Vehicles with V2V, V2B and V2G Operations. Energies 2023, 16, 4884. [Google Scholar] [CrossRef]
  45. Mirhoseini, P.; Ghaffarzadeh, N. Economic Battery Sizing and Power Dispatch in a Grid-Connected Charging Station Using Convex Method. J. Energy Storage 2020, 31, 101651. [Google Scholar] [CrossRef]
  46. Saber, H.; Ranjbar, H.; Fattaheian-Dehkordi, S.; Moeini-Aghtaie, M.; Ehsan, M.; Shahidehpour, M. Transactive Energy Management of V2G-Capable Electric Vehicles in Residential Buildings: An MILP Approach. IEEE Trans. Sustain. Energy 2022, 13, 1734–1743. [Google Scholar] [CrossRef]
  47. Khezri, R.; Steen, D.; Wikner, E.; Tuan, L.A. Optimal V2G Scheduling of an EV With Calendar and Cycle Aging of Battery: An MILP Approach. IEEE Trans. Transp. Electrif. 2024, 10, 10497–10507. [Google Scholar] [CrossRef]
  48. Paterakis, N.G.; Erdinç, O.; Bakirtzis, A.G.; Catalão, J.P.S. Optimal Household Appliances Scheduling Under Day-Ahead Pricing and Load-Shaping Demand Response Strategies. IEEE Trans. Ind. Inform. 2015, 11, 1509–1519. [Google Scholar] [CrossRef]
  49. Zhang, J.; Che, L.; Wang, L.; Madawala, U.K. Game-Theory Based V2G Coordination Strategy for Providing Ramping Flexibility in Power Systems. Energies 2020, 13, 5008. [Google Scholar] [CrossRef]
  50. Wan, Y.; Qin, J.; Li, F.; Yu, X.; Kang, Y. Game Theoretic-Based Distributed Charging Strategy for PEVs in a Smart Charging Station. IEEE Trans. Smart Grid 2021, 12, 538–547. [Google Scholar] [CrossRef]
  51. Aksan, F.; Suresh, V.; Janik, P. Optimal Capacity and Charging Scheduling of Battery Storage through Forecasting of Photovoltaic Power Production and Electric Vehicle Charging Demand with Deep Learning Models. Energies 2024, 17, 2718. [Google Scholar] [CrossRef]
  52. Luo, X.J.; Oyedele, L.O.; Ajayi, A.O.; Akinade, O.O.; Owolabi, H.A.; Ahmed, A. Feature Extraction and Genetic Algorithm Enhanced Adaptive Deep Neural Network for Energy Consumption Prediction in Buildings. Renew. Sustain. Energy Rev. 2020, 131, 109980. [Google Scholar] [CrossRef]
  53. Kim, T.-Y.; Cho, S.-B. Predicting Residential Energy Consumption Using CNN-LSTM Neural Networks. Energy 2019, 182, 72–81. [Google Scholar] [CrossRef]
  54. Kreft, M.; Brudermueller, T.; Fleisch, E.; Staake, T. Predictability of Electric Vehicle Charging: Explaining Extensive User Behavior-Specific Heterogeneity. Appl. Energy 2024, 370, 123544. [Google Scholar] [CrossRef]
  55. Iqbal, M.N.; Kütt, L.; Lehtonen, M.; Millar, R.J.; Püvi, V.; Rassõlkin, A.; Demidova, G.L. Travel Activity Based Stochastic Modelling of Load and Charging State of Electric Vehicles. Sustainability 2021, 13, 1550. [Google Scholar] [CrossRef]
  56. Liu, S.; Tayarani, M.; Gao, O. An Activity-Based Travel and Charging Behavior Model for Simulating Battery Electric Vehicle Charging Demand. Energy 2022, 258, 124938. [Google Scholar] [CrossRef]
  57. Li, T.; Tao, S.; He, K.; Lu, M.; Xie, B.; Yang, B.; Sun, Y. V2G Multi-Objective Dispatching Optimization Strategy Based on User Behavior Model. Front. Energy Res. 2021, 9, 739527. [Google Scholar] [CrossRef]
  58. XL-CONNECT|On Demand Multi-Directional Charging Solutions for Electric Vehicles. Available online: https://xlconnect.eu/ (accessed on 26 June 2025).
  59. Kohl, K. Homepage [Forecast.Solar]. Available online: https://forecast.solar/ (accessed on 28 May 2025).
  60. Transparency Platform. Available online: https://newtransparency.entsoe.eu/ (accessed on 28 May 2025).
  61. Innocenti, E.; Berzi, L.; Kociu, A.; Pugi, L.; Delogu, M. Planning of Smart Charging Infrastructure for Electric Vehicles: An Italian Case Study. In Proceedings of the 3rd International Symposium on Industrial Engineering and Automation ISIEA 2024, Bolzano, Italy, 19–21 June 2024; ISBN 978-3-031-70465-9. [Google Scholar]
  62. De Angelis, F.; Boaro, M.; Fuselli, D.; Squartini, S.; Piazza, F.; Wei, Q. Optimal Home Energy Management Under Dynamic Electrical and Thermal Constraints. IEEE Trans. Ind. Inform. 2013, 9, 1518–1527. [Google Scholar] [CrossRef]
  63. Day Ahead Market. Available online: https://www.etpa.nl/knowledge-base/markets/day-ahead-market (accessed on 20 May 2025).
  64. Eicke, A.; Ruhnau, O.; Hirth, L. Electricity Balancing as a Market Equilibrium: An Instrument-Based Estimation of Supply and Demand for Imbalance Energy. Energy Econ. 2021, 102, 105455. [Google Scholar] [CrossRef]
  65. Keil, P.; Jossen, A. Calendar and Cycle Aging of Commercial NCA Lithium-Ion Cells. Meet. Abstr. 2016, MA2016-02, 914. [Google Scholar] [CrossRef]
  66. Keil, P.; Schuster, S.F.; Wilhelm, J.; Travi, J.; Hauser, A.; Karl, R.C.; Jossen, A. Calendar Aging of Lithium-Ion Batteries. J. Electrochem. Soc. 2016, 163, A1872. [Google Scholar] [CrossRef]
  67. Vagropoulos, S.I.; Bakirtzis, A.G. Optimal Bidding Strategy for Electric Vehicle Aggregators in Electricity Markets. IEEE Trans. Power Syst. 2013, 28, 4031–4041. [Google Scholar] [CrossRef]
  68. Mixed-Integer Linear Programming (MILP) Algorithms—MATLAB & Simulink. Available online: https://it.mathworks.com/help/optim/ug/mixed-integer-linear-programming-algorithms.html (accessed on 22 May 2025).
  69. Shoja, S. On Complexity Certification of Branch-and-Bound Methods for MILP and MIQP with Applications to Hybrid MPC. Licentiate’s Thesis, Linkoping University Electronic Press, Linkoping, Sweden, 2023. [Google Scholar]
  70. Wang, J.; Purewal, J.; Liu, P.; Hicks-Garner, J.; Soukazian, S.; Sherman, E.; Sorenson, A.; Vu, L.; Tataria, H.; Verbrugge, M.W. Degradation of Lithium Ion Batteries Employing Graphite Negatives and Nickel–Cobalt–Manganese Oxide + Spinel Manganese Oxide Positives: Part 1, Aging Mechanisms and Life Estimation. J. Power Sources 2014, 269, 937–948. [Google Scholar] [CrossRef]
  71. Huang, Z.; Ma, P.; Wang, M.; Fang, B.; Zhang, M. A Hierarchical Strategy for Multi-Objective Optimization of Distribution Network Considering DGs and V2G-Enabled EVs Integration. Front. Energy Res. 2022, 10, 869844. [Google Scholar] [CrossRef]
  72. Najafi, A.; Pourakbari-Kasmaei, M.; Jasinski, M.; Lehtonen, M.; Leonowicz, Z. A Hybrid Decentralized Stochastic-Robust Model for Optimal Coordination of Electric Vehicle Aggregator and Energy Hub Entities. Appl. Energy 2021, 304, 117708. [Google Scholar] [CrossRef]
  73. Gümrükcü, E.; Klemets, J.R.A.; Suul, J.A.; Ponci, F.; Monti, A. Decentralized Energy Management Concept for Urban Charging Hubs With Multiple V2G Aggregators. IEEE Trans. Transp. Electrif. 2023, 9, 2367–2381. [Google Scholar] [CrossRef]
  74. Mansour-Saatloo, A.; Pezhmani, Y.; Mirzaei, M.A.; Mohammadi-Ivatloo, B.; Zare, K.; Marzband, M.; Anvari-Moghaddam, A. Robust Decentralized Optimization of Multi-Microgrids Integrated with Power-to-X Technologies. Appl. Energy 2021, 304, 117635. [Google Scholar] [CrossRef]
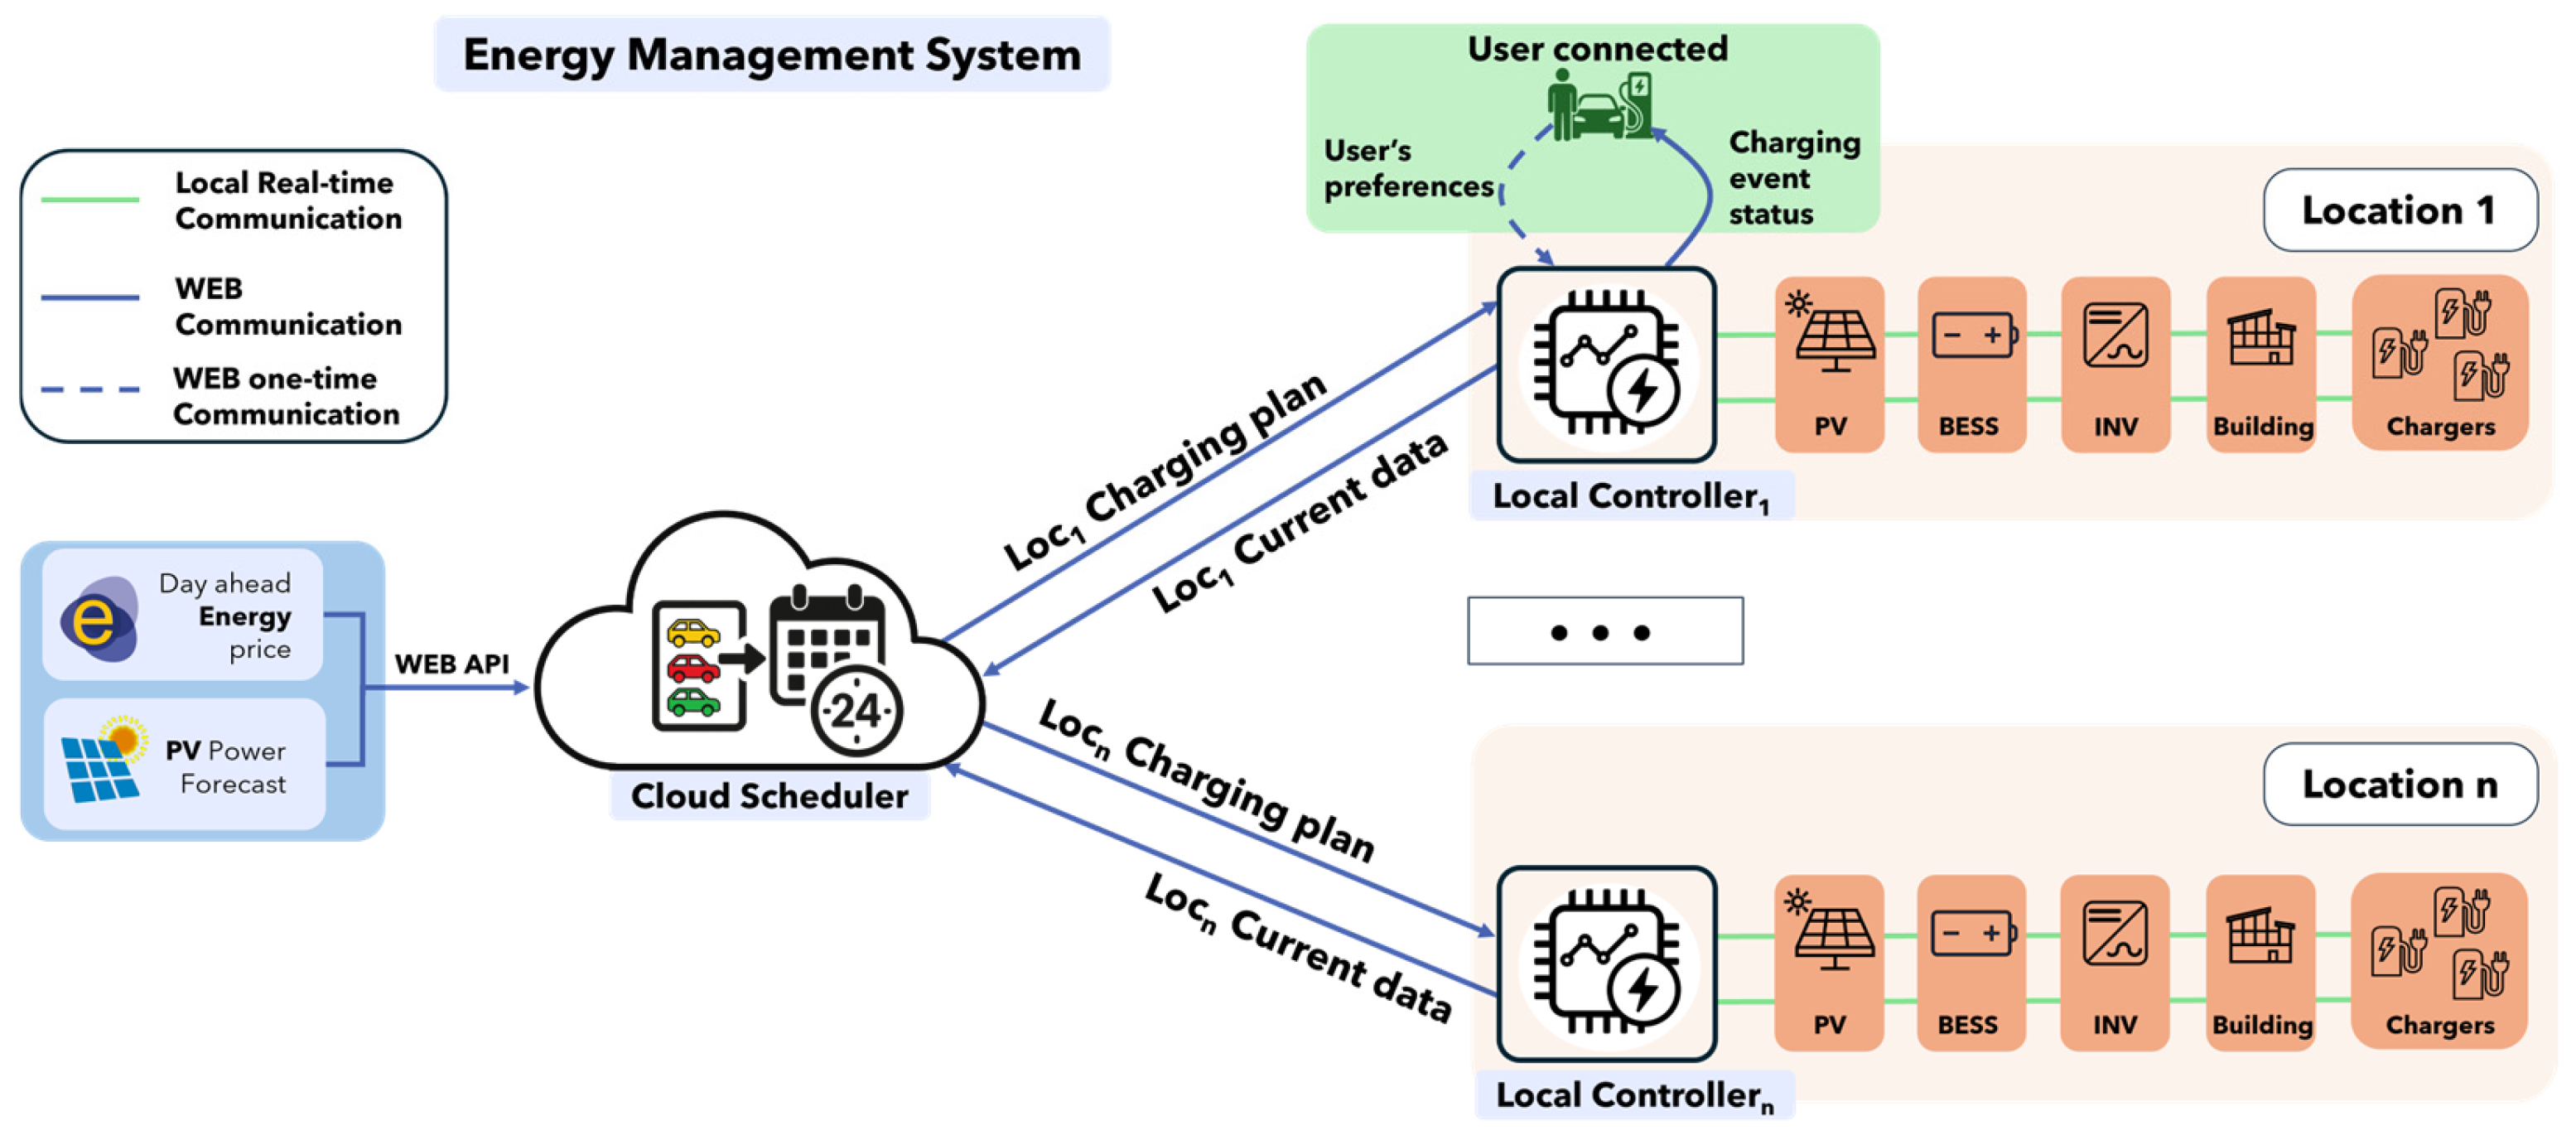
Figure 1. Schematic diagram of the proposed Energy Management System. The global Cloud Scheduler receives data through APIs from ENTSO-E and Forecast.Solar [59], while Local Controllers handle operations at individual locations, including requests from connected EV users.
Wevj 16 00450 g001
Figure 2. Probability Density Function for arrival (a) and user-defined final SOC (b) based on Poisson distribution. The initial SOC has a mean of 0.2, while the target SOC has a mean of 0.8.
Wevj 16 00450 g002
Figure 3. Log events generated in accordance with probabilistic arrival curves for a workplace and a mixed workplace/residential area. Points represent the pseudo-random generation of vehicle entities following the probabilistic curves. Each entity is assigned a user (see Table 2).
Wevj 16 00450 g003
Figure 4. Mean R 2 scores computed for each prediction cluster in the training and evaluation datasets. Clusters are defined by the forecast time horizon (x-axis) and the time of day at which the prediction is made (y-axis).
Wevj 16 00450 g004
Figure 5. Flow diagram of the proposed system.
Wevj 16 00450 g005
Figure 6. Piecewise linear function for SOC and C-rate penalty. Boundaries and ramps are more restrictive for EV than BESS. A user penalty penalizes maintenance at low SOC values for EVs.
Wevj 16 00450 g006
Figure 7. Decision tree for managing forecasted power imbalances.
Wevj 16 00450 g007
Figure 8. Map showing the relative positions of the two sites. Operational charging points have already been installed in the Campus Area.
Wevj 16 00450 g008
Figure 9. Results of MILP optimization process: (a) global power balance between supply and demand powers; (b) grid power and sharing power alignment with day-ahead energy price and computed sharing incentives; (c) SOC and Power optimized values for BESS; (d) SOC and Power optimized values for actual charging sessions.
Wevj 16 00450 g009
Figure 10. Distribution of power corrections at the Moving site among EVs, BESS, and the grid, based on the electricity price value, BESS state of charge, and EVs’ priority factors. The priority bounds indicate the minimum and maximum values of priority factors among currently connected EVs, providing a measure of the vehicles’ actual availability to contribute to power balancing.
Wevj 16 00450 g010
Figure 11. Power balancing on a representative day with peak demand from the MOVING laboratories, across the three user-based scenarios: (a) Breakdown of building demand, EV charging, BESS operation, and PV generation throughout the day; (b) Total load from both Campus and Moving sites, overall grid exchange, and shared power contributions.
Wevj 16 00450 g011
Figure 12. Overall comparison among Uncontrolled charging, V2G, and V1G scenarios: hourly mean power consumption and normalized mean power ramp (per kW) throughout the day.
Wevj 16 00450 g012
Figure 13. KPI comparison for V2G, V1G, and Uncontrolled charging scenarios: Sharing Factor, Mean Energy Cost (including incentives), and Mean Power Ramp normalized per kW.
Wevj 16 00450 g013
Figure 14. Comparison of SOC and Capacity-rate distributions across Uncontrolled charging, V1G, and V2G scenarios. The results are evaluated against battery degradation models: calendar aging [47] and cycle aging [70], highlighting the correlation between operating profiles and capacity fade.
Wevj 16 00450 g014
Figure 15. Computed calendar and cycle aging costs for the Uncontrolled charging, V1G, and V2G scenarios. Results are normalized per charger and per simulation day. Error bars reflect the uncertainty associated with the unknown battery operating temperature.
Wevj 16 00450 g015
Figure 16. Distribution of computation times for the V2G, V1G, and uncontrolled charging scenarios across three system complexity levels. The dashed lines represent the trends of the 95% confidence intervals of the distribution.
Wevj 16 00450 g016
Table 1. Italian incentives for REC. The incentive varies according to the location in which the REC is located, as it is indexed to the zonal price ( k P z ). They are guaranteed for 20 years from the foundation of the REC [21].
RES Plant Size [Pls]Incentive [€/MWh]Min Value Incentive [€/MWh]Max Value Incentive [€/MWh]
Pls < 200 kWp 80   +   max ( 0 ,   180 k P z .)80120
200 ≤ Pls ≤ 600 kWp 70   +   max ( 0 ,   180 k P z .)70110
Pls > 600 kWp 60   +   max ( 0 ,   180 k P z .)60100
Table 2. Definition of user categories.
User TypeDescriptionSOC TargetParking Time
Wevj 16 00450 i001Priority
 Full chargeCharges at maximum powerNot requiredNot required
 Partial chargeCharges to a specific SOC at maximum powerRequiredNot required
Wevj 16 00450 i002V1GAllows modular chargingOptionalRequired
Wevj 16 00450 i003V2GAllows bidirectional chargingOptionalRequired
Table 3. Input and output features of the proposed predictive model.
FeatureDescription
InputTime signature m Minute of the day
i s H Boolean flag indicating if the current day is a holiday
i s H n e x t Boolean flag indicating if the next day is a holiday
d w Normalized day of the week (0/8 to 8/8)
m c Cosine of the minute of the day
d c Cosine of the day of the year
Short-term data P p r e v Previous 12 h of power sampled at 15-min intervals
Output P f Next 24 h forecasted power sampled at 15-min intervals
Table 4. Hyperparameter values explored and model configuration with the lowest loss.
HyperparametersValuesBest Parameters
Activation function[Relu, Leaky Relu]Leaky Relu
Number of hidden layers[1, 2, 4]2
Learning rate[1 × 10⁻², 1 × 10⁻³, 1 × 10⁻⁴]1 × 10⁻⁴
Table 5. Number of problem constraints and cost function components for the proposed optimization methods. N V 1 G and N p r i o r refer to the number of V1G and priority users, respectively, who are actively charging at the time of optimization.
Problem ConstraintsN.Cost Function PartsN.
Power balance N L O C Energy cost1
SOC evolution N E V + N B E S S
Inverter maximum power N L O C Incentive penalty1
UserV1G N V 1 G
Priority N p r i o r Aging penalty N E V + N B E S S
SOC target N E V
Sub-constraints definition 5 ( N E V + N B E S S ) Power ramp penalty 1 + N E V + N B E S S
Power derivative definition1
Positive grid power definition1
Table 6. Parameter settings for the proposed case study at the two sites.
Moving Lab
ParameterValue
Charging point power[22, 22, 22]kWp
PV power100kWp
BESS capacity50kWh
Building mean power 50kW
Campus Design
ParameterValue
Charging point power[22, 22, 22,
22, 11, 11]
kWp
Table 7. REC configurations used in the scalability analysis defined by the number of locations, associated buildings, and EV chargers.
Loc.BuildingsChargers
219
4218
8436
Disclaimer/Publisher’s Note: The statements, opinions and data contained in all publications are solely those of the individual author(s) and contributor(s) and not of MDPI and/or the editor(s). MDPI and/or the editor(s) disclaim responsibility for any injury to people or property resulting from any ideas, methods, instructions or products referred to in the content.